bkk16-103 opencsd - open for business!
TRANSCRIPT

Presented by
Date
Event
CoreSight/OpenCSD - Open for Business
CoreSight trace decoding with Perf and OpenCSD
Mike LeachTor Jeremiassen
Mathieu Poirier
BKK16-103 7th March 2016
Linaro Connect BKK16

Topics Covered• A brief overview of the CoreSight technology
• Using CoreSight on Linux
• OpenCSD project – the decoder library, progress and programming.
• Using Perf to decode and render trace information.

What is CoreSight?● CoreSight is a set of IP blocks enabling HW assisted program flow tracing in an SoC.
● Using CoreSight, it is possible to know the exact code path a program took, in both user and kernel space, including interruptions.
● CoreSight tracers record branch point rather than all executed instructions. Using object files and libraries it is possible to reconstruct the execution path.
● Each CoreSight implementation is different and tailored to specific SoC tracing requirement.
● Implementation will typically have a HW tracer per CPU core, and series of “links” connecting tracers to “sinks”.
● Sinks are entities collecting trace data, either in an internal memory buffer or system memory.

CoreSight Trace : Hardware

Why CoreSight?● Tracing has minimal to no impact on the system timing.
● Does not require any external component or cable to be connected to a system.
● Can be used in “live” systems without impact of reconfiguration.
● Each CoreSight implementation is different and tailored to specific SoC tracing requirement.
● Implementation will typically have a HW tracer per CPU core, and series of “links” connecting tracers to “sinks”.
● Sinks are entities collecting trace data, either in an internal memory buffer or system memory.

Using CoreSight on Linux● Support for most CoreSight IP blocks have been available upstream since 3.19.
○ Everything is under: $(KERNEL)/drivers/hwtracing/coresight/
● The upstream solution provides an extensible framework to support different kind of topology. Everything is driven via DT.
● Two ways of using CoreSight:○ Using sysFS.○ Using the Perf infrastructure.
● Reference platform supported:○ Versatile Express (TC2)○ Juno-r1 (Extra DT needed)○ Pandaboard (OMAP4430, extra patches needed)
● Get in touch with me for the extra patches.
CoreSight on Linux using sysFS● Really a “Build your own trace kit” method.
● The CoreSight Access Library (CSAL) can be used for programming the tracers. More on that topic later in the presentation.
● Trace data need to be collected and fed to openCSD.
● Everything is driven via sysFS.
● Why not simply using Perf?○ Some use case simply can’t be addressed by Perf.

CoreSight driven from sysFSlinaro@linaro-nano:/sys/bus/coresight/devices$ ls20010000.etf 20040000.main_funnel 22040000.etm 22140000.etm 230c0000.A53_funnel 23240000.etm replicator@20020000 20030000.tpiu 20070000.etr 220c0000.A57_funnel 23040000.etm 23140000.etm 23340000.etmlinaro@linaro-nano:/sys/bus/coresight/devices$
linaro@linaro-nano:/sys/bus/coresight/devices$ ls 22040000.etm/ | wc -l52linaro@linaro-nano:/sys/bus/coresight/devices$

CoreSight driven from Perflinaro@linaro-nano:~/kernel$ ./tools/perf/perf record -v \
-e cs_etm//u --per-thread uname mmap size 266240BLinux[ perf record: Woken up 1 times to write data ]failed to write feature 8failed to write feature 9failed to write feature 14[ perf record: Captured and wrote 0.072 MB perf.data ]
linaro@linaro-nano:~/kernel$ ls -lh perf.data ~/.debug/-rw------- 1 linaro linaro 77K Feb 28 17:47 perf.data
/home/linaro/.debug/:total 16Kdrwxr-xr-x 2 linaro linaro 4.0K Feb 24 19:21 [kernel.kallsyms]drwxr-xr-x 2 linaro linaro 4.0K Feb 24 19:21 [vdso]drwxr-xr-x 3 linaro linaro 4.0K Feb 24 19:21 bindrwxr-xr-x 3 linaro linaro 4.0K Feb 24 19:21 lib

Famous Last Words
● When using the CoreSight framework in either Perf or sysFS mode, CPUidle MUST be disabled.
● Why?○ Because ETMv3/4 tracers USUALLY share the same power domain. If a CPU is
suspended in a deep state, configuration of the tracers is lost.
● The same problem exists for other PMU, interrupt controller and CCIs. Anything that is sharing a power domain with a CPU will be affected the same way.
● It is being worked on in the community - currently no available solution.
● Linaro rather disable CPUidle than introduce a hack that needs to be undone.

OpenCSD Library• Designed to decode the different CoreSight Trace source protocols into generic trace packets.
Implemented in C++ with C wrapper API.• Platforms supported are native ARM (Linux and bare metal), x86/x64 Linux and Windows.
• Three stage decode:-De-multiplex:– split combined trace frames into individual trace source byte streams.Packet Process:– split the source byte stream into individual protocol packet stream.Packet Decode:– decode packet stream into a set of generic trace packets.
• Generic trace packets consist of instruction ranges executed, core state and other packets describing program flow.
• Library provides a “Decode Tree” API which manages decode for a single trace sink.Creates a demuxer and decoders according to the “Trace Source Config” data used to program the hardware. Client program must also provide memory images to allow the decoder to access the opcodes traced for full instruction execution flow.

OpenCSD: Library in Use1) Client Application creates a Decode Tree for trace
data from a single sink.2) Protocol Decoders are created from the SW Trace
Source Config data used to program up the hardware.
3) Client program provides memory images, in the form of memory buffers or files to represent the areas of code executed in the trace run.
4) Trace data is then pushed through the decoder, trace elements are output via a callback into the client program.
5) Client program processes the trace elements as required (e.g. Generate disassembly, record coverage data)
Note: Not all sources in a trace data file need to be decoded. The de-mux will ignore sources without an attached decoder

OpenCSD: test and debug• For test and debug purposes, the library provides APIs to convert protocol packets and generic
packets into a human readable string format.• This string format is used in the output of the library test application “trc_pkt_lister ”, and is
also available from the perf report / perf script outputs as an option.• trc_pkt_lister example below:
Idx:1643; ID:10; [0x00 0xf7 0x95 0xa2 0xa5 0xdb ]; I_NOT_SYNC : I Stream not synchronisedIdx:1650; ID:10; [0x00 0x00 0x00 0x00 0x00 0x00 0x00 0x00 0x00 0x00 0x00 0x80 ]; I_ASYNC : Alignment Synchronisation.Idx:1662; ID:10; [0x01 0x01 0x00 ]; I_TRACE_INFO : Trace Info.Idx:1666; ID:10; [0x9d 0x00 0x35 0x09 0x00 0xc0 0xff 0xff 0xff ]; I_ADDR_L_64IS0 : Address, Long, 64 bit, IS0.; Addr=0xFFFFFFC000096A00; Idx:1675; ID:10; [0x04 ]; I_TRACE_ON : Trace On.Idx:1676; ID:10; [0x85 0x00 0x35 0x09 0x00 0xc0 0xff 0xff 0xff 0xf1 0x00 0x00 0x00 0x00 0x00 ];I_ADDR_CTXT_L_64IS0 : Address & Context, Long, 64 bit, IS0.; Addr=0xFFFFFFC000096A00; Ctxt: AArch64,EL1, NS; CID=0x00000000; VMID=0x0000; Idx:1692; ID:10; [0xf7 ]; I_ATOM_F1 : Atom format 1.; EIdx:1675; ID:10; RCTDL_GEN_TRC_ELEM_TRACE_ON( [begin or filter])Idx:1676; ID:10; RCTDL_GEN_TRC_ELEM_PE_CONTEXT(EL1N; AArch64; VMID=0x0; CTXTID=0x0; )Idx:1692; ID:10; RCTDL_GEN_TRC_ELEM_INSTR_RANGE(exec range=0xffffffc000096a00:[0xffffffc000096a10] E ISB )

OpenCSD : trace protocols and support levelETMv4 – Instruction: Full decode (limited configuration).ETMv4 – Data: None.ETMv3 – Instruction: Packet processing.ETMv3 – Data: Packet processing.PTMv1 – Instruction: Full decode (limited configuration).STM – SW trace: Packet processing.ITM – SW trace: None.
The intention is to bring all above protocols to the full decode level. Priority being given to instruction trace and STM as data trace is not present on A class Cortex cores.
Note: Limited configuration above means that there are certain programmable configuration options on the ETM hardware that the decoder does not yet support.e.g. Return stack.

Custom Application: trace capture and decode• Application must program the CoreSight trace hardware according to requirements. Options are:
-A) Use the sysfs interface in Linux. Requires detailed knowledge of CoreSight hardware and operation.B) Use the CoreSight Access Library (CSAL) from ARM. Higher level library designed to ease direct programming of CS Hardware. CSAL can be used in Linux environment or on bare metal.
• Application is responsible for initiating and halting trace. Programming CTI components to propagate trace halt can help here.
• Application then must collect the trace and decode using OpenCSD, as described above.
Note: CSAL is an open source library available from ARM providing a programming API for CoreSight hardware. Presently the library back-end requires the CS components to be mmap()’ed into user space. An updated back end using the sysfs on linux is planned.Library is released under the Apache licence. It is expected to be made available onGithub soon.

CoreSight Tracing with perfTwo step process:● perf record
○ Configures trace unit○ Manages collection of the compressed trace data○ Produces perf.data file and populates .debug/ with collateral files
● perf report and/or perf script○ Parses perf.data file and uses the collected trace information and
the collateral files in .debug/ to expand the collected trace.○ report provides a text based interface to analyze the data○ script either dumps the raw events or passes them to a script for
further processing.

The perf.data FileAll trace data and information about the execution of a program is collected in the perf.data file:● Host system information
○ Number of processors, ISA (instruction set arch), processor topology○ Operating system version
● Name(s) of all libraries and executable files and their locations in memory during the data collection.
● Description of what was traced.● Actual trace data.● Links between file names and build_id’s
○ build-id is a 160 bit unique id attached to each executable/lib

The magic.debug/ directory● To avoid duplicating information the actual executable files (and libraries)
are not stored in the perf.data file, but are stored in the .debug directory, usually $HOME/.debug
● Files are stored under their build-id’s, such that multiple versions of the “same” executable can be stored without conflict○ Traces collected for different versions of a program refer to different
build-id’s and thus can coexist with a single .debug/ directory● Exception:
○ The kernel file (vmlinux) is not stored in .debug/ (though some symbols extracted from it are stored in [kernel.kallsyms])
○ A path to the kernel must be passed to perf (report/script) if kernel space trace decoding is required.

perf report / script
Trace Decoding in report/script
perf.data
configuration
trace dataProtocol
Specific
Trace
Decoder
Extract trace data from perf.data sections
.debug/*
vmlinux
Read instruction words from exe/lib files
Generate perf samples
Mem req’s
Inst. data
Parse config and create decoder instance
Trace data
Instruction ranges
config

% perf reportNote, symbol information available when perf is compiled with elfutils available.Samples: 114K of event 'instructions:u', Event count (approx.): 519690 Children Self Command Shared Object Symbol 10.46% 10.46% uname libc-2.21.so [.] strlen 9.66% 9.66% uname libc-2.21.so [.] _dl_addr 6.43% 6.43% uname libc-2.21.so [.] strcmp 4.52% 4.52% uname libc-2.21.so [.] malloc 3.38% 3.38% uname libc-2.21.so [.] memcpy 2.42% 2.42% uname libc-2.21.so [.] __stpcpy 1.85% 1.85% uname libc-2.21.so [.] memchr 1.59% 1.59% uname ld-2.21.so [.] 0x0000a7f4 1.40% 1.40% uname libc-2.21.so [.] __rawmemchr 1.32% 1.32% uname libc-2.21.so [.] 0x0002f0c0 1.19% 1.19% uname ld-2.21.so [.] 0x00008eb8 1.14% 1.14% uname ld-2.21.so [.] 0x00016888 1.04% 1.04% uname libc-2.21.so [.] 0x00072520 0.95% 0.95% uname libc-2.21.so [.] free 0.94% 0.94% uname libc-2.21.so [.] getenv
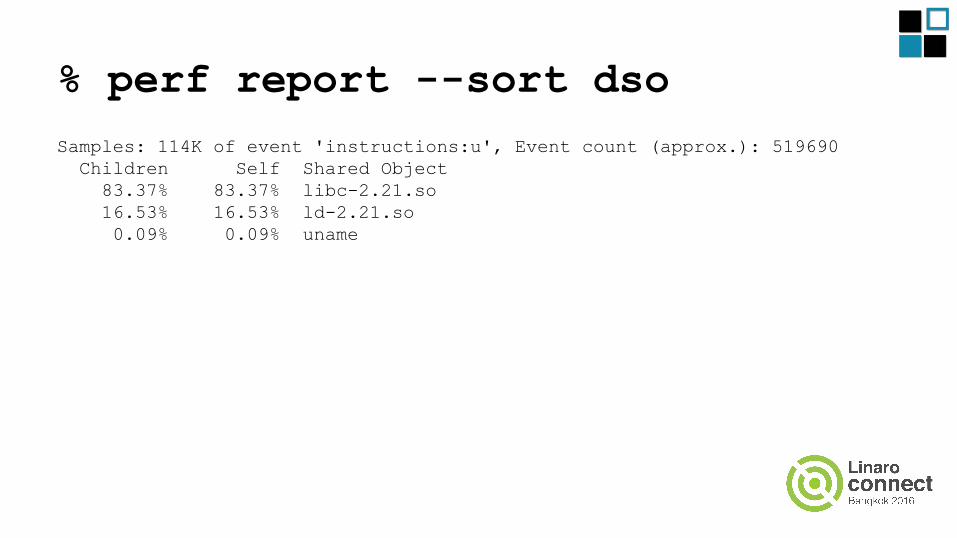
% perf report --sort dsoSamples: 114K of event 'instructions:u', Event count (approx.): 519690 Children Self Shared Object 83.37% 83.37% libc-2.21.so 16.53% 16.53% ld-2.21.so 0.09% 0.09% uname

% perf scriptuname 15244 8 instructions:u: 7f89e46f54 fgets_unlocked ([...]/libc-2.21.so)uname 15244 2 instructions:u: 7f89e46f74 fgets_unlocked ([...]/libc-2.21.so)uname 15244 11 instructions:u: 7f89e46f7c fgets_unlocked ([...]/libc-2.21.so)uname 15244 2 instructions:u: 7f89e3e2d8 _IO_getline ([...]/libc-2.21.so)uname 15244 14 instructions:u: 7f89e3e148 _IO_getline_info ([...]/libc-2.21.so)uname 15244 2 instructions:u: 7f89e3e184 _IO_getline_info ([...]/libc-2.21.so)uname 15244 1 instructions:u: 7f89e3e18c _IO_getline_info ([...]/libc-2.21.so)uname 15244 8 instructions:u: 7f89e3e190 _IO_getline_info ([...]/libc-2.21.so)uname 15244 5 instructions:u: 7f89e3e1b0 _IO_getline_info ([...]/libc-2.21.so)...
● Note, not all fields of the trace event is returned by default, here the fields are:○ comm, tid, period, event, ip, sym, dso
● Additional fields are available:○ pid, time, cpu, trace, addr, symoff, iregs, brstack,
brstacksym, flags● Address range from trace is (ip, addr)
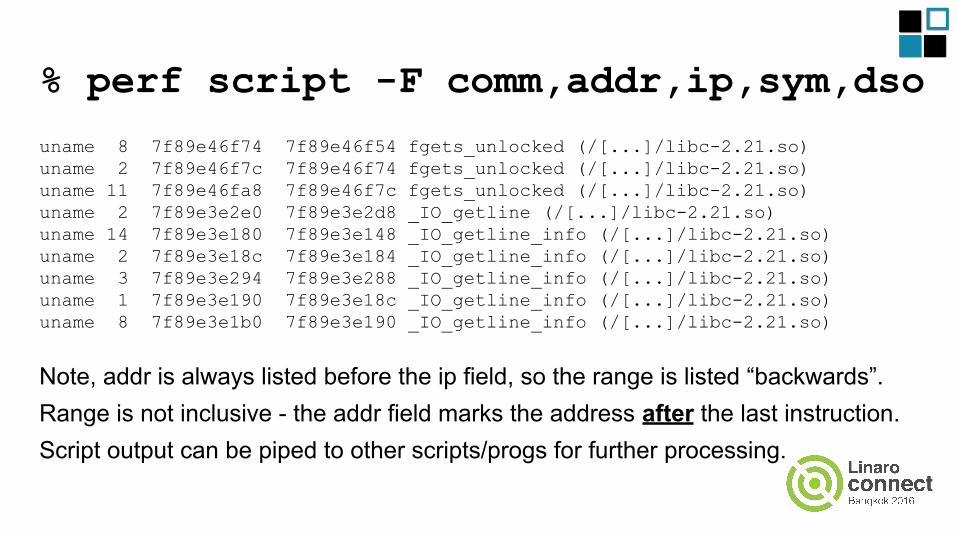
% perf script -F comm,addr,ip,sym,dso
uname 8 7f89e46f74 7f89e46f54 fgets_unlocked (/[...]/libc-2.21.so)uname 2 7f89e46f7c 7f89e46f74 fgets_unlocked (/[...]/libc-2.21.so)uname 11 7f89e46fa8 7f89e46f7c fgets_unlocked (/[...]/libc-2.21.so)uname 2 7f89e3e2e0 7f89e3e2d8 _IO_getline (/[...]/libc-2.21.so)uname 14 7f89e3e180 7f89e3e148 _IO_getline_info (/[...]/libc-2.21.so)uname 2 7f89e3e18c 7f89e3e184 _IO_getline_info (/[...]/libc-2.21.so)uname 3 7f89e3e294 7f89e3e288 _IO_getline_info (/[...]/libc-2.21.so)uname 1 7f89e3e190 7f89e3e18c _IO_getline_info (/[...]/libc-2.21.so)uname 8 7f89e3e1b0 7f89e3e190 _IO_getline_info (/[...]/libc-2.21.so)
Note, addr is always listed before the ip field, so the range is listed “backwards”.Range is not inclusive - the addr field marks the address after the last instruction.Script output can be piped to other scripts/progs for further processing.

perf script scripting● perf script can call scripts in python or perl directly.● Specific functions are called within the script
○ trace_before()○ trace_end()○ process_event(t)○ trace_unhandled(...)
● More detailed information is available inside the script process_event() function than with command line perf script
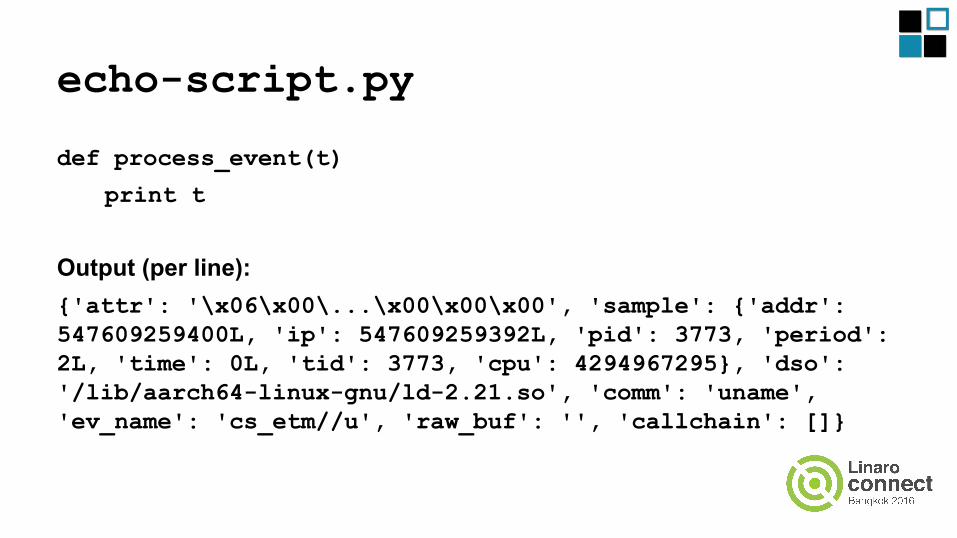
echo-script.py
def process_event(t)
print t
Output (per line):{'attr': '\x06\x00\...\x00\x00\x00', 'sample': {'addr': 547609259400L, 'ip': 547609259392L, 'pid': 3773, 'period': 2L, 'time': 0L, 'tid': 3773, 'cpu': 4294967295}, 'dso': '/lib/aarch64-linux-gnu/ld-2.21.so', 'comm': 'uname', 'ev_name': 'cs_etm//u', 'raw_buf': '', 'callchain': []}

cs-trace-disasm.py
● A script that provides a disassembly of the instruction trace○ Calls perf buildid-list to get list of object files○ Calls perf script --show-mmap-events to collect information
about which object files were used and where in memory they were allocated during execution (.so files don’t have a start address)
○ For each trace address range generate disassembly by calling :■ objdump -d --start-address=<ip> --stop-
address=<addr>○ Filters and prints the generated disassembly to stdout.
■ Removes blank lines, header information for each invocation○ Caches decoded address ranges to improve runtime

cs-trace-disasm.py - Example Output401bb8: d280001d mov x29, #0x0 // #0401bbc: d280001e mov x30, #0x0 // #0401bc0: 910003fd mov x29, sp401bc4: aa0003e5 mov x5, x0401bc8: f94003e1 ldr x1, [sp]401bcc: 910023e2 add x2, sp, #0x8401bd0: 910003e6 mov x6, sp401bd4: 580000a0 ldr x0, 401be8 <setlocale@plt+0x4e8>401bd8: 580000c3 ldr x3, 401bf0 <setlocale@plt+0x4f0>401bdc: 580000e4 ldr x4, 401bf8 <setlocale@plt+0x4f8>401be0: 97fffe38 bl 4014c0 <__libc_start_main@plt>4014c0: b00000b0 adrpx16, 416000 <setlocale@plt+0x14900>4014c4: f9404a11 ldr x17, [x16,#144]4014c8: 91024210 add x16, x16, #0x904014cc: d61f0220 br x17401380: a9bf7bf0 stp x16, x30, [sp,#-16]!401384: 900000b0 adrpx16, 415000 <setlocale@plt+0x13900>

Current Project Status● Everything that was presented today is available on github [1].● Instructions on how to setup the environment and use the Perf methods
can be found in the HOWTO file on branch opencsd-bkk16.● The work that integrates the CoreSight framework to Perf has been
accepted for the 4.6 merge window.● Upstreaming of the work to support for ETMv4 and TMC via Perf has
started.● All the user space “perf tools” is on github but upstreaming of that code
hasn’t started yet.

Question and Comments?
[1]. https://github.com/Linaro/OpenCSD branch opencsd-bkk16