bitou local municipality - western cape · bitou local municipality revised integrated development...
TRANSCRIPT

Revised integrated development plan
CounlResolution Council resolution number: C/6/273/02/15
BITOU LOCAL MUNICIPALITY
REVISED INTEGRATED DEVELOPMENT PLAN
2015/2016
“To be the best together”
2
TABLE OF CONTENTS
LIST OF ABBREVIATIONS ......................................................................................................................................................... 8
EXECUTIVE MAYOR’S FOREWORD ........................................................................................................................................ 10
OVERVIEW BY MUNICIPAL MANAGER .................................................................................................................................. 11
CHAPTER 1: INTRODUCTION ....................................................................................................................................... 12
1.1. Legislative and policy frame work ...................................................................................................................... 12
1.2. Main focus of this revision ......................................................................................................................................... 14
1.3. What is the 2015/2016 IDP review in relation to the 2012/2017 IDP ........................................................... 28
1.4. MEC comments .................................................................................................................................................... 28
1.5. Performance 2012/2013 performance highlights ............................................................................................ 28
1.6. National and Provincial Development Planning and Policy Directives ........................................................ 33
1.7. Integrated development planning process ....................................................................................................... 35
1.8. Roles and responsibilities in the IDP process ................................................................................................. 38
1.8.1. External stakeholders .......................................................................................................................................... 38
1.8.2. Internal stakeholders ........................................................................................................................................... 40
1.9. Overview of document structure ........................................................................................................................ 42
1.10 IDP / budget process self-assessment .................................................................................................................. 43
CHAPTER 2: MUNICIPAL PROFILE ......................................................................................................................................... 45
2.1. Bitou geography ......................................................................................................................................................... 45
2.2. Demographic profile .................................................................................................................................................... 47
2.3. Household Information .............................................................................................................................................. 51
2.3.1. Household dynamics .............................................................................................................................................. 51
2.3.2. Household monthly income ........................................................................................................................................ 52
2.4. Household services .................................................................................................................................................... 53
2.4.1. Dwelling type ........................................................................................................................................................... 53
2.4.2. Households with access to water ......................................................................................................................... 55
2.4.3. Households with access to electricity or lighting, cooking and heating .......................................................... 57
2.4.4. Households with access to Sanitation ................................................................................................................. 58
2.4.5. Households with access to waste removal ......................................................................................................... 59
2.5. Socio-Economic Development Profile............................................................................................................... 61
2.5.1. Public facilities ........................................................................................................................................................... 61
2.5.1.1. Kranshoek (MAP) .................................................................................................................................................... 62
2.5.1.2. Wittedrift (MAP) ..................................................................................................................................................... 63
2.5.1.3. Kurland .................................................................................................................................................................... 64
2.5.1.7. New Horizons .......................................................................................................................................................... 64
2.5.1.8. Kwa-Nokuthula ........................................................................................................................................................ 65
2.5.2. Education .............................................................................................................................................................. 67
2.5.3. Health........................................................................................................................................................................ 68
2.5.4. Safety and Security ................................................................................................................................................. 70
2.5.5. Social Grants ........................................................................................................................................................... 72
2.5.6. Human Development Index ................................................................................................................................... 72
2.5.7. People Living in Poverty ........................................................................................................................................ 73
2.5.8. Gini Coefficient ........................................................................................................................................................ 74
2.6. development Economics ..................................................................................................................................... 74
2.6.1.1. Employment Status ............................................................................................................................................. 74
2.6.1.2. Employment by Sector ........................................................................................................................................ 76
CHAPTER 3: COMMUNITY DEVELOPMENT (WARD PLANNING) ......................................................................... 77
WARD 2 PRIORITIES .............................................................................................................................................................. 84

3
WARD 3 PRIORITIES ....................................................................................................................................................... 89
WARD 4 PRIORITIES .............................................................................................................................................................. 92
WARD 5 & 6 PRIORITIES ................................................................................................................................................ 96
CHAPTER 4: IN-DEPTH ANALYSIS ............................................................................................................................ 102
4.1 Institutional Analysis ................................................................................................................................................. 102
4.1.1 Political Leadership ................................................................................................................................................ 102
4.1.2. Administrative leadership ..................................................................................................................................... 102
4.1.3 Staff Complement .................................................................................................................................................. 105
4.1.4. Employment equity and targets .......................................................................................................................... 106
4.1.5. Organogram and vacant posts ........................................................................................................................ 108
4.1.6. Staff turnover rate ................................................................................................................................................. 109
4.1.7 Skills Development ................................................................................................................................................ 110
4.1.8 Municipal Policies and Service Delivery Improvement Plans .................................................................................. 113
4.2.1. Liquidity ratio ....................................................................................................................................................... 116
4.2.2. IDP regulation financial viability indicators ......................................................................................................... 116
4.2.3. Borrowing Management ....................................................................................................................................... 116
4.2.4. Employee costs are the financial ratios ................................................................................................................. 116
4.3. Local Economic Development ..................................................................................................................................... 116
4.4. Good Governance and Public Participation ................................................................................................... 119
4.4.1. COUNCIL .......................................................................................................................................................... 120
4.4.1.2. EXECUTIVE MAYORAL COMMITTEE ............................................................................................... 120
4.4.2. WARD ................................................................................................................................................................. 121
4.4.3. Audit Committees .................................................................................................................................................. 122
4.4.4. Local Labour Forum .......................................................................................................................................... 123
4.4.5. Performance audit committee .......................................................................................................................... 123
4.4.6. Intergovernmental relations .............................................................................................................................. 125
4.5. Basic services and infrastructure development ............................................................................................. 125
4.5.1. Water ...................................................................................................................................................................... 125
CHAPTER 5: DEVELOPMENT STRATEGY ............................................................................................................... 127
5.1. Vision.......................................................................................................................................................................... 127
5.2. Mission ....................................................................................................................................................................... 128
5.3 Strategic Goals ................................................................................................................................................... 128
5.6. Strategic Projects and Programmes ...................................................................................................................... 133
CHAPTER 6: projects and programmes ............................................................................................................................... 137
CHAPTER 7: SECTOR PLANNING .............................................................................................................................. 141
7.1 Municipal Function ............................................................................................................................................. 141
7.2 Sector Plans........................................................................................................................................................ 142
7.2.1 Spatial Development Framework Summary ................................................................................................. 144
7.2.2. Local Economic Development............................................................................................................................. 152
7.2.4 Integrated Waste Management Plan ................................................................................................................... 167
7.2.5 Integrated Human Settlement Plan (IHSP) ........................................................................................................ 168
7.2.6. Local Integrated Transport Plan ...................................................................................................................... 170
7.2.7. Air Quality Management Plan .......................................................................................................................... 179
7.2.8. Coastal Management Plan ........................................................................................................................................ 180
7.2.9. Fleet management plan .................................................................................................................................... 182
7.2.10. Disaster Management Plan ............................................................................................................................... 183
7.2.11. Thusong Service Centre Programme .............................................................................................................. 185
7.2.12 Risk Management Plan ..................................................................................................................................... 186

4
7.2.13. WORKPLACE Skills Plan .................................................................................................................................. 189
7.2.14. PERFORMANCE Management Policy Framework ....................................................................................... 189
7.3 Other Municipal Functions ....................................................................................................................................... 190
7.3.1. Cemeteries .......................................................................................................................................................... 190
7.3.2 Airfields and Landing Strips .............................................................................................................................. 191
7.4 Sector Departments ........................................................................................................................................... 193
7.4.1 Sector Departments Foot-print ............................................................................................................................. 193
CHAPTER 8 BUDGET FRAMEWORK ......................................................................................................................... 196
Executive Summary ...................................................................................................................................................... 196
Operating Revenue Framework ................................................................................................................................. 197
Property Rates ................................................................................................................................................................ 200
Sale of Water and Impact of Tariff Increases .......................................................................................................... 201
Sale of Electricity and Impact of Tariff Increases .................................................................................................. 203
Sanitation and Impact of Tariff Increases................................................................................................................ 203
Waste Removal and Impact of Tariff Increases ..................................................................................................... 204
Overall impact of tariff increases on households ................................................................................................. 205
Operating Expenditure Framework ........................................................................................................................... 206
Priority given to repairs and maintenance .............................................................................................................. 209
Free Basic Services: Basic Social Services Package .......................................................................................... 210
Capital expenditure ....................................................................................................................................................... 211
CHAPTER 9: PERFORMANCE MANAGEMENT ....................................................................................................... 215
9.1 Performance Management ...................................................................................................................................... 215
9.2 Organisational performance .................................................................................................................................... 215
9.3 Individual Performance ............................................................................................................................................. 216
9.4 Key Performance Indicators (KPI's) ................................................................................................................ 217
9.5 Performance Reporting ............................................................................................................................................ 218
9.5.1 Quarterly Reports ................................................................................................................................................... 218
9.5.2 Mid-Year Assessment ........................................................................................................................................... 218
9.5.3 Annual Assessment ............................................................................................................................................... 218

5
Figure 1: IDP cycle 2012 - 2017 ...................................................................................................................................... 28 Figure 2: Locality Map .............................................................................................................................................. 46 Figure 3: Map indicating the spatial location of each ward. ......................................................................................... 47 Figure 4: Population growth trends since 1996. (source StatsSA) .................................................................................. 48 Figure 5: Map illustrating the population distribution by national group per war d(source StatsSA) . ........................... 50 Figure 6: Population pyramids illustrating the population dynamics since 1996 (source StatsSA).................................. 51 Figure 7: Household size percentage (source StatsSA) ................................................................................................... 52 Figure 8: Household monthly income levels(source StatsSA) ......................................................................................... 53 Figure 9: Percentage size of household dwelling types (source StatsSA) ........................................................................ 54 Figure 10: Informal dwellings by ward (source StatsSA) ................................................................................................ 55 Figure 11: Percentage of households with access to portable water. (source StatsSA) .................................................. 56 Figure 12: Map indicating wards with piped water and number of households with no access to piped water(source
StatsSA) ................................................................................................................................................................ 57 Figure 13: Household percentage with access to electricity (source StatsSA)................................................................. 58 Figure 14: Household percentage of households with access to toilet facilities. (source StatsSA) .................................. 59 Figure 15: Household percentage with access to municipal waste removal services ...................................................... 60 Figure 16: Wards with households with no access to municipal waste removal services ............................................... 60 Figure 17: Percentage share of education levels in Bitou. (source StatsSA) ................................................................... 67 Figure 18: FET retention rate, source; borrowed from DoE indaba 2 presentation (source DoE) .................................... 68 Figure 19: Primary health care facilities in Bitou ............................................................................................................ 69 Figure 20: Status of social grants in the province January 2013. .................................................................................... 72 Figure 21: Employment status in Bitou (source StatsSA) ................................................................................. 75 Figure 22: Unemployment per age cohort (source StatsSA) ........................................................................................... 76 Figure 23: Bitou Municipality approved macro structure ............................................................................................. 103 Figure 24: Graphs representing the approved positions and vacancy rates over the past 2 financial years ................. 108 Figure 25: Proposed Kurland Spatial Development Proposals ...................................................................................... 145 Figure 26: Proposed Kurland Spatial Development Proposals ...................................................................................... 145 Figure 27: Proposed Keurbooms development proposals ............................................................................................. 146 Figure 28: Wittedrift Spatial Development Proposal .................................................................................................... 147 Figure 29: Plettenberg Bay Spatial Development Proposal .......................................................................................... 148 Figure 30: Kranshoed Spatial Development Proposal .................................................................................................. 149 Figure 31: Kwa-Nokuthula/New Horizon proposed Spatial Development Corridor ...................................................... 150 Figure 32: Kurland Development Corridor ................................................................................................................... 151 Figure 33: Natures Valley Area .................................................................................................................................... 152 Figure 34: CemAir aircraft landing for the first time at Plettenberg Bay Airport ......................................... 192 Figure 35: Main operational expenditure categories for the 2015/2016 financial year ............................... 209 Figure 36: Capital infrastructure programme .............................................................................................................. 214 Figure 37: Bitou Municipality performance management framework ............................................................ 215 Figure 38: Bitou Municipality's performance management system ............................................................... 216
6
Table 1: Abbreviations ..................................................................................................................................................... 9 Table 2: Bitou Municipality LG MTEC 3 assesment report: Budget and IDP Ananlyisis ................................................... 27 Table 3: Summary of financial performance for the 2013/2014 financial year ............................................................... 32 Table 4: External role player’s roles and responsibilities of stakeholders in the IDP process ......................................... 40 Table 5: Internal role players ................................................................................................................................... 42 Table 6: Document structure ................................................................................................................................... 43 Table 7: Ward delineation ........................................................................................................................................ 47 Table 8: Bitou population by national group and gender (source StatsSA) ..................................................................... 48 Table 9: Summary of household dynamics ..................................................................................................................... 52 Table 10: Household numbers by size of households(source StatsSA) ........................................................................... 52 Table 11: Number of dwellings by type of dwelling (Source StatsSA) ............................................................................. 54 Table 12: Number of households with access to water above the RDP standards. (source StatsSA) .............................. 55 Table 13: Energy source for lighting (source StatsSA) .................................................................................................... 57 Table 14: Household percentage with access to toilet facilities (source StatsSA) ........................................................... 58 Table 15: Refuse removal (source StatsSA) .................................................................................................................... 59 Table 16: Education levels of individuals in the Bitou Area.(source StatsSA) ................................................................. 67 Table 17: Percentage of children age between 7 and 16 years not attending school in Bitou per ward. (source StatsSA)
............................................................................................................................................................................. 68 Table 18: Eden burden of diseases in 2010, Source DoH indaba 2 presentation ............................................................. 70 Table 19: Crime levels in Bitou ....................................................................................................................................... 70 Table 20: Crime statistics ............................................................................................................................................... 71 Table 21: Crime trends- Plettenberg Bay ....................................................................................................................... 71 Table 22: Human development index in Eden District ................................................................................................... 73 Table 23: Poverty rate in Eden DM ................................................................................................................................ 73 Table 24: Gini Coefficient in Eden DM ............................................................................................................................ 74 Table 25: The official unemployment rate in Bitou. (source StatsSA) ............................................................................. 75 Table 26: Unemployment age cohort. (source StatsSA) ................................................................................................. 75 Table 27: Employment by economic sector.................................................................................................................... 76 Table 28: Departmental functions ............................................................................................................................... 105 Table 29: Occupational categories ............................................................................................................................... 105 Table 30: Employment equity targets by occupation level ........................................................................................... 107 Table 31: Vacancy rate per post and functional level ................................................................................................... 109 Table 32:Staff turnover rate ........................................................................................................................................ 110 Table 33: Skills matrix .................................................................................................................................................. 111 Table 34: Number of training recipients per occupation category ............................................................................... 112 Table 35: Planned trainings for 2014/2015 .................................................................................................................. 113 Table 36: Schedule of policies and systems of Bitou Municipality ................................................................................ 115 Table 37: Economic Activity by sector .......................................................................................................................... 117 Table 38: Prioritised projects within each of the industry categories ........................................................................... 118 Table 39: Proposed top LED Programmes .................................................................................................................... 118 Table 40: Composition of Bitou Municipal Council ........................................................................................... 120 Table 41: Composition of the executive mayoral committee .......................................................................... 121 Table 42: IGR forums ................................................................................................................................................... 125 Table 43: Municipal Functions .............................................................................................................................. 142 Table 44: List of Sector plans and their status .................................................................................................. 143 Table 45: Sector contribution to the GDP ........................................................................................................... 153 Table 46: Bitou Water Sources and Status ......................................................................................................... 158 Table 47: Blue drop awards ................................................................................................................................... 159 Table 48: Implementation of water master plan ................................................................................................. 160 Table 49: Implementation of storm water master plan ..................................................................................... 162 Table 50: Status of wastewater treatment works ............................................................................................... 163 Table 51: green drop ratings ................................................................................................................................. 163 Table 52 : Waste water management plan programmes .................................................................................. 164 Table 53: Electricity notified maximum demand ............................................................................................... 166 Table 54: Municipal electrification programme .................................................................................................. 167 Table 55: Integrated waste management programme ...................................................................................... 168

7
Table 56: Housing pipeline .................................................................................................................................... 170 Table 57: List of LITP projects .............................................................................................................................. 178 Table 58: Coastal management implementation plan ....................................................................................... 182 Table 59: Disaster management plan implementation plan............................................................................. 185 Table 60: Thusong centre implementation programme is continuous.......................................................... 186 Table 61: Risk environment ................................................................................................................................... 187 Table 62: Municipal potential risks ...................................................................................................................... 188 Table 63: Implementation of the risk programme .............................................................................................. 189 Table 64: PMS implantation programme ............................................................................................................. 190 Table 65: Status of cemeteries.............................................................................................................................. 190 Table 66: Airfield information ................................................................................................................................ 191 Table 67: Indaba 2 agreements ................................................................................................................................... 195 Table 68: Consolidated overview of the 2015/2016 MTREF ......................................................................................... 197 Table 69: Summary of revenue classified by main source ............................................................................................ 198 Table 70 Percentage of revenue by main revenue source .............................................................................. 199 Table 71: Percentage of revenue by main revenue source ........................................................................................... 199 Table 72: Major sources of revenue for 2015/2016 ...................................................................................................... 199 Table 73: Operating transfers and grant receipts.............................................................................................. 200 Table 74: Comparison of proposed rates ...................................................................................................................... 201 Table 75: Proposed water tariffs .................................................................................................................................. 202 Table 76: Comparison current vs. new electricity charges ............................................................................................ 203 Table 77: Comparison between current charges and increases .................................................................................... 204 Table 78: Comparison between current charges and new per customer type .............................................................. 204 Table 79: Comparison between current waste removal fees and increases .................................................................. 205 Table 80: MBRR table SA 14-Household bills ................................................................................................................ 206 Table 81: Operational repairs and maintenance .......................................................................................................... 209 Table 82: Repairs and maintenance per asset class ..................................................................................................... 210 Table 83: Medium-term capital budget per vote ......................................................................................................... 211 Table 84: Capital budget .............................................................................................................................................. 212

8
LIST OF ABBREVIATIONS
ABBREVIATION DESCRIPTION
AG AUDITOR-GENERAL
AADT AVERAGE ANNUAL DAILY TRAFFIC
AADTT ANNUAL AVERAGE DAILY TRUCK TRAFFIC
AQMP AIR QUALITY MANAGEMENT PLAN
BESP BUILT ENVIRONMENT SUPPORT PROGRAM
CAPEX CAPITAL EXPENDITURE
CBO COMMUNITY BASED ORGANISATION
CFO CHIEF FINANCIAL OFFICER
CMP COASTAL MANAGEMENT PROGRAMME
CPTR CURRENT PUBLIC TRANSPORT RECORD
COGTA COOPERATIVE GOVERNANCE AND TRADITIONAL AFFAIRS,
DCAS DEPARTMENT OF CULTURAL AFFAIRS AND SPORT
DEA DEPARTMENT OF ENVIRONMENTAL AFFAIRS
DEADP DEPARTMENT OF ENVIRONMENTAL AFFAIRS AND DEVELOPMENT PLANNING DITP
DLG DEPARTMENT OF LOCAL GOVERNMENT
DM DISTRICT MUNICIPALITY
DMG DISTRICT MUNICIPALITY GRANT
DORA DIVISION OF REVENUE ACT
DRDLR DEPARTMENT OF RURAL DEVELOPMENT AND LAND REFORM
DWA DEPARTMENT OF WATER AFFAIRS
DWAF DEPARTMENT OF WATER AFFAIRS AND FORESTRY
EE EMPLOYMENT EQUITY
EDM EDEN DISTRICT MUNICIPALITY
EDMED EDEN DISTRICT MUNICIPALITY EDUCATION DEPARTMENT
EMDMC EDEN MUNICIPAL DISASTER MANAGEMENT CENTRE
EMF ENVIRONMENTAL MANAGEMENT FRAMEWORK
EMS EMERGENCY MEDICAL SERVICES
EPWP EXPANDED PUBLIC WORKS PROGRAMME
GIS GEOGRAPHICAL INFORMATION SYSTEM
GAMAP GENERALLY ACCEPTED MUNICIPAL ACCOUNTING PRACTICE GRAP
HDI HUMAN DEVELOPMENT INDEX
HH HOUSEHOLDS
HOD HEAD OF DEPARTMENT
HSP HUMAN SETTLEMENTS PROGRAMME
HR HUMAN RESOURCES
ICZMP INTEGRATED COASTAL ZONE MANAGEMENT PLAN
IDT INSTITUTIONAL DEVELOPMENT AND TRANSFORMATION
IDP INTEGRATED DEVELOPMENT PLAN
IFRS INTERNATIONAL FINANCIAL REPORTING STANDARDS
IHSP INTEGRATED HUMAN SETTLEMENT PLAN
IIF INFRASTRUCTURE INVESTMENT FRAMEWORK
IIAMP INTERGRATED INFRASTRUCTURE ASSEST MANAGEMENT PLAN
IMAP IMPLEMANTATION PLAN
INEP INTEGRATED NATIONAL ELECTRIFICATION PROGRAMME

9
I T INFORMATION TECHNOLOGY
ITP INTEGRATED TRANSPORT PLAN
IWMP INTEGRATED WASTE MANAGEMENT PLAN
JOC JOINT OPERATION CENTRE
KL KILOLITER (1 000 LITERS)
KPA KEY PERFORMANCE AREA
KPI KEY PERFORMANCE INDICATOR
KWH KILOWATT-HOUR
LED LOCAL ECONOMIC DEVELOPMENT
LG LOCAL GOVERNMENT
LM LOCAL MUNICIPALITY
LITP LOCAL INTEGRATED TRANSPORT PLAN
MBRR MUNICIPAL BUDGET AND REPORTING REGULATIONS
MDG MUNICIPAL DEVELOPMENTAL GOAL
MERO MUNICIPAL ECONOMIC REVIEW AND OUTLOOK REPORT
MFMA LOCAL GOVERNMENT: MUNICIPAL FINANCE MANAGEMENT ACT (ACT NO. 56 OF 2003)
MIG MUNICIPAL INFRASTRUCTURE GRANT
MIP MUNICIPAL INFRASTRUCTURE PLAN
ML MEGALITER (1 000 000 LITRES)
MM MUNICIPAL MANAGER
MMP MAINTENANCE MANAGEMENT PLAN
MOD MASS OPPORTUNITY DEVELOPMENT
MSDF MUNICIPAL SPATIAL DEVELOPMENT FRAMEWORK
MSID MUNICIPAL SERVICE AND INFRASTRUCTURE DEVELOPMENT
ABBREVIATION DESCRIPTION
AG AUDITOR-GENERAL
AADT AVERAGE ANNUAL DAILY TRAFFIC
AADTT ANNUAL AVERAGE DAILY TRUCK TRAFFIC
AQMP AIR QUALITY MANAGEMENT PLAN
BESP BUILT ENVIRONMENT SUPPORT PROGRAM
CAPEX CAPITAL EXPENDITURE
CBO COMMUNITY BASED ORGANISATION
CFO CHIEF FINANCIAL OFFICER
CMP COASTAL MANAGEMENT PROGRAMME
CPTR CURRENT PUBLIC TRANSPORT RECORD
COGTA COOPERATIVE GOVERNANCE AND TRADITIONAL AFFAIRS,
DCAS DEPARTMENT OF CULTURAL AFFAIRS AND SPORT
DEA DEPARTMENT OF ENVIRONMENTAL AFFAIRS
DEADP DEPARTMENT OF ENVIRONMENTAL AFFAIRS AND DEVELOPMENT PLANNING DITP
Table 1: Abbreviations

10
EXECUTIVE MAYOR’S FOREWORD
Mandated by the
Municipal
Systems Act, No
32 of 2000, and
other legislation,
Bitou Municipal
Integrated Development Plan (IDP) provides
the strategic framework that guides the
municipality’s planning and budgeting over the
course of each political term.
Given the almost simultaneous occurrences of
a political election and organisational
processes, some administrations in the past
experienced a disconnection between the
political leadership and the organisation. After
the election of the current administration in
2011, we crafted a strong plan of action for the
municipality, this was to be a blue print that
guides the strategic focus of the municipality.
This plan was based on a clear understanding
of what needs to be achieved during this term
of office: We want to create a more inclusive
society by working towards greater economic
freedom for all the people of Bitou. This requires
us to create a business environment suitable for
economic growth and subsequently reduce
unemployment.
The Integrated Development Plan (IDP) is such
a strategy that informs our government over the
next five years and we annually adjust our
planning in line with provincial and national
programmes.
I would also like to take the opportunity to thank
the communities that provided input into the
IDP through our Ward Committee Meetings and
IDP Forum. I would also like to encourage more
of our citizens to be involved in the process of
developing the IDP. Secondly I would like to
thank Council for their political leadership in
guiding and drafting of the IDP. Thirdly as the
custodians of the IDP, we acknowledge the
work of the Municipal Manager, senior
administration and staff in general for their
contribution in developing a strategic integrated
development plan that aligns our budget and
service delivery implementation plans.
The drafing of the 2015/16 revised IDP will
assist the Municipality to adjust its strategic
focus and align its budget to ensure that the
long-term vision and outcomes are achieved.
EXECUTIVE MAYOR
MEMORY BOOYSEN

Revised integrated development plan
CounlResolution Council resolution number: C/6/273/02/15
OVERVIEW BY MUNICIPAL MANAGER
It is another exciting era in the IDP cycle, a time where
municipalities are legally obliged to revise their Integrated
Development Plans to ensure that the IDP is in tandem with
changing circumstances as experienced locally and nationally.
This revision does not take away the strategic direction adopted
by council in 2012.
The 2015/2016 revised IDP is therefore not replacing the 2012-2017 municipal IDP but it is
the municipality’s continuous effort to improve and comply with the requirements of a credible,
well-aligned and strategic IDP. The past few years did not pass without hindrances, but as an
institution we emerged victorious and we are planning to use all our energy ensuring that we
keep the momentum. The fruits of our labour was a clean audit opinion awarded to Bitou
Municipality by the office of the Auditor General for the 2013/2014 financial year.
The revised IDP and 2015/2016 budget are products of an in-depth consultation and
participatory process of both internal and external stakeholders. The challenge is that the
available resources will not satisfy every individual need but we are committed to sparingly
utilize the available resources in delivering high quality and uninterrupted basic services for
all. Our administration is poised, ready to take on the new challenges and deliver on our
mandate as outlined in the IDP and budget.
All stakeholders (private or public) are free to use the content of this document as a planning
instrument to guide their investment decisions. The 2015/2016 IDP further provides a platform
to engage and refine the strategic thrust of the municipal.
ALLEN ANTHONY PAULSE
MUNICIPAL MANAGER

12
CHAPTER 1: INTRODUCTION
Integrated development planning is a process by which the Municipality and its key
stakeholders prepare a strategic development plan for the municipal area over a period of five
years. Bitou Municipality already adopted a five-year strategic plan in 2012. This strategic plan
known as the Integrated Development Planning (IDP) is an instrument, which lies at the centre
of developmental local government in South Africa and represents the driving force for making
municipalities more strategic, inclusive, responsive and performance driven.
Bitou Municipality seeks to integrate and balance the economic, ecological and social pillars
of sustainability within the municipal area without compromising the institutional capacity
required to implement and coordinate the efforts needed across sectors and relevant spheres
of government.
This is the second revised IDP of the 2012/2017 IDP review period. The aim of this revision is
to fill the legislative and compliancy gaps, but most importantly to give attention to the gaps
identified during the 2013/2014 IDP/budget assessment, 2013 Audit findings and on improving
the municipal past performance.
The IDP process is a legislative process. Revision of the IDP is informed by legislation and
policies from National and Provincial governments.
1.1. LEGISLATIVE AND POLICY FRAME WORK
All municipal operations are governed and guided by legislation and a policy framework to
enhance good governance to assist municipalities to achieve the objectives of developmental
local government. The revision of the IDP is also guided by legislation such as:
The Constitution of the Republic of South Africa, Act 106 of 1996
This Act stipulates that a municipality must give priority to the basic needs of its
communities and promote social and economic development, to achieve a democratic,
safe and healthy environment.
The Local Government: Municipal Systems Act (MSA) Act 32 of 2000 , section 34 in
particular
This Act stipulates the need for each municipality to develop and adopt an IDP, which
should be reviewed annually. In addition, it outlines the process and components.

13
Local Government: Municipal Finance Management Act (Act 56 of 2003) (MFMA).
This Act makes provision for the alignment of the IDP and municipal budget. The SDBIP
is the binding service delivery contact between municipal administration, council and
communities.
The Local Government: Municipal Planning and Performance Management Regulations
of 2001 set out the minimum requirements for an Integrated Development Plan.
These regulations make provision for the inclusion in the IDP of the following:
a) Institutional framework for the implementation of the IDP;
b) Investment and development initiatives in the municipality;
c) Key performance indicators and important statistical information;
d) A financial plan; and
e) A special development framework.
Revised integrated development plan
CounlResolution Council resolution number: C/6/273/02/15
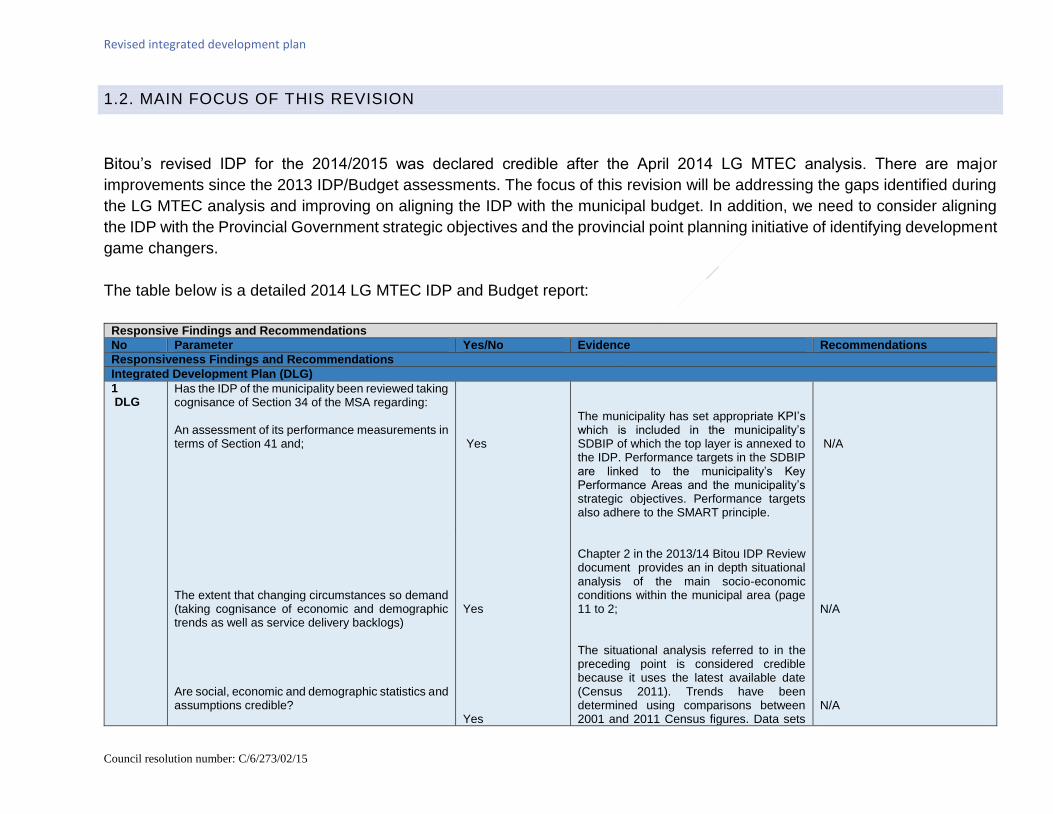
1.2. MAIN FOCUS OF THIS REVISION
Bitou’s revised IDP for the 2014/2015 was declared credible after the April 2014 LG MTEC analysis. There are major
improvements since the 2013 IDP/Budget assessments. The focus of this revision will be addressing the gaps identified during
the LG MTEC analysis and improving on aligning the IDP with the municipal budget. In addition, we need to consider aligning
the IDP with the Provincial Government strategic objectives and the provincial point planning initiative of identifying development
game changers.
The table below is a detailed 2014 LG MTEC IDP and Budget report:
Responsive Findings and Recommendations
No Parameter Yes/No Evidence Recommendations
Responsiveness Findings and Recommendations
Integrated Development Plan (DLG)
1 DLG
Has the IDP of the municipality been reviewed taking cognisance of Section 34 of the MSA regarding: An assessment of its performance measurements in terms of Section 41 and; The extent that changing circumstances so demand (taking cognisance of economic and demographic trends as well as service delivery backlogs) Are social, economic and demographic statistics and assumptions credible?
Yes Yes Yes
The municipality has set appropriate KPI’s which is included in the municipality’s SDBIP of which the top layer is annexed to the IDP. Performance targets in the SDBIP are linked to the municipality’s Key Performance Areas and the municipality’s strategic objectives. Performance targets also adhere to the SMART principle. Chapter 2 in the 2013/14 Bitou IDP Review document provides an in depth situational analysis of the main socio-economic conditions within the municipal area (page 11 to 2; The situational analysis referred to in the preceding point is considered credible because it uses the latest available date (Census 2011). Trends have been determined using comparisons between 2001 and 2011 Census figures. Data sets
N/A N/A N/A

15
Responsive Findings and Recommendations
No Parameter Yes/No Evidence Recommendations
Responsiveness Findings and Recommendations
Integrated Development Plan (DLG)
Does the reviewed IDP contain a council resolution clarifying the status of the IDP in terms of Section 34 (a)(i) and (b)?
No
looked at include; economic trends, demographic trends, basic services backlogs and various socio-economic data sets. The IDP also reflects trends by juxtaposing the Census 2001 data sets with the Census 2011 data sets which allows the municipality to gain insight on municipal development challenges and opportunities. The IDP complies with the requirement in the MSA. Although the IDP does not contain a council resolution clarifying the status of the IDP in terms of Section 34 (a)(i) and (b; a letter which indicates the council resolution number and signed off by the municipal manager was submitted with the ID.
It is recommended that the 2014/15 IDP indicates the date upon which the IDP was adopted by council as well as the resolution number under which was adopted.
2 DLG
Section 26 of the MSA states that an integrated development plan must reflect (i) the key performance indicators and performance targets determined in terms of section 41. Section 41 (a) of the MSA: Key performance indicators “as a yardstick for measuring performance, including outcomes and impact, with regard to the Municipality’s development priorities and objectives set out in its Integrated Development Plan”.
Yes
The key performance indicators and performance targets contained in the 2013/14 Top Layer SDBIP are incorporated in the IDP implementation (IMAP) as referred to as an annexure to IDP 2012-2016. (DLPM) Critical development needs,
N/A

16
Responsive Findings and Recommendations
No Parameter Yes/No Evidence Recommendations
Responsiveness Findings and Recommendations
Integrated Development Plan (DLG)
Measurable performance targets for each of the development priorities and objectives. Does the IDP reflect performance indicators and clear targets to measure performance on its development priorities and objectives?
Yes Yes
reflected in a table on page 59 as municipal Key Performance Areas in the IDP are identified by the municipality. Full compliance with this requirement has therefore been achieved. The Top Layer SDBIP was approved by the Executive Mayor on 28 June 2013. The Municipality’s IMAP has got clear alignment between the National Development Priorities (NDP) and outcomes and Provincial Strategic Objectives (PSO). (DLPM) The operating and capital budgets are aligned to the Municipality’s KPAs and are responsive to the Municipality’s IDP as the largest proportions of both the operating and capital budget are allocated to the KPA: Development of New Services and Infrastructure. The measurable objectives are clearly defined, adhere to the SMART principles and there is alignment between the draft IDP, the SDBIP and the Budget. Furthermore the IDP indicates that “the overall performance of the municipality is managed and evaluated by a municipal scorecard (Top Layer SDBIP) at organisational level and through monitoring and evaluation of the detailed Departmental Service Delivery budget implementation plan (SDBIP) at directorate and departmental (H.O.D) levels. The municipal scorecard (Top Layer SDBIP) sets out consolidated service delivery targets for senior management and provides an overall picture of performance for the municipality as a whole, reflecting the performance on each strategic objective and service delivery priorities. The SDBIP includes non-financial and financial key performance indicators. The Key Performance Indicators and performance
N/A N/A

17
Responsive Findings and Recommendations
No Parameter Yes/No Evidence Recommendations
Responsiveness Findings and Recommendations
Integrated Development Plan (DLG)
targets contained in the 2013/14 draft Top Layer SDBIP (Annexure D) are incorporated in the IDP Implementation Plan (IMAP) that is an attachment to(the 2013/14 IDP) this document.”
3 DLG
Preparing for an IDP Review :Public Participation Does the IDP contain evidence of the following: Mechanisms put in place to ensure meaningful / active citizen participation beyond ward committees in the municipal IDP Processes e.g. Public Participation Policy, PP Process plan Ward Committee involvement in IDP Processes? Please elaborate. E.g. Ward committee meetings specific to IDP / IDP Workshops with ward committees, developed Ward Committee Operational Plans What municipal public participation processes in respect of the IDP (meetings etc.) has been put in place to empower communities to take control of IDP processes and the development within their wards, e.g. evidence of types of meetings / workshops held A breakdown of community structures (e.g. ward committees, CBO’s, NGO’s, number of persons that attended, key issues raised etc.) involved in municipal IDP/ Budget processes. Mechanisms reflected in the municipal process plan that incorporates feedback on progress made on the
Yes Yes Yes Yes Yes
Although it is clear that the municipality has institutionalised certain structures in order to guide its public participation. Processes; It is not evident within the IDP whether the municipality has an adopted community participation strategy and plan. Ward committees were clearly well involved in the IDP processes as can be seen in Chapter 5. The IDP also indicates that IDP public engagements were held during which a total of 1034 people attended. The IDP provides evidence that IDP public engagements were held with the broader community, during which various service delivery issues were raised and reaffirmed. These issues were then further refined and prioritised by ward committees and forms the basis of the municipality’s ward plans as well as the budget and development priorities of the municipality.(Chapter 5) The IDP adequately provides a breakdown of community structures involved in municipal IDP/ Budget processes. Chapter 5 of the IDP clearly illustrates the key issues raised per ward as well as projects identified and prioritised by the municipality. The IDP provides a summary of the 2013/14 IDP Review Process followed by the municipality. It is evident that within the IDP review process followed various structures were implemented to ensure that

18
Responsive Findings and Recommendations
No Parameter Yes/No Evidence Recommendations
Responsiveness Findings and Recommendations
Integrated Development Plan (DLG)
implementation / non-implementation of existing community priorities as indicated in the IDP.
communities could provide feedback to the municipality on the progress made regarding the implementation of existing community priorities. Said structures included 21 public IDP engagement sessions which were held across all 14 wards. Furthermore on page 5 of the IDP, the various mechanisms put in place to ensure active citizen participation in the IDP process are: The IDP and budget process plan together with a schedule of all IDP related public engagement sessions were placed at all libraries and satellite offices for information, scrutiny and comments; Notifications to communities and stakeholder invitations were communicated in all 3 official languages of the Western Cape by means of : Published dates of IDP public sessions in local newspapers and Municipal newsletter. Dissemination of IDP educational flyers. Displaying of posters in all wards. IDP talk sessions on regional radio stations. Loud Hailing in all wards.
4 DLG
Monitoring: Does the IDP Review contain sufficient information that measures progress with the implementation of programmes and projects through a series of indicators that have been set, to determine whether the outcomes strived for have been achieved. Does the IDP Review contain information about the achievements of objectives set in the IDP that will have to be measured over time? Is this done in terms of the indicators that have been set, to determine whether or not the outcomes strived for have been achieved? Does the IDP contain any new information that has been generated from internal or external sources
Yes Yes
The Top Layer SDBIP as an annexure to the reviewed IDP has got a series of key performance indicators with targets for the year under review and outer years. The key performance indicators are categorised into National and Municipal Key Performance Areas (KPA). Each indicator is assigned a program driver for the purposes of accountability. The Municipality had to consider other external sources in their planning for the
N/A The Municipality need to consider including the achievements or progress made in the previous year (2012/2013: Year 1). It is recommended that the column should reflect the “audited/actual performance” as set out in the IDP, to determine whether or not the outcomes strived for have been achieved.

19
Responsive Findings and Recommendations
No Parameter Yes/No Evidence Recommendations
Responsiveness Findings and Recommendations
Integrated Development Plan (DLG)
and reflects changes to the internal context of the municipal area that impacts on the appropriateness of the IDP?
Yes
reviewed IDP. The following documents amongst others were consulted: Census 2011 National Development Plan (SA Vision 2030)
5 DLG
Evaluation Has information gathered in the process of monitoring the IDP implementation been packaged in a way that facilitates discussion by the Representative Forum for discussion and decision making by Council?
Yes
The Bitou Municipality has made use of its monitoring systems to evaluate the processes they have put in place in order to review their service delivery needs and priorities. The areas of improvements identified are: Planning for the next IDP review cycle; ii) Improving on their communication strategy; Increasing their level of public participation in particular strategic planning through IDP; clear identification of projects and prioritisation; and Allocation of more resources where it’s mostly needed.
N/A
6 DLG
Review Does the reviewed IDP of the municipality contain a refined understanding of the situation around priority issues refined/amended/additional objectives revised or new strategies, including strategies to improve implementation revised or new projects reflect all the above in all plans and programmes including a revised Medium Term Expenditure Framework.
Yes Within Chapter one of the IDP the municipality reflects on the purpose of the 2013/14 review IDP. To this extent the IDP reflects an acute understanding of the need to reflect and report on progress made towards implementing the Bitou five year strategy as articulated in the 2012/17 Bitou five year IDP. The IDP indicates that because of various changing circumstances such as the availability of new and updated statistics a need exists to make adjustments to the strategy in the five-year IDP necessary because of changing internal and external circumstances that impact on the appropriateness of the IDP as well as to determine annual targets and activities for the next financial year in line with the five year strategy. In the end, the aim is to ensure that the IDP review document informs the Municipality’s financial and institutional planning and most importantly,

20
Responsive Findings and Recommendations
No Parameter Yes/No Evidence Recommendations
Responsiveness Findings and Recommendations
Integrated Development Plan (DLG)
the drafting of the annual budget. The extent to which all of the revised plans and projects are reflected in the IDP can be seen under Chapter 5 of the IDP. In this chapter, priorities identified by ward committees are aligned to the municipalities budget as well as the municipality’s overall strategies as outlined in the IDP itself.
7 DLG
Council Adoption/Tabling of the Revised IDP Has the revised IDP and budget of the municipality been tabled to Council within the legislated timeframes as per Section 16 of the MFMA. Has the municipality’s budget been informed by the IDP and reflects the objectives, strategies, projects and programmes contained in the IDP? Alternatively, has the municipality’s financial strategies and MTREF informed the IDP Review Process?
Yes Yes
The 2013/14 Bitou IDP review document and 2013/14 budget was adopted on the 30TH of May 2013 under the council resolution of E71-05/2013. Chapter 4 of the IDP provides linkages to the financial plan of the municipality by stating: The municipality’s total capital and operating budget and revenue sources; the capital replacement reserve of the municipality for the 2013/14 Medium Term Revenue and Expenditure Framework (MTREF) period; and the Average salary increases. Furthermore page 59 and 60 also provides an excellent reflection of how the municipality has outlined its Key Performance Areas, Strategic Objectives and its Pre-Determined Objectives with its Operational and Capital Expenditure(i.e. its budget)
Yes Yes
10 DLG
Alignment Assess how the local IDP and budget priorities reflect national/provincial support initiatives.
Yes
The 2013/14 Bitou IDP Review document admirably reflects sector department’s investments in the Bitou municipal space within the 2013/14 budget year. It is however not clear to what extent, other than the municipality’s contribution towards the National Development Plan, the IDP and the municipality is responsive to the
N/A

21
Responsive Findings and Recommendations
No Parameter Yes/No Evidence Recommendations
Responsiveness Findings and Recommendations
Integrated Development Plan (DLG)
Assess the level of responsiveness of the reviewed IDP to IDP Indaba generated initiatives/agreements
IDP Indaba agreements and other national/provincial support initiatives.
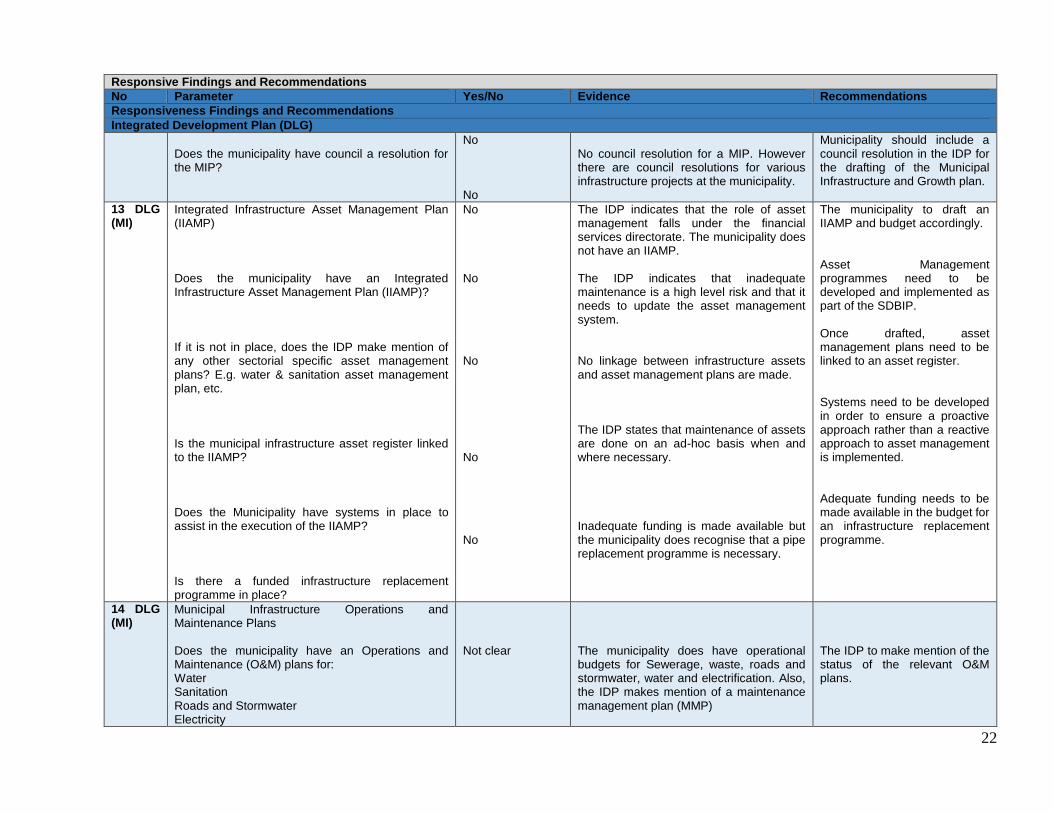
12 DLG (MI)
Municipal Infrastructure Planning Does the municipality have a Municipal Infrastructure Plan (MIP)? If the IDP makes mention of the MIP, does this MIP include all sectors: Water, Sanitation, Roads and Stormwater, Electricity and Waste Management? If no Infrastructure Plans are indicated, does the IDP refer to the availability of sector specific plans, e.g. WSDP, waste management plan, electricity master plan etc. Has the master planning of the various Infrastructure Plans as reflected in the consolidated Municipal Infrastructure Plan, been based on a development forecast which is aligned with the SDF & growth plans per town within the municipality? Has the Infrastructure Investment Framework (IIF) been included in the MIP?
No Yes Yes No
The Bitou municipality IDP has referenced a lot of items pertaining to the planning of new infrastructure and maintenance of old infrastructure within the municipality. However no mention is made to a specific all-encompassing Municipal Infrastructure Plan. Although the municipality does not have a MIP per say, they do have sector plans for their various infrastructure components. All of the plans have been aligned to the municipality’s SDF. The SDF informs all the sectoral plans in order for development to occur in a coordinated manner eliminating duplication in all the processes. The municipality does not have a consolidated Municipal Infrastructure Plan; hence alignment with the development forecasts and the SDF cannot be assessed. It is however noted that sectoral plans are aligned to the SDF. No infrastructure investment framework in the IDP.
The Department of Local Government’s Municipal Infrastructure Directorate to Draft a Municipal Infrastructure and Growth plan for the municipality during the 2014/15 financial year. Sector plans to be included in the Municipal Infrastructure and Growth plan. N/A Drafting of the Municipal Infrastructure and Growth plan should be aligned with the municipality’s SDF. Municipality should reference its IIF in the IDP.
22
Responsive Findings and Recommendations
No Parameter Yes/No Evidence Recommendations
Responsiveness Findings and Recommendations
Integrated Development Plan (DLG)
Does the municipality have council a resolution for the MIP?
No No
No council resolution for a MIP. However there are council resolutions for various infrastructure projects at the municipality.
Municipality should include a council resolution in the IDP for the drafting of the Municipal Infrastructure and Growth plan.
13 DLG (MI)
Integrated Infrastructure Asset Management Plan (IIAMP) Does the municipality have an Integrated Infrastructure Asset Management Plan (IIAMP)? If it is not in place, does the IDP make mention of any other sectorial specific asset management plans? E.g. water & sanitation asset management plan, etc. Is the municipal infrastructure asset register linked to the IIAMP? Does the Municipality have systems in place to assist in the execution of the IIAMP? Is there a funded infrastructure replacement programme in place?
No No No No No
The IDP indicates that the role of asset management falls under the financial services directorate. The municipality does not have an IIAMP. The IDP indicates that inadequate maintenance is a high level risk and that it needs to update the asset management system. No linkage between infrastructure assets and asset management plans are made. The IDP states that maintenance of assets are done on an ad-hoc basis when and where necessary. Inadequate funding is made available but the municipality does recognise that a pipe replacement programme is necessary.
The municipality to draft an IIAMP and budget accordingly. Asset Management programmes need to be developed and implemented as part of the SDBIP. Once drafted, asset management plans need to be linked to an asset register. Systems need to be developed in order to ensure a proactive approach rather than a reactive approach to asset management is implemented. Adequate funding needs to be made available in the budget for an infrastructure replacement programme.
14 DLG (MI)
Municipal Infrastructure Operations and Maintenance Plans Does the municipality have an Operations and Maintenance (O&M) plans for: Water Sanitation Roads and Stormwater Electricity
Not clear
The municipality does have operational budgets for Sewerage, waste, roads and stormwater, water and electrification. Also, the IDP makes mention of a maintenance management plan (MMP)
The IDP to make mention of the status of the relevant O&M plans.

23
Responsive Findings and Recommendations
No Parameter Yes/No Evidence Recommendations
Responsiveness Findings and Recommendations
Integrated Development Plan (DLG)
Waste Management Does the Municipality have Standard Operating Procedures in place for all sectors: Water Sanitation Roads and Stormwater Electricity Waste Management Is the O&M adequately funded? Does the organogram of the technical services department adequately respond to the requirements of the O&M plan? Are all critical posts directly involved in O&M filled? Are all critical plant & equipment involved in O&M in place?
No No Not Clear Not Clear Not Clear
SOP’s for the various sectors are not indicated in the IDP. Due to the limited budget (budget constraints) of the municipality, the O&M is not adequately funded, a fact that the municipality is aware of. Organogram of councillors and top management only indicated in IDP. IDP also shows amount of posts in the departments as well as the number of these posts that are vacant. IDP does not indicate if these posts respond to O&M requirements. IDP does not indicate status of O&M posts. IDP does not indicate if all critical plant & equipment for O&M are in place.
The IDP to indicate the SOP’s for the various sectors. The municipality to source alternative funding for O&M processes. IDP to align technical organogram to O&M requirements. It is recommended that the IDP indicates the status of O&M posts and any capacity constraints that exist in O&M. IDP to indicate if critical plant and equipment is sufficient for the O&M processes or if there is constraints in this department.
15 DLG (MI)
Municipal Roads and Stormwater Specific Is a Pavement Management System in place? Is a Stormwater Master Plan (SWMP) in place?
Yes, but not indicated in IDP. Yes No Yes Yes
No pavement management system is in place but the municipality has prioritised the roads infrastructure that needs to be upgraded. The municipality indicates in the MIG (Municipal Infrastructure Grant) section the roads projects to be
IDP to include indications of the pavement management systems draft by V&V Consultants. N/A

24
Responsive Findings and Recommendations
No Parameter Yes/No Evidence Recommendations
Responsiveness Findings and Recommendations
Integrated Development Plan (DLG)
Is the submission of a SWMP set as prerequisite for the approval of new developments (private and subsidised housing)? Is a Roads Master Plan in place? Has the priority service backlogs been identified? Does the municipality have a funded programme to address the backlogs?
Yes implemented as well as an allocated budgeted for each project. A stormwater Master plan is in place. The municipality has identified stormwater management systems for certain areas. The IDP indicates that stormwater master plans have been drafter for three of its areas. The municipality does practice stormwater management on all new developments but does not indicate if a SWMP for the new development is a prerequisite for approval of the plans. The IDP does indicate that approved Transport Management Plans and Roads Master Plans are in place and used in practice. Priority service backlogs for the municipality at this stage are water, sanitation and housing. These have all been identified. The municipality is using the MIG programme to help eradicate its roads and stormwater backlogs and have budgeted to counter fund these projects where necessary
The IDP to indicate if a SWMP for the new development is a prerequisite for approval of the plans. N/A N/A N/A
16 DLG (MI) & DWA
Water Infrastructure Specific Planning Has the WSDP been adopted? Was it reviewed in last year? Access to service: Backlogs? Basic Services provision (1 stand pipe per 25 households)? Free Basic Water (6kl per household/month)? Higher Levels of service requirements? Access to services e.g. Schools and clinics? Cost Recovery:
Yes No Yes Yes Yes No Unclear Yes
Planning: The WSDP has been adopted. IDP does not indicate if it has been reviewed. Access to service: Backlogs for this service are indicated. All basic service provisions have been identified and a 2012/13 KPA, 100% implementation of Access to Basic Services have been achieved. Included in basic service provision. IDP does not mention higher level service requirements.
N/A IDP to indicate status of WSDP. N/A N/A N/A IDP to indicate higher level service requirements. IDP to indicate the level of access to services of schools and clinics. N/A IDP to indicate if bulk and zoned water meters are in place.

25
Responsive Findings and Recommendations
No Parameter Yes/No Evidence Recommendations
Responsiveness Findings and Recommendations
Integrated Development Plan (DLG)
Has the water service billing with associated budget been ring-fenced? Is bulk and zoned water meters in place? Are monthly water balance calculations performed? Water Quality Compliance: Is Blue Drop per system in the municipality identified? Does the municipality have strategies in place to achieve Blue Drop Status (If not already achieved)? Water Conservation/Water Demand Management (WC/WDM): Does the municipality have a funded WC/WDM programme? Is the WC/WDM adequately funded to meet the Non-Revenue Water (NRW) targets & timeframes? Priority Projects: Does the IDP reflect priority projects as identified in the WSDP, MIP, and IIAMP and by the community?
Unclear Unclear No Yes Unclear Unclear Yes
Service requirements at facilities not mentioned. Cost recovery: Tariff increases for water have been indicated in the IDP. IDP does not indicate if bulk and zoned water meters are in place. Water balance calculations are not indicated in the IDP. Water Quality Compliance: The blue drop status per system is not identified but it is indicated in the IDP that the municipality has achieved blue drop status. The blue drop status per system can be found in the municipality’s blue drop report. The municipality has strategies in place to achieve blue drop status and because of these strategies; it have attained the blue drop status. Water Conservation/Water Demand Management (WC/WDM: The technical services department has a Water Demand Management policy. The IDP does not indicate if this policy is funded to meet NRW targets. Priority Projects: The IDP does indicate priority projects on its plans.
IDP to indicate Water balance calculations. The IDP to indicate blue drop status per system at the municipality. N/A IDP to indicate whether the municipality’s WDM policy is adequately funded. IDP to indicate municipal NRW targets and timeframes. N/A
17 DLG (MI) &NDHS
Sanitation Infrastructure Specific Planning: Has the WSDP been adopted? Was it reviewed in last year and updated? Access to Service: Backlogs? Basic Services provision (what ratio of household per toilet is provided) e.g. 1 toilet per 5 households? Current situation and future plans. Free Basic Sanitation? (3-4kl extra water per household/month). Access to services e.g. Schools and clinics?
Yes No Yes Yes Yes No Unclear No No Yes Yes
Planning: a) The WSDP has been adopted. b) IDP does not indicate if it has been reviewed. Access to service: a) Backlogs for this service are indicated. b) All basic service provisions have been identified and a 2012/13 KPA, 100% implementation of Access to Basic Services have been achieved. c) Included in basic service provision.
•N/A •IDP to indicate status of WSDP. N/A N/A N/A IDP to indicate higher level service requirements. IDP to indicate the level of access to services of schools and clinics. IDP to include information on WWTW systems that are over

26
Responsive Findings and Recommendations
No Parameter Yes/No Evidence Recommendations
Responsiveness Findings and Recommendations
Integrated Development Plan (DLG)
Wastewater Quality Compliance? Are the Wastewater Treatment Works (WWTW) Capacity’s indicated and are the WWTWs that are operating above the design capacity identified? Is Green Drop per system in the municipality identified? Does the municipality have strategies in place to achieve Green Drop Status (If not already achieved)? Priority Projects: Does the IDP reflect priority projects as identified in the WSDP, MIP, and IIAMP and by the community?
d) IDP does not mention higher level service requirements. e) Service requirements at facilities not mentioned. Water Quality Compliance: a) The IDP does not indicate which WWTW are over capacity. b) The green drop status per system is not identified but it is indicated in the IDP that the municipality has achieved green drop status. The green drop status per system can be found in the municipality’s bi-annual green drop report. c) The municipality has strategies in place to achieve green drop status and because of these strategies; it have attained the green drop status. Priority Projects: The IDP does indicate priority projects on its plans.
capacity so that upgrading of infrastructure can be prioritised. The IDP to indicate blue drop status per system at the municipality. N/A N/A
18 DLG (MI) & ESKOM
Energy and Electricity: Electricity Provision Does the municipality have an updated electricity master plan in place? Is there a 10 year electricity forecast for capacity (MVA) and consumption (MWh) for existing intake points and new intake points (if applicable)? Electrification (which is based on the human settlement plan for formal and informal housing) Is there an electrification plan based on a five year formal housing plan? Is there an electrification plan based on a five year informal housing plan? Free Basic Electricity(50kWh household/month) Does an indigent policy exist? Have the number of FBE recipients been determined? Where Eskom provides electricity, has Eskom been informed and contracted to provide the FBE?
No No No No Yes No
a. The IDP mentions electricity infrastructure but no mention is made of a specific electricity master plan b. The electrical needs of the different wards are mentioned as well as the allocated capital budget for various bulk electrical projects in the municipality. No 10 year electrical forecast mentioned. a. Municipality has identified the needs of the poor communities but the electrification plans does not seem to be based on a 5 year formal housing plan. b. Municipality has identified the needs of the poor communities but the electrification plans does not seem to be based on a 5 year formal housing plan. a. Yes an indigent policy does exit at the municipality. b. It does not indicate if the number of free basic electricity recipients has been identified but the IDP does indicate in which communities the need exists.
DLG has applied for funding from Provincial Treasury for the drafting of electrical master plans at local municipalities within the province. The IDP to indicate a 10 year electricity forecast for capacity (MVA) and consumption (MWh) for existing intake points and new intake points (if applicable)? The IDP to indicate the status of its electrification plan based on a five year formal housing plan? N/A IDP to indicate the number of FBE recipients been determined.
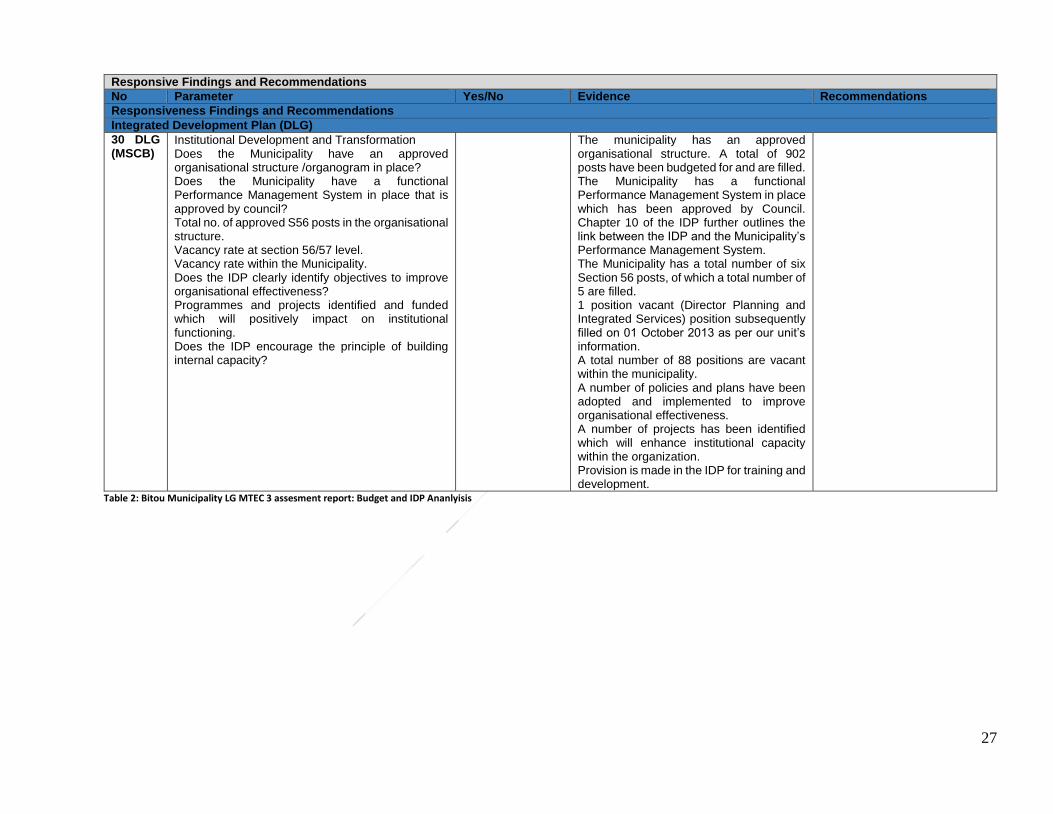
27
Responsive Findings and Recommendations
No Parameter Yes/No Evidence Recommendations
Responsiveness Findings and Recommendations
Integrated Development Plan (DLG)
30 DLG (MSCB)
Institutional Development and Transformation Does the Municipality have an approved organisational structure /organogram in place? Does the Municipality have a functional Performance Management System in place that is approved by council? Total no. of approved S56 posts in the organisational structure. Vacancy rate at section 56/57 level. Vacancy rate within the Municipality. Does the IDP clearly identify objectives to improve organisational effectiveness? Programmes and projects identified and funded which will positively impact on institutional functioning. Does the IDP encourage the principle of building internal capacity?
The municipality has an approved organisational structure. A total of 902 posts have been budgeted for and are filled. The Municipality has a functional Performance Management System in place which has been approved by Council. Chapter 10 of the IDP further outlines the link between the IDP and the Municipality’s Performance Management System. The Municipality has a total number of six Section 56 posts, of which a total number of 5 are filled. 1 position vacant (Director Planning and Integrated Services) position subsequently filled on 01 October 2013 as per our unit’s information. A total number of 88 positions are vacant within the municipality. A number of policies and plans have been adopted and implemented to improve organisational effectiveness. A number of projects has been identified which will enhance institutional capacity within the organization. Provision is made in the IDP for training and development.
Table 2: Bitou Municipality LG MTEC 3 assesment report: Budget and IDP Ananlyisis

Revised integrated development plan
CounlResolution Council resolution number: C/6/273/02/15
1.3. What is the 2015/2016 IDP review in relation to the 2012/2017 IDP
In May 2012 Council approved a five year IDP which is an overarching strategic framework through
which the Municipality aims to realise its vision and strategic objectives. The Municipality is therefore
required to revisit, revise and amend its strategies based on its past performance and if changing
circumstances so demand. This revision takes stock of the municipal performance against the set key
performance objectives, targets and adjusts its institutional capacity to perform optimally to achieve
the set targets.
This is the third revision of the third generation IDP. This revision provides a perfect opportunity to
Council to revise its performance based services delivery trends built on the past IDP processes of the
current administration.
Figure 1 below gives a schematic diagram of the IDP cycle and the actual position of the current review
(green bar).
Figure 1: IDP cycle 2012 - 2017
1.4. MEC COMMENTS
The Provincial Department of Local Government reported that they no longer issue MEC letters; but
the Head of Department signs off on the LG MTEC report for municipalities to factor in the
recommendations from the departments into the IDP.
1.5. PERFORMANCE 2012/2013 PERFORMANCE HIGHLIGHTS
The IDP is revised based on the municipal past performance. The focus of this section is on
municipal performance per key performance area. The data used in this section is extracted
from the 2013/2014 annual report
IDP CYCLE (2012 - 2017)
APPROVED IDP 2012/2017
APPROVED 1ST REVISED IDP
2013/2014
3RD REVISION OF IDP
2014/2015
2ND REVISED IDP 2015/2016
4TH AND FINAL REVISION OF IDP 2016/2017
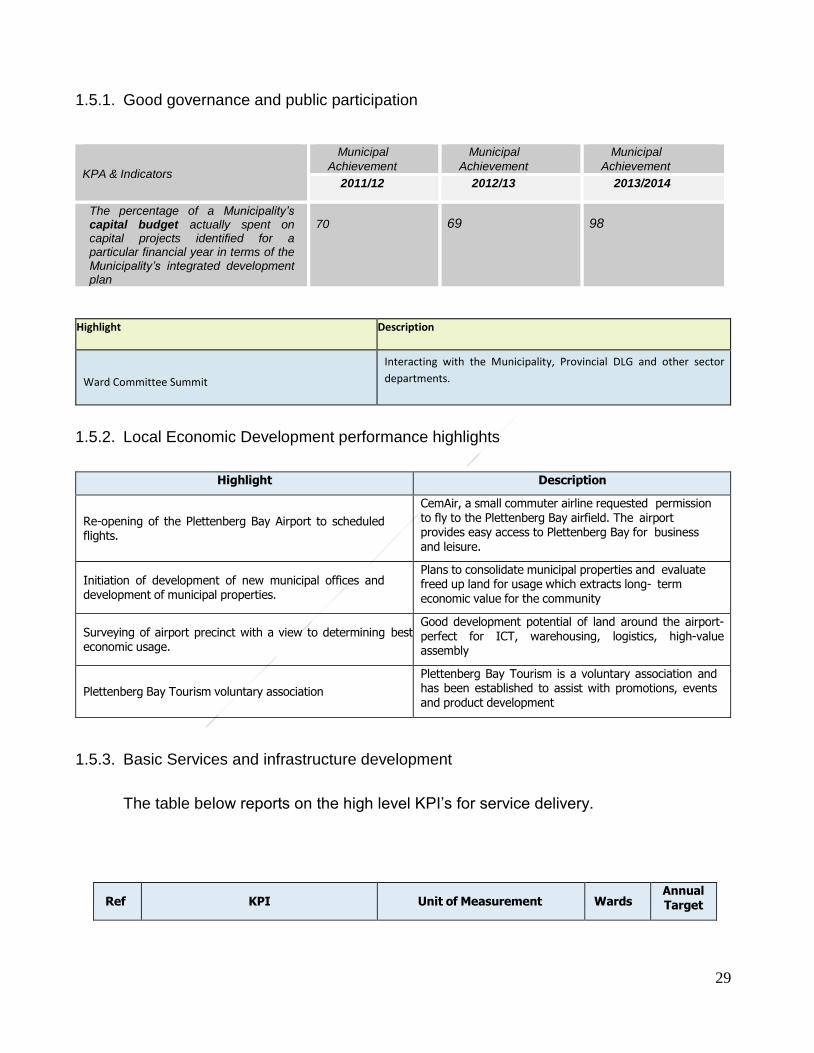
29
1.5.1. Good governance and public participation
KPA & Indicators
Municipal
Achievement
Municipal
Achievement
Municipal
Achievement
2011/12 2012/13 2013/2014
The percentage of a Municipality’s capital budget actually spent on capital projects identified for a particular financial year in terms of the Municipality’s integrated development plan
70
69
98
Highlight Description
Ward Committee Summit
Interacting with the Municipality, Provincial DLG and other sector
departments.
1.5.2. Local Economic Development performance highlights
Highlight Description
Re-opening of the Plettenberg Bay Airport to scheduled flights.
CemAir, a small commuter airline requested permission to fly to the Plettenberg Bay airfield. The airport provides easy access to Plettenberg Bay for business and leisure.
Initiation of development of new municipal offices and development of municipal properties.
Plans to consolidate municipal properties and evaluate freed up land for usage which extracts long- term economic value for the community
Surveying of airport precinct with a view to determining best economic usage.
Good development potential of land around the airport- perfect for ICT, warehousing, logistics, high-value assembly
Plettenberg Bay Tourism voluntary association
Plettenberg Bay Tourism is a voluntary association and has been established to assist with promotions, events and product development
1.5.3. Basic Services and infrastructure development
The table below reports on the high level KPI’s for service delivery.
Ref
KPI
Unit of Measurement
Wards Annual Target

30
TL1
Install civil services on the sites for the Qolweni housing project by 30 June 2015
Number of sites serviced by 30 June 2015
3
333
TL2
Complete top structures for the Qolweni housing project by 30 June 2015
Number of top structures completed by 30 June 2015
7
358
TL3
Complete top structures for the Kwa-Nokuthula housing project by 30 June
2015.
Number of top structures completed by 30 June 2015.
1
226
TL4
Install civil services on the sites for the Kwa-Nokuthula housing project by 30
June 2015
Number of sites serviced by 30 June 2015
3
233
TL17
Provide electricity to formal residential properties connected to the municipal electrical infrastructure network for both credit and prepaid electrical
metering
Number of formal residential properties connected to the
municipal electrical infrastructure network (credit and prepaid
electrical metering)
All
15,653
TL18
Number of formal residential properties for which refuse is removed once per week
Number of residential properties which are billed for refuse removal
All
16,655
TL19
Provide sanitation services to residential properties which are connected to the
municipal waste water (sanitation/sewerage) network & are
billed for sewerage service, irrespective of the number of water closets (toilets)
Number of residential properties which are billed for sewerage in accordance with the financial
system
All
14,328
TL20
Provide piped water to formal residential properties which are connected to the municipal water infrastructure network
Number of formal residential properties that receive piped water
(credit and prepaid water)
All
14,513
TL24
Limit electricity losses to not more than 15% {(Number of Electricity Units
Purchased and/or Generated - Number of Electricity Units Sold) / Number of Electricity Units Purchased and/or
Generated) × 100}
% electricity losses
All
15%
TL25
90% of the electricity maintenance budget spent by the end of June
{(Actual expenditure on maintenance divided by the total approved maintenance budget)x100}
% of the maintenance budget spent
All
90%
TL26
90% of the electricity capital budget spent by the end of June {(Actual
capital expenditure divided by the total approved capital budget)x100}
% of the capital budget spent
All
90%
TL27
90% of the roads and stormwater maintenance budget spent by the end of
June {(Actual expenditure on maintenance divided by the total
approved maintenance budget)x100}
% of the maintenance budget spent
All
90%
TL28 Kilometres of roads resealed by 30 June Kilometres of roads resealed All 1
TL29
90% of the roads and stormwater capital budget spent by the end of June {(Actual capital expenditure
divided by the total approved capital budget)x100}
(Actual expenditure on roads and stormwater capital divided by the
total approved budget)x100
All
90%

31
1.5.4. Institutional performance
The table below indicates how the municipality performed against the objective of “Create an
institution that can align planning with implementation for effective and efficient service delivery”
Ref
KPI
Unit of Measurement
Wards Annual Target
TL5
90% of funded posts filled {(Actual funded posts filled divided by approved funded
posts)x100}
% of posts filled (Actual funded posts filled divided by approved funded
posts)x100
All
90%
TL6
Number of people from employment equity target groups employed in the three highest
levels of management in compliance with a municipality’s approved employment equity
plan
Number of people employed in the
three highest levels of management
All
1
TL7
Spent 0.1% of operational budget on training {(Actual total training expenditure divided by total operational budget)x100}
% of personnel budget spent
All
0.10%
1.5.5. Financial performance for the past two financial years
The Statement of Financial Performance provides an overview of the financial performance of
the municipality and focuses on the financial health of the municipality.
Financial Summary
R'000
Description
2012/13 2013/14 2013/14 %Variance
Actual
Original Budget
Adjusted Budget
Actual
Original Budget
Adjust- ment
Budget
Financial Performance
Property rates 83 816 90 447 99 584 95 015 4.81 -4.81
Service charges 174 984 192 923 192 820 190 343 -1.36 -1.30
Investment revenue 2 844 1 770 2 340 3 365 47.40 30.46
Transfers recognised - operational
82 274
102 052
106 109
86 994
-17.31
-21.97
Other own revenue 24 681 13 056 19 461 49 128 73.42 60.39
Total Revenue (excluding capital transfers and
contributions)
368 600
400 248
420 314
424 845
5.79
1.07
Employee costs 108 939 127 524 125 969 134 355 5.08 6.24
Remuneration of councillors 4 043 4 415 4 701 4 710 6.28 0.20
Depreciation & asset impairment 41 218 36 114 36 114 30 791 -17.29 -17.29

32
Finance charges 13 559 13 845 13 927 13 683 -1.18 -1.78
Materials and bulk purchases 73 165 80 710 76 860 76 400 -5.64 -0.60
Transfers and grants 2 332 2 630 2 678 2 443 -7.67 -9.62
Other expenditure 103 980 138 823 145 797 146 607 5.31 0.55
Total Expenditure 347 236 404 060 406 046 408 990 1.21 0.72
Surplus/(Deficit) 21 364 (3 812) 14 267 26 562 114.35 46.29
Transfers recognised - capital 22 857 36 447 42 215 47 883 23.88 11.84
Table 3: Summary of financial performance for the 2013/2014 financial year

Revised integrated development plan
CounlResolution Council resolution number: C/6/273/02/15
1.6. NATIONAL AND PROVINCIAL DEVELOPMENT PLANNING AND POLICY DIRECTIVES
This section will identify the relationship between Bitou’s Integrated Development Plan and other key planning and policy
instruments from the National, Provincial Government and Eden District Municipality.
Millennium
Development Goals
National
Development Plan
2030
National Outcomes(s) Provincial Strategic Goals
(s)
Eden Strategic Goal(s)
MDG 1: Eradicate
extreme poverty and
hunger
MDG 4: Reduce child
mortality
MDG 5: Improve
maternal health
MDG 6: combat
HIV/AIDS, malaria and
other diseases
Chapter 10: Health
Care for all
Chapter 11: Social
Protection
Outcome 2: Improve health
and life expectancy
Outcome 7: Vibrant,
equitable and sustainable
rural communities and food
security
PSG 3: Increasing Wellness,
Safety and Tackling Social
Ills
G1: Healthy and Socially stable
communities
MDG 3: Promote gender
equality and empower
women
Chapter 9: Improving
Education, training
and innovation
Chapter 15: Nation
building and Social
Cohesion
Outcome 1: Improve the
quality of basic education
Outcome 5: A skilled a
capable workforce to
support inclusive growth
PSG 2: Increase education
outcomes
Improving Education
Outcomes and Opportunities
for Youth Development
G2: Build a capacitated workforce
and communities
Outcome 6: An efficient,
competitive and responsive
economic infrastructure
network
PSG 1: Create Opportunities
for Growth and Jobs
PSG 2: Improving Education
Outcomes and Opportunities
for Youth Development
G3: Conduct regional bulk
infrastructure planning and
implement projects, roads
maintenance and public transport:
manage and develop council fixed
assets

34
MDG 7: Ensure
environmental
sustainability
Chapter 5:
Environmental
Sustainability and
resilience
Outcome 3: All people in
South Africa protected and
feel safe
Outcome 10: Protection and
enhancement of
environmental assets and
natural resources
Outcome 11: A better South
Africa, a better and safer
Africa and world
PSG 4: Enabling a Resilient,
Sustainable, Quality and
Inclusive Living Environment
G4: Promote sustainable
environmental management and
public safety
Outcome 9: A responsive
and accountable, effective
and efficient local
government system
PSG 5: Embedding Good
Governance and Integrated
Service Delivery through
Partnerships and Spatial
Alignment
G5: Ensure financial viability of
the Eden District Municipality
MDG 8: Develop a global
partnership for
development
Chapter 14: Fighting
corruption
Chapter 3: Economy
and Development
Outcome 9: A responsive
and accountable, effective
and efficient local
government system
Outcome 12: A
development-orientated
public
PSG 5: Embedding Good
Governance and Integrated
Service Delivery through
Partnerships and Spatial
Alignment
PSG 2: Improving Education
Outcomes and Opportunities
for Youth Development
G6: Promote Good Governance
Outcome 4: Decent
employment through
inclusive economic growth
Outcome 6: An efficient,
competitive and responsive
economic infrastructure
network
PSG 1: Create Opportunities
for Growth and Jobs
PSG 2: Improving Education
Outcomes and Opportunities
for Youth Development
G7: Grow the district economy

Revised integrated development plan
CounlResolution Council resolution number: C/6/273/02/15
1.7. INTEGRATED DEVELOPMENT PLANNING PROCESS
The Municipal Systems Act pays particular attention regulating how the IDP should be drafted.
The Act states that the Council must adopt a plan that sets out how it intends to draft, adopt
and review the IDP document. The Act also places a high priority on the elements of vertical
integration and community participation. The process plan for the review of Bitou Municipality
five-year IDP for the 2014/2015 financial year was adopted by Council on 31 August 2013.
The table below summarizes the processes followed and ensures that the role players involved
in the process are prepared and provide the required inputs.
ACTIVITY RESPONSIBLE PERSON /
DEPARTMENT TIME LINE
Applicable
Legislation / Policy
directive
PREPARATION
IDP analysis report / MEC for Local Governments comments Municipal Manager / IDP
Manager July 2014
MSA, Section 32 (1)
(a)
IDP/Budget Steering Committee Meeting
(Analysing MEC comments) IDP / Budget /office 17 July 2014 Best Practise
Draft and sign performance agreements for section 57 officials.
Sent copies of signed agreements to Minister: Cooperative
Governance & Traditional Affairs as well as MEC: Local
Government, publish on website and local newspaper
Manager: PMS, SDBIP 31 July 2014 Performance
Regulations 805
District IDP Mangers Forum IDP Manager 08 August 2014 Best practice
Council approves process plan/time schedule plan – MFMA
Section 21(1)(b) Mayor / Municipal Manager 28 August 2014 Best practice
Formal review of staff performance of the period January – June.
Finalise performance plans (scorecards) for staff Manager: PMS, SDBIP August 2014
Advertise IDP process in local news papers IDP Manager 5 September 2014 Best practice
Ward Committee Summit Communication unit September 2014 Best practise
IDP / Budget / PMS Workshop
Mayor/MM/HOD’s and line
Managers (IDP/Budget
steering committee)
10 September 2014 Best practice
IDP INDABA/ MINMAY Municipal Manager / IDP/Mun
Manager September 2014 Best practice
Provincial IDP Managers Forum IDP Manager 04 & 05 September
2014 Best practice
District IDP Managers Workshop IDP Manager 18 September 2014 Best Practice
Update IDP forum list IDP Manager 26 September 2014 Best practice
ANALYSIS
Ward meetings (meeting with ward committees and Council of
Stakeholders in the case of ward 4).
(Revision of chapter 7 of 2014/2014 IDP)
Ward Councillors/ IDP
Manager / Speakers Office
02 – 30 September
2014
Approved process
plan
Wards Venue (Tentative) TIME
Ward 1 Green Valley Hall 19:00 Ward Councillor October 2014 Best practice
Ward 2 Strategic Services Board
room
18:00 Ward Councillor October 2014 Best practice
Ward 3 Bicycle Shed 19:00 Ward Councillor October 2014 Best practice

36
ACTIVITY RESPONSIBLE PERSON /
DEPARTMENT TIME LINE
Applicable
Legislation / Policy
directive
Ward 4 Councillors office 19:00 Ward Councillor October 2014 Best practice
Ward 5 Kwano-Library 18:00 Ward Councillor October 2014 Best practice
Ward 6 Kwano-Library 18:00 Ward Councillor October 2014 Best practice
Ward 7 Kranshoek Boardroom 19:00
Ward Councillor October 2014 Best practice
IDP FORUM MEETING (presenting community issues to
government and NGO sectors)
MAYOR/MUNICIPAL AND IDP
MANAGERS November 2014 Best practice
Finalise and submit performance report to AG. Annual
performance review of section 57 officials
Evaluation Panel headed by
Executive Mayor September 2014
Performance
Regulations 805
IDP / PMS Steering Committee (considering community issues
and targets) Mayor Municipal Manager November 2014 Best Practice
Bitou Municipality INDABA 1 engagement Municipal Manager 06 October 2014 Best Practice
Bitou Profiling
(Revision of chapter 3 of 2014/2015 IDP) HOD: Strategic Services November 2014 Best practice
institutional analysis
(Revision of chapter 4 of 2014/2015 IDP) HOD: Corporate Services November 2014 Best practice
Financial Analysis
(Revision of chapter 8 of 2014/2015 IDP) HOD: Financial Services November 2014
IDP / Budget / PMS Steering Committee Analysing gaps:
- Institutional
- Financial
- Governance
- Service Gaps
- Performance
HOD’s Corporate, Finance and
Strategic services November 2014 Best practice
Municipal Strategic Planning Session Municipal Manager November 2014 Best Practice
Provincial IDP Managers forum IDP Manager Dec 2014 Best Practice
STRATEGY / INDICATORS/TARGETS
Strategic workshop: Consolidate priorities for Budget purposes.
(Revision of chapter 5 of 2014/2014 IDP)
Mayor, Councillors Municipal
Manager and HOD,s January 2015 Best practice
Piloting of the implementation of the SALGA IDP framework in
Hessequa IDP Manager 11 November 2014 Best practice
PROJECTS / PROGRAMMS / BUDGETS
Capital Projects All Departments February 2015 Best practice
- Community projects (Roads, housing etc.) February 2015 Best practice
- Staff items (office furniture etc.) February 2015 Best practice
Operational Projects Budget Office February 2015 Best practice
- Personnel (New position) February 2015 Best practice
- Administration and Personnel February 2015 Best practice
Submission of Adjustment Budget information Budget Office 2-9 January 2015 Best practice
- IDP / Budget Steering Committee (considering
adjustment budget) Budget Office 13 January 2015
Best practice
- Setting of performance indicators (Draft SDBIP) IDP forum February 2015 Best practice
INTEGRATION
Approval of adjustment budget in conjunction with mid-year
assessment. Budget Office March 2015 Approved process plan
District IDP Managers work session IDP Manager March 2015 Approved process plan
Integration of sector plans All departments March 2015 Approved process plan
APPROVAL (IDP & Budget and Performance Documentation)
Final changes to Draft Budget submissions All departments 6 February 2014
Council approves first drafts of the revised IDP and Budget Mayor / Municipal Manager 19 March 2015 MFMA Section 16 (1) &
(2)

37
ACTIVITY RESPONSIBLE PERSON /
DEPARTMENT TIME LINE
Applicable
Legislation / Policy
directive
Give notice for 21 days to the public for comments the draft IDP
& Budget IDP and Budget Offices 03 – 23 April 2015
Municipal Planning and
performance
regulations, 2001
(GNR.796)
Submit copies of the draft IDP and Budget to Provincial Treasury
and Provincial and National Departments responsible for local
government
IDP and Budget Offices 03 April 2015 MFMA Section 22 (a) &
(b)
Submit the proposed revised IDP to Eden DM IDP Manager 6 April 2015 MSA Section 29(3)(b)
MPPM Regulation 3(6)
Conduct ward based public meetings to inform the public about
the IDP and Budget for 2014/2014 IDP Steering Committee April 2015 MFMA Section 23(1)
WARDS VENUE TIME
Ward 1 Covey 19:00 Ward Councillor
Kurland 19:00
Ward Councillor
Wittedrift 19:00 Ward Councillor
- Ward 2 Piesang Hall 18:00 Ward Councillor April 2015
Ward 3 Bicycle shed 18:30 Ward Councillor April 2015
Ward 4 New horizon Hall
(transport Split VD) 19:00 Ward Councillor
April 2015
- Ward 5 Kwa-Nokuthula Hall 18:00 Ward Councillor April 2015
- Ward 6 Kwa-Nokuthula Hal 18:00 Ward Councillor April 2015
- Ward 7 Kranshoek 19:00 Ward Councillor April 2015
Harkeville(transport
Split VD) 19:00 Ward Councillor
April 2015
Respond to public
comments Mayor and Municipal Manager MFMA Section 23(2) 13 April 2015
Council approves IDP
and Budget. Council
MFMA Section 24(1)
MPPM Regulation 3(3) 29 May 2015
Place approved IDP, and annual budget related documents and
policies on municipal website (within 5 days of adoption)
MFMA Section 75(1) & (2)
MSA Section 21A(1)(b) 5 June 2015
Respond to public comments Mayor and Municipal
Manager
20 May 2015 MFMA Section 23(2)
- IDP / Budget Steering Committee (considering
Budget) Budget Office
May 2015
Council approves IDP and Budget. Council 28 May 2015 MFMA Section 24(1)
MPPM Regulation 3(3)
Place approved IDP, and annual budget related documents and
policies on municipal website (within 5 days of adoption)
IDP and Budget Offices 5 June 2015 MFMA Section 75(1) &
(2)
MSA Section 21A(1)(b)
Submit copies of the revised IDP and Budget to Provincial
Treasury and MEC for Local Government (within 10 days of the
adoption)
IDP and Budget Offices 10 June 2015 MSA Section 32(1)(a)
Give notice to the public of the adoption of the IDP (within 14
days of adoption)
IDP and Budget Offices 10 June 2015 MSA Section 25(4)(a)
MSA Section 21A(1)(b)
Publicise a summary of the IDP (within 14 days of adoption) IDP Office 10 June 2015 MSA Section 25(4)(b)
Make public the approved annual budget and supporting
documentation (including tariffs) (within 10 working days after
approval of the
budget)- Budget Office 10 June 2015 Budget & Reporting
Regulations 2009, Rag
18 (1-3)
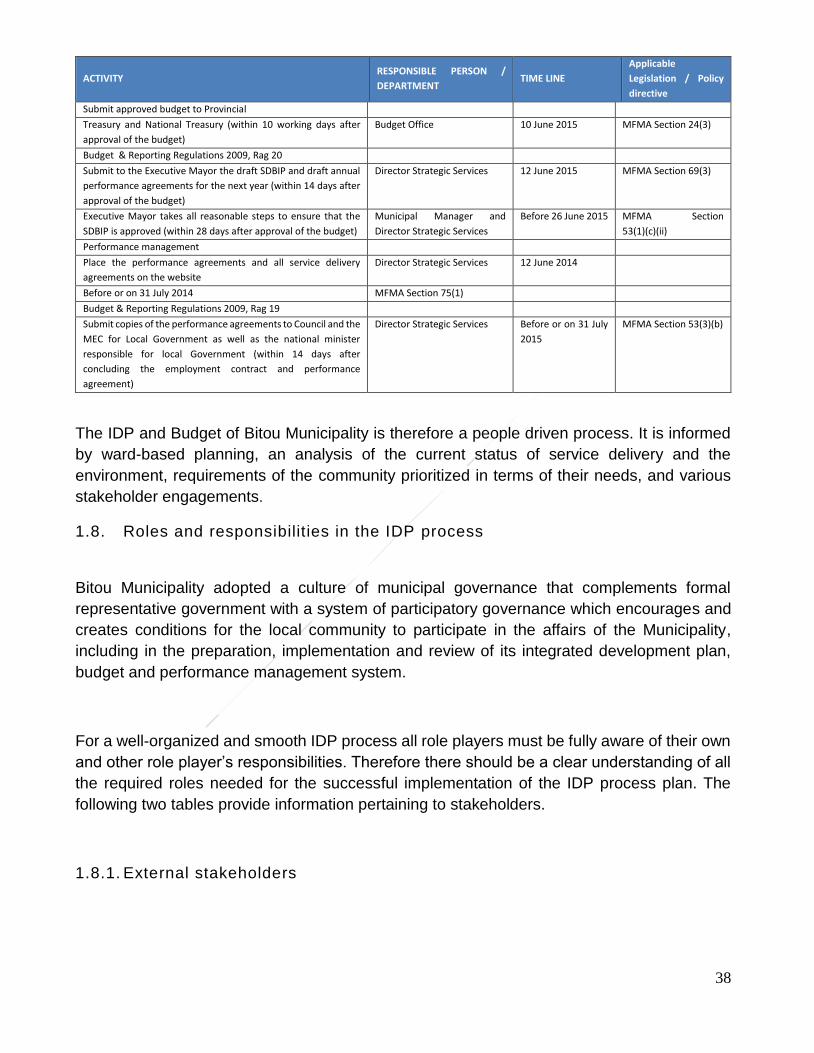
38
ACTIVITY RESPONSIBLE PERSON /
DEPARTMENT TIME LINE
Applicable
Legislation / Policy
directive
Submit approved budget to Provincial
Treasury and National Treasury (within 10 working days after
approval of the budget)
Budget Office 10 June 2015 MFMA Section 24(3)
Budget & Reporting Regulations 2009, Rag 20
Submit to the Executive Mayor the draft SDBIP and draft annual
performance agreements for the next year (within 14 days after
approval of the budget)
Director Strategic Services 12 June 2015 MFMA Section 69(3)
Executive Mayor takes all reasonable steps to ensure that the
SDBIP is approved (within 28 days after approval of the budget)
Municipal Manager and
Director Strategic Services
Before 26 June 2015 MFMA Section
53(1)(c)(ii)
Performance management
Place the performance agreements and all service delivery
agreements on the website
Director Strategic Services 12 June 2014
Before or on 31 July 2014 MFMA Section 75(1)
Budget & Reporting Regulations 2009, Rag 19
Submit copies of the performance agreements to Council and the
MEC for Local Government as well as the national minister
responsible for local Government (within 14 days after
concluding the employment contract and performance
agreement)
Director Strategic Services Before or on 31 July
2015
MFMA Section 53(3)(b)
The IDP and Budget of Bitou Municipality is therefore a people driven process. It is informed
by ward-based planning, an analysis of the current status of service delivery and the
environment, requirements of the community prioritized in terms of their needs, and various
stakeholder engagements.
1.8. Roles and responsibilities in the IDP process
Bitou Municipality adopted a culture of municipal governance that complements formal
representative government with a system of participatory governance which encourages and
creates conditions for the local community to participate in the affairs of the Municipality,
including in the preparation, implementation and review of its integrated development plan,
budget and performance management system.
For a well-organized and smooth IDP process all role players must be fully aware of their own
and other role player’s responsibilities. Therefore there should be a clear understanding of all
the required roles needed for the successful implementation of the IDP process plan. The
following two tables provide information pertaining to stakeholders.
1.8.1. External stakeholders

39
ROLE PLAYER ROLES AND RESPONSIBILITIES
Bitou Municipality
Prepare and adopt the IDP process plan;
Undertake the overall management and coordination of the IDP
process which includes ensuring that;
All relevant role players are appropriately involved;
Appropriate mechanisms and procedures for community participation
are applied;
Events are undertaken in accordance with the time schedule;
The IDP relates to the real burning issues in the Municipality
The sector planning requirements are satisfied.
Prepare and adopt the IDP;
Adjust the IDP in accordance with the MEC’s
proposals/recommendations; and
Ensure that the annual business plans, budget and performance
management decisions are linked to and based on the IDP.
Role of Ward Committees Members
Serve as an official participatory structure Assist the Ward Councillor in identifying challenges and needs of
residents Disseminate information in the ward concerning municipal affairs,
such as Budget, Integrated Development Planning, Performance Management systems, service delivery options and municipal properties.
Serve as a mobilisation agent for community action within the IDP and other related matters.
Bitou communities, residents and stakeholders
Represent interests and contribute knowledge and ideas in the IDP
process by participating in and through the ward committees;
Analyse issues, determine priorities and provide input;
Keep their constituencies informed on IDP activities and their
outcomes; and
Discuss and comment on the draft IDP;
Check that annual business plans and budget are based on and
linked to the IDP; and
Monitor performance on the implementation of the IDP.
Eden District Municipality
Same roles and responsibilities as municipal governments of local
municipalities but related to the preparation of a district IDP;
The District Municipality must also prepare a District Framework (Sec
27 of the MSA);
Fulfil a coordination and facilitation role by:
Ensuring alignment of the IDP’s of the municipalities in the district
council area
Ensuring alignment between the district and local planning;
Facilitation of alignment of IDP’s with other spheres of government
and sector departments; and

40
ROLE PLAYER ROLES AND RESPONSIBILITIES
Preparation of joint strategy workshops with local municipalities,
provincial and national role players and other subject matter
specialists.
Provincial Government: Department of Local Government
Ensure horizontal alignment of the IDP’s of the District Municipalities
within the province.
Ensure vertical/sector alignment between provincial sector
departments/ provincial strategic plans and the IDP process at
local/district level by:
Guiding the provincial sector departments participation in and their
required contribution to the municipal IDP process and;
Guiding them in assessing draft IDP’s and aligning their sector
programs and budgets with the IDP’s.
Efficient financial management of Provincial IDP grants.
Monitor the progress of the IDP processes.
Facilitate resolution of disputes related to IDP.
Assist municipalities in the IDP drafting process where required.
Coordinate and manage the MEC’s assessment of IDP’s.
Sector Departments
Contribute relevant information on the provincial sector department’s
plans, programs, budgets, objectives, strategies and projects in a
concise and accessible manner.
Contribute sector expertise and technical knowledge for the
formulation of municipal strategies and projects.
Engage in a process of alignment with District Municipalities.
Participate in the provincial management system of coordination.
National Government
National Treasury issues guidelines on the manner in which
municipal councils should draft and process their annual budgets. Table 4: External role player’s roles and responsibilities of stakeholders in the IDP process
1.8.2. Internal stakeholders
The Municipality has a specific role to fulfil in relation to the implementation of the process
plan. Table 3 below defines the roles of internal stakeholders:
Role Player Roles and Responsibilities
Municipal Council o Consider and approve the IDP o Consider and approve the Budget
Executive Mayor &
Mayoral Committee
o Overall management, coordination and monitoring of the process and drafting of the IDP
o Assign and delegate the function to the municipal manager o Approve nominated persons to be in charge of the different roles,
activities and responsibilities of the process and drafting.

41
Role Player Roles and Responsibilities
o Submit the draft IDP to Council for adoption.
Ward Councillors o Link the planning process with their constituencies and/or wards o Assist with organising public consultation and participation (ward
committees) o Monitor the implementation of the IDP with respect to their particular
wards; o Ensure the annual business plans and municipal budget are linked to
and based on the IDP. o Ward Councillor must ensure that full and proper records are kept of
minutes of ward committee meetings are kept o Must chair ward and public meetings. Ward Councillor may delegate in
writing the chairing of the meeting in his/her absence
Speaker o Overall monitoring of the public participation process; o Exercise oversight of the ward committee system.
Municipal Manager
and / Director
Strategic Services /
IDP Manager
o Prepare and finalize the Process Plan; o Be responsible for overall management, coordinating and monitoring
of the process and drafting the IDP Review; o Responsible for the day to day management of the planning process,
ensuring that all relevant actors are appropriately involved; o Nominate persons in charge of different roles o Ensure that the process is participatory, strategic and implementation
orientated and is aligned with sector planning requirements o Respond to public and MEC’s comments on the draft IDP review o Ensure proper IDP documentation o Adjust the IDP in accordance with the MEC’s recommendations o Monitor the implementation of the IDP proposal
Directors and
Heads of
Department
o Prepare departmental budgets in line with IDP o Prepare selected Sector Plans o Provide relevant technical, sector and financial information for analysis
for determining priority issues. o Contribute technical expertise in the consideration and finalization of
strategies and identification of projects. o Provide departmental, operation and capital budgetary information. o Responsible for the preparation of project proposals, the integration of
projects and sector programmes.
Communication
Sub-Directorate
o Assist the Speaker to coordinate the process of establishing ward committees.
o Responsible for logistical arrangements pertaining to ward committee meetings.
o The responsibility to meet regularly with the ward committees to ensure appropriate communication with the communities through the ward committee structure.
o The responsibility to ensure that representations made through the ward committees and ward councillors are channelled to the appropriate structures/functionaries for further attention/information.
o To provide the administrative support to ward committees.

42
Role Player Roles and Responsibilities
IDP-Steering
Committee
o Refinement and Quality check of IDP document to ensure compliance with legislation.
o Consist of Municipal Manager, Senior Management/Directors, IDP Manager/Office, and Speaker.
Budget-Steering
Committee
o To provide technical assistance to the mayor in discharging the responsibilities set out in Section 53 of the MFMA.
o Consist of portfolio Councillor for Financial matters, the Municipal Manager, the Chief Financial Officer, Senior Managers/Directors and Head of Departments to give technical advice if necessary.
IDP Representative
Forum
o Provide an organisational mechanism for discussion, negotiation and decision-making between stakeholders.
o Represents the interest of their constituencies in the IDP process. o Monitors the performance of the planning and implementation process.
Table 5: Internal role players
1.9. OVERVIEW OF DOCUMENT STRUCTURE
Section 25 of the Municipal Systems Act is particular about the content of the IDP. The content
in of this document is outlined as follow:
Chapter 1: introduction
This chapter sets the scene by giving the context for revising the IDP and outlines the institutional arrangements for the successful implementation of the IDP. Included in this chapter is the approved process plan, MEC comments and the municipal past performance.
Chapter 2: municipal profile
This is one of the most important sections of the IDP because it outlines the current realities based on scientifically tested data. The purpose of this chapter is to give users the current reality of the population figures, population growth trends and the socio-economic profile of Bitou.
Chapter 3: community development (ward planning)
Community participation is central in the development of the IDP and communities are legislatively encouraged to participate in the affairs of local government. They are also encouraged to demand services and be part of all municipal decision making processes. This chapter gives a list of priorities raised by communities in the different wards. These issues are raised for consideration in the planning and budgeting process
Chapter 4: in-depth
analysis
This chapter focuses on analysing the institutional situation, financial viability, issues of good governance and public participation, local economic development and the levels of basic services delivery with the view of finding a balance between the issues facing the socio-economic wellbeing of Bitou and the available resources.
Chapter 5: development strategy
The IDP is a strategic tool that is meant to guide the municipal planning, and decision-making processes. It is a tool, which needs to steer municipal expenditure in a direction of achieving the municipal developmental imperatives. This chapter describes the municipal strategic focus, the vision, mission and all related strategic planning requirements.
Chapter 6: one year project implementation plan (2014/2015)
After the analysis is completed, based on sections 2, 3 and 4 projects are identified for implementation. This chapter gives a list of projects per key performance area for implementation in the 2014/2015 financial year. User can now see where, what and how much is going to be spent per ward.

43
Chapter 7: sector planning and department investments
Sector alignment is one of the fundamental prerequisites in the process and the legislation is clear on which sector plans must find prominence in the IDP. This chapter reports on the status of sector plans and also the provincial sector departments’ foot print in the Bitou area.
Chapter 8: financial plan
The Municipality will not meet its developmental mandate without sound finances and proper
financial management systems. This section focuses on the municipal financial plans for the next
MTREF cycle. The plan looks into mechanisms of funding both the CAPEX and OPEX budgets
in a sustainable manner.
Chapter 9: performance management
This chapter reports on the status of the municipal performance management systems and how the implementation of the municipal development strategies will be measured against set key performance indicators and targets. This plan also outlines the reporting mechanisms as prescribed by legislation and adopted by Bitou Municipality for compliancy and accountability.
Table 6: Document structure
1.10 IDP / budget process self -assessment
MAYCO adopted the IDP and time schedule in August and Council could only approve them
on the 16 October 2014 due to a by-election in September 2014.
Mechanism for participation
Community participation took place in all phases of the IDP drafting process. The following
tables give a full account of how communities were encouraged to participate in the IDP
drafting process:
Ward Committee Meetings
During October and November IDP Meetings were held with ward committees in all wards,
some ward committees made written submissions and Ward Plans were developed for Wards
1, 3 and 4 through a provincial sponsored programme.
IDP Forum
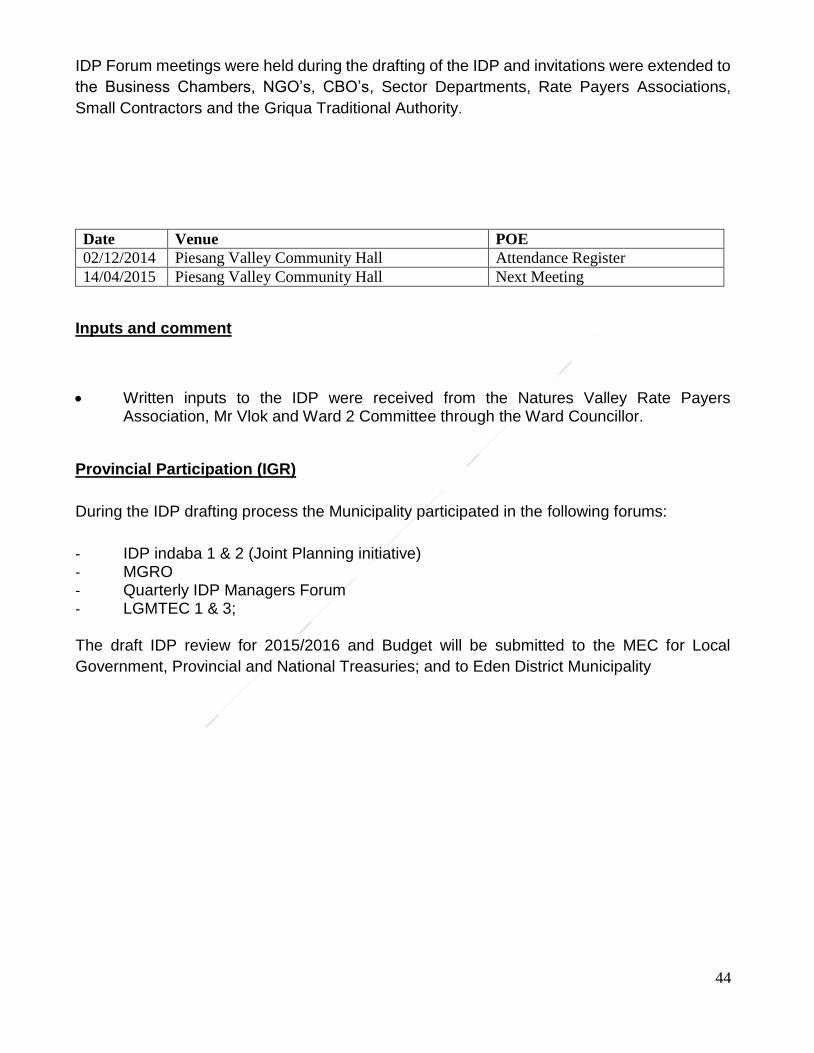
44
IDP Forum meetings were held during the drafting of the IDP and invitations were extended to
the Business Chambers, NGO’s, CBO’s, Sector Departments, Rate Payers Associations,
Small Contractors and the Griqua Traditional Authority.
Date Venue POE
02/12/2014 Piesang Valley Community Hall Attendance Register
14/04/2015 Piesang Valley Community Hall Next Meeting
Inputs and comment
Written inputs to the IDP were received from the Natures Valley Rate Payers Association, Mr Vlok and Ward 2 Committee through the Ward Councillor.
Provincial Participation (IGR)
During the IDP drafting process the Municipality participated in the following forums:
- IDP indaba 1 & 2 (Joint Planning initiative) - MGRO - Quarterly IDP Managers Forum - LGMTEC 1 & 3;
The draft IDP review for 2015/2016 and Budget will be submitted to the MEC for Local
Government, Provincial and National Treasuries; and to Eden District Municipality
45
CHAPTER 2: MUNICIPAL PROFILE
The main aim of this chapter is to give users, investors and the public up to date data on
service levels, backlogs and economic status of Bitou. This report will highlight the following
data sets:
1. Geographic profile
2. Socio-economic information
3. Household service
4. Tenure status
5. Spatial management concepts
6. Environmental management
These data sets are also supported with comprehensive maps that indicate the geography or
spatial spread of service gaps.
This profile of the Municipality relies on the 2011 census data (done every 10 years) and the
provincial Municipal Economic Review and Outlook.
2.1. Bitou geography
Bitou Municipality (WC044) is situated along the Garden Route within the Western Cape; it
falls in the jurisdiction of Eden District Municipality (DC4) and the Bloukrans River its eastern
boundary that bisects the Western and Eastern Cape Provinces.
Bitou includes towns like Plettenberg Bay “the Jowell of the Garden Route”, Covie, Nature's
Valley, the Crags, Kurland, Keurbooms, Wittedrift, Green Valley, Kranshoek, Harkerville, Kwa-
Nokuthula, New Horizons, Qolweni and Bossiesgif.

Revised integrated development plan
CounlResolution Council resolution number: C/6/273/02/15
Bitou Municipality’s area of jurisdiction.
Figure 2: Locality Map
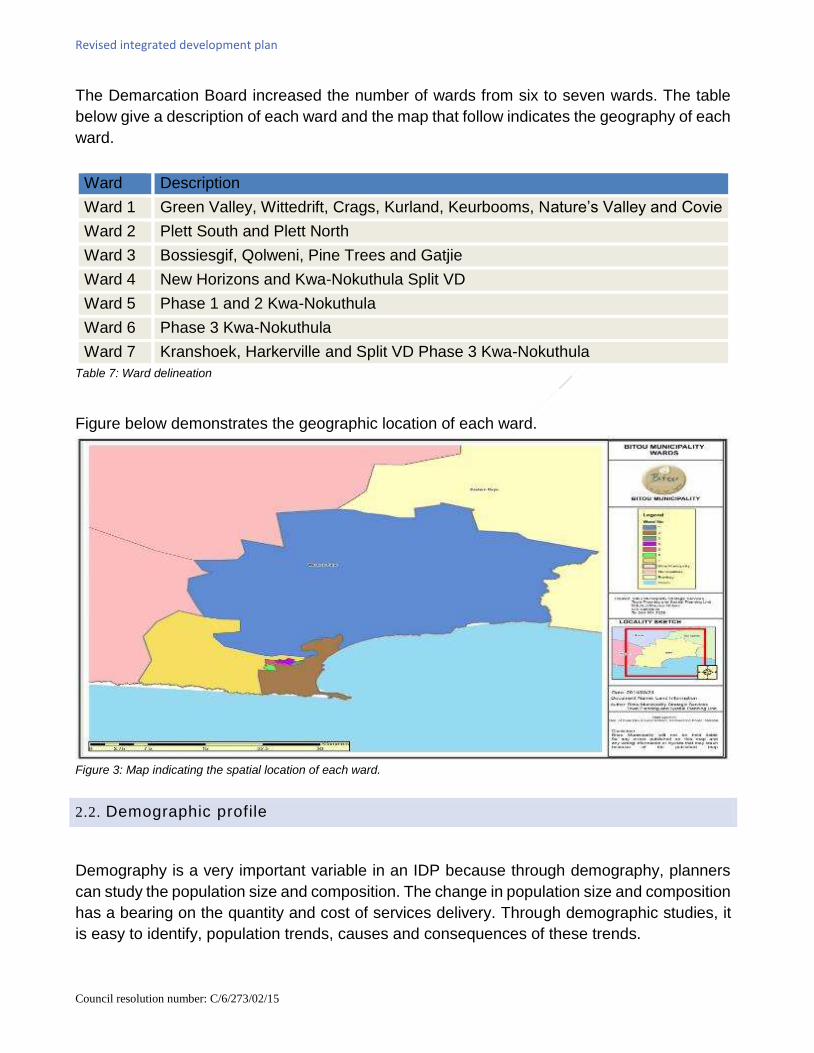
Revised integrated development plan
CounlResolution Council resolution number: C/6/273/02/15
The Demarcation Board increased the number of wards from six to seven wards. The table
below give a description of each ward and the map that follow indicates the geography of each
ward.
Ward Description
Ward 1 Green Valley, Wittedrift, Crags, Kurland, Keurbooms, Nature’s Valley and Covie
Ward 2 Plett South and Plett North
Ward 3 Bossiesgif, Qolweni, Pine Trees and Gatjie
Ward 4 New Horizons and Kwa-Nokuthula Split VD
Ward 5 Phase 1 and 2 Kwa-Nokuthula
Ward 6 Phase 3 Kwa-Nokuthula
Ward 7 Kranshoek, Harkerville and Split VD Phase 3 Kwa-Nokuthula
Table 7: Ward delineation
Figure below demonstrates the geographic location of each ward.
Figure 3: Map indicating the spatial location of each ward.
2.2. Demographic profile
Demography is a very important variable in an IDP because through demography, planners
can study the population size and composition. The change in population size and composition
has a bearing on the quantity and cost of services delivery. Through demographic studies, it
is easy to identify, population trends, causes and consequences of these trends.

48
The last census was held in 2011. The census results of 2011 indicates, “Bitou Municipality
has the fourth fastest growing population in the country and the second fasted growing
population in the Province with an annual growth rate of 5.4 percent.
The Table below indicates the population trends from 1996 to 2011 and this is done by
comparing population growth by national group and gender.
NATIONAL GROUP 1996 2001 2011
Male Female Male Female Male Female
Black African 2513 2143 5638 5429 11338 10901
Coloured 3697 3948 5659 6080 7478 7866
Indian or Asian 38 25 45 50 116 133
White 2286 2428 3001 3280 3960 4347
Other 0 0 0 0 1576 1447
Unspecified 665 684 0 0 0 0
TOTAL 18427 29182 49162
Table 8: Bitou population by national group and gender (source StatsSA)
The graph in below shows the population growth trends since 1996.
Figure 4: Population growth trends since 1996. (source StatsSA)

49
Population projection by 2030
Rapid population growth is a major contributor to the municipal development challenge. It is
said that Bitou is the 4th fastest growing town in South Africa with an annual growth rate of 5.8
percent. The table below give the population figures as per the past census and a population
forecast to 2030.
POPULATION
1996 2001 2011 2014 2030
18427 29182 49162 59629 138776
We used the double period formula to forecast the doubling period of the population in Bitou and we
realized that the population will double in the next 11 – 12 years. This simply means that Bitou will
have a population of close to a 100 000 residents by 2025.
The exponential population growth in Bitou breeds the following challenges:
a. A need for additional housing opportunities;
b. NEED for additional infrastructure services and bulk infrastructure (to cater even for the seasonality of
the town)
c. Increasing backlogs of infrastructure maintenance
d. Encroachment and illegal dwellings;
e. Illegal electrical connections;
f. Unemployment;
g. Health hazards and
h. crime
The map below demonstrates the population distribution by national grouping in all wards. This data set can
be used to inform the communication strategy for each ward.

50
The population pyramid graphs below illustrate the levels of growth per age group. The
evidence presented by the graph in figure 6 below demonstrates that the population is
growing primarily between the ages of 20 and 65 years and 0 – 20 years. These growth
trends mean demand for shelter, employment, health and education facilities increased.
Figure 5: Map illustrating the population distribution by national group per war d(source StatsSA) .

51
Bitou Municipality’s population had more females than males in 2011. The gender ratio in 2001
was 96,7% males (per 100 females). The ratio increased to 99,1% in 2011.
2.3. HOUSEHOLD INFORMATION
In 2011, 16 645 households were living in the Bitou municipal area. The number of households
nearly doubled since 2001. There is also an increase in the number of households headed by
females and a decrease of households living in formal dwellings.
2.3.1. HOUSEHOLD DYNAMICS
Figure 6: Population pyramids illustrating the population dynamics since 1996 (source StatsSA)

52
HOUSEHOLD DYNAMICS
Households Average household
size
Female headed
households % Formal dwellings %
% Housing
owned/paying off
8 763 16 645 3,2 2,8 32,8 33,5 79,8 72,2 58,9 45,9
Table 9: Summary of household dynamics
The size cohort with the highest number of households is where the households consist of a
single person; it represents 28,1% of households. Nearly 26,7% of households consist of not
more than 2 persons.
HH size 1 2 3 4 5 6 7 8 9 10+ Total
Nr of HH's 4 692 4460 2677 2228 1294 689 287 149 77 91 16 645
Table 10: Household numbers by size of households(source StatsSA)
Figure 7: Household size percentage (source StatsSA)
2.3.2. HOUSEHOLD MONTHLY INCOME
The graph below illustrates the monthly household income levels from households with no income to house
households with the highest income per capita per month.
1 2 3 4 5 6 7 8 9 10
1996 19.3 26.4 15.4 15.0 9.1 6.0 3.5 2.2 1.8 1.3
2001 20.4 26.1 17.6 14.6 9.1 5.8 2.9 1.8 0.8 1.0
2011 28.2 26.8 16.1 13.4 7.8 4.1 1.7 0.9 0.5 0.5
0.0
5.0
10.0
15.0
20.0
25.0
30.0
Pe
rce
nta
ge
Household Size percentage

53
Figure 8: Household monthly income levels(source StatsSA)
2.4. HOUSEHOLD SERVICES
This section focuses on the number of households with access to basic services such as
water, electricity, sanitation and waste removal above RDP standards.
2.4.1. DWELLING TYPE
The number of formal dwellings increased with more than 6 000 dwellings from 1996 to 2011.
The increase in the number of dwellings can be attributed to the population increase. At the
same time the number of informal dwellings nearly trebled from 2001 to 2011. Bitou had 1 478
informal dwellings in 2001, which increased to 4 049 in 2011. The map in figure 10 below gives
a spatial link to informal dwellings. The informal dwellings in wards 5 and 4 are mostly back
yard dwellings on plots with formal dwellings.
The table below gives the actual figures of the dwelling types whilst figure 8 schematic
demonstration of trends since 1996.
0.00 5.00 10.00 15.00 20.00 25.00
No income
R1 - R400
R401 - R800
R801 - R1 600
R1 601 - R3 200
R3 201 - R6 400
R6 401 - R12 800
R12 801 - R25 600
R25 601 - R51 200
R51 201 - R102 400
R102 401 - R204 800
R204 801 or more
Noincome
R1 -R400
R401 -R800
R801 -R1 600
R1 601 -R3 200
R3 201 -R6 400
R6 401 -R12 800
R12 801- R25600
R25 601- R51200
R51 201- R102
400
R102401 -R204800
R204801 ormore
2011 18.07 4.40 5.49 16.41 19.70 13.83 9.01 6.66 4.02 1.54 0.48 0.38
2001 13.94 5.80 13.13 20.54 18.56 11.99 8.33 5.19 1.37 0.59 0.23 0.32
Distribution of household by monthly household income

54
DWELLING TYPE 1996 2001 2011
Formal dwelling 3879 6989 12013
Traditional dwelling 93 223 168
Informal dwelling 960 1478 4059
Other 48 72 405
Unspecified 59 0 0
TOTAL 5039 8762 16645 Table 11: Number of dwellings by type of dwelling (Source StatsSA)
Figure 9: Percentage size of household dwelling types (source StatsSA)
The integrated humam settlement plan provides a strategic and a policy framework to deal
with human settlement issues.

55
Figure 10: Informal dwellings by ward (source StatsSA)
The map above indicates the wards with the most number of informal dwellings.
2.4.2. HOUSEHOLDS WITH ACCESS TO WATER
The number of household with piped water inside dwelling increased from 2 300 in 1996 to 9
743 in 2011. The number of households with access to piped water in the yard also increased
from 1 109 in 1996 to 3 999 in 2011 and households with access to potable water from an
access point also increased from 1 041 in 1996 to 2 649 in 2011. At the same time the number
of households with no access to piped water decreased from 563 in 1996 to 254 in 2011.
CENSUS YEAR
PIPED
WATER
INSIDE THE
DWELLING
PIPED
WATER
INSIDE
THE
YARD
PIPED WATER
FROM ACCESS
POINT OUTSIDE
THE YARD
NO
ACCESS
TO
PIPED
WATER UNSPECIFIED TOTAL
1996 2300 1109 1041 563 26 5039
2001 4132 2863 1404 364 0 8763
2011 9743 3999 2649 254 0 16645
Table 12: Number of households with access to water above the RDP standards. (source StatsSA)

56
The table above indicates the number of households with access to clean drinking water
beyond RDP standards and the graph below demonstrates the trend in which the Municipality
delivered potable water over the past census’s.
Figure 11: Percentage of households with access to portable water. (source StatsSA)
The map below presents the wards with the highest number of households with no access to
water. All water projects should be directed in addressing the water backlogs.
Piped water insidethe dwelling
Piped water insidethe yard
Piped water fromaccess point
outside the yard
No access to pipedwater
Unspecified
1996 45.6 22.0 20.7 11.2 0.5
2001 47.2 32.7 16.0 4.2 0.0
2011 58.5 24.0 15.9 1.5 0.0
0.0
10.0
20.0
30.0
40.0
50.0
60.0
70.0
Pe
rce
nat
ge
Households with access to water

57
Figure 12: Map indicating wards with piped water and number of households with no access to piped water(source StatsSA)
2.4.3. HOUSEHOLDS WITH ACCESS TO ELECTRICITY OR LIGHTING, COOKING
AND HEATING
The table below show the different sources of energy used by households since 1996
census. Electricity has been the main source of energy since 1996. The number of
households with access to electricity increased from 73,9 percent in 1996 to 94 percent in
2011.
Electricity Gas Paraffin Candles Solar Other None Unspecified
1996 73.9 0.6 12.9 11.9 0.0 0.0 0.0 0.7
2001 80.7 0.3 7.9 10.7 0.2 0.1 0.0 0.0
2011 94.0 0.2 1.6 3.8 0.2 0.0 0.2 0.0 Table 13: Energy source for lighting (source StatsSA)
The graph below illustrates the trend in which the municipality connected citizens to the grid.

58
Figure 13: Household percentage with access to electricity (source StatsSA)
2.4.4. HOUSEHOLDS WITH ACCESS TO SANITATION
Seventy five percent of households have access to a water bourn sanitary system. The
municipality refutes the notion that there is a form of a bucket toilet system in Bitou and this
dispute was raised at a highest level at Statistics South Africa as a result the questionnaire for
the community survey will be revised.
Flush toilet (connected to sewerage system)
Flush toilet (with septic tank)
Chemical toilet
Pit toilet with ventilation (VIP)
Pit toilet without ventilation
Bucket toilet
Other None
2001 71.09 10.28 1.64 1.83 3.57 3.39 0.00 8.19
2011 75.61 8.40 0.23 3.55 8.07 0.75 0.86 2.54 Table 14: Household percentage with access to toilet facilities (source StatsSA)
The map below demonstrate the trend of providing sanitation to households since 2001.
Electricity Gas Paraffin Candles Solar Other None Unspecified
1996 73.9 0.6 12.9 11.9 0.0 0.0 0.0 0.7
2001 80.7 0.3 7.9 10.7 0.2 0.1 0.0 0.0
2011 94.0 0.2 1.6 3.8 0.2 0.0 0.2 0.0
0.0
10.0
20.0
30.0
40.0
50.0
60.0
70.0
80.0
90.0
100.0p
erc
en
tage
ho
use
ho
ldHouseholds with access to electicity

59
Figure 14: Household percentage of households with access to toilet facilities. (source StatsSA)
2.4.5. HOUSEHOLDS WITH ACCESS TO WASTE REMOVAL
There was an increase in households that access municipal waste removal services since
1996. The percentage of households who has access to municipal waste removal services
increased from 75,8 percent in 1996 to 87,7 percent in 2011.
REMOVED BY LOCAL AUTHORITY AT LEAST ONCE A WEEK
REMOVED BY LOCAL AUTHORITY LESS OFTEN
COMMUNAL REFUSE DUMP
OWN REFUSE DUMP
NO RUBBISH DISPOSAL
OTHER
UNSPECIFIED
1996
75.8 4.5 2.0 14.3 1.5 0.0
1.7
2001
86.6 0.2 3.1 8.1 1.9 0.0
0.0
2011
87.7 0.8 4.7 4.3 1.1 1.3
0.0
Table 15: Refuse removal (source StatsSA)
The map below presents the increasing trend of households accessing municipal waste
removal services.
Flush toilet(connectedto sewerage
system)
Flush toilet(with septic
tank)
Chemicaltoilet
Pit toilet withventilation
(VIP)
Pit toiletwithout
ventilationBucket toilet Other None
2001 71.09 10.28 1.64 1.83 3.57 3.39 0.00 8.19
2011 75.61 8.40 0.23 3.55 8.07 0.75 0.86 2.54
0.00
10.00
20.00
30.00
40.00
50.00
60.00
70.00
80.00p
erc
en
tag
e
Households with access to sanitation

60
Figure 15: Household percentage with access to municipal waste removal services
Figure 16: Wards with households with no access to municipal waste removal services
Removed bylocal authorityat least once a
week
Removed bylocal authority
less often
Communalrefuse dump
Own refusedump
No rubbishdisposal
Other Unspecified
1996 75.8 4.5 2.0 14.3 1.5 0.0 1.7
2001 86.6 0.2 3.1 8.1 1.9 0.0 0.0
2011 87.7 0.8 4.7 4.3 1.1 1.3 0.0
0.0
10.0
20.0
30.0
40.0
50.0
60.0
70.0
80.0
90.0
100.0perc
enta
ge
Household access refuse removal

61
2.5. SOCIO-ECONOMIC DEVELOPMENT PROFILE
In this section, the focus is on the proximity of individuals to private and public amenities.
We therefore analyse the geography of service delivery in terms of access in cost and time.
There are development parameters that outlines the community characteristics and type of
service they require. With its growing population, Bitou is yet to get a public hospital and
the community of New Horizon is still without a police station or SAPS contact point.
The maps below illustrate the kind of public services enjoyed by each of the communities in
Bitou.
2.5.1. PUBLIC FACILITIES
A spatial location of public facilities by area.

62
2.5.1.1. KRANSHOEK (MAP)

63
2.5.1.2. WITTEDRIFT (MAP)

64
2.5.1.3. KURLAND
2.5.1.7. NEW HORIZONS

65
2.5.1.8. KWA-NOKUTHULA

66

Page | 67
2.5.2. EDUCATION
The Table below compares the educational attainment profile of Bitou’s population in
2001 and 2011. The percentage of individuals (aged 20+) that have not received any
schooling decreased from 7,3% to 2,4%.
The percentage of individuals (aged 20+) that attained Grade 12 increased from 24,5%
to 28,2%. The percentage of individuals (aged 20+) that have higher education
qualifications increased from 11,4% in 2001 to 12,1% in 2011. The overall observation
is that the level of educational attainment of Bitou residents has improved from 2001
to 2011.
1996 2001 2011
No schooling 1736 2357 1231
Some primary 4067 6971 10316
Complete primary 1408 2204 2897
Some secondary 4469 8117 15236
Grade 12/Std 10 2344 4807 9560
Higher 1275 2145 3913
Unspecified 1442 0 154
Not applicable 1684 2582 5855
Total 18427 29182 49162
Table 16: Education levels of individuals in the Bitou Area.(source StatsSA)
The graph below show a declining trend of people with no schooling since census 1996.
Figure 17: Percentage share of education levels in Bitou. (source StatsSA)
Noschooling
Someprimary
Completeprimary
Somesecondary
Grade12/Std 10
Higher UnspecifiedNot
applicable
1996 9.4 22.1 7.6 24.3 12.7 6.9 7.8 9.1
2001 8.1 23.9 7.6 27.8 16.5 7.4 0.0 8.8
2011 2.5 21.0 5.9 31.0 19.4 8.0 0.3 11.9
0.0
5.0
10.0
15.0
20.0
25.0
30.0
35.0
Perc
en
tag
e
Education levels

Page | 68
Our major concern is the percentage of children between the ages 7 and 16 years who are not
attending school.
LOCATION
AGE
Total 7 8 9 10 11 12 13 14 15 16
Bitou 4.4 2.1 4.2 3.7 5.2 4.4 5.7 6.1 9.8 11.9 5.8
Ward 1 2.5 2.7 2.5 2.4 2.5 0.0 2.7 5.3 9.0 17.0 4.9
Ward 2 0.0 0.0 0.0 0.0 0.0 0.0 3.5 0.0 7.6 1.9 1.5
Ward 3 0.0 0.0 4.1 5.7 10.0 0.0 5.4 4.6 7.8 15.1 4.9
Ward 4 8.7 2.7 5.2 5.6 4.9 12.4 14.7 6.6 13.1 14.5 8.8
Ward 5 2.9 7.5 3.8 4.3 9.7 3.3 7.7 0.0 9.0 21.6 6.8
Ward 6 0.0 0.0 0.0 0.0 5.1 0.0 8.7 12.8 5.5 11.4 3.8
Ward 7 8.4 3.2 7.0 4.1 7.7 5.2 4.3 8.3 10.5 11.5 6.9
Table 17: Percentage of children age between 7 and 16 years not attending school in Bitou per ward. (source StatsSA)
Bitou has the highest FET phase learner retention rate in the district and this rate
exceeds the provincial average.
Figure 18: FET retention rate, source; borrowed from DoE indaba 2 presentation (source DoE)
2.5.3. HEALTH
This section of the profile highlights current healthcare infrastructure and services in
the public health sector in Bitou. The table below shows the number of primary health
care (PHC) facilities available. The department is planning to build a district hospital
in 2025 and we would like them to revisit this date it is too far in the future.
Municipality Community Health Centre
Community Day Centre
Clinics Satellite Clinics
Mobile Clinics
District Hospitals
Regional Hospitals
Total
Bitou (2010)
0 1 3 1 1 0 0 7
50%
60%
70%
80%
Yr 2009-2011 Yr 2010-2012 Yr 2011-2013
Bitou
George
Hessequa

Page | 69
Bitou (2012)
0 1 4 1 1 0 0 7
Figure 19: Primary health care facilities in Bitou
Bitou have eight primary healthcare facilities, which includes four fixed clinics, one
mobile, two satellite clinics and one community day centre.
The table below indicates the disease burden per town.
Ra
nk Kannaland Hessequa Mossel Bay George
Oudtshoor
n Bitou Knysna Eden
1 Tuberculosis
(11.7%)
Ischaemic
heart disease
(12.6%)
HIV/AIDS
(14.2%)
HIV/AIDS
(14.6%)
Tuberculos
is (10.3%)
HIV/AIDS
(16.9%)
HIV/AIDS
(16.6%)
HIV/AIDS
(12.7%)
2 HIV/AIDS
(9.2%)
Road injuries
(6.9%)
Tuberculosis
(8.7%)
Tuberculosis
(9.2%)
HIV/AIDS
(8.9%)
Interpersonal
violence
(7.3%)
Interpersonal
violence
(8.7%)
Tuberculosis
(8.5%)
3
Interpersonal
violence
(7.2%)
Diabetes
mellitus
(6.9%)
Ischaemic
heart disease
(6.5%)
Interpersonal
violence
(8.3%)
Ischaemic
heart
disease
(7.9%)
Lower
respiratory
infections
(7%)
Cerebrovascul
ar disease
(7.7%)
Interpersonal
violence
(6.8%)
4 Road injuries
(6.8%)
Cerebrovascul
ar disease
(5.4%)
Cerebrovascul
ar disease
(5.3%)
Ischaemic
heart disease
(5.5%)
Cerebrovas
cular
disease
(7.3%)
Cerebrovascul
ar disease
(6.3%)
Tuberculosis
(6.5%)
Ischaemic
heart disease
(6.5%)

Page | 70
Ra
nk Kannaland Hessequa Mossel Bay George
Oudtshoor
n Bitou Knysna Eden
5 COPD (6.7%) Tuberculosis
(4.8%)
Interpersonal
violence
(5.1%)
Trachea/bronc
hi/lung (5.1%)
COPD
(6.2%)
Tuberculosis
(5.4%)
Road injuries
(6%)
Cerebrovascul
ar disease
(5.7%)
6
Ischaemic
heart disease
(6.7%)
Interpersonal
violence
(4.6%)
Diabetes
mellitus
(4.7%)
COPD (4.9%)
Interperson
al violence
(4.9%)
Road injuries
(4.7%)
Ischaemic
heart disease
(4.3%)
Road injuries
(4.7%)
7
Cerebrovascul
ar disease
(6.2%)
COPD (4.4%)
Lower
respiratory
infections
(4.2%)
Cerebrovascul
ar disease
(4.2%)
Road
injuries
(4.6%)
Trachea/bronc
hi/lung (4.5%) COPD (3.5%) COPD (4.4%)
8
Lower
respiratory
infections
(5.3%)
Trachea/bronc
hi/lung (4.2%)
Road injuries
(4.1%)
Diabetes
mellitus
(4.1%)
Diabetes
mellitus
(4.3%)
Ischaemic
heart disease
(4.4%)
Lower
respiratory
infections
(3.1%)
Trachea/bronc
hi/lung (4.2%)
9
Diabetes
mellitus
(3.7%)
Lower
respiratory
infections
(3.6%)
COPD (3.7%) Road injuries
(4%)
Lower
respiratory
infections
(3.6%)
Self-inflicted
injuries (4%)
Trachea/bronc
hi/lung (3%)
Lower
respiratory
infections
(4.2%)
10 Trachea/bronc
hi/lung (2.8%)
Self-inflicted
injuries (2.9%)
Trachea/bronc
hi/lung (3.7%)
Lower
respiratory
infections
(3.8%)
Hypertensi
ve heart
disease
(3.6%)
COPD (3.2%)
Fires, hot
substances
(2.9%)
Diabetes
mellitus
(4.1%)
Table 18: Eden burden of diseases in 2010, Source DoH indaba 2 presentation
2.5.4. SAFETY AND SECURITY
Two police stations (Plettenberg Bay and Kwa-Nokuthula) service the Bitou area.
Below is a table with top crimes taking place in Bitou.
Crime Category 2003/04 2004/05 2005/06 2006/07 2007/08 2008/09 2009/10 2010/11 2011/12
Murder 7 9 4 7 12 9 7 5 11
Sexual crimes 36 54 38 31 31 38 39 41 41
Burglary at
residential
premises
127 130 80 86 71 84 116 207 166
Drug related
crime
236 227 215 197 215 200 226 184 138
Driving under
the influence
alcohol/drugs
19 48 50 35 39 45 32 67 51
Table 19: Crime levels in Bitou
The following table below show different crimes against a person since 2008 to 2012:
Crime Category 2008 2009 2010 2011 2012 TOTAL
CONTACT CRIMES (CRIMES AGAINST A PERSON)
Murder 3 8 7 8 5 31
Total Sexual Crimes 52 21 47 42 40 202
Attempted murder 3 1 2 5 8 19
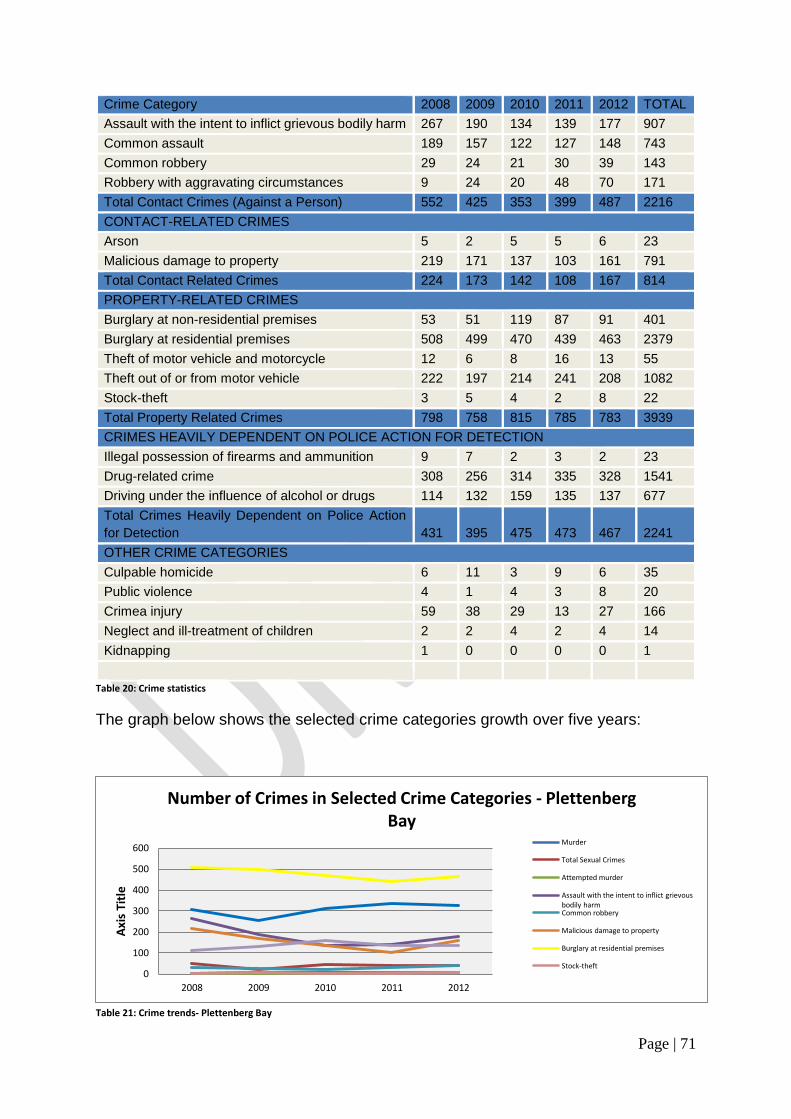
Page | 71
Crime Category 2008 2009 2010 2011 2012 TOTAL
Assault with the intent to inflict grievous bodily harm 267 190 134 139 177 907
Common assault 189 157 122 127 148 743
Common robbery 29 24 21 30 39 143
Robbery with aggravating circumstances 9 24 20 48 70 171
Total Contact Crimes (Against a Person) 552 425 353 399 487 2216
CONTACT-RELATED CRIMES
Arson 5 2 5 5 6 23
Malicious damage to property 219 171 137 103 161 791
Total Contact Related Crimes 224 173 142 108 167 814
PROPERTY-RELATED CRIMES
Burglary at non-residential premises 53 51 119 87 91 401
Burglary at residential premises 508 499 470 439 463 2379
Theft of motor vehicle and motorcycle 12 6 8 16 13 55
Theft out of or from motor vehicle 222 197 214 241 208 1082
Stock-theft 3 5 4 2 8 22
Total Property Related Crimes 798 758 815 785 783 3939
CRIMES HEAVILY DEPENDENT ON POLICE ACTION FOR DETECTION
Illegal possession of firearms and ammunition 9 7 2 3 2 23
Drug-related crime 308 256 314 335 328 1541
Driving under the influence of alcohol or drugs 114 132 159 135 137 677
Total Crimes Heavily Dependent on Police Action
for Detection 431 395 475 473 467 2241
OTHER CRIME CATEGORIES
Culpable homicide 6 11 3 9 6 35
Public violence 4 1 4 3 8 20
Crimea injury 59 38 29 13 27 166
Neglect and ill-treatment of children 2 2 4 2 4 14
Kidnapping 1 0 0 0 0 1
Table 20: Crime statistics
The graph below shows the selected crime categories growth over five years:
Table 21: Crime trends- Plettenberg Bay
0
100
200
300
400
500
600
2008 2009 2010 2011 2012
Axi
s Ti
tle
Number of Crimes in Selected Crime Categories - Plettenberg Bay
Murder
Total Sexual Crimes
Attempted murder
Assault with the intent to inflict grievous bodily harmCommon robbery
Malicious damage to property
Burglary at residential premises
Stock-theft

Page | 72
2.5.5. SOCIAL GRANTS
The social security system is one of government’s initiatives to address poverty,
inequality and unemployment in the country. This system has two main objectives:
a. To reduce poverty amongst the groups of people who are not expected to
participate in the labour market and these include the elderly, those with
disabilities and children; and
b. To increase governments investment in health, education and nutrition.
There are five major social security grants in South Africa and payment of each grant
is dependent on an income-based means test. The grants are implemented and
administered by the South African Social Security Agency (SASSA). The next chart
provides a statistical summary of the distribution of social grants in the Western Cape.
Figure 20: Status of social grants in the province January 2013.
2.5.6. HUMAN DEVELOPMENT INDEX
The Human Development Index (HDI) is a composite, relative index that attempts to
quantify the extent of human development of a community. It is based on measures of
life expectancy, literacy and income. It is seen as a measure of people’s ability to live
a long and healthy life, to communicate, to participate in the life of the community and
to have sufficient resources to obtain a decent living.
20%
12%
2%
1%
65%
Old Age
Disability
Foster Care
Care Dependency
Child Support
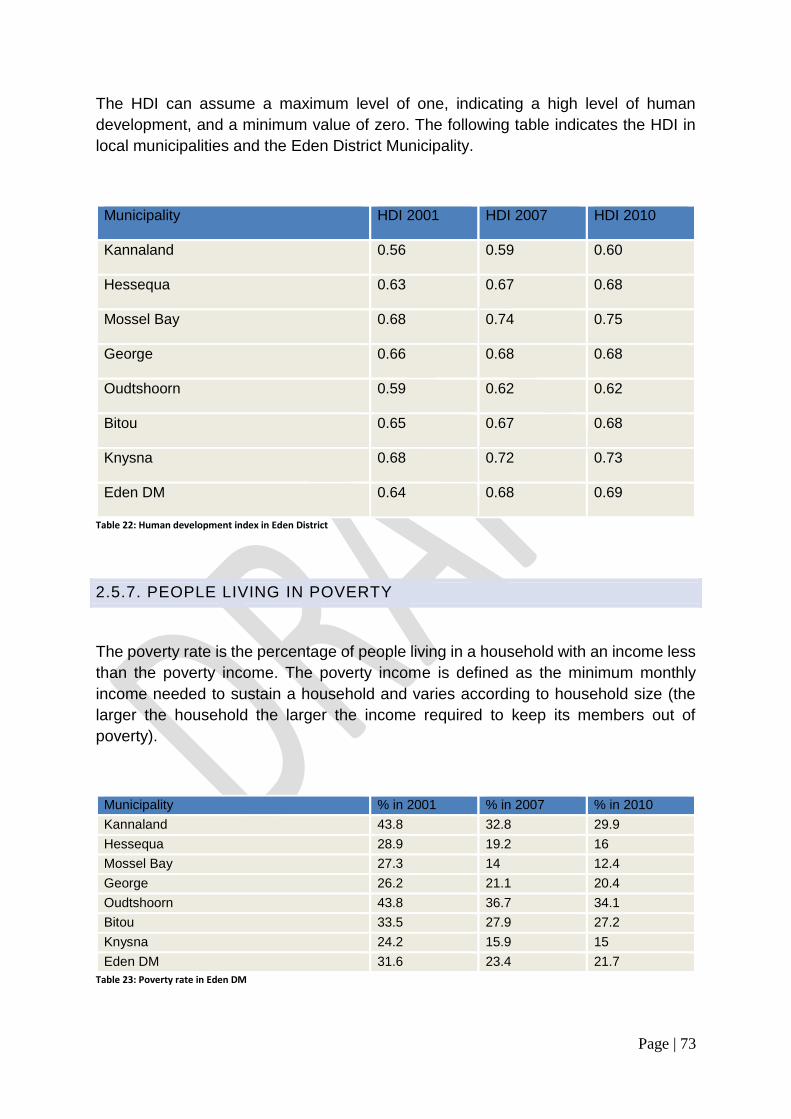
Page | 73
The HDI can assume a maximum level of one, indicating a high level of human
development, and a minimum value of zero. The following table indicates the HDI in
local municipalities and the Eden District Municipality.
Municipality HDI 2001 HDI 2007 HDI 2010
Kannaland 0.56 0.59 0.60
Hessequa 0.63 0.67 0.68
Mossel Bay 0.68 0.74 0.75
George 0.66 0.68 0.68
Oudtshoorn 0.59 0.62 0.62
Bitou 0.65 0.67 0.68
Knysna 0.68 0.72 0.73
Eden DM 0.64 0.68 0.69
Table 22: Human development index in Eden District
2.5.7. PEOPLE LIVING IN POVERTY
The poverty rate is the percentage of people living in a household with an income less
than the poverty income. The poverty income is defined as the minimum monthly
income needed to sustain a household and varies according to household size (the
larger the household the larger the income required to keep its members out of
poverty).
Municipality % in 2001 % in 2007 % in 2010
Kannaland 43.8 32.8 29.9
Hessequa 28.9 19.2 16
Mossel Bay 27.3 14 12.4
George 26.2 21.1 20.4
Oudtshoorn 43.8 36.7 34.1
Bitou 33.5 27.9 27.2
Knysna 24.2 15.9 15
Eden DM 31.6 23.4 21.7
Table 23: Poverty rate in Eden DM

Page | 74
The proportion of people living in poverty in the Eden District has declined sharply
between 2001 and 2007. The estimated number of people living in poverty in the
district was ± 120 203 people in 2010. The proportion of people living in poverty in
Bitou has declined steadily from 33,5% to 27,2% in 2010.
2.5.8. GINI COEFFICIENT
The Gini coefficient is a summary statistic of income inequality, which varies from 0,
in the case of perfect equality where all households earn equal income, to 1 (in the
case where one household earns all the income and other household earns nothing).
In practice the coefficient is likely to vary from approximately 0,25 to 0,70. The national
figure is 0,7.
Municipality 2001 2007 2010
Kannaland 0.59 0.60 0.57
Hessequa 0.56 0.54 0.51
Mossel Bay 0.58 0.56 0.52
George 0.58 0.58 0.56
Oudtshoorn 0.59 0.59 0.57
Bitou 0.61 0.64 0.62
Knysna 0.58 0.58 0.55
Eden DM 0.59 0.59 0.56
Table 24: Gini Coefficient in Eden DM
In general income inequality is common across the Eden District but showed steady
decline in the past decade. In Bitou, the Gini coefficient increased from 0,61 in 2001
to 0,64 in 2007, but declined from 0,64 in 2007 to 0,62 in 2010. We still waiting for new
figures.
2.6. DEVELOPMENT ECONOMICS
2.6.1. Labour force
2.6.1.1. EMPLOYMENT STATUS
In 2011 nearly 34% of Bitou’s population were employed, 14% indicated they were
unemployed, 17% were not active economically and 3% were discouraged work-
seekers.

Page | 75
Figure 21: Employment status in Bitou (source StatsSA)
The official unemployment rate in Bitou Municipality is 30,1% according to Census
data, the highest of the seven local municipalities in the Eden district. The
unemployment rate increased by 3,8% from 2001 to 2011. The percentage increase
is also the highest in the district.
LABOUR MARKET
UNEMPLOYMENT RATE % YOUTH UNEMPLOYMENT RATE % 2001 2011 2001 2011 26,3 30,1 33,4 37,9
Table 25: The official unemployment rate in Bitou. (source StatsSA)
Unemployment is concentrated amongst the youth (15 - 34 years), the youth accounts
for 37,9% of the unemployed in 2011.
Year 15 - 19
Year 20 - 24
Year 25 - 29
Year 30 - 34
Year 35 - 39
Year 40 - 44
Year 45 - 49
Year 50 –54
Year 55 - 59
Year 0 - 65
Grand Total
Unemployed
735 1 455 1 322 1 004 890 645 495 335 169 57 7 107
Percentage (%)
10.4%
20.5%
18.6%
14.1%
12.5%
9.1% 7% 4.7% 2.4% 0.8%
100%
Table 26: Unemployment age cohort. (source StatsSA)
The graph below gives a schematic representation on the unemployment per age cohort as in 2011.
34%
14%
3%
17%
32%Employed
Unemployed
Discouraged work-seeker
Other not economically active
Not applicable

Page | 76
Figure 22: Unemployment per age cohort (source StatsSA)
2.6.1.2. EMPLOYMENT BY SECTOR
The sector that employed the largest proportion of people in the municipal area in 2007
was ‘wholesale and retail trade’ with 20,5%, this was followed by construction with
17,3%. The table below provides an overview of employment by sector per
Municipality in the district.
SECTOR EDEN
DM
KANN
ALAN
D
HESS
EQUA
MOSS
EL
BAY
GEOR
GE
OUDT
SHOO
RN
BITOU KNYS
NA
Wholesale and retail
trade 15.5 8.8 10.7 14.9 15.5 14 20.5 20.4
Unspecified 12.1 8.3 17.9 14.4 11.1 8 12.6 11.2
Transport, storage
and communication 2.7 1 2 1.8 4.5 2.7 1.8 2.4
Other & not
adequately defined 9.3 5.3 6.6 7.3 11.9 9.1 13.1 8.6
Mining and quarrying 0.3 0.3 0 0.1 0.5 0.2 0.1 0.7
Manufacturing 11.8 13.6 10.5 11.8 12.1 12 10 12.3
Finance, insurance,
real estate and
business services
7.8 4.8 6.3 9.2 8.5 6.4 7.5 7.7
Electricity, gas and
water 0.7 0.7 0.6 1.2 0.5 0.5 0.4 0.8
Construction 13.8 7.7 11.2 17.2 13.5 9.2 17.3 15.4
Community, social
and personal
services
15 12.1 14 14.4 15.5 24.5 9.7 12.3
Agriculture, hunting,
forestry & fishing 10.8 37.4 20.2 7.5 6.4 13.3 7 8.2
Table 27: Employment by economic sector
0200400600800
1000120014001600
15
- 1
9
20
- 2
4
25
- 2
9
30
- 3
4
35
- 3
9
40
- 4
4
45
- 4
9
50
- 5
4
55
- 5
9
60
- 6
4
Unemployment

Page | 77
CHAPTER 3: COMMUNITY DEVELOPMENT (WARD PLANNING)
Bitou Municipality is divided into seven wards and each ward has a functional ward
committee that meet quarterly to discuss development progress and service delivery
issues of the ward. After conducting a desktop analysis. A comprehensive community
participation process was conducted and a list of priorities were submitted.
Some of the community priorities fall outside of the scope of municipality and therefore
municipalities rely on other spheres of government to address them.
Ward Councillors and Ward Committees were responsible for updating or reprioritising
their ward issues in consultation with their constituencies.
Here is a comprehensive list of Ward issues as revised in 2015 by Ward Committees
and Ward Councillor.

Page | 78

Page | 79
WARD 1 – IDP Priorities
ISSUE No DESCRIPTION LOCATION 2014/2015 2015/2016 2016/2017
ELECTRICITY
1. High mast lights
Dam area in
Green Valley
Two high mast lights are
installed and the street
lighting is still under
investigation.
2.
Street lighting
3.
Monitoring and maintenance of all
substations and consumer
cubicles to prevent electricity
outages as experienced in 2013. Natures Valley
The Electrical manager
had already checked all
substations and they will
commence as soon SCM
stores have the items or
tender out the products.
WATER
4. Water reservoir
Natures Valley
The installation of the
Ozone generators and
automation of the diesel
standby plant is in process
and the project is almost
done.
5. New water pipeline(current
pressure too low)
6.
Ozone water treatment plant
SANITATION 7.
Improve sewerage system Green Valley
None of the projects have
commence due to budget
constraints. There was no
funding for the projects
Provide toilet facilities at the dam
area
Natures Valley
New sewage system (an EIA was
done ±5 years ago)
Public toilets at the entrance Green Valley
HOUSING
8.
Move outside toilets into
dwellings.
Kurland
Application will be made
under the rectification
programme to reconstruct
toilets to the dwellings.
Application for
325 civil services
and purchase of
college land
portion 28 of the
Application for
325 top structure
9. Build more houses
Kurland & Green Valley

Page | 80
10.
Renovate old houses Kurland & Green Valley Applications are being
drafted plus or minus 110
houses by clinic and
purchase of land.
farm Wittedrift
306 (18.75Ha).
Rectification of
certain houses
(EHP)
WASTE REMOVAL
11. Need central point in CBD for
recycling collection.
Wittedrift
In process – bins has been
procured already
Environmental process to
obtain waste license. Part
of drop-off application
currently with
environmental affairs
Wheelie bins has already
been delivered to Natures
Valley.
The LED section is
currently busy planning a
recycling project with
Kurland bricks.
12.
Garden waste drop off facility
required because people do not
have the means to transport
garden waste to the landfill site.
Natures Valley
13.
Wheelie bins will be
delivered to Natures Valley
Natures Valley
14.
Recycling Organic waste drop-off
facility (Covie residents are willing
to process this waste)
Keurbooms
PARKS AND REACTION AND
SPORT
15. Upgrade and maintenance of
sport fields.
Kurland & Green Valley
Attention will be given
within the availability of
budget.
This will be attended to by
Park & Recreation
Department within
availability of budget.
16.
Beautification of the CBD Park
and planting trees next to access
road.
Wittedrift & Green
Valley
17. Increase cemetery
Green Valley
ROADS
18.
Tarring of Rotterdam and
Kammassie
Streets.
Green Valley
Under Roads and Storms
Water there are no funds.
There is R 1 million for the
department, which would
not be able to cater all the
projects. The available
budget will only cover
potholes and patching.
19.
Update Road marking and
signage.
Green Valley
20. Maintenance of roads
(potholes)
Kurland & Green Valley

Page | 81
21. Construction of speed humps Kurland & Green Valley
22.
Proposed parking facilities
opposite
butchery
Wittedrift
Green Valley
23. Upgrade road to clinic Kurland
24. Cycling path way from N2 to
Wadrift
Wittedrift
25.
Provide proper street names in
Kurland to avoid confusion and
delays during emergencies
because some streets have
two names.
Kurland
26. Increase and upgrade
parking at Keurbooms Beach Keurbooms
27. Maintenance of walk way
SKILLS DEVELOPMENT 28.
Development of SMME’s and
implement skills development
programmes
Kurland & Green Valley
HEALTH 29.
There is a need for a permanent
doctor at the clinic
Storage facility for medication
and medical equipment is
required
Kurland & Green Valley
Kurland
SAFETY 30.
Establishment of a satellite
police station
Establishment of a satellite fire
station
Kurland & Green Valley
Green Valley
Discussion with the South
African Police Services
(SAPS) has taken place
and they are aware of the
community’s needs but the
project would not
commence anytime soon.
VODACOM TOWER 31.
There is an enquiry about the
lease payment by Vodacom to
Covie community
Covie

Page | 82
EDUCATION 32. Construction of a new primary
school Green Valley

Page | 83

Page | 84
WARD 2 PRIORITIES
ISSUE No. DESCRIPTION 2014/215 2015/2016 2016/2017
ELECTRICITY
1. Streets lights along Odlands Drive and Longships Drive
NIL R 300 000 R 500 000
2. Streets lights and pedestrian walkway extended along bottom section along Beacon way
NIL R 200 000 R 500 000
3. Replace electrical substation at corner of Dorothea street and Beacon Way
NIL (funding – CRR) NIL NIL
4. Put solar geysers on each house in RDP area
NIL NIL NIL
WATER 5. Replacement of old asbestos / cement water reticulation pipes
6. Give rain water tanks for each house in the RDP area
ECONOMIC DEVELOPMENT
7. Make development more accessible and expedite applications
8. Replacing timer constructed building on Central Beach (Moby Dicks)
9. Residential multi-level development on municipal erven 2317 and 2070 (like santini)
10. Support to tourism board
11. Upgrading of airport facilities
12. Tarring of Robberg Road extension from airport towards N2
13. Speedy development of Checkers Shopping mall in Beacon Way opposite Market Square
14. New Sentech mast for digital TV reception
15. Telkom LTE internet with fast data speed to be introduced for computers and to be used in schools
16. Development of Wine Route (see tourism plan for detail)

Page | 85
WARD 2 PRIORITIES
ISSUE No. DESCRIPTION 2014/215 2015/2016 2016/2017
17. New industrial township between Kwa-Nokuthula and N2 route to replace overcrowded existing Plett Industrial Area
18. Suggested small tourism office at Signal Hill to promote Plett to tourist
19. Upgrade of Taxi Rank in town
20. Formal shops for traders near Taxi Rank to replace temporary hawker tables
INSTITUTIONAL DEVELOPMENT
21. Centralize municipal offices to minimize rent
22. Move tourism office from Melville corner to main street
23. Collect all outstanding debt from rate payers
24. Urgent appointment of professional registered engineer
25. Improve communication with all governmental bodies to obtain counter funding for projects
26. Quality improvement of SDF and IDP to complete budget process
27. Make municipal projects more transparent to public (formalized communications)
WASTE REMOVAL 28. Keep Plett clean at all times to promote tourism
29. Removal of waste and recycling bags needs fine tuning and standard times of collection
30. Garden waste shredding machine needs attention
Garden waste will be composed at refuse transfer station.
R 1 500 000 NIL
31. Full closure of landfill site License application received but cannot start until transfer station is completed.

Page | 86
WARD 2 PRIORITIES
ISSUE No. DESCRIPTION 2014/215 2015/2016 2016/2017
32. Organic waste and recycling bins facilities to be operational within ward 2
33. Steel cages must be fitted over waste collecting bins in rural areas
PARKS, RECREATION, ENVIRONMENT AND SPORTS
34. Cementry
35. Upgrading of parks, access and bathrooms on beaches
36. Alien clearing( all areas in ward 2 and also along the Keurbooms and Bitou rivers)
37. Heated swimming pool to encourage people to learn to surf
38. Implement the Keurbooms River Catchment Management Plan
39. Wood pole fences in parks must be either removed or keep in good condition
ROADS 40. Fix street signs for Anthonv Street, Roche Bonne and Longships intersection
NIL NIL NIL
41. Establish parking and shuttles down to Lookout Beach for season
Community Service
42. Extension termac surface of Robberg Road to link up with N2
NIL NIL NIL
43. Cycling routes NIL NIL NIL
44. Road replacement of lower Beacon Way NIL NIL NIL
45. Parking area at Lookout Beach for season NIL NIL R 500 000
46. Improvement of Beacon Way and N2, with taxi facility and ablutions
NIL NIL NIL

Page | 87
WARD 2 PRIORITIES
ISSUE No. DESCRIPTION 2014/215 2015/2016 2016/2017
47. Pedestrian walk way along N2 between Marine and Beacon way
NIL NIL NIL
48. Maintain minimum flow in Keurboms River after Bitou Municipal water extraction
49. Replace old asbestos water pipes in old part of ward 2
50. Construct information board highlighting attractions
SAFETY 51. Safety and security
52. Employ or improve security at Poortjies Beach
53. More security cameras to be installed
54. Upgrading of security fence at end of Bowtie Drive
EDUCATION 55. Development of schools/university
56. School next to rugby field in Plett South
57. Complete study made of all schools and acceptable education levels must be maintained

Page | 88

Page | 89
WARD 3 PRIORITIES
ISSUE No. DESCRIPTION 2014/215 2015/2016 2016/2017
ELECTRICITY
58. Reduce or eradicate the illegal electricity connections
Underway
59. Erect a high mast light in Pola Park Completed
60. Fix electrical cables in the Cuba area
WATER 61. There is need more water taps and toilet facilities
Part of Civil Phase 3
ECONOMIC DEVELOPMENT
62. Support LED projects:
Waste recycling
Open air amphitheater
Tourism route
Craft shop at the drop-off facility close to the N2
63. Provide land for food gardens and agriculture
64. Pave parking at Beehive units in Bossiesgif
65. Land for live stock
66. Construct a business park for SMME’s
WASTE REMOVAL 67. Prevent illegal dumping and give resident additional refuse bags
Done R 1 500 000 NIL
PARKS, RECREATION, ENVIRONMENTAL MANAGEMENT AN SPORTS
68. Tree felling and bush clearing on the valley between Pine Trees/Gaatjie, Qolweni, Bossiesgif and Pola Park
69. Support the rocks that are falling in the Pola Park
ROADS 70. Construction an access road from Bossiesgif to Pola Park
NIL NIL R 500 000
71. Construct speed humps in Pola Park and road below Robberg Fisheries
NIL NIL NIL
72. Upgrade of access roads to Qolweni Under construction
SAFETY, DISASTER MANAGEMENT
73. Satellite Police Station
74. Establish a satellite fire station

Page | 90
AND SOCIAL SECURITY
75. Social grants services
76. Extension of present clinic
77. Provide more housing opportunities Construction of 100 H.D units- Qolweni
Construction of 150 H.D units – Qolweni
Construction of 158 H.D units - Qolweni
EDUCATION 78. Construction of a school at the Bossiesgif/Qolweni area
79. Provide scholar transport

Page | 91

Page | 92
WARD 4 PRIORITIES
ISSUE No. DESCRIPTION 2014/215 2015/2016 2016/2017
ELECTRICITY
1. Erect high mast lights and streets lights
2. Provide for a 24 hour electricity kiosk
HOUSING 3. Provide housing
4. Upgrade old municipal houses
E.H.P New Horizon purchase of Land (portion 20 of 437)
Construction of civil services
WASTE REMOVAL 5. Construct the waste transfer station
Tender currently at BAC level, proposed starting date January 2015.
In process
6. Illegal dumping and refuse removal
In process of appointing contractor for cleaning of residential areas plus grass cutting
R 1 500 000 NIL
SANITATION 7. Move outside toilets at the old houses into the house
WATER 8. Water pressure need to be increased
PARKS AND RECREATION AND SPORTS
9. Upgrading & maintenance of sports field
The sport field will be upgraded within available budget
NIL NIL
10. Indoors sports facility NIL NIL
11. Play park with visible signage
12. Clearing of alien vegetation
13. Convert community hall into multi-purpose centre
NIL NIL
14. Upgrading of cemetery Cemetery investigation by Department of Strategic Services.
ROADS AND STORMWATER DRAINAGE
15. Upgrade storm water drainage system
16. Upgrading of taxi rank
17. Construct more sidewalks NIL NIL
18. Streets names on kerbside NIL NIL
19. Convert drifts into speed humps
NIL NIL

Page | 93
SKILLS DEVELOPMENT
20. Economic revitalization of area
HEALTH 21. Drug rehabilitation centre
22. Upgrading of clinic Complete
SAFETY 23. Satellite Police Station
24. Control of dogs/cows
EDUCATION 25. Implement a school safety plan for Plett Secondary School in particular
The department of education committed to implement plan by the first quarter of 2015

Page | 94

Page | 95

Page | 96
WARD 5 & 6 PRIORITIES
ISSUE No. DESCRIPTION 2014/215 2015/2016 2016/2017
ELECTRICITY
1. Street lighting especially in the new areas
High mast light was installed & street lighting is ongoing
Completed NIL
2. Upgrading the electrical network to prevent outages.
Appointed consultants to do planning work. Implementation will commence as soon as constructor is appointed
R 1 150 000 R 150 000
HOUSING 3. Housing development should speed up.
Ongoing currently building 226 units Construction of 126 top structure
Application for 441 civil services
WASTE REMOVAL 4. Clearing of illegal dump site Ongoing the tender is out In progress
5. Educating communities to prevent illegal dumping
Ongoing
6. Clearing of waste from water channels
Ongoing
SANITATION 7. Upgrade the sewerage network to prevent spilling or bursting sewerage pipes.
Budget constraints NIL
PARKS AND RECREATION AND SPORTS
8. Construction of a central theme park for the whole family. Upgrade of Simunye Community Hall
Planning phase – budget constraints Budget constraints
ROADS AND STORMWATER DRAINAGE
9. Opening of a second entrance into Kwa-Nokuthula from N2
Planning will form part of MIG application with the Kwa-Nokuthula development
NIL R 5000 000
10. Construction of a pedestrian bridge to link Kwa-Nokuthula with New Horizon to prevent people crossing the N2 by foot.
Budget constraints. Engaging with provincial road agency for possible funding.
NIL NIL
11. Update Road Marking and signage
Ongoing with budget availability Ongoing with budget availability
Ongoing with budget availability
12. Maintenance of roads (potholes)
Ongoing with budget availability Ongoing with budget availability
Ongoing with budget availability
13. Construction of speed humps
Budget constraints, in planning & will be implemented with available funding.

Page | 97
14. Construction of sidewalks in all major roads to prevent accidents involving pedestrians.
Application forwarded to province based on IDP projects. Will await outcomes of approvals.
15. Improve the storm water drainage to prevent flooding of rainwater.
Process of appointing consultants for a stormwater master plan for all areas. Project implementation will depend on budget availability.
16. Clearing of weeds and waste at the water channel at Skhosana street
Ongoing as part of maintenance.
SKILLS DEVELOPMENT
17. Development of SMME’s and implement skills development programmes
Lack of skills and funding
18. Revival of the Mbokotho bricks making project at Sishuba Street
Site will be used for something else
19. Upgrading of South Cape Collage (facility and curriculum)
Plans are underway to upgrade College in 2015
20. Construction of a primary school to relieve overcrowding at Phakamisani.
Under Construction
21. Upgrading of Simunye Centre
Funding constraints
HEALTH 22. Old age home Will never happen
23. Establishment of a Soup kitchen at the old clinic
Under investigation
24. Establishment of an HIV/AIDS Centre at the old clinic
SAFETY 25. Crime prevention and schools safety projects
Department of education will take the lead
26. Establishment of a satellite firefighting services or park fire truck at police station for rapid response
Planning phase. Implementation form time to time.

Page | 98
27. Road safety programmes and more speed pumps
EDUCATION 28. Construction of a new primary school
Construction underway 33000000.00

Page | 99

Page | 100
WARD 7 PRIORITIES
ISSUE No. DESCRIPTION LOCATION 2014/2015 2015/2016 2016/2017
ELECTRICITY
1. Electrification of
streets and
houses
Kranshoek
and
Harkerville
Budget constraints.
Will proceed with
availability of funds.
R 1 312 281 R 315 789
2. Street lighting
WATER 3. Provision of
drinking water
Harkerville At planning stage
with department of
Strategic Services
NIL NIL
SANITATION 4. Provision of
sanitation
Harkerville At planning stage
with department of
Strategic Services
NIL NIL
LAND AND
HOUSING
5. Construction of
houses
Kranshoek Completed 447
units
NIL NIL
6. Land required for
houses and for
churches
7. Development at
the dam area
Planning stage
WASTE
REMOVAL
8. Removal of
illegal dump sites
Kranshoek Ongoing tender is
out
R 1 500 000 NIL
PARKS AND
RECREATION
AND SPORTS
9. Upgrading of
sport facilities
and
establishment of
an indoor facility
at the multi-
purpose centre
Kranshoek Planning phase NIL NIL
ROADS AND
STORMWATER
DRAINAGE
10. Upgrade and
tarring of streets
Kranshoek Planning – in the
process of
appointing
consultants to do
designs for all
untarred roads.
Implementation will
depend on
availability of funds.
Part of MIG
application
NIL NIL
11. Construction of
speed humps
and sidewalks
NIL NIL
12. Construction of
taxi rank
R 250 000 NIL
13. Upgrading of
storm water
drainage system
R 232 000 R 1 389 205
SKILLS
DEVELOPMENT
14. Construction of
primary school
Split VD Kwa-
Nokuthula
15. Education for the
audio impaired
16. Establishment of
a pre-school
17 Provide basic
adult education
HEALTH 18. Stray animal
control
Kranshoek Ongoing
SAFETY 19. Need more
police visibility
Kranshoek

Page | 101
WARD 7 PRIORITIES
ISSUE No. DESCRIPTION LOCATION 2014/2015 2015/2016 2016/2017
ECONOMIC
DEVELOPMENT
20. Establishment of
a fuel station
Kranshoek
21. Construction of a
mini mall
22. Construction of a
light industrial
park
23. Establishment of
a tourism village
24. Establishment of
a flight school at
the airport
25. Alien vegetation
clearing
26. Construction of
community hall
27. Construction of a
place of safety
for the abused
women and
children
28. Job creation with
SANPARKS
Establishment of
an agricultural
village for stack
farming
Harkeville,
the
department
of
Agriculture is
on board
EDUCATION 29. Construction of a
primary and high
school
Kranshoek
Ward Plans were created for Wards 1, 3 and 4 with the help of the public participation unit of
Provincial DLG.

Page | 102
CHAPTER 4: IN-DEPTH ANALYSIS
Integrated Development Planning is a strategic management tool to realize the developmental
role of local government. Performance management, on the other hand, it is a management
tool to facilitate the implementation of the IDP, and as such forms an integral part of the IDP.
The budget attaches money to the IDP objectives and this is monitored through the service
delivery and budget implementation plan (SDBIP).
4.1 INSTITUTIONAL ANALYSIS
The following section focuses on the factors contributing to the sustainability of the Municipality
ranging from continuity of the prevailing political environment and the internal capacity of the
Municipality, particularly in relation to personnel and the systems used within the Municipality.
4.1.1 POLITICAL LEADERSHIP
The council performs both legislative and executive functions. They focus on legislative,
oversight and participatory roles, and have delegated its executive function to the Executive
Mayor and the Mayoral Committee. Their primary role is to debate issues publicly and to
facilitate political debate and discussion. Apart from their functions as decision makers,
Councillors are also actively involved in community work and the various social programmes
in the municipal area.
4.1.2. ADMINISTRATIVE LEADERSHIP
The Municipal Manager is the Accounting Officer of the Municipality. He is the head of the
administration, and primarily has to serve as chief custodian of service delivery and
implementation of political priorities. He is assisted by his direct reports, which constitute the
Management Team (5 Section 56 Directors), whose structure is outlined in the table below:

Page | 103
Figure 23: Bitou Municipality approved macro structure
The departmental functions of the macro organizational structure above are as follows:
DIRECTORATE SUB DIRECTORATE CORE FUNCTION
Office of the
Municipal
Manager
I. Internal Auditing
Internal Auditing
Risk Management
II. Office of the political office
bearers
Close protection
EPWP
Youth and Sport
Development
Special Programmes
Provides support to the
Speakers office
The Municipal Manager is generally the Accounting
Officer of the Municipality.
Provides strategic leadership
Supports the office of the Political Office bearers
Manages all heads of departments reports
Internal Auditing
Risk Management
Financial
Services
Budget and Financial Reporting
Revenue Services
Expenditure
Supply Chain Management
Information Technology
The HOD in this department is the Chief Financial
Officer for the Municipality
Manage and control the implementation of the budget policies, systems and procedures and financial statements processes to ensure legislative compliance and sound financial management practices.
Financial reporting
Implement and maintain revenue and credit control policies and procedures to
Sound revenue management practices and compliance.
Ensure the recording, authorization and proper execution of expenditure systems, procedures and transactions.
Municipal Manager
Allen Paulse
Head Financial Services
Mr. F Lotter
Head Corporate Services
Mr R Smit
Head Engineering Services
Ms P Nqgumshe
Head: Community Services
Mr. M Stratu
Head Strategic Services
Vacant
Internal Audit and Risk Management
T Loliwe

Page | 104
DIRECTORATE SUB DIRECTORATE CORE FUNCTION
Manage supply chain management services to ensure appropriate systems, procedures and control for demand, acquisition, logistics, assets and disposal management.
Manage and maintain the municipal information technologies
Corporate
Services
i. Administration
Committee and
Administration Services
Registry services
ii. Human Resources
Occupational Health and
Safety
Skills Development
Labour Relations
iii. Communication
Public Participation
Ward Committees
Customer Care Services
iv. Legal Services
Corporate Services is the secretariat of Council and supports the legislative and executive functions of Council;
It is also responsible for cultivating a culture of good governance and administration and to ensure administrative processes take place in an environment which promotes productivity; and lastly
It renders legal services to council and administration.
Ensures the wellness of the municipal workforce
Ensures continues up skilling of the municipal employees to keep-up with new developments and latest innovations for effective and efficient service delivery.
Strategic
Services
IDP/PMS/SDBIP
Building Control;
LED/Tourism
Town Planning
Property Management
Environmental Management
Planning and Project
Management
Ensure the provisioning of effective land use management, spatial planning and regulation of building control activities and services.
Plan, develop and implement a coherent and integrated framework for local economic development.
Render project planning, design and project/program management services to the Municipality in execution of the IDP and development strategies.
Develop, implement and maintain GIS.
Responsible for Municipal reporting
Manage property assets and maintain property asset register.
Community
Services
Human Settlement & Housing, Parks and Recreation, Sport and Public Facilities Management
Waste Management
Public Safety
Library and Information Services
Provide human settlement and housing administration services.
Manage and regulate the rendering of solid waste management services to ensure a clean and healthy environment.
Manage the provision of protection services to the people of Bitou.
Provide and maintain parks and recreation facilities.
Provide library and information services to the Municipality’s communities.

Page | 105
DIRECTORATE SUB DIRECTORATE CORE FUNCTION
Engineering
Services
Roads & Fleet Maintenance
Water Services
Project Facilitation
Electrical and Mechanical Engineering
Manage the provisioning and maintenance of roads, municipal buildings and vehicle fleet.
Manage the provisioning and maintenance of water and wastewater services.
Manage the provisioning and maintenance of electrical distribution networks and mechanical equipment.
Manage and ensure compliance to applicable legislation, policies and guidelines.
Table 28: Departmental functions
4.1.3 STAFF COMPLEMENT
The Bitou Municipality’s senior management team is supported by a workforce of 479
personnel. From the 479 positions 465 are permanent and 14 are temporary positions. The
total funded positions on the municipal organogram are 607. The plan is to fill all funded vacant
positions during this revised IDP (2014/2015) cycle.
Below is a table indicating the current number of employees at Bitou Municipality, by race
within a specific occupational category (including Councillors):
OCCUPATIONAL LEVELS
MALE
FEMALE
TOTAL
A
C
I
W
A
C
I
W
Top
management
1
2
0
1
1
0
0
0
5
Senior management
0
1
0
5
0
0
0
0
6
Professionally qualified
and experienced
specialists and mid-
management
6
5
1
2
1
3
0
1
19
Skilled technical and
academically qualified
workers, junior
management,
supervisors, foremen, and
superintendents
19
23
1
16
9
11
0
2
81
Semi- skilled and
discretionary decision
making
59
37
0
5
52
37
0
3
193
Unskilled and defined
decision making
77
51
0
0
21
12
0
0
161
TOTAL PERMANENT
162
119
2
29
84
63
0
6
465
Temporary employees
1
3
0
1
4
5
0
0
14
GRAND TOTAL
1163
122
2
30
88
68
0
6
479
Table 29: Occupational categories

Page | 106
4.1.4. EMPLOYMENT EQUITY AND TARGETS
The Employment Equity Act (1998) Chapter 3, Section 15 (1) states that affirmative action
measures are measures designed to ensure that suitable qualified people from designated
groups have equal employment opportunities and are equitably represented in all occupational
categories and levels in the workforce of a designated employer.
The table below represents the employment equity targets for the 2014/2015 financial year

Page | 107
Table 30: Employment equity targets by occupation level
OCCUPATIONAL LEVEL AFRICAN COLOURED INDIAN WHITE DISABLED TOTAL AFRICAN COLOURED INDIAN WHITE
DISABLED
TOTAL
Economically Active Profile
(Province) 15% 24% 0.7% 9% 49% 15% 25% 0.70% 10% 51% 100%
TOP MANAGEMENT 1 2 0 1 0 4 1 0 0 0 0 1 5
% Representation for Occupational
Level per designated category 20% 40% 0% 20% 0% 80% 20% 0% 0% 0% 0% 20% 100.00%% Representation iro total labour
turn over per designated category 0.61% 1.64% 0.00% 3.33% 0.00% 1.26% 1.14% 0.00% 0.00% 0.00% 0.00% 0.62% 1%TARGET -5% -16% 1% -11% 0% -31% -5% 25% 1% 10% 0% 31%
SENIOR MANAGEMENT 0 1 0 5 0 6 0 0 0 0 0 0 6
% Representation for Occupational
Level 0% 17% 0% 83% 0% 100% 0% 0% 0% 0% 0% 0% 100.00%% Representation iro total labour
turn over per designated category 0.00% 0.82% 0.00% 16.67% 0.00% 1.89% 0.00% 0.00% 0.00% 0.00% 0.00% 0.00% 1.25%
TARGET 15% 7% 1% -74% 0% -51% 15% 25% 1% 10% 0% 51%
PROFESSIONALLY QUALIFIED
AND EXPERIENCED SPECIALISTS
AND MID-MANAGEMENT 6 5 1 2 14 1 3 0 1 0 5 19
% Representation for Occupational
Level 32% 26% 5% 11% 0% 74% 5% 16% 0% 5% 0% 26% 100%% Representation iro total labour
turn over per designated category 3.68% 4.10% 50.00% 6.67% 0.00% 4.40% 1.14% 4.41% 0.00% 16.67% 0.00% 3.09% 3.97%
TARGET -17% -2% -5% -1% 0% -25% 10% 9% 1% 5% 0% 25%
SKILLED TECHNICAL & JUNIOR
MNG, SUPERVISORS &
Superintendents 19 23 1 16 59 9 11 0 2 0 22 81
% Representation for Occupational
Level 23% 28% 1% 20% 0% 73% 11% 14% 0% 2% 0% 27% 100%% Representation iro total labour
turn over per designated category 11.66% 18.85% 50.00% 53.33% 0.00% 18.55% 10.23% 16.18% 0.00% 33.33% 0.00% 13.58% 16.91%
TARGET -8% -4% -1% -10% 0% -24% 4% 11% 1% 8% 0% 24%
SEMI – SKILLED and
discretionary decision making 59 37 0 5 0 101 52 37 0 3 0 92 193
% Representation for Occupational
Level 31% 19% 0% 3% 0% 52% 27% 19% 0% 2% 0% 48% 100%% Representation iro total labour
turn over per designated category 36.20% 30.33% 0.00% 16.67% 0.00% 31.76% 59.09% 54.41% 0.00% 50.00% 0.00% 56.79% 40.29%
Target -16% 5% 1% 7% 0% -3% -12% 6% 1% 8% 0% 3%
Unskilled and Defined decision
making 77 51 0 0 1 129 21 12 0 0 0 33 162
% Representation for Occupational
Level 48% 31% 0% 0% 1% 80% 13% 7% 0% 0% 0% 20% 100%% Representation iro TOTAL labour
turn over per designated category 47.24% 41.80% 0.00% 0.00% 0.00% 40.57% 23.86% 17.65% 0.00% 0.00% 0.00% 20.37% 33.82%
Target -33% -7% 1% 9% -1% -31% 2% 18% 1% 10% 0% 31%
TOTAL PERMANENT 162 119 2 29 1 313 84 63 0 6 0 153 465
% representation permanent staff 35% 26% 0% 6% 0% 67% 18% 14% 0% 1% 0% 33% 100%% Representation iro total labour
turn over per designated category 99.39% 97.54% 100.00% 96.67% 0.00% 98.43% 95.45% 92.65% 0.00% 100.00% 0.00% 94.44% 97.08%
Target -20% -2% 0% 3% 0% -18% -3% 11% 1% 9% 0% 18%
TEMPORARY STAFF 1 3 0 1 0 5 4 5 0 0 9 14
% Representation for Occupational
Level (temporary staff) 7% 21% 0% 7% 0% 36% 29% 36% 0% 0% 0% 64% 100%% Representation iro permanent
staff to total labour turnover (temps
and permanents) per designated
category 99.39% 2.46% 0.00% 3.33% 0.00% 1.57% 4.55% 7.35% 0.00% 0.00% 0.00% 5.56% 2.92%
TARGET representation
temp staff 8% 3% 1% 2% 0% 13% -14% -11% 1% 10% 0% -13%GRAND TOTAL 163 122 2 30 1 318 88 68 0 6 0 162 479
Variance between
provincial and local
(%)based on
PERMANENT STAFF -20% -2% 0% 3% 0% -18% -3% 11% 1% 9% 0% 18%
Overall % representation based on
total labour turnover (temp and
permanent workers 34% 25% 0% 6% 0% 66% 18% 14% 0% 1% 0% 34%
Variance Between Provincial and
Actual Overall(Permanent and
temp staff) -19% -1% 0% 3% 0% -17% -3% 11% 1% 9% 0% 17%
MALE FEMALE
GRAND TOTAL

Page | 108
4.1.5. Organogram and vacant posts
4.1.5.1. The Municipal human resources during the 2012/2013 and 2013/2014 financial
years
The Municipality had 669 positions approved for the 2012/13 financial year. 222 Posts were
vacant at the end of 2012/13, resulting in a vacancy rate of 33.18 per cent.
During the 2014/2015 financial year the municipality had 708 positions approved on the
organogram and 607 of the 708 positions were funded during the 2014/2015 financial year. A
total number of 479 positions are filled of which 465 are permanently filled and 14 positions
are filled temporarily.
128 funded positions were vacant as at July 2014 resulting in a vacancy rate of 21 per cent.
The vacancy growth rate has increase from 12.47% to 21.0% at Bitou Municipality over the
past financial year. The graph below demonstrates how the staff complement has increased
and how the vacancy rate has decreased in the past two financial years.
Figure 24: Graphs representing the approved positions and vacancy rates over the past 2 financial years
The table below presents the number of filled and vacant positions per functional area during
the 2013/2014 financial year.
669679
607
560
580
600
620
640
660
680
700
Series1
33.18%
12.47%
21.00%
0.00%
5.00%
10.00%
15.00%
20.00%
25.00%
30.00%
35.00%
2012/20132013/20142014/2015
Series1

Page | 109
PER POST LEVEL
Post level Filled Vacant
MM & MSA section 57 & 56 5 1
Middle management 6 1
Professionally qualified and experienced specialists and
mid-management 19 23
Skilled technical and academically qualified workers,
junior management, supervisors, foremen and
superintendents
81 51
Semi-skilled and discretionary decision making 193 98
Unskilled and defined decision making 161 72
Temporary Employees 14 0
Total 479 246
PER FUNCTIONAL LEVEL
Functional area Filled Vacant
Office of the Municipal Manager 13 16
Corporate Services 25 18
Financial Services 51 29
Planning & Strategic Services 25 13
Community Services 219 103
Municipal Services and Infrastructure Development 128 67
Total 465 246
Table 31: Vacancy rate per post and functional level
4.1.5.2. Human resource projections for 2014/2015
The final organizational structure of the Municipality was approved on Wednesday, 11 March
2015 under council resolution C/1/98/03/15. The municipality is in the process of developing
and finalising job descriptions for each position on the approved organizational organogram.
4.1.5.2.1 Staff projection for the 2015/2016 financial year.
Due to resource constraints, the municipality is planning to fill 128 vacant permanent
positions in 2015/2016.
Attached is a copy of the latest Council approved organisational structure.
4.1.6. Staff turnover rate
The table below shows the staff turnover rate for the past four financial years.

Page | 110
FINANCIAL YEAR
TOTAL NO OF
FILLED POSTS AT
THE END OF EACH
FINANCIAL YEAR
NEW
APPOINTMENTS
NO TERMINATIONS
DURING THE YEAR TURN-OVER RATE
2010/11 486 33 20 4.1
2011/12 488 20 18 3.6
2012/13 447 45 26 5.8
2013/2014 456 49 27 5.9
2014/2015 476 95 19 4.0
Table 32:Staff turnover rate
4.1.7 Skills Development
Section 68(1) of the Municipal Structures Act states that “a Municipality must develop its
human resource capacity to a level that enables it to perform its functions and exercise its
powers in an economical, effective, efficient and accountable manner”.
To meet the minimum requirements of the Municipal Structures Act as describe the human
resource capacity of the Municipality must comply with the Skills Development Act, Act No 81
of 1998 and the Skills Development Levies Act, Act No 28 of 1999.
4.1.7.1. Skills development 2014/2015
The table below indicates the number of beneficiaries per occupational category who received
training during the 2014/15 financial year. The tables below show the number of individuals
(headcount) trained and not the number of training interventions.

Page | 111
Occupational Levels
Male
Female Total
A C I W A C I W
Top
management 1 1 1 1 4
Senior management 1 3 4
Professionally qualified and
experienced specialists and mid-
management
5 5 1 5 1 3 1 21
Skilled technical and academically
qualified workers, junior
management, supervisors, foremen,
and superintendents
13 17 1 10 9 8 58
Semi- skilled and discretionary
decision making 23 15 18 13 69
Unskilled and defined decision
making 13 6 3 2 24
TOTAL PERMANENT 55 45 2 19 32 26 1 180 Temporary employees 1 2 1 4 GRAND TOTAL 56 47 2 19 33 26 1 184
Table 33: Skills matrix
4.1.7.2 Trainings provided in during 2014/2015
The following table presents the types of trainings provided to Bitou employees and number
of participant per training course in the 2014/2015 financial year:
TRAINING NUMBER OF
PARTICIPANTS
TYPE OF
TRAINING
DURATION
AET 30 Learnership 07 Months
Water Process Controllers
NQFL 4
4 Learnership 09 Months
Electrical Learnership 1 Apprenticeship 36 Months
Plumbing Learnership 3 Apprenticeship 36 Months
Brick-Layer Learnership 5 Apprenticeship 36 Months
Municipal Minimum Competency Training
25 Learnership 12 Months
Skills Development Facilitator
23 Skills
Programme
8 Days
Basic Billing 5 Skills
Programme
5 Days
Law Enforcement 14 Skills
Programme
5 Days

Page | 112
4.1.7.3. Beneficiaries for Upcoming Training events for 2014/2015
The table below indicates the number of beneficiaries per occupational category who will
receive training during the 2014/15 financial year. The table show the number of individuals
by equity.
Occupational Levels
Male
Female Total
A C I W A C I W
Top management 2 1 3
Senior management 1 5 6
Professionally qualified and experienced
specialists and mid- management 5 5 1 4 1 2 1 19
Skilled technical and academically qualified
workers, junior management, supervisors,
foremen, and superintendents
9 8 1 3 3 6 1 31
Semi- skilled and discretionary decision
making 9 6 7 8 30
Unskilled and defined decision making 10 9 13 8 40
TOTAL PERMANENT 32 29 2 13 24 24 2 129
Temporary employees 1 1 1
GRAND TOTAL 33 30 2 13 25 24 2 129
Table 34: Number of training recipients per occupation category
4.1.7.4 Upcoming trainings for 2014/2015
The following table presents the types of upcoming training provided to Bitou Municipal
employees and number of participant per training course in the 2015/2016 financial year:
Industrial Relations
Training
40 Skills
Programme
8 Days
Assertive Behaviour 23 Short Course 1 Day
Commercial Mediation 1 Skills
Programme
5 Days
Minute Taking 10 Short Course 2 Days
NAME OF LEARNING
PROGRAMME
TYPE OF LEARNING
PROGRAMME
(APPRENTICESHIP/
LEARNERSHIP/
SKILLS PROGRAMME
TARGETED
NUMBER OF
CURRENTLY
EMPLOYED
LEARNERS (18.1)
TARGETED
NUMBER OF
CURRENTLY
UNEMPLOYED
LEARNERS (18.2)
Local Economic
Development Learnership 5
Computer Training Skills Programme 9

Page | 113
Table 35: Planned trainings for 2014/2015
4.1.8 Municipal Policies and Service Delivery Improvement Plans
The Municipality has the following policies, service delivery improvement plans and systems to support the
workforce in delivering on the strategic objectives and to promote institutional viability and cohesion:
NAME OF POLICY, PLAN, SYSTEM STATUS RESPONSIBLE DIRECTORATE COUNCIL RESOLUTION
Employment equity Approved on 27 June 2013 Corporate Services C68/03/06/13
Scarce skills and retention policy Approved on 27 June 2013 Corporate Services C68/03/06/13
Recruitment and selection policy Approved on 27 June 2013 Corporate Services C3/68/06/13
Substance Abuse: Alcohol and drug policy and
procedure Approved on 27 June 2013 Corporate Services
C3/68/06/13
Leave policy Approved on 27 June 2013 Corporate Services C3/68/06/13
Dress code policy Approved on 27 June 2013 Corporate Services C3/68/06/13
Employee study aid and leave policy Approved on 27 June 2013 Corporate Services C3/68/06/13
Placement policy Approved on 27 June 2013 Corporate Services C3/68/06/13
Review of macro and organizational structure Approved on 27 June 2013 Corporate Services C3/68/06/13
HIV/AIDS policy Approved 26 March 2009 Corporate Services C3/68/06/13
Revised Substance Abuse: Alcohol and drug policy
& procedure
Approved 26 March 2009
Revised to be approved
Corporate Services
C3/68/06/13
Sexual harassment policy Approved 26 March 2009 Corporate Services C3/68/06/13
Overtime policy Revised approved 26
September 2013 Corporate Services
C3/74/09/13
Cellular phone policy Approved on 27 June 2013 Corporate Services C68/03/06/13
Protective clothing policy Revised approved on 27 March
2013 Engineerin
C5/29/03/13
IsiXhosa Training Skills Programme 20
Supervisory Training NQF
L2-4
Skills Programme
20
Fire Arm Training Skills Programme 15
First Aid & She Rep Skills Programme 20
Water & Wastewater
Treatment
Learnership
10
Horticulture Learnership 10
Employment Equity Training Short Course 20
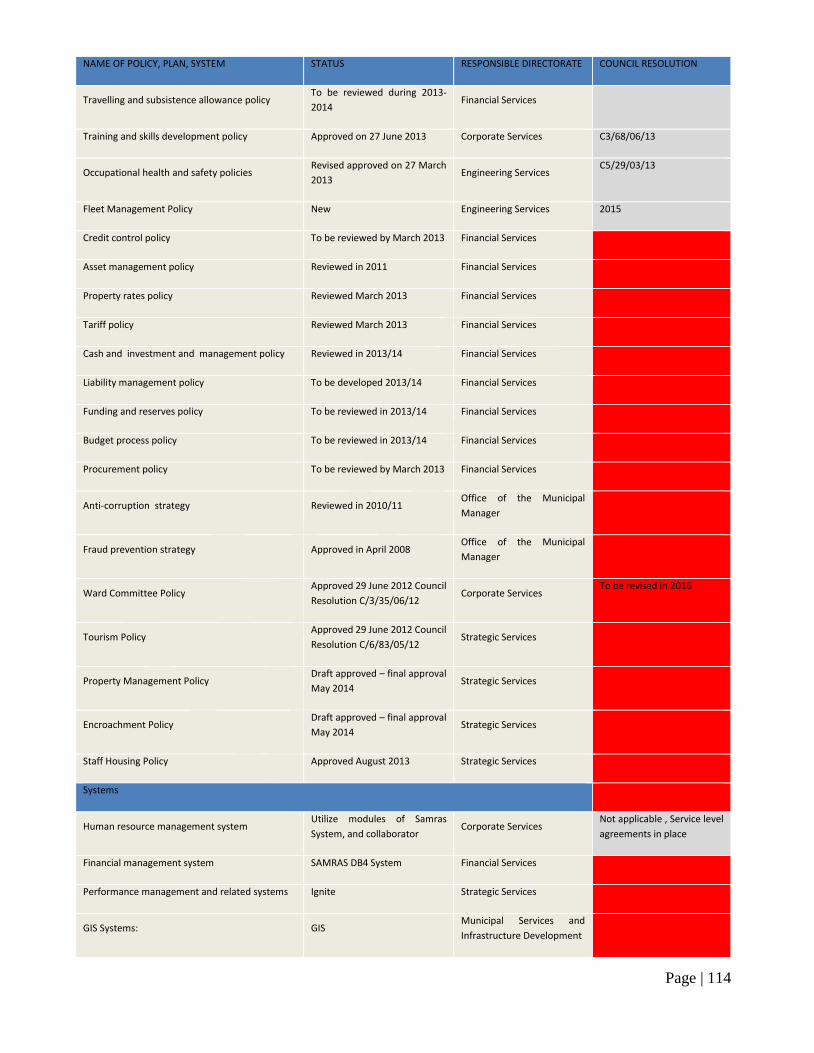
Page | 114
NAME OF POLICY, PLAN, SYSTEM STATUS RESPONSIBLE DIRECTORATE COUNCIL RESOLUTION
Travelling and subsistence allowance policy To be reviewed during 2013-
2014 Financial Services
Training and skills development policy Approved on 27 June 2013 Corporate Services C3/68/06/13
Occupational health and safety policies Revised approved on 27 March
2013 Engineering Services
C5/29/03/13
Fleet Management Policy New Engineering Services 2015
Credit control policy To be reviewed by March 2013 Financial Services
Asset management policy Reviewed in 2011 Financial Services
Property rates policy Reviewed March 2013 Financial Services
Tariff policy Reviewed March 2013 Financial Services
Cash and investment and management policy Reviewed in 2013/14 Financial Services
Liability management policy To be developed 2013/14 Financial Services
Funding and reserves policy To be reviewed in 2013/14 Financial Services
Budget process policy To be reviewed in 2013/14 Financial Services
Procurement policy To be reviewed by March 2013 Financial Services
Anti-corruption strategy Reviewed in 2010/11 Office of the Municipal
Manager
Fraud prevention strategy Approved in April 2008 Office of the Municipal
Manager
Ward Committee Policy Approved 29 June 2012 Council
Resolution C/3/35/06/12 Corporate Services
To be revised in 2016
Tourism Policy Approved 29 June 2012 Council
Resolution C/6/83/05/12 Strategic Services
Property Management Policy Draft approved – final approval
May 2014 Strategic Services
Encroachment Policy Draft approved – final approval
May 2014 Strategic Services
Staff Housing Policy Approved August 2013 Strategic Services
Systems
Human resource management system Utilize modules of Samras
System, and collaborator Corporate Services
Not applicable , Service level
agreements in place
Financial management system SAMRAS DB4 System Financial Services
Performance management and related systems Ignite Strategic Services
GIS Systems: GIS Municipal Services and
Infrastructure Development

Page | 115
NAME OF POLICY, PLAN, SYSTEM STATUS RESPONSIBLE DIRECTORATE COUNCIL RESOLUTION
IMQS
Strategic Services
Audit Management System MVisio Municipal Manager
Document management and process flow
systems Collaborator Corporate Services
Not applicable , Service level
agreements in place
By-laws
Liquor trading hours by-law Been published for comment –
approval date 30 June 2013 Community Services
Table 36: Schedule of policies and systems of Bitou Municipality
It is Council’s intention to develop a schedule of all policies and by-laws that will indicate an
annual action plan for reviewing all policies and by-laws. This process will assist the
Municipality to be developmental and innovative in conducting its business.

Page | 116
4.2 Municipal finance viability and performance analysis
Successful engagement of the political, social, economic, technological and geographic trends
and realities are only possible if a Municipality operates effectively and efficiently within the
constitutional mandate. Financial viability is paramount to the latter. Accordingly, this part of
the document addresses the financial viability and sustainability of the Municipality.
The financial position is best illustrated by the following tables below:
4.2.1. LIQUIDITY RATIO
DESCRIPTION 2011/12 2012/13
Audit Outcome Audit Outcome
Current ration 90,9 82,3
Current ratio adjusted for aged debtors 0,69 0,97
Liquidity ratio 0,74 1,15
4.2.2. IDP REGULATION FINANCIAL VIABILITY INDICATORS
DESCRIPTION 2011/12 2012/13
Audit Outcome Audit Outcome
Cost coverage 4,98 11,43
Total Outstanding Debtors to revenue 20% 17%
Debt coverage 11% 14%
4.2.3. BORROWING MANAGEMENT
DESCRIPTION 2011/12 2012/13
Audit Outcome Audit Outcome
Capital charges to operating expenditure 4% 4%
4.2.4. EMPLOYEE COSTS ARE THE FINANCIAL RATIOS
DESCRIPTION 2011/12 2012/13
Audit Outcome Audit Outcome
Employee costs 33% 29%
The financials show a steady improvement for most factors with a continuous improvement in
compliance to the MFMA and NT policies and prescriptions.
4.3. LOCAL ECONOMIC DEVELOPMENT

Page | 117
Bitou is blessed in many ways from an economic point of view. Situated in the Western Cape with a
current 3,2 percent growth rate, it is also part of the Eden District which boasts a 5,2% economic
growth rate. MERO-data itself claim an 8,4% economic growth rate for Bitou in 2000-2011. It is also
evident that Bitou must capitalize on its excellent Wholesale and Retail Trade, Catering and
Accommodation (17,9%), Finance, Insurance, Real Estate and Business Services (24,3%).
The LED strategy and the LED Implementation plan were approved respectively in March 2012 and
August 2013 by Council and are being implemented. They focus on enhancing the local business and
competitive environment and thus increase sustainable growth and development in the area and
ensure that this growth is inclusive of all communities. Additional focus is on identifying the current
resources and infrastructure that are available in the local municipal area, as well as the skills that are
available; with the purpose of assessing what still needs to be done in order to allow for the growth
of the economy and generate opportunities for all the stakeholders.
The table below identifies the economic activity within the different sectors:
Sector 2010/11 2011/12
Agriculture, forestry and fishing 76 045 85 049
Mining and quarrying 0 0
Manufacturing 231 823 237 193
Wholesale and retail trade 521 310 719 244
Finance, property, etc. 347 874 396 640
Community and social services 137 841 187 539
Infrastructure services 105 503 133 083
Total 1 420 396 1 758 748
Table 37: Economic Activity by sector
Below presents the top three prioritised projects within each of the industry categories:
Priority area Description
Agriculture
Development of fishing industry and marine culture activities
Establishment of a saw mill and development of forestry and milling industry
in municipal area
Promotion and development of Viticulture and wine farming
Manufacturing
Increased provision of light industrial space in Bitou Municipality
Manufacturing activities related to Viticulture (bottling and processing plant,
packaging plant)
Dairy Farming manufacturing activities (cheese production, bottling plant)

Page | 118
Priority area Description
Construction
Creating favourable investment environment for investors looking to invest
in local residential market (increasing efficiency of approvals, relaxing of
building costs and other taxes or levy’s on construction industry)
Facilitating increased access to formal and especially middle income and
low income/social housing markets for black entrepreneurs
Development of Bitou Coming Together Project (industrial, residential,
commercial and infrastructural components)
Wholesale and Retail
Provision of space for SMME and informal trading
Skills development and training for SMME and informal traders (mentorship
programmes and basic business skills training)
Promotion of establishment of cooperatives amongst small business
owners and informal sector
Finance and business
services
Establishment and operation of tourism as a central business (marketing,
advertising and accessing of tourist information all performed by central
organisation)
Recreation and youth entertainment facilities and activities
Facilitation and establishment of specialised financial services catering for
SMME environment (legal services, recruitment, bookkeeping services,
human resource development)
Transport
Establishment of transport network centred around Coming Together
Project
Increased use of public transport services in tourism industry
Establishment of transport cooperatives for manufacturing and agro-
processing activities (linked to agricultural and manufacturing opportunities
Table 38: Prioritised projects within each of the industry categories
From the above list of prioritised projects the following were identified as the most important
projects required for local economic development:
Priority nr Project Industry
1
Creating favourable investment environment for investors looking
to invest in local residential market (increasing efficiency of
approvals)
Construction
2 Increased provision of light industrial space in Bitou Municipality Manufacturing
3 Manufacturing activities related to Viticulture (pro-active land use
management) Manufacturing
4 Establishment of a wine route Agri-processing
5 Establishment of an Agricultural Village Agriculture
Table 39: Proposed top LED Programmes

Page | 119
Creating an environment for the top prioritised projects that is conducive and attractive for
investors, especially within the residential and industrial construction industry will
predominately be the role of Bitou Municipality. With the construction industry being one of the
dominant industries in the local municipal area, the implementation of this initiative will help
strengthen one of the area’s major industries which will also benefit the business services and
wholesale and retail industries. It are directly and indirectly reliant on the performance of the
local construction industry. This represents the top-down approach to economic development
in the Bitou Municipality.
The other 2 top prioritised projects aim at developing the local manufacturing industry, through
the increased provision of industrial space as well as developing manufacturing activities
related to growing the agricultural industry in the area of viticulture. The increased provision of
industrial space is thus also linked with the top prioritised projects through creating a more
favourable environment for investment within the development of more industrial space, and
prioritised project number 3 represents the bottom-up approach to economic development.
This project not only falls within a value chain derived from the viticulture activities and
processes, but is also aiding the diversification of the local economy away from the dominant
services and construction industry to more primary and secondary economic activities of
agriculture and manufacturing.
Three reasons to spend on infrastructure:
Fulfil public services demand (Political support benefits);
Quick access for developers (Economic growth); and
Job Creation (Political and Economic benefits).
4.4. GOOD GOVERNANCE AND PUBLIC PARTICIPATION
The purpose of this section is to report on the status of governance structures and the participation of
communities in the affairs of local government as required by legislation.
Good governance has 8 major characteristics. It is participatory, consensus oriented, accountable,
transparent, responsive, effective and efficient, equitable and inclusive and follows the rule of law. It
assures that corruption is minimized, the views of minorities are taken into account and that the voices
of the most vulnerable in society are heard in decision-making. We have a draft public participation
policy that still needs to be adopted by council these policy is also to align our 8 major characteristics
with the back to basic approach as agreed by national government

Page | 120
4.4.1. COUNCIL
Bitou Municipal Council comprises 13 councillors, including seven Ward Councillors and six
Proportional Representation Councillors. The Municipality has an Executive Mayoral system. The
Executive Mayor appointed and Executive Committee, made up of Councillors drawn from the ruling
parties, namely the DA and Cope Alliance.
Below is a table that categorised the Councillors within their specific political parties and wards:
Name of councillor Capacity Political party Ward representing or
proportional
Cllr M Booysen The Executive Mayor DA PR
Cllr R S Koeberg The Deputy Executive Mayor COPE PR
Cllr EE Paulse Mayoral Committee Member DA PR
Cllr Ndayi PR Councillor DA PR
Cllr S Farrow PR Councillor DA PR
Cllr S Besana PR Councillor ANC PR
Cllr NM de Waal Ward Councillor DA Ward 1
Cllr W Craig Ward Councillor DA Ward 2
Cllr LM Seyisi Ward Councillor ANC Ward 3
Cllr H Plaatjies Ward Councillor ANC Ward 4
Cllr MM Mbali Ward Councillor ANC Ward 5
Cllr SE Gcabayi Ward Councillor ANC Ward 6
Cllr AR Olivier Speaker DA Ward 7
Table 40: Composition of Bitou Municipal Council
4.4.1.2. EXECUTIVE MAYORAL COMMITTEE
The Executive Mayor of the Municipality, Councillor Memory Booysen, assisted by the Mayoral
Committee, heads the executive arm of the Municipality. The Executive Mayor is at the centre
of the system of governance, since executive powers are vested in him to manage the day-to-
day affairs. This means that he has an overarching strategic and political responsibility. The
key element of the executive model is that executive power is vested in the Executive Mayor,

Page | 121
delegated by the Council, and as well as the powers assigned by legislation. Although
accountable for the strategic direction and performance of the Municipality, the Executive
Mayor operates in concert with the Mayoral Committee.
The name and portfolio of each member of the Mayoral Committee is listed in table 28 below:
Name of member Capacity
Cllr M Booysen The Executive Mayor
Cllr R S Koeberg The Deputy Executive Mayor
Cllr AR Olivier The Speaker
Cllr N De Waal Mayoral Committee Member
Cllr EE Paulse Mayoral Committee Member
Table 41: Composition of the executive mayoral committee
4.4.2. WARD
The ward committees support the Ward Councillor who receives reports on development,
participate in development planning processes, and facilitate wider community
participation. To this end, the Municipality constantly strives to ensure that all ward
committees function optimally with community information provision; convening of meetings;
ward planning; service delivery; IDP formulation and performance feedback to communities.
Council adopted a ward committee policy on the 22 June 2013. The municipal area was
demarcated into seven wards and a ward committee represents each of the seven wards.
Bitou has a fully functional ward committee system of which members are active participants.
Ward committee members were recently trained on municipal processes and meeting
procedure this was to get them all in line with municipal legislative framework.
The Council at its Special Council meeting held 25 February 2015 adopted an item on the the
establishment of a Ward Committee Forum in order to enhance strategic relationships
between the Bitou communities and the municipality. The forum can be used as a platform for
all stakeholders to unblock service delivery issues as well as to improve ward committee
functionality. This will reflect that Bitou Local Municipality maintains the ideal co-operational

Page | 122
approach towards operational and geographical solutions. The management team of Bitou
municipality will gain hands on experience on what the needs and challenges of the Bitou
community are.
The establishment of the forum will maximize administrative and operational efficiency and
provide for adequate checks and balances.
Frequency of meetings of ward committees
Ward Committees meet quarterly.
4.4.3. AUDIT COMMITTEES
Section 166(2) of the MFMA states that an audit committee is an independent advisory body which must –
(a) advise the municipal council, the political office-bearers, the accounting officer and the management staff of the Municipality, on matters relating to –
internal financial control;
risk management;
performance Management; and
effective Governance.
The Audit Committee has the following main functions as prescribed in section 166 (2) (a-e) of the MFMA and the Local Government: Municipal Planning and Performance Management Regulation, 2000.
Functions of the Audit Committee
To advise the Council on all matters related to compliance and effective governance.
To review the annual financial statements to provide Council with an authoritative and credible view of the financial position of the Municipality, its efficiency and its overall level of compliance with the MFMA, the annual Division of Revenue Act (DoRA) and other applicable legislation.
Respond to the council on any issues raised by the Auditor- General in the audit report.
To review the quarterly reports submitted to it by Internal Audit.
To evaluate audit reports pertaining to financial, administrative and technical systems.

Page | 123
The compilation of reports to Council, at least twice during a financial year.
To review the performance management system and make recommendations in this regard to Council.
To identify major risks to which Council is exposed and determine the extent to which risks have been minimised.
To review the annual report of the Municipality.
Review the plans of the Internal Audit function and in so doing; ensure that the plan addresses the high-risk areas and ensure that adequate resources are available to manage identified high risks.
Provide support to the Internal Audit function.
Ensure that no restrictions or limitations are placed on the Internal Audit section.
Evaluate the activities of the Internal Audit function in terms of their role as prescribed by legislation.
4.4.4. LOCAL LABOUR FORUM
Name of representative Capacity
Councillor EE Paulse Councillor
Councillor Koeberg Councillor
Councillor S E Gcabayi Councillor
Councillor N M De Waal Councillor
Mr Monde Stratu Head: Community Services
Ms Phumla Ngqumshe Head: Engineering Services
Vacant Head: Strategic Services
Mr Felix Lotter Chief Financial Officer
Mr Reginald Smit Head Corporate Services
Mr Henry Toyis IMATU
Miss Audrey Reed SAMWU
Mrs Mary Vries SAMWU
Mr Lindi Nceba Nkentsha SAMWU
4.4.5. PERFORMANCE AUDIT COMMITTEE
The Regulations require that the performance audit committee is comprised of a minimum of
three members, the majority of whom are external (neither a councillor nor an employee) of

Page | 124
the Municipality. Section 14(2) (b) of the Regulations further stipulates that the performance
audit committee must include at least one person who has expertise in performance
management. It is also a requirement of the Regulations in Section 14(2)(d) that the Council
of a Municipality designate a member of the performance audit committee, who is neither a
councillor nor an employee of the Municipality, as the chairperson of the committee.
Section 166(5) of the MFMA, requires that the members of an audit committee must be
appointed by the council of the Municipality. One of the members, not in the employ of the
Municipality, must be appointed as the chairperson of the committee. No councillor may be a
member of an audit committee.
Both the Regulations and the MFMA, indicate that three is the minimum number of members
needed to comprise a performance audit committee. While the regulations preclude the
appointment of a councillor as chairperson of the performance audit committee, the MFMA
excludes the involvement of a councillor in the composition of a performance audit committee
entirely.
Further, Section 14(2) (f) of the Regulations provides that, in the event of a vacancy occurring
amongst the members of the performance audit committee, the Municipality concerned must
fill that vacancy for the unexpired portion of the vacating member’s term of appointment.
Section 14(3) (a) of the Regulations requires that the performance audit committee of a
Municipality must meet at least twice during each financial year. However, any member of the
committee may call for additional special meetings of the performance audit committee, where
sufficient justification exists in terms of Section 14(3) (b) of the Regulations.
Functions of the Performance Audit Committee
In terms of Section 14(4) (a) of the Regulations, the performance audit committee has the
responsibility to -
i) Review the quarterly reports produced and submitted by the internal audit process; ii) Review the Municipality’s performance management system and make
recommendations in this regard to the council of the Municipality; and iii) At least twice during each financial year, submit a performance audit report to the council
of the Municipality.

Page | 125
4.4.6. INTERGOVERNMENTAL RELATIONS
The Municipality fosters relations with other spheres of government and participates in various
intergovernmental activities to promote a closer working relationship between the various
spheres of government. Council is of the view that these relationships can assist in enhancing
government’s services to the communities of the Municipal Area.
The Municipality delegated officials and councillors to the following forums:
Forum Frequency Responsibility
Municipals managers forum Quarterly Municipal Manager
SALGA working groups Quarterly Directors and councillor specific
to working group
District coordinating forum Quarterly Mayor and Municipal Manager
Premiers coordinating forum Quarterly Mayor and Municipal Manager
Provincial and district managers IDP forums Quarterly IDP Manager
Disaster management forum Quarterly Community Services
Human resources forum Quarterly Corporate Services
Legal advisors forum Quarterly Corporate Services
Environmental health forum Quarterly Community Services
ICT Managers Forum Every 2 months Financial Services
Chief finance officers Quarterly Chief Financial Officer
Supply chain management forum Quarterly Financial Services
South Cape Development Forum Quarterly Strategic Services
Municipal Planning Heads Forum Quarterly Strategic Services
Local Economic Development Forum Quarterly Strategic Services
Municipal Risk Management Forum Quarterly Office of the Municipal Manager
Chief Audit Executive Forum Quarterly Office of the Municipal Manager
Predetermined Objectives Forum Quarterly PMS, IDP and Internal Audit
Managers
Standard operating Procedures Forum Quarterly Internal Auditor
Table 42: IGR forums
4.5. BASIC SERVICES AND INFRASTRUCTURE DEVELOPMENT
The Municipality has been able to provide the deemed necessary services to its residents. The services include water and sanitation reticulation and bulk services road and storm water infrastructure, electricity reticulation and bulk services waste removal and health services. The number of these services has been increasing on yearly basis.
4.5.1. WATER

Page | 126
Major factors influencing water demand:
Population growth
The population in Bitou is growing at an average annual rate of 5. 4 percent and it is projected
that by 2030 the current population would have doubled. That will have a direct impact on the
Municipality’s ability to provide water. Now more than 90 percent of households have access
to water beyond the RDP standards.
The major challenge with water provision is at the informal settlements and urban settlements
in rural areas, e.g. Kranshoek, Kurland and Covie. The water infrastructure cannot reach and
service such areas efficiently or sustainably.
Weather (climate)
Climate change also plays a major role in the provision of water. Drought, changing rainfall
and run-off patterns and increased evaporation rates all affect the provision of potable water.

Page | 127
CHAPTER 5: DEVELOPMENT STRATEGY
The IDP is defined as the ultimate municipal strategic plan that has to inform all planning,
budgeting and decision making processes. This strategy has to take into account the
development trends as outlined by relevant data which is sourced from accredited institutions
like StatsSA. The communities as consumers of municipal serves have to be consulted,
engaged and be given an opportunity to inform or demand services from the Municipality. Most
importantly the Municipality has to consider sector requirements and the legal framework to
ensure that services are delivered in a sustainable manner which does not compromise the
environment, the livelihood of communities and the financial viability of the Municipality as an
institution.
An in-depth analysis of the current situation was done in chapters three and four above and
the following critical development challenges were identified:
1. The gap in service delivery;
2. Unemployment is on the rise;
3. The gini coefficient
4. The crime levels are on the rise;
5. Seasonality of the economy is a challenge;
6. In migration of low skilled workers;
7. Poor, or lack of, health facilities;
8. Environmental degradation
To create an ideal situation the Municipality must adopt a vision to work towards establishing
that ideal environment that will eradicate the development challenges listed above. On the 1
– 3rd November 2013 the leadership of Bitou Municipality embarked on an intensive strategic
session which aimed at deriving tactics or strategies that would enhance developmental local
government. The municipal and strategic objectives remained unchanged; however, 13 priority
projects to enhance the Municipality’s developmental obligations were identified and
implemented.
5.1. VISION

Page | 128
5.2. MISSION
The political office bearers and staff of the Bitou Local Municipality commit to:
Effecting participative and accountable development local government and governance.
Fostering effective intergovernmental relations.
Facilitating sustainable people-centred development and ensuring environmental integrity.
Proactively identifying and securing suitable land for settlement.
Providing effective basic services in a sustainable manner.
Facilitating local economic development with a particular focus on reducing poverty,
creating jobs and developing the tourism and eco-tourism sectors.
Facilitating social upliftment and community integration.
Adhering to the Batho Pele principles for its community.
5.3 STRATEGIC GOALS
Council has approved the following strategic goals:
a) To ensure efficient and affordable basic services to all residents of Bitou. b) To strengthen the economy of Bitou for sustainable growth and job creation. c) To develop a municipal governance system that complies with international best
practise. d) Create an institution that can align planning with implementation for effective and
efficient service delivery. e) To be a financially viable institution geared to provide affordable and sustainable
services to the clientele of Bitou Municipality.
These strategic goals are unpacked in section 5.5.
Vision 2022:
“To be the best together”
“Om saam die beste te wees”
“SobalaselaSonke”

Page | 129
5.4 Municipal Planning and Co-operative Government
This section provides the background of the National, Provincial and District development-
planning framework that was considered during the development of the municipal strategy and
illustrates the alignment of all these strategies. The alignment table towards the end of this
section summarises the integration of the developmental frameworks into one strategy for the
Bitou Municipal area.
In terms of section 24 of the Municipal Systems Act –
(1) The planning undertaken by a Municipality must be aligned with, and complement, the
development plans and strategies of other affected municipalities and other organs of
state to give effect to the principles of co-operative government contained in section 41
of the Constitution.
(2) Municipalities must participate in national and provincial development programmes as
required in section 153(b) of the Constitution.”
(3) It is therefore important for municipalities to align their strategic objectives with national
and provincial development programmes. The alignment of the Bitou Strategic
Objectives with the key national, provincial and regional strategies is illustrated in the
table below.
Millennium
Developmen
t Goals
Vision for
2030
Medium Term
Strategic
Framework
National
Outcomes
Provincial
Strategic
Objectives
Eden District
Municipality
Strategic
Objectives
Bitou
Strategic
Goals
Eradicate
extreme
poverty and
hunger
An
economy
that will
create more
jobs
Speed up
economic
growth and
transform the
economy to
create decent
work and
Decent
employment
through
inclusive
economic
growth
Creating
opportunities
for growth
and jobs
Grow the
district
economy
To strengthen
the economy
of Bitou for
sustainable
growth and
job creation

Page | 130
Millennium
Developmen
t Goals
Vision for
2030
Medium Term
Strategic
Framework
National
Outcomes
Provincial
Strategic
Objectives
Eden District
Municipality
Strategic
Objectives
Bitou
Strategic
Goals
sustainable
livelihoods
Improving
Infrastructur
e Massive
programme to
build
economic and
social
infrastructure
An effective,
competitive
and
responsive
economic
infrastructur
e network
Integrating
service
delivery for
maximum
impact
Increasing
access to
safe and
efficient
transport
Conduct
regional bulk
infrastructure
planning,
implement
projects,
roads
maintenance,
public
transport,
manage and
develop
Council fixed
assets
To ensure
efficient and
affordable
basic
services to all
residents of
Bitou
Transition
to a low-
carbon
economy
Mainstreami
ng
sustainability
and
optimizing
resource-use
efficiency
An inclusive
and
integrated
rural
economy
Comprehensi
ve rural
development
strategy linked
to land and
agrarian
reform and
food security
Vibrant,
equitable
and
sustainable
rural
communities
and food
security
Creating
opportunities
for growth
and
development
in rural areas
Facilitate the
comprehensi
ve rural
development
plan
Ensure
environment
al
sustainability
Reversing
the spatial
effects of
apartheid
Build
cohesive,
caring and
sustainable
communities
Sustainable
resource
Sustainable
human
settlements
and
improved
quality of
household
life
Protection
and
Developing
integrated
and
sustainable
human
settlements
Promote
sustainable
environmenta
l
management
and public
safety
To strengthen
the economy
of Bitou for
sustainable
growth and
job creation

Page | 131
Millennium
Developmen
t Goals
Vision for
2030
Medium Term
Strategic
Framework
National
Outcomes
Provincial
Strategic
Objectives
Eden District
Municipality
Strategic
Objectives
Bitou
Strategic
Goals
management
and use
enhanceme
nt of
environment
al assets
and natural
resources
Achieve
universal
primary
education
Improving
the quality
of
education,
training and
innovation
Strengthen
the skills and
human
resource base
Improve the
quality of
basic
education
A skilled and
capable
workforce to
support
inclusive
growth
Improving
education
outcomes
Build a
capacitated
workforce
and
communities
Create an
institution that
can align
planning with
implementati
on for
effective and
efficient
service
delivery
Reduce child
mortality
Improve
maternal
health
Combat
HIV/AIDS,
malaria, and
other
diseases
Quality
health care
for all
Improve the
health profile
of society
Improve
health and
life
expectancy
Increasing
wellness
Healthy and
socially stable
communities
To strengthen
the economy
of Bitou for
sustainable
growth and
job creation
Social
protection
Intensify the
fight against
crime and
corruption
All people in
south Africa
protected
and feel safe
Reducing
poverty
Building
safer
communitie
s
Increasing
safety
Reforming
the public
service
Build a
developmenta
l state
including
improvement
of public
services and
strengthening
A
development
-orientated
public
service and
inclusive
citizenship
Building the
best-run
regional
government
in the world
Ensure
financial
viability of the
EDM
To be a
financially
viable
institution
geared to
provide
affordable
and
sustainable
Fighting
corruption

Page | 132
Millennium
Developmen
t Goals
Vision for
2030
Medium Term
Strategic
Framework
National
Outcomes
Provincial
Strategic
Objectives
Eden District
Municipality
Strategic
Objectives
Bitou
Strategic
Goals
democratic
institutions
A responsive
and,
accountable,
effective and
efficient local
government
system
Promote
good
governance
services to
the clientele
of Bitou
Municipality
To develop a
municipal
governance
system that
complies with
international
best practice
Promote
gender
equity and
empower
women
Develop a
global
partnership
for
development
Transformin
g society
and uniting
the country
Pursue
regional
development,
African
advancement
and enhanced
international
co-operation
A better
South Africa,
a better
Africa and
world
Increasing
social
cohesion
To strengthen
the economy
of Bitou for
sustainable
growth and
job creation
Table 5.1: Performance objectives alignment
5.5 Strategic Goals and Priorities
As a Municipality that is committed to enhance the characteristics of a developmental state,
the following goals, priorities, strategies and outcomes have been developed to address the
challenges identified during the IDP development process. The agreed strategic goals are
linked to service areas and departmental objectives. The information will be used in the IDP
implementation plan (iMAP) to finalise the predetermined objectives (PDO) and align it with
the municipal budget and performance system.
The Top Institutional Risks identified by the Municipality during the risk analysis were
considered in the development of the departmental objectives.

Page | 133
5.6. STRATEGIC PROJECTS AND PROGRAMMES
Thirteen interventions were identified to spur economic activity in the Bitou Area and these
programmes are listed below:
Project 1: Economic Development and Catalytic Project Driver
Project 2: Coming-together/New Horizons/Ladywood
Project 3: Checkers Development Project
Project 4: Central Beach Re-development
Project 5: South Cape College Initiative
Project 6: Offices Development Project
Project 7: Krantzkop Secure School Development
Project 8: Social Housing Project
Project 9: Establishment of a Government Footprint
Project 10: Airport Development
Project 11: Alien Vegetation Control
Project 12: Kwa-Nokuthula Electricity Upgrade
The challenges in implementing the above programmes are linked to bulk services,
administrative red tape and lack of technical and financial resources. The following
programmes are game changers:
Bulk Electricity supply
Description Some of the electrical supply equipment like networks, transformers and substations are out of date or has limited capacity that result in electrical outages during the peak season. The municipality has developed an electricity master plan with an implementation cost of R208m
Impact Some development initiatives cannot be approved due to limited capacity which results in lost job opportunities, lost revenue and loss of economic injection into the economy. More than 3000 households are affected when outages occur and more than 16 000 households are affected when the whole load shedding process occur.
Affected areas
Kwa-Nokuthula and Surrounding areas, Plettenberg Bay, Kuerbooms, and Nature Valley.
Programme/Project
a. Construction of a 66/11kv substation at Kwa-Nokuthula b. Increase 22Kv overhead line for Keurbooms, Witterdrift and Natures Valley c. The Keurbooms pump station NMD is 600KVA needs to be upgraded to 1000KVA d. Upgrade 10MVA 66/22Kv at Robberg 10MVA transformer to 20MVA e. Bitou S/S 20MVA f. ESKOM Upgrade Blanco Knysna 132Kv overhead line g. New 66Kv feeder at Robberg SS to supply Brakloof SS h. Upgrade cable from SS1 TO SS7
Stakeholders Eskom, DEA, Municipality, DOE, DBSA and DME
Required Funding
2015/2016 2016/2017 2017/2018 2018/2019 2019/2020
R34 900 000 R34 750 000 R52 120 000 R20 600 000 R65 930 000

Page | 134

Page | 135
Bulk Water supply
Description The municipality is a water authority responsible for the provision, purification, and provision
of water and sewerage services. The water situation in Bitou is dire and needs urgent
attention. The following factors influence water supply:
1. Population growth and human behaviour patterns;
2. Intensification of use (new water supply to existing rural areas and supply)
3. Climate change
4. Efficiency of water use (WC/WDM)
5. Seasonal variability
The impact of these factors on consumption growth patterns can be absorbed for now but in
2016 the demand for water will outstrip the supply. A storage dam needs to be constructed
at Wadrift.
Current consumption on average out of season is 9Ml/day. In season on average is 17Ml/day
at peak.
Current storage is 58Ml/day which is only 48hrs storage and insufficient in case of a disaster.
Impact All social and economic activities will be affected and life will be threatened, importing or
buying bottled water will be very expensive for the poor and marginalized.
Affected
areas
All areas and surrounding farms.
Programme/
Project
1. Investigating a new source or increasing abstraction for Kurland
2. Busy with a feasibility study for the Regional Bulk Water Scheme with Knysna
3. Increasing storage by construction of the Wadrift Dam a linking pipeline to Knysna
(R200m)
4. MSID is currently increasing the current capacity of the Water Treatment Works from 22
Ml/day to 27 Ml/day. Electrical and mechanical installations still outstanding.
5. New reservoir constructed in Kwa-Nokuthula, the linking pipeline infrastructure from the
reservoir will be constructed when the housing project resumes
6. Planning for storage with linking pipeline for Natures Valley
7. The Water and Sewer Master Plans, for the internal networks within the various towns,
recommends upgrades to the value of R288 million and R131 million in the foreseeable
future.
Stakeholders DWA, DEA, Eden DM and Knysna Municipality, DBSA
Required
Funding
2015/2016 2016/2017 2017/2018 2018/2019 2019/2020
R11 100 000.00 R29 000 000.00 R41 600 000.00 R115 000 000. R95 500 000.00
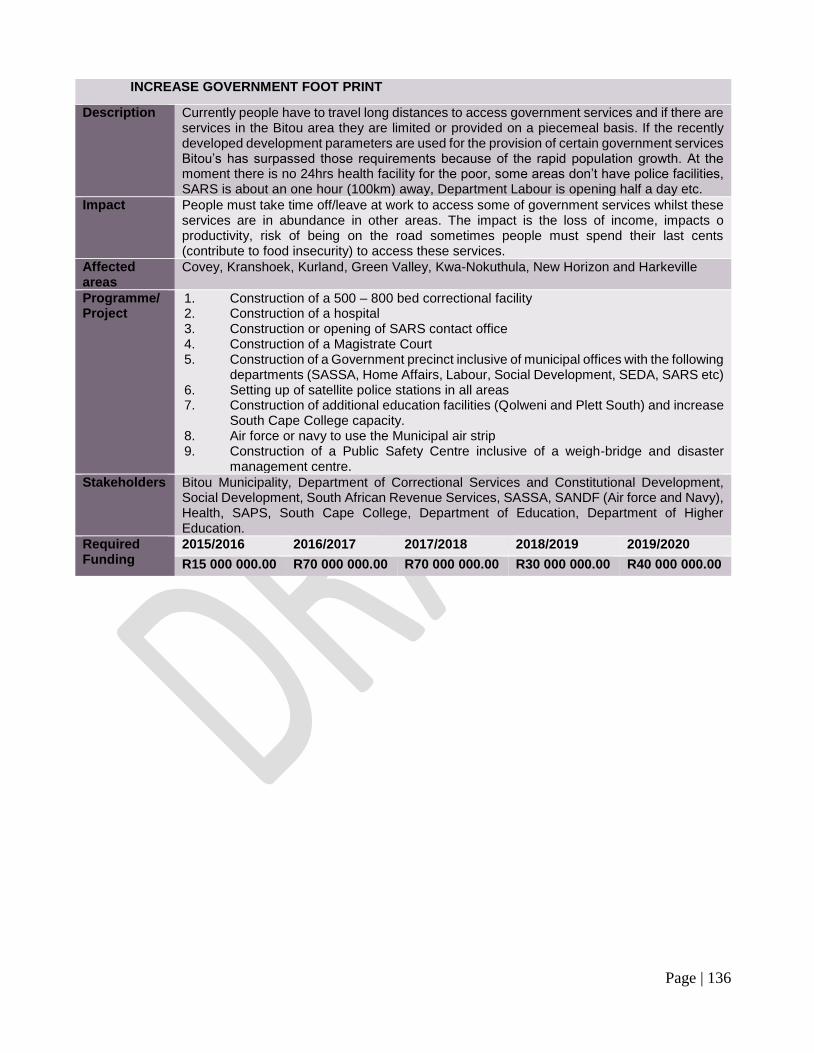
Page | 136
INCREASE GOVERNMENT FOOT PRINT
Description Currently people have to travel long distances to access government services and if there are services in the Bitou area they are limited or provided on a piecemeal basis. If the recently developed development parameters are used for the provision of certain government services Bitou’s has surpassed those requirements because of the rapid population growth. At the moment there is no 24hrs health facility for the poor, some areas don’t have police facilities, SARS is about an one hour (100km) away, Department Labour is opening half a day etc.
Impact People must take time off/leave at work to access some of government services whilst these services are in abundance in other areas. The impact is the loss of income, impacts o productivity, risk of being on the road sometimes people must spend their last cents (contribute to food insecurity) to access these services.
Affected areas
Covey, Kranshoek, Kurland, Green Valley, Kwa-Nokuthula, New Horizon and Harkeville
Programme/Project
1. Construction of a 500 – 800 bed correctional facility 2. Construction of a hospital 3. Construction or opening of SARS contact office 4. Construction of a Magistrate Court 5. Construction of a Government precinct inclusive of municipal offices with the following
departments (SASSA, Home Affairs, Labour, Social Development, SEDA, SARS etc) 6. Setting up of satellite police stations in all areas 7. Construction of additional education facilities (Qolweni and Plett South) and increase
South Cape College capacity. 8. Air force or navy to use the Municipal air strip 9. Construction of a Public Safety Centre inclusive of a weigh-bridge and disaster
management centre.
Stakeholders Bitou Municipality, Department of Correctional Services and Constitutional Development, Social Development, South African Revenue Services, SASSA, SANDF (Air force and Navy), Health, SAPS, South Cape College, Department of Education, Department of Higher Education.
Required Funding
2015/2016 2016/2017 2017/2018 2018/2019 2019/2020
R15 000 000.00 R70 000 000.00 R70 000 000.00 R30 000 000.00 R40 000 000.00

Page | 137
CHAPTER 6: PROJECTS AND PROGRAMMES
Below is the draft capital budget for 2015/2016 and the outer financial years.
5 5 320 012 1 PURCHASE OF LAND (GRANTS) 6 887 428.00 5 711 227.00 6 729 888.00 Housing
5 5 322 015 1 LDV LONG WHEEL BASE DIESEL 300 000.00 CRR
5 5 340 012 1 FIRE HYDRANTS 80 000.00 CRR
5 5 342 015 1 TRAILOR 200 000.00 CRR
5 5 342 032 1 LAND AND BUILDINGS 2 2 700 000.00 External Loans
5 5 350 035 1 UPGRADE OF SPORTS FACILIT: MIG 438 596.00 2 562 275.00 1 754 386.00 MIG
5 5 820 032 1 STORM WATER IMPROVEMENTS 3 1 689 208.00 MIG
5 5 820 061 1 HOUSING SERVICES-QOLWENI 1 851 226.00 1 535 083.00 1 808 882.00 Housing
5 5 820 102 1 RURAL INFRASTRUCTURE DEV-CRR 366 013.00 CRR
5 5 820 105 1 INTEGRATED TRANSPORT PLAN-CRR 200 000.00 CRR
5 5 820 107 1 NON-MOTORISED TRANS FAC-CRR 900 000.00 980 000.00 1 000 000.00 CRR
5 5 820 200 1 SAFELY HOME PROGRAM-CRR 60 000.00 260 000.00 CRR
5 5 820 205 1 COMMUNITY DEVELOP PLAN-CRR 100 000.00 CRR
5 5 820 206 1 COMMUNITY DEVELOP PLAN-EFF 750 000.00 External Loans
5 5 820 207 1 KRANSHOEK-UPGRADING OF GRAVEL 1 315 789.00 2 441 461.00 2 631 579.00 MIG
5 5 820 208 1 UPGRADING OF UNPAVED ROADS-CRR 500 000.00 CRR
5 5 820 209 1 REHABILIT OF PAVED ROADS-CRR 3 646 771.00 3 426 291.00 3 308 407.00 CRR
5 5 820 307 1 KWANO:UPGRADING GRAVEL ROAD-MI 1 315 789.00 1 816 451.00 1 245 263.00 MIG
5 5 820 308 1 KWANO-UPGRADE SISHUBA EXT-MIG 877 193.00 1 754 386.00 MIG
5 5 824 000 1 REPLACEMENT OF FLEET VEHICLE 6 000 000.00 CRR
5 5 824 001 1 NEW PLAN & MACHINERY 2 500 000.00 CRR
5 5 830 006 1 WASTE TRANSFER STATION (G) 877 193.00 MIG
5 5 830 007 1 WASTE TRANSFER STATION 5 000 000.00 External Loans
5 5 830 100 1 WASTE TRANSFER ST:E&M-MIG 3 698 919.00 MIG
5 5 830 101 1 WASTE TRANSFER ST:E&M-EFF 1 268 800.00 External Loans
5 5 840 033 1 KWANO OUTFALL SEWER 1 754 386.00 2 631 579.00 MIG
5 5 840 061 1 QOLWENI/BOSSIESGIF 2 408 756.00 1 997 401.00 2 353 660.00 Housing
5 5 840 102 1 UPGRADING OF PUMPSTATION-GRANT 2 702 632.00 ACIP
5 5 840 103 1 UPGRADING OF PUMPSTATION-CRR 1 000 000.00 CRR
5 5 840 104 1 UPGRADING OF PUMPSTATION-EFF 600 000.00 500 000.00 External Loans
5 5 840 105 1 UPGRADING OF TELEMATRY-CRR 770 000.00 CRR
5 5 840 107 1 UPGRADE WASTE WATER TREAT-CRR 80 000.00 700 000.00 CRR
5 5 840 108 1 UPGRADE BPS PUMPSTATION-GRANT
5 5 840 109 1 UPGRADE BPS PUMPSTATION-CRR 405 000.00 917 000.00 CRR
5 5 840 200 1 UPGRADE BPS PUMPSTATION-EFF 1 000 000.00 3 890 000.00 4 890 000.00 External Loans
5 5 850 016 1 ELECTIFICATION:HOUSING PROGRAM 6 140 351.00 7 017 544.00 4 385 965.00 INEP
5 5 850 062 1 STREET LIGHTS-GRANT 1 130 934.00 1 497 136.00 MIG
5 5 850 063 1 STREET LIGHTS-CRR 500 000.00 400 000.00 300 000.00 CRR
5 5 850 064 1 ELECTRICITY MASTER PLANS-CRR 2 183 000.00 2 800 000.00 CRR
5 5 850 065 1 ELECTRICITY MASTER PLANS-EFF 7 131 200.00 8 988 800.00 External Loans
5 5 850 066 1 UNIT DEVELOPMENT PLAN-CRR 1 300 000.00 4 000 000.00 1 750 000.00 CRR

Page | 138
5 5 850 067 1 UNIT DEVELOPMENT PLAN-EFF 2 000 000.00 1 000 000.00 2 000 000.00 External Loans
5 5 850 206 1 SECURITY KEY SITES-CRR 150 000.00 150 000.00 CRR
5 5 860 047 1 RETICULATION UPGRADES & REPLAC 400 000.00 900 000.00 700 000.00 External Loans
5 5 860 049 1 KEURBOOMS WATER SUPPLY AND ABS 877 193.00 2 438 071.00 MIG
5 5 860 055 1 WATER DEMAND MANAGEMENT(PRESSU 355 000.00 455 000.00 20 000.00 CRR
5 5 860 061 1 QOLWENI/BOSSIESGIF 1 669 261.00 1 384 192.00 1 631 078.00 Housing
5 5 860 062 1 ROODEFONTEIN DAM UPGRADES 3 877 193.00 1 754 386.00 MIG
5 5 860 084 1 SUPPLY TO KWANO & SURROUNDS 6 745 851.00 2 430 923.00 MIG
5 5 860 091 1 WATER TREAMENT WORKS UPGRD-CRR 375 000.00 CRR
5 5 860 102 1 KURLAND WTW,WATER SUPP,BOREHOL 877 193.00 1 754 386.00 MIG
5 5 860 103 1 UDP KRANSHOEK WATER SUPP-GRANT 1 754 386.00 2 631 579.00 MIG
5 5 860 105 1 NEW NATURESVALLEY RES&PIPELINE 500 000.00 2 000 000.00 CRR
5 5 860 107 1 DISTRIBUTION SYSTEMS-CRR 2 525 000.00 3 241 000.00 CRR
5 5 860 108 1 BULK SUPPLY SYSTEMS-GRANT
5 5 860 109 1 BULK SUPPLY SYSTEMS-CRR 1 695 000.00 1 800 000.00 CRR
5 5 860 200 1 WDM:TELEMETRY@RESERV&PUMPSTATI 570 000.00 200 000.00 70 000.00 CRR
5 5 860 207 1 PUMP STATION EQUIPMENT-EFF 500 000.00 500 000.00 500 000.00 External Loans
74 568 704.00 69 215 341.00 66 261 495.00
81 515 216.00 71 719 341.00 67 051 495.00
-6 946 512.00 -2 504 000.00 -790 000.00

Page | 139

Page | 140

Revised integrated development plan
CounlResolution
Council resolution:
CHAPTER 7: SECTOR PLANNING
Bitou Municipality is responsible for the execution of municipal functions as specified in
Schedule 4B and 5B of the Constitution. All the strategic planning processes to address
these functions should be aligned and fully integrated to ensure sustainable growth and
development. It is therefore required that all the sector plans are considered as these plans
should guide the departments on specific issues to be addressed during planning and
implementation of the IDP.
7.1 MUNICIPAL FUNCTION
The Municipality is responsible for delivering the following services:
Municipal Function Municipal Responsibility
Constitution Schedule 4, Part B functions:
Air pollution Community Services
Building regulations Strategic Services
Electricity reticulation Municipal Services &
Infrastructure Development
Fire fighting services Community Services
Local tourism Strategic Services
Municipal planning Strategic Services
Municipal public transport
Municipal Services &
Infrastructure Development /
Community Services
Municipal public works only in respect of the needs of municipalities in the
discharge of their responsibilities to administer functions specifically
assigned to them under this Constitution or any other law
Municipal Services &
Infrastructure Development
Storm water management systems in built-up areas Municipal Services &
Infrastructure Development
Trading regulations enforcement Community Services
Water and sanitation services limited to potable water supply systems and
domestic waste-water and sewage disposal systems
Municipal Services &
Infrastructure Development
Constitution Schedule 5, Part B functions:
Beaches and amusement facilities Community Services
Billboards and the display of advertisements in public places Strategic Services
Cemeteries, funeral parlours and crematoria Community Services
Cleansing Community Services
Control of public nuisances Community Services
Local amenities
Municipal Services &
Infrastructure Development /
Community Services
Local sport facilities Community Services
Municipal parks and recreation Community Services

Page | 142
Municipal Function Municipal Responsibility
Municipal roads Municipal Services &
Infrastructure Development
Noise pollution Community Services
Public places Community Services
Refuse removal, refuse dumps and solid waste disposal Community Services
Street trading Strategic Services
Street lighting Municipal Services &
Infrastructure Development
Traffic and parking Community Services
Table 43: Municipal Functions
7.2 SECTOR PLANS
The sector plans focus on specific sectors within the context of local government. The alignment of
sector plans between all spheres of government is important in ensuring integration of programmes
and maximum utilization of available resources.
The following table highlights the status of the sector plans where after each of the sector plans are
discussed in more detail:
SECTOR PLAN STATUS OF PLAN DATE
APPROVED
DATE WHEN
REVIEW IS DUE
COUNCIL
RESOLUTION
NUMBER
Air Quality Management
Plan In place 27/06/2013 2017
C/4/47/06/13
Disaster Management
Plan
1st Level Disaster
Management Plan approved
New plan to be developed for
Council approval
2008 September 2013
M4/02/08
Electricity Master Plan Approved and in process of
being implemented March 2013 2016
C/5/18/06/12
HIV/Aids Policy The policy was approved and
need urgent revision.
Approved 26
March 2009 Lack resources
Integrated Coastal
Management Strategy
The Municipality does not yet
have a strategy but
collaborated with Eden DM
when Eden drafted a District
plan.
October 2012 2013/14
Integrated Human
Settlement Plan
The IHSP was approved by
Council August 2013 Ongoing
M/4/48/08/13
Integrated Waste
Management Plan
The draft 2nd generation
IWMP was approved by
Council and
September
2013 Annually
M/4/50/09/13
Local Economic
Development Strategy
and LED
Implementation Plan
Are Approved March 2012 Annually
M/64/03/12
Local Integrated
Transport Plan
The Revised LITP was
approved by Council (revised
chapters 3,6, 8)
May 2013 Annually
C/5/32/05/13
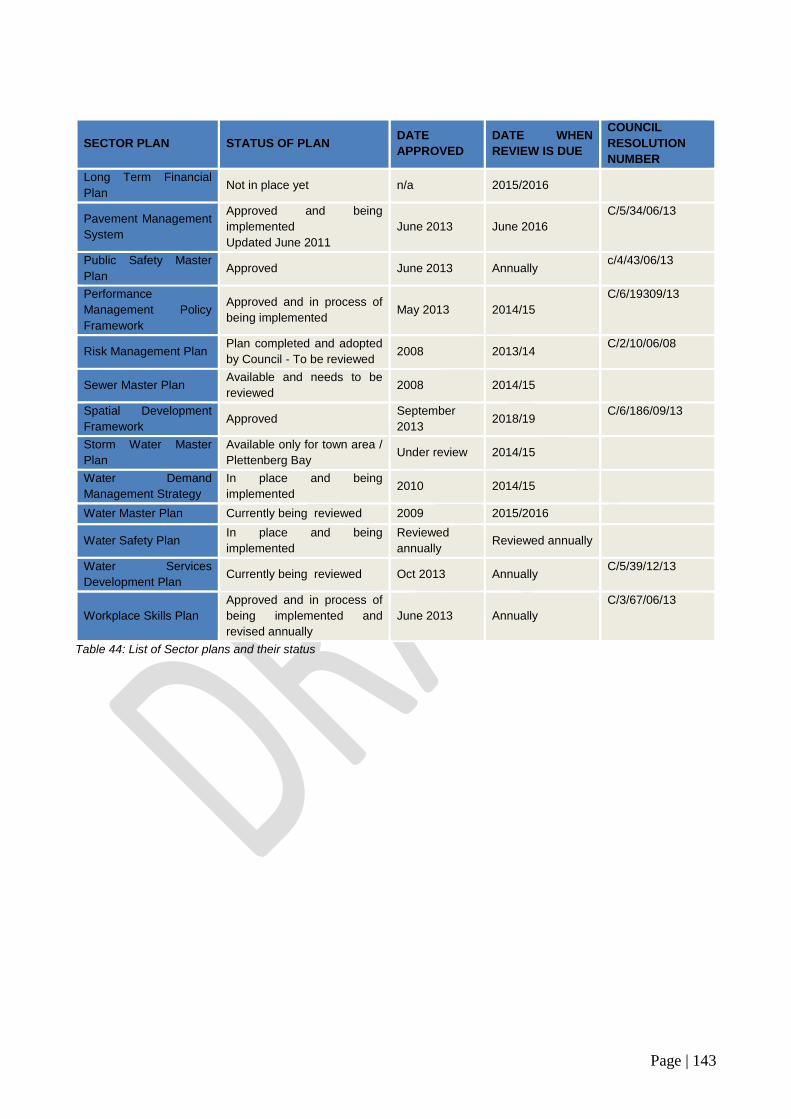
Page | 143
SECTOR PLAN STATUS OF PLAN DATE
APPROVED
DATE WHEN
REVIEW IS DUE
COUNCIL
RESOLUTION
NUMBER
Long Term Financial
Plan Not in place yet n/a 2015/2016
Pavement Management
System
Approved and being
implemented
Updated June 2011
June 2013 June 2016
C/5/34/06/13
Public Safety Master
Plan Approved June 2013 Annually
c/4/43/06/13
Performance
Management Policy
Framework
Approved and in process of
being implemented May 2013 2014/15
C/6/19309/13
Risk Management Plan Plan completed and adopted
by Council - To be reviewed 2008 2013/14
C/2/10/06/08
Sewer Master Plan Available and needs to be
reviewed 2008 2014/15
Spatial Development
Framework Approved
September
2013 2018/19
C/6/186/09/13
Storm Water Master
Plan
Available only for town area /
Plettenberg Bay Under review 2014/15
Water Demand
Management Strategy
In place and being
implemented 2010 2014/15
Water Master Plan Currently being reviewed 2009 2015/2016
Water Safety Plan In place and being
implemented
Reviewed
annually Reviewed annually
Water Services
Development Plan Currently being reviewed Oct 2013 Annually
C/5/39/12/13
Workplace Skills Plan
Approved and in process of
being implemented and
revised annually
June 2013 Annually
C/3/67/06/13
Table 44: List of Sector plans and their status

Page | 144
7.2.1 SPATIAL DEVELOPMENT FRAMEWORK SUMMARY
A Municipal Spatial Development Framework (MSDF) is a five year development strategy
required in terms of the Municipal Systems Act 32 of 2000 and forms part of the Integrated
Development Plan (IDP). The main aim of the MSDF is to clearly outline the spatial status
quo of the Municipality, identify the opportunities and threats and then set out the local
authority’s goal, strategies and supporting policies in achieving medium - and long term
growth. It must give spatial expression on the Municipality’s service delivery and
development agenda. Furthermore it clarifies and directs development and management
activities in urban and rural areas in alignment with National and Provincial spatial policies
and legislations.
In June 2013, Bitou Council approved the new MSDF for 2013 -2017, which was then sent
to the MEC together with the IDP for consideration and approval. The MSDF will be reviewed
in 2017 to incorporate newly approved developments, capital investment framework of the
municipality and to spatially reflect the future IDP Projects. The vision of the MSDF is to
make Bitou the Garden Route’s sustainable playground for the benefit of all. In order to
achieve the municipal vision of the MSDF, short and medium term goals/objectives must be
identified together with an implementation plan for all identified projects. The objectives of
the Bitou Municipal SDF can be summarised as follows:
Facilitating, but with spending the minimum of public resources, the
Increase of attractions that attract wealthy residents; – these include,
conserving the natural environment, promoting accessibility through the
upgrading of the airport and installing excellent IT services, and more golf
courses, polo facilities, MTB and hiking trails, accommodation and
restaurant venues;
Making sure that every effort is made to broaden access to economic
opportunities spinning off this wealthy core market, e.g. compulsory
caddies on golf courses, street markets and public transport
interchanges integrated into shopping centres, township retail that is
easily accessible to external passing traffic;
Ensuring that this strengthening of attractions is not done at the expense
of the natural or social environment. For example, any further golf
courses should follow Audubon or similar concepts
making maximum use of natural vegetation and minimum consumption
of water or use recycled waste water, similar principle should apply to
polo fields including using hardy indigenous grasses such as Buffalo
rather than Kikuyu;
Directing the majority of public resources to ensure that the settlements
work as well as possible for the poor and middle income groups. This
includes planning and implementing development programs such as
Coming Together and extending this approach to other settlements such
as Kranshoek, Kurland and Wittedrift;

Page | 145
Agriculture, although a minor economic sector in the Bitou economy remains important as a
creator of low skilled jobs. The limited amount of arable land means that protection and
better use of this resource should occupy a high priority. The Bitou MSDF advocates
integration of various areas to create a well-functioning space economy. The Bitou MSDF
strategies are divided according to different settlement areas due existing spatial patterns
and varying characteristics of settlement areas namely Kurland, Keurbooms, Wittedrift,
Plettenberg bay and Kranshoek.
7.2.1.1. Summary of SDF per settlement
7.2.1.1.1. Kurland
The SDF proposes two nodes in Kurland linking Kurland estate to the west with Kurland
village to the east at the existing intersection along the N2 with Kurland garage and Kurland
hotel. The Kurland hotel intersection can be reinforced by closing the current Nature’s Valley
intersection on the side of the long curve on the N2 and linking it with this intersection. A
service road with low key commercial and light industries is also proposed into Kurland.
Upmarket urban development can be considered on the side of Kurland polo estate abutting
the N2. With an audited housing demand of approximately 670 houses, there is adequate
land for housing and surplus space for future development. Kurland will be developed on
the principle of walking distance to facilities and services.
Figure 25: Proposed Kurland Spatial Development Proposals Figure 26: Proposed Kurland Spatial Development Proposals

Page | 146
7.2.1.1.2. Keurbooms
The road to Keurbooms strand, the first road to Keurbooms beach as well as the old N2
should be declared as scenic routes. The flood plain should be kept clean of urban
development and it should be encouraged within its fringes. A low key node around the farm
stall is proposed where Keurbooms river access road intersects with the N2 for periodic
markets. A balance has to be found between utilising the most attractive sites and complying
with the coastal setback lines.
7.2.1.1.3. Wittedrift
Figure 27: Proposed Keurbooms development proposals

Page | 147
Figure 28: Wittedrift Spatial Development Proposal
Wittedrift should be developed and promoted on the principles of;
Walking distance as the primary measure of accessibility
Functional integration
Socio economic integration
Urban design, landscape architectural guidelines are required to minimise negative visual
impacts on the landscapes. Within the urban edge critical biodiversity areas should be
managed as municipal nature reserves. It is proposed that all future development be
concentrated on both sides of the main access road creating a stronger image and sense of
arrival within Wittedrift. The land on top of the ridge can be considered for upmarket
development to strengthen support for businesses and facilities. Another business node is
proposed at the intersection of Green Valley.

Page | 148
7.2.1.1.4. Plettenberg Bay
Figure 29: Plettenberg Bay Spatial Development Proposal
Plettenberg Bay Continue to promote development and densification of the current urban
settlements but ensure that ubiquitous development typologies such as standard shopping
centre or house and apartment design found elsewhere in the country are not repeated so
as to not weaken the sense of place. There is more than enough land to cater for the housing
backlog in Kwa-Nokuthula and new horizon. The two settlements require 2700 houses and
a surplus of 1700 houses can be provided. The opportunity should be taken to create new
precedent setting mixed income mixed use projects with different housing typologies and
other land uses on identified future development areas. Infill developments are supported to
effect Integration of all existing settlements around Plettenberg area. Several mixed use
nodes are also proposed to cater for scattered settlements.

Page | 149
7.2.1.1.5. Kranshoek
In order to reinforce the sense of linkage and integration, future township development
should prioritise creating a linear corridor towards the Robberg road intersection before
spreading laterally. The Municipality must acquire land on either side of the access road
until Robberg road. A node is proposed at the intersection of Kranshoek road and Robberg
road. The node could include the proposed heritage centre, a farm stall as well as the
farmers market selling produce from the surrounding farms. Another resort node should
also be developed between the southern boundary and the rocky headland to the south.
7.2.1.2. Priority actions and projects
Bitou’s approved SDF proposes development of six mixed use activity nodes in different
settlements along the National Road (N2). Development of scenic activity corridors linking
the existing townships of Kwa-Nokuthula and New Horizon with the rest of Plettenberg Bay
was also proposed in the SDF. Due to stringent budgets, lack of capacity and resources,
Bitou Municipality is unable to develop precinct plans and tourism corridors for all proposed
nodes and will have to identify areas of need and prioritise the development of local plans.
Ladywood, Kurland and Nature’s Valley were identified as priority areas for development of
Local Area Plans.
7.2.1.2.1. Ladywood Corridor Precinct
Ladywood including areas of Kwa-Nokuthula and New Horizon, was identified as an urban
precinct requiring development of an activity corridor linking the settlements with the rest on
Figure 30: Kranshoed Spatial Development Proposal

Page | 150
Plettenberg Bay. The area constitutes a large number of Bitou’s population with over 24 000
people residing in the area.
Figure 31: Kwa-Nokuthula/New Horizon proposed Spatial Development Corridor
a) Scope of Work
The proposed corridor precinct plan will integrate the proposed central cemetery (currently
under investigation) to be developed around Ebenezer, the proposed transfer station and
the Kwa-Nokuthula land identified for housing. It will outline objectives, best possible uses
and vision for Ladywood. The precinct plan will attempt to incorporate all development
projects identified in the IDP within the proposed area. The plan should align with Human
Settlement Plan (HSP) and all other development plans for Bitou Municipality that are
relevant for this area. The plan will serve as a guiding framework for the municipality when
making decisions on land development applications.
b) Estimated Cost and Duration
The development of Kwa-Nokuthula/New Horizon corridor precinct plan is estimated to cost
around six hundred thousand rand (R600 000.00) inclusive of all expenses. The plan was
not budgeted for in the 2014/2015 financial year. In September 2013, attempts by the Bitou
Municipality to get assistance from the Department of Rural Development and Land Reform
(DRDLR) was not successful due to DRDLR not funding any spatial project in the 2014/2015
financial year. The Municipality will continue to request funding from DRDLR and many

Page | 151
other relevant departments for the development of this precinct plan in the 2015/2016
financial year if not budgeted for by Council.
7.2.2.1.2 Kurland Precinct Plan
Kurland, with characteristics of a rural community in the vicinity on the N2 was identified as
a priority area which would require immediate development of a precinct plan. The area
consists of a population of around 5000 low income residents. There are a number of tourism
facilities in the area which broaden development potential for Kurland community.
Figure 32: Kurland Development Corridor
a) Proposed Scope of Work
The proposed Kurland precinct should not only cover the existing Kurland settlement but will
include the polo fields on the other side of the N2 as proposed in the approved SDF.
Amongst other things, the plan will include the Crags area and a study to recommend the
best possible use of agricultural land that exists in and around Kurland area. It will link the
existing tourism facilities and other local economic opportunities i.e. the filling station and
Kurland Bricks and Timber which provides most of the employment in the area. Kurland
should be developed based on the principle of walking distance to facilities, thus a mixed
use node with facilities is proposed in proximity of the N2.
b) Estimated Cost and Duration
The development of Kurland Precinct node is estimated to cost around three hundred
thousand (R300 000.00) inclusive of all expenses. The Municipality did not budget for the
development of Kurland precinct plan in the 2014/2015 financial year and thus alternative

Page | 152
sources would be required. Kurland will also be included in the projects to be funded by
DRDLR.
7.2.2.1.3 Nature’s Valley Local Area Spatial Plan
The Bitou Council approved the development of Nature’s Valley Local Spatial Area Plan
(NVLSAP) as a priority project. In 2009, the Nature’s Valley Ratepayers Association
appointed a service provider to develop a Nature’s Valley Local Area Spatial Plan. The draft
plan covers the entire area of Nature’s Valley. The plan was then advertised and circulated
to relevant government and non-governmental organisations for comments. The plan will be
finalised and presented to Council for adoption as a priority project.
Figure 33: Nature’s Valley Area
7.2.2. LOCAL ECONOMIC DEVELOPMENT
Bitou Municipal area’s economy is mainly based on the wholesale and retail trade, catering and,
accommodation; construction; finance, insurance, real estate and business services; community,
social and personal services and agriculture and fisheries sectors. In the Municipal Economic Review
and Outlook Report (MERO Report) of 2012 completed by Provincial Treasury, Bitou economy
received a positive rating.
Bitou has been the fastest growing municipal economy in the Eden District, expanding at a rate of
8% per annum, 2000 - 2010. It also created jobs at a rate of 1,2% per annum, despite the adverse
impact of the recession. The most striking feature of the Municipality’s growth is the double digit real
growth rate of the retail, wholesale, catering & accommodation sector, with this sector accounting
for close to 30% of Bitou’s GRDP. Both the size and rate of expansion of this sector reveal the
Figure 33: Natures Valley Area

Page | 153
favourable impact of tourism on the local economy; the sector also created employment (adding a
cumulative net 2 300 jobs over the period 2000 to 2010).
The other large services sub-sector, which also grew strongly (8,3% per annum) and created
employment on a net basis, is the finance, real estate & business services sector. Apart from
services, the Municipality’s manufacturing sector also grew strongly, albeit from a low base; it also
managed to create jobs on a net basis despite the impact of the recession. Bitou also shares in a
general tendency in the Eden District, namely that of a growing agriculture, forestry & fishing sector
with a relatively small real of up to 7,5% per annum over the period 2008 - 2010.
Sector
GDPR
(%
share)
Employment
(number)
GDPR
Year
on
Year
%
Expansion
Year on
Year %
Recession
Year on
Year %
Agriculture, forestry and fishing 4.3 -790 4.2 2.9 7.5
Mining and quarrying 0.1 7 -1.2 2.8 -11.7
Manufacturing 15.1 427 8.5 10.3 3.7
Electricity, gas and water 1 2 0.7 1.7 -28
Construction 11.9 657 11.9 13.4 8
Wholesale and retail trade, catering and
accommodation 29.4
2 254 10.6 13.1 4
Transport, storage and communication 5.8 -21 1.8 4.4 -5.2
Finance, insurance, real estate and
business services 22.7
872 8.3 10.1 3.4
Community, social and personal
services 4.7
469 5.1 6.5 1.3
General government 5.1 353 4.1 4.4 3.5
Total 100 4 230 8 9.6 3.7
Table 45: Sector contribution to the GDP
Municipality’s role and mandate
The purpose of local economic development (LED) is to facilitate the build-up economic
capacity of a local area to improve its economic future and the quality of life for all. Bitou
Municipality has always played a significant role in the economic development of the area
by employing people, purchasing goods and services, developing infrastructure and by
regulating the development of land. The Constitution defines the “promotion of social and
economic development” as one of the key objectives of local government. Local
Government’s development mandate encourages municipalities to seek ways to address
poverty, joblessness and redistribution in their service areas.
Local Tourism
Tourism is outsourced to an existing tourism organisation namely the Plett Voluntary
Tourism Association (PTVA) which acts as an executive and coordination organ for the

Page | 154
promotion of sustainable tourism and tourism development in the municipal area by means
of a strategic partnership with the Municipality. The responsibilities are based on a Service
Level Agreement which includes 3 important areas such as marketing, administration and
development. They receive an annual grant from the Municipality but also receive
membership fees from members who belong to the organisation.
The PTVA utilises a variety of marketing tools to promote the area as a tourist destination,
e.g. its new website; brochures, print media; line advertising; social media; exhibitions;
educational as well as consumer and trade shows.
Name Description
Brand Strategy Develop unique brand and strategy for use by all related stakeholders
Events Marketing Market events outside of Bitou area to draw new investors, visitors and tourists
Brand Marketing Market “Plettenberg Bay and Surrounds” as tourism and investment destination
7.2.3 Municipal infrastructure programme
Bulk infrastructure services are strategic assets that must be managed and improved in a sustainable
manner. The levels of the provision of bulk services within an area is a good indication of the area’s
level of development and contribute to the sub-regional economy in terms of the tourism potential
and industry development.
Adequate and timeous service infrastructure provision is important in supporting the potential growth
for the Bitou municipal area. Provision must also be made in the future planning of the infrastructure
for an increase in the rate of population growth. The revision of the infrastructure management plans
must not only provide for growth, but must also take cognisance of the specific spatial proposals
which are highlighted in the SDF. Furthermore, it is essential that infrastructural services support
and enable development to be undertaken as is proposed in the SDF.
The Municipality should further ensure that the provision of bulk services for industrial development
do not impact negatively on the level of services for household purposes. Furthermore development
applications should be adjudicated in terms of the existing supply capacity of infrastructure and
services in order to ensure that a set of minimum service standards is met. Supply and services
include the water supply sources, proposed sewage treatment and disposal system, electricity
supply, as well as access roads / servitudes.
Prior planning should be carried out to ensure that the needs of the Municipality and community are
balanced with what is practically possible with available human and financial capacity. Therefore
sector planning is important in order to focus on a specific area /service and to guide the Municipality
in what projects need to be initiated and implemented. The sector plans also need to be aligned to
the IDP to ensure that there is holistic planning, integration and alignment of budget processes.
7.2.3.1 WATER MASTER PLAN

Page | 155
Community Engineering Services (Pty) Ltd was appointed in 2008 to compile a water master plan of
the water distribution system for Bitou Municipality. The project was funded by the Department of
Water Affairs and Forestry (DWAF). The process entailed the following:
Computer models for the water systems in Bitou Municipality
Linking these models with the stand and water meter databases of the financial system,
evaluation and master planning of the networks
Posting of all information to an engineering geographic information system (GIS)
The master plan report lists the analyses and findings of the study on the water distribution systems
of all the towns in the Bitou Municipality. Review of the Water Master plan commenced in the
2012/13 financial year and it is due for completion in the 2013/14 financial year.
One of the most important aspects of public health is access to clean water that is suitable for
consumption and domestic use. The Municipality therefore has a public health responsibility to
ensure the provision of safe drinking water. Bitou Municipality has three (3) water treatment plants
situated in Plettenberg Bay, Kurland and Natures Valley. The Municipality’s water reticulation
network consists of 314 069 meters of water main with diameters ranging from 50mm to 500mm.
This network carries treated water from various service reservoirs to consumers within the municipal
area.
With the implementation of a water main replacement program and the replacement of pressure
reducing valves, breakages have been reduced to ± 70 per annum. Communities in the municipal
service area receive water from different water sources and storage facilities which are indicated in
the following table:
Area Ward Water Source & Storage Status Quo
Plettenberg Bay 2
Water Source:
The main supply for Plettenberg Bay is abstracted on a run-of-river basis
from the Keurbooms River. This is supplemented by groundwater and by
the Roodefontein Dam on the Piesang River which is owned by
Department of Water Affairs and operated and maintained by the Bitou
Local Municipality. Groundwater supply to the Plettenberg Bay Water
Treatment Works (WTW) consists of two boreholes that supplement the
water supply during the peak demand months.
The Municipality's central water treatment works is located in Plettenberg
Bay, and treats water from the Keurbooms River, the Piesang River and
groundwater sources. The differences in water chemistry of the various
sources make the treatment process challenging.
The treatment works was upgraded during 2004 and has an operating
capacity of 22Ml per day.
Plettenberg Bay is in dire need for additional water sources, as the current
supply cannot meet the water requirements. The shortfall would increase
to 1,162 million m3/a by 2035 for a low-growth scenario and 6,235 m3/a for
a high-growth scenario.
The Desalination Plant supplies 2 ML/Day for a period of 5 months of the
year. Production starts 1st December and ends 30 April.
Water Storage:

Page | 156
Area Ward Water Source & Storage Status Quo
Archiewood Reservoir:
Archiewood reservoir serves the Industrial Area, Formosa Garden Village
and part of the Bowling club area.
The water source for the Archiewood reservoir is the Plettenberg Bay
water treatment works
Reservoir capacity = 2 ml
Brackenridge Reservoir:
The Brackenridge reservoir serves the Brackenridge development area
The water source for the Brackenridge reservoir is the Plettenberg Bay’s
water treatment works
Reservoir capacity = 4 ml
Tower Reservoir:
The Tower reservoir serves Plettenberg Bay central, Police Station and
Cutty shark area.
The water source for the Tower reservoir is the Plettenberg Bay’s water
treatment works
Reservoir consists of three reservoirs with the following capacity:
Booster reservoir = 2 ml
Concrete reservoir = 3ml
Town Reservoir:
The Town reservoirs serve the greater Plettenberg Bay town area. It
consists of three reservoirs.
The water source for the Town reservoir is the Plettenberg Bay water
treatment works
Reservoir consists of three reservoirs with the following capacity:
Reservoir A = 2.5 ml
Reservoir B = 2.5 ml
Reservoir C = 3.5 ml
New Horizon 4
Water Source and Storage:
The New Horizon reservoir serves the community of New Horizon and
Castleton complex and it consists of two concrete reservoirs.
The water source for the New Horizon reservoir is the Plettenberg Bay
water treatment works and three boreholes.
Reservoir capacity:
Concrete reservoir = 2 ml
Concrete reservoir = 3ml
Kwa-Nokuthula 4; 5; & 6
Water Source and Storage:
The water source for the Kwa-Nokuthula reservoirs is the New Horizon
reservoir which in turn gets its water from Plettenberg Bay water treatment
works.
The Kwa-Nokuthula reservoir serves the community of also known as
Hillview.
It consists of two steel tower reservoirs and two concrete reservoirs
Reservoir capacity:
Steel reservoirs = 500kl each
Concrete reservoir = 2 ml
Concrete reservoir = 3ml
New concrete Reservoir = 3.5 ml

Page | 157
Area Ward Water Source & Storage Status Quo
Kurland 1
Water Source:
The main water supply for Kurland is run-off from the Wit River.
Statistical data shows a demand which is under the design capacity of the
water treatment works. The permitted abstraction from the Wit River is 360
ML/ per annum and the average annual demand is 180ML/ per annum.
Water Storage:
The Kurland reservoirs are situated in the Kurland area and serve Kurland
village, hotel and polo area.
The water source for the reservoirs is the Kurland water treatment works
that gets its water supply from the Wit River.
Reservoir capacity:
Reservoir 1 = 1 ml
Reservoir 2 = 2.5 ml
Keurbooms 1
Water Source and Storage:
The Keurbooms top reservoir supply the Keurbooms Strand area with
water
The water source for the Keurbooms top reservoir is the Matjies reservoir
Reservoir capacity = 1 ml
Wittedrift 1
Water Source and Storage:
The Wittedrift reservoir supplies the Wittedrift community and Green
Valley reservoir with water
The water source for the reservoir is the Goose Valley reservoir
Reservoir capacity = 500 kl
Green Valley 1
Water Source and Storage:
The Green Valley reservoir supplies the community of Green Valley with
water
The water source for the reservoir is the Wittedrift reservoir
Reservoir capacity = 600 kl
Goose Valley 1
Water Source and Storage:
The Goose Valley reservoir serves the Goose Valley golf course
development, the Matjiesfontein reservoir and Wittedrift reservoir
The water source for the Keurbooms top reservoir is the Matjies reservoir
Reservoir capacity = 3.5 ml
Natures Valley 1
Water:
The main water supply for Nature’s Valley is abstracted from a natural pool
on the Groot River using a floating intake.
Statistical data shows a demand which is well under the design capacity of
the water treatment works. The permitted abstraction from the Groot River
is 1Ml/day (water services development plan – page 48), due to low
consumption only about 0.25ML/day is abstracted.
Water Storage:
The Natures Valley reservoir provides water to Natures Valley village, De
Vasselot Camping Resort and Tsitsikamma National Park.
Reservoir capacity = 600 kl
Harkerville Area 7
Water Source and Storage:
The source is the borehole which is situated inside the fence of the
reservoir
Harkerville reservoir serves the Harkerville rural area.

Page | 158
Area Ward Water Source & Storage Status Quo
Reservoir capacity = 100kl
Kranshoek 7
Water Source and Storage:
The water source for the reservoirs is the Brakkloof reservoir which in turn
gets its water from Plettenberg Bay’s water treatment works.
Three (3) reservoirs serve the community of Kranshoek
Reservoir capacity:
Concrete reservoir = 600kl
Steel reservoir = 500kl
Header reservoir = 1,5ml
Brakkloof 2
Water Source and Storage:
The Brakkloof reservoir supplies part of Longships Drive and Robberg
Road areas as well as Robberg en Kranshoek reservoir.
The main water source for the reservoir is the Plettenberg Bay water
treatment works and Airport borehole
Reservoir capacity = 6 ml
Robberg 2
Water Source and Storage:
The Robberg reservoir is situated on the Robberg quarry and the water
source for the reservoir is the Brakkloof reservoir
It supplies the Robberg End and Whale Rock Ridge development areas
Reservoir capacity = 3 ml
Whale Rock 2
Water Source and Storage:
The Whale Rock reservoir is inside the Whale Rock area and the water
source is the Keurbooms River.
It supplies water to Whale Rock Gardens and Whale Rock.
The main water source for the reservoir is the Plettenberg Bay water
treatment works. It can also get water from the Robberg reservoir.
Reservoir capacity = 2 ml
Uplands
balancing tanks 1
Water Source and Storage:
The Uplands balancing tanks are situated on the Plettenberg Bay Game
Reserve
It supplies water to the Plettenberg Bay’s water treatment works
Tank capacity :
Tank 1 = 1 ml
Tank 2 = 3 ml
Table 46: Bitou Water Sources and Status
The augmentation programme is on target and such programme provides for future demand
and growth in usage, including diversity in terms of water resources. MIG funding is primarily
used for this programme. The main challenge is to secure funding for the off-channel raw
water storage facility (Wadrift Dam) and feasibility studies is now underway to explore RBIG
funding for this purpose. Raw water storage is a vital component of the augmentation
programme, whereby water from the Keurbooms will be pumped and stored in the facility
during off-peak and seasonal periods.
The recent droughts highlighted the weakness by dependence on surface water only. Other
sources such as ground water and seawater have been explored to supplement and
enhance the security of this commodity. In future more emphasis need to be placed on

Page | 159
alternative sources and a ratio of 50/50 has developed – i.e. 50% (groundwater, seawater
and re-use of sewer effluent) – to enable sufficient water to satisfy demand patterns.
The Municipality has already experienced problems in meeting the water demand because
of a number of dry years. There is a need to augment storage capacity to ensure continuity
of supply. Construction of additional storage dams and pump stations will be required to
maintain an adequate supply of water. A desalination plant was constructed which yields as
an additional resource.
The large low-income and indigent population stresses available capital and operational
funding and the Municipality depends on grants from other spheres of government to supply
services to this section of the population. MIG funding is utilized for bulk water provision
projects. The challenge has always been adequate funding to maintain the water
infrastructure assets. As a result some of the infrastructure is giving in, especially old
asbestos cement pipes. Leaking results in water losses in the system. The MSID is however
proactive in using whatever resources are available to try and curb these losses. The
Demand Management Strategy is used to address the issues. A telemetry system is in place
to monitor flow levels in all reservoirs in order to avoid water losses. Under the operational
budget, some bulk water meters were replaced due to age and inaccurate readings.
Bitou received a Blue Drop Certificate for its water treatments works in Plettenberg Bay with
an overall score of 98,75 per cent and full compliance with drinking water standards during
the 2012 evaluation.
Plant Description Year of Assessme
2010 2011 2012
Plettenberg Water Treatment Works 97.85 96.19 97.76
Kurland Water Treatment Works 95.55 95.00 97.38
Natures Valley Water Treatment Works 96.35 95.00 97.76
Table 47: Blue drop awards
The Municipality has identified the following actions to address water challenges within the municipal
service area:
Outcome / Response Required Municipal Action
Address unaccounted water losses (internal
transmission losses ± 37%)
Install meters to measure daily production of clean
water(Kurland and Natures Valley WTW)
Attend to water leakages at storage reservoirs
(Kurland and Natures Valley WTW)
Limit technical losses to not more than 15%
Challenges with filters that may compromise water
quality during heavy rainfall
Reinstatement of Ozone Clear Process
(generator) - (Natures Valley water treatment
works - completed)
All areas under Bitou’s service area jurisdiction have
access to clean water
Planning to address the backlogs with the funding
received from the Provincial Government

Page | 160
Outcome / Response Required Municipal Action
Water backlogs – specify wards Backlogs addressed with roll out of housing
program.
Blue drop status Comply with assessment requirement
Operational and maintenance plan Operational plans to be implemented within the
available budget.
Water Master Plan Review and updating completed in 2014/15
Water Demand Management Strategy Review and implementation of strategy
Off-channel storage dam (Wadrif Dam)
Strengthen intergovernmental liaison with national
& provincial sector departments and neighbouring
municipalities.
EIA was finalised in 2014/15 but subject to an
appeal submitted by the PBCEF
Land acquisition
Construction of dam
Maintenance of infrastructure Complete Phase 1 and 2 New Kwa-Nokuthula
rising main to 3,5 Mega litre reservoir
Maintenance of infrastructure Replacement of AC pipes (reticulation and
upgrade)
Maintenance of infrastructure New rising main from Roodefontein to Water
Treatment Works
Maintenance of infrastructure Upgrade Oxi to ozone generators
Maintenance of infrastructure Complete Phase 3 of the upgrade of the water
supply and abstraction system in Keurbooms River
Maintenance of infrastructure Install surge tank
Maintenance of infrastructure Installation of suction booster system
Maintenance of infrastructure
Replacement and improvement of Whale Rock
pumping scheme and associated drainage
networks
Maintenance of infrastructure Upgrade inlet works for the Kurland Treatment
Works
Maintenance of infrastructure
Provide additional security measures and
generators at vulnerable sites to mitigate against
the impact of continued vandalism and load
shedding
Maintenance of infrastructure
Provide additional security measures and
generators at vulnerable sites to mitigate against
the impact of continued vandalism and load
shedding
Table 48: Implementation of water master plan
7.2.3.2. STORMWATER
The major storm water system of Bitou Municipality’s service area consists of all natural
water ways, including springs, streams, rivers, wetlands and dams. It includes detention and
retention dams and other devices constructed to control storm water. Roadways and their
associated drainage structures are part of the major storm water system if they result in a
significant deflection of storm water from its natural overland flow path.

Page | 161
The minor storm water system consists of any measures provided to accommodate storm
water runoff within sites and road reserves and convey the runoff to the major storm water
system. These measures include gutters, conduits, beams, channels, road verges, small
watercourses and infiltration constructions.
Storm water runoff should not be concentrated to an extent that would result in any damage
to the environment during storms with a probability frequency more than 1 in 10 years and
would result in only minor, repairable damage in storms with a probability frequency more
than 1 in 50 years. All elements of the built and natural environment must be able to
withstand a 1 in 100 year storm event without significant consequential loss and risk to
property and life. Note that a “storm frequency” equates to a “probability of occurrence” of a
storm event that should be used to assess the annual budget or insurance provision for
remedial works, should the event occur.
In all catchments, the water courses and built storm water infrastructure must be maintained
in a clean state, free of any rubbish, debris and matter likely to pose any pollution threat to
the lower reaches of the water courses.
The as built info collection of all the areas in Bitou Municipality is in progress. This will
determine the requirements of needed storm water upgrading caused by funding
constraints. The strategy was to develop a Storm Water Master Plan which is currently being
implemented. Funding in the current financial year 2014/15 will allow for the investigation
and planning of the Kranshoek storm water system and the other areas to follow in future
years.
Master drainage planning should be contemplated on a catchment-wide basis, irrespective
of urban and other man-made boundaries. The full environmental impact of the storm water
on that catchment must be investigated and is the responsibility of the controlling regional
or local authority. The hydrological processes in the specific area need to be investigated
and statistical data obtained. Hydraulic routing of the storm water must be considered. In
analysing storm water drainage, consideration may need to be given to the use of open
spaces like parks, sports fields, and transport circulation routes. It is assumed that with
development there is an increase in both the overall quantity and the peak flow rate of the
runoff.
The stormwater management philosophy encourages the following:
Maintain adequate ground cover at all places and at all times to negate the erosive
forces of wind, water and all forms of traffic.
Prevent concentration of storm water flow at any point where the ground is
susceptible to erosion.
Reduce storm water flows as much as possible by the effective use of attenuating
devices.

Page | 162
Ensure that development does not increase the rate of storm water flow above that
which the natural ground can safely accommodate at any point in the sub-
catchments.
Ensure that all storm water control works are constructed in a safe and aesthetic
manner in keeping with the overall development theme for the area.
Prevent pollution of waterways and water features by suspended solids and dissolved
solids in storm water discharges.
Contain soil erosion, whether induced by wind or water forces, by constructing
protective works to trap sediment at appropriate locations. This applies particularly
during construction.
Avoid situations where natural or artificial slopes may become saturated and
unstable, both during and after the construction process.
The Municipality has identified the following actions to address storm water challenges
within the municipal service area:
Outcome / Response Required Municipal Action
Development of Storm Water Master Plan
Storm Water Master Plan for the whole Bitou area to
guide the maintenance of existing systems and the
provision of new capital infrastructure where
required.
Address storm water needs
Storm water upgrades in the following areas – Kwa-
Nokuthula, New Horizon, Kranshoek, Green Valley,
Wittedrift, Kurland,
Maintenance of infrastructure New storm water pipe improvements
Table 49: Implementation of storm water master plan
The estimated cost to address storm water demands will be addressed in the Storm Water Master
Plan.
7.2.3.3. SEWERAGE
In September 2008, Community Engineering Services (Pty) Ltd compiled the Sewer Master Plan for
the sewer distribution system for Bitou Municipality. The development of the master plan was funded
by the then Department of Water Affairs and Forestry (DWAF). The plan contains computer models
for the sewer systems in Bitou Municipality, linking these models with the stand and water meter
database of the municipal financial system, evaluation and master planning of the networks, and
posting of all information to an engineering Geographic Information System (GIS). The master plan
report lists the analyses and findings of the study on the sewer distribution systems of all the towns
within the Bitou Municipality. As with water services provision, the challenge has always been
adequate funding to maintain the sewer infrastructure assets, as a result some of the infrastructure
is deteriorating. A telemetry system is in place in certain areas like pump stations and treatment
works to avoid sump overflows, which might result in spills into streams and the ocean causing an
environmental hazard.
Area Ward Waste Water Treatment Works (WWTW): Capacity & Status Quo
Gansvlei 2 Wastewater from Plettenberg Bay is treated at the Gansevallei WWTW.

Page | 163
Area Ward Waste Water Treatment Works (WWTW): Capacity & Status Quo
It has an average capacity of 6,25 Ml/day and a peak capacity of 9 Ml/day. The total
volume of water treated per year is 3 200 Ml.
The WWTW is currently being upgraded to cater for a peak hydraulic capacity of 14
Ml/day.
Kurland 1
Waste water from Kurland Village is treated at the Kurland WWTW.
It has an average capacity of 6,5 Ml/day and a peak capacity of 7.5Ml/day. The average daily
flow to the plant is 2.4 Ml/day, therefore only 37% of the design capacity of the WWTW is
currently utilized.
The capacity of the plant is adequate and can serve a community double the size of the
current Kurland Village.
Table 50: Status of wastewater treatment works
The WWTW’s received a Green Drop Score of 79% during the 2011 assessment failing,
only in the category of ‘waste water quality compliance’, which is a concern for potential
water re-use. Bitou’s rating for their waste water treatment works for the past years in the
Green Drop programmes of Department of Water Affairs is summarised in the following
table:
Plant Description Year of Assessment
2009 2010 2011 2013
Plettenberg Waste Water
Treatment Works 77.5
No
assessment 96.1
98.77
Kurland Waste Water Treatment
Works 79
No
assessment 96.5
99.45
Table 51: green drop ratings
The Municipality has identified the following actions to address sewerage challenges in the
municipal service area:
Outcome / Response Required Municipal Action
Review of waste water master plan Review master plan
Finalize the installation of the telemetry system Budget and procure a maintenance contract for the
telemetry system
Improve access to sanitation services in areas
identified for improvement
In-situ upgrade, de-densification and/or relocation
Accelerate housing provision
Improve green drop status Comply with and improve on assessment requirements
Maintenance of infrastructure Replacement and improvement of Whale Rock pumping
scheme and associated drainage networks
Maintenance of infrastructure Upgrade of Kwa-Nokuthula Outfall sewer
Upgrade of pump stations
Refurbish pump stations in Kwa-Nokuthula:
Pump station 23 was refurbished and new equipment
installed in 2013/14 financial year.
Pump station 2 is currently upgraded to include a new
generator room, aboveground self-priming pumps and an
emergency overflow tank.

Page | 164
Outcome / Response Required Municipal Action
Pump station 3 is to be overhauled in 2015/16 financial
year.
Pump Stations 18, 19 and 20 in Piesang Valley need to
be upgraded to accommodate increased development
challenges.
Upgrade of pump stations
Pump Stations 18, 19 and 20 in Piesang Valley need to
be upgraded to accommodate increased development
challenges.
Upgrade of pump stations
Relocation of pump station Poortjies:
Pump station 1 was replaced with a new pump station in
a new position and the existing pump station converted
to a storm water pump station to reduce the problems
being experienced in the Poortjies area when heavy rains
are experienced. A new Pump Station (1A) was
constructed on the corner of Beacon Way and Dorothea
Street.
Upgrade of pump stations Beacon Isle pump station was rebuilt in 2013.
Upgrade of pump stations
Kranshoek: New pump station 4 became operational in
2013. Refurbishment required at the other 3 existing
pump stations due to continued vandalism and load
shedding requirements.
Kurland: New pump station became operational in 2013.
Refurbishment required at the other 2 existing pump
stations due to capacity and load shedding requirements.
Maintenance of infrastructure Upgrade inlet works for the Kurland Treatment Works
Maintenance of infrastructure Upgrade of Kwa-Nokuthula outfall sewer
Maintenance of infrastructure
Provide additional security measures and generators at
vulnerable sites to mitigate against the impact of
continued vandalism and load shedding
Table 52 : Waste water management plan programmes
The estimated cost to address wastewater treatment works demand is R5 million.
7.2.3.4. ELECTRICITY
Bitou’s electricity master plan was reviewed in January 2013. The purpose of the Master
plan can be summarised as follows:
a. To identify the HV (66000 volts) and MV (22000 volts and 11000 volts) network
components that need to be augmented to address immediate problems and to cater
for long term load growth and new developments.
b. To serve as a basis for any new construction work so that it can be carried-out in a
planned and phased manner, thus minimizing any abortive work due to a lack of
insight into the future requirements.

Page | 165
c. To provide a network development plan which takes into account all known future
developments in order to avoid unnecessary expenditure through duplication of
network extensions.
The plan further addresses: electrification of informal houses at Qolweni/Bossiesgif (light
industrial area) and all informal areas within Greater Bitou Municipality; electrical losses;
asset management costs (operations and maintenance); energy saving measures; a plan
layout showing municipal area of supply and escalation.
The Master Plan includes the identification of projects, programme and cash flow over a
minimum period of three years. Successes achieved are securing of funds with the
Department of Energy in terms of their Integrated National Electrification Programme and
the first phase of upgrading the electrical infrastructure to Kwa-Nokuthula. The Department
of Energy supported the Municipality in providing funding for specific projects. The
Municipality will strengthen the good relations with the department and ensure all grant funds
are spent to secure additional financial support.
Bitou Municipality receives its electricity supply via a main NMD cable which is a 18 500 kVA
power cable that runs from George. The Municipality has 5 main cable supplies that feed
into various substations located throughout the municipal area.
The Municipality’s strategy is to make electricity available to all households identified within
a year after the requirement has been identified. The top three service delivery priorities are
to complete the planning on time, including additional capacity into the municipal grid, to
ensure that funding is in place for all bulk infrastructure and electricity connections, and to
perform in terms of the standards set during the construction stages.
Measures to improve performance are to work closer with the Human Settlement
Departments, to integrate all functions within the relevant parties involved in the projects,
and to have approved Master Plans in place for the roll out of the projects. This means
working closely with ESKOM as well in ensuring implementation of their projects on time to
provide additional capacity to the town
ESKOM informed the Municipality in writing that electricity supply at Eskom’s Robberg
Substation is experiencing capacity constraints. The 15 MVA transformer at Robberg
Substation has reached its full capacity; therefore, any increase in electricity supply from the
substation cannot take place before a new 20 MVA transformer is commissioned.
Electrification priorities are determined in line with the Municipality’s IDP and Human
Settlements/Housing Programmes. With the exception of Kranshoek and Kurland, where
ESKOM is responsible for electrification, the Municipality is responsible for all other
townships within the municipal area.

Page | 166
Major Towns Notified Maximum
Demand (NMD)
Maximum Demand
Growth (NMD)
Maximum Demand Peak
(NMD)
Plettenberg Bay 18500 kVA -1158 kVA 16 326 kVA
Wittedrift 400 kVA 64 kVA 395 kVA
Keurboomstrand 1700 kVA -186 kVA 1 840 kVA
Natures Valley 1000 kVA -113 kVA 779 kVA
Kwa-Nokuthula 4000 kVA -575 kVA 5 301 kVA
Brakkloof 5000 kVA
Table 53: Electricity notified maximum demand
Some of the distribution transformers are more than 20 years old and corrosive coastal sea
air is taking its toll on the iron parts of the equipment due to rust and oxidisation. In some
cases equipment need refurbishment as well as routine maintenance.
The Municipality will continue with implementation of the Electrical Load Control System in
the municipal area. The system was installed in 1999/2000 in Plettenberg Bay and
Keurbooms to reduce the peak MVA demand at the Eskom bulk supply points and thereby
reducing the cost of purchasing electricity and to create additional supply and capacity.
The Municipality will continue with implementation of Phase 2 (installation of 1500 switches)
and Phase 3 (installation of 1500 switches) for the total cost of R5.2 million. Funding for this
energy efficiency initiative for energy conservation will be funded by Eskom. A formal
proposal was submitted to Eskom.
The Municipality has identified the following actions to address electricity challenges in the
municipal service area:
Outcome / Response Required Municipal Action
Implementation of Phase 2 & 3 of the Electrical Load
Control System
Formal communication with Eskom and follow up on
funding request
Address unaccounted electricity losses Limit unaccounted losses to not more than 10%.
Replace faulty meters with pre-paid meters
Address illegal connections Public awareness campaigns
Deliver electricity to all households at affordable
rates Actions to minimise electricity losses
Maintenance of substations and mini-substations Implementation of maintenance schedules
Network challenges Development network maintenance plan
Sufficient and efficient human resource capacity Create critical post on organogram (electricians and
fitters)
Maintenance of infrastructure New electricity connections for Kwa-Nokuthula and
Bossiesgif/Qolweni
Maintenance of infrastructure New substation for Kwa-Nokuthula
Maintenance of infrastructure Upgrade MV cables Plett
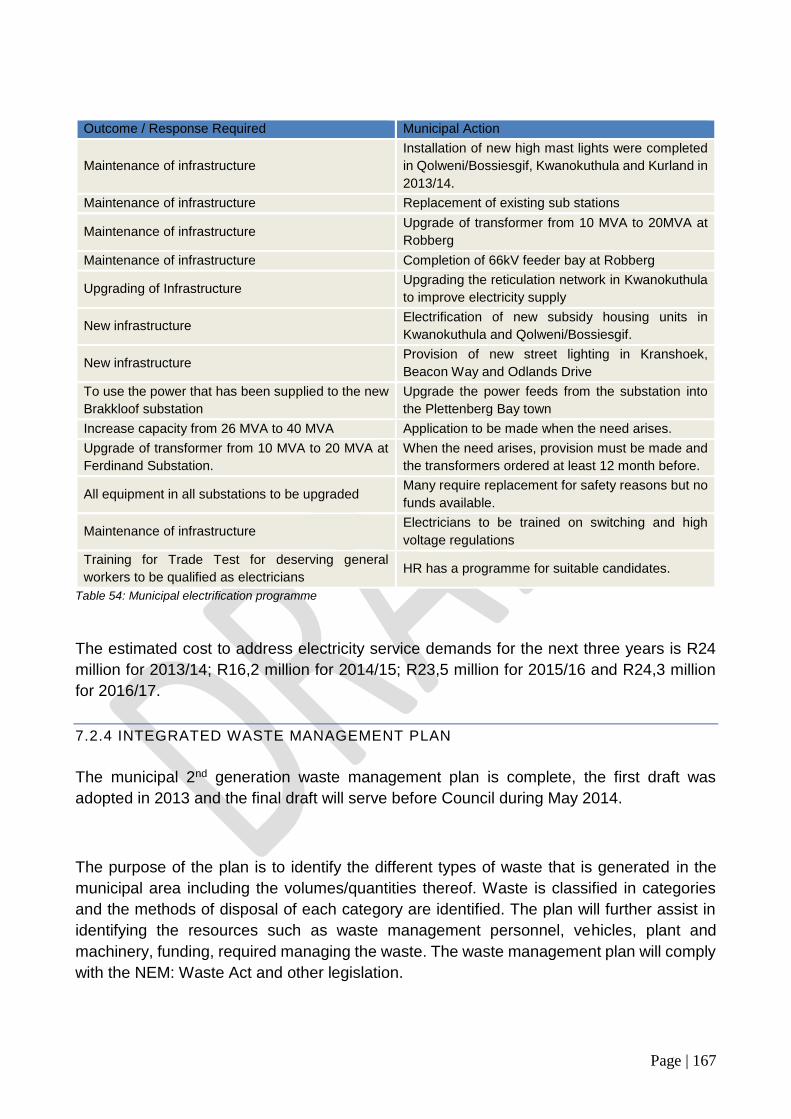
Page | 167
Outcome / Response Required Municipal Action
Maintenance of infrastructure
Installation of new high mast lights were completed
in Qolweni/Bossiesgif, Kwanokuthula and Kurland in
2013/14.
Maintenance of infrastructure Replacement of existing sub stations
Maintenance of infrastructure Upgrade of transformer from 10 MVA to 20MVA at
Robberg
Maintenance of infrastructure Completion of 66kV feeder bay at Robberg
Upgrading of Infrastructure Upgrading the reticulation network in Kwanokuthula
to improve electricity supply
New infrastructure Electrification of new subsidy housing units in
Kwanokuthula and Qolweni/Bossiesgif.
New infrastructure Provision of new street lighting in Kranshoek,
Beacon Way and Odlands Drive
To use the power that has been supplied to the new
Brakkloof substation
Upgrade the power feeds from the substation into
the Plettenberg Bay town
Increase capacity from 26 MVA to 40 MVA Application to be made when the need arises.
Upgrade of transformer from 10 MVA to 20 MVA at
Ferdinand Substation.
When the need arises, provision must be made and
the transformers ordered at least 12 month before.
All equipment in all substations to be upgraded Many require replacement for safety reasons but no
funds available.
Maintenance of infrastructure Electricians to be trained on switching and high
voltage regulations
Training for Trade Test for deserving general
workers to be qualified as electricians HR has a programme for suitable candidates.
Table 54: Municipal electrification programme
The estimated cost to address electricity service demands for the next three years is R24
million for 2013/14; R16,2 million for 2014/15; R23,5 million for 2015/16 and R24,3 million
for 2016/17.
7.2.4 INTEGRATED WASTE MANAGEMENT PLAN
The municipal 2nd generation waste management plan is complete, the first draft was
adopted in 2013 and the final draft will serve before Council during May 2014.
The purpose of the plan is to identify the different types of waste that is generated in the
municipal area including the volumes/quantities thereof. Waste is classified in categories
and the methods of disposal of each category are identified. The plan will further assist in
identifying the resources such as waste management personnel, vehicles, plant and
machinery, funding, required managing the waste. The waste management plan will comply
with the NEM: Waste Act and other legislation.

Page | 168
A study conducted by the National Department of Environmental Affairs revealed that the
airspace at the Plettenberg Bay landfill site is exhausted and that alternative measures must
be implemented to dispose waste. Currently the Municipality transports waste to PetroSA
facility in Mossel Bay and implement recycling initiatives. The Municipality provides drop off
areas for farm areas where there is no access for the municipal air refuse compactors. The
Municipality introduced a wheelie bin system to residents to improve waste collection and
plastic bags where wheel bins are not provided.
The Municipality has identified the following actions to address waste management
challenges within the municipal service area:
Outcome / Response Required Municipal Action Timeframe
Develop a 2nd generation integrated
waste management plan Approve and implement the plan January 2014
Waste management by-law Develop and approve a waste
management by-law 2014/15
Education of the public pertaining to
waste, new environmental legislation
and waste management procedures and
available facilities
Conduct awareness programme Annually
Review of collection service and
available fleet for the function
Provision and replacement of wheelie
bins Annually
Complete the Waste Transfer Station
Advertise and award tender to
successful bidder
Construction of transfer station
2014 - 2016
Landfill closure
Complete environmental scoping –
submission of required documents to
DEADP
2013 - 2016 Design and tender documentation for
closure
Advertise and award tender to
successful bidder
Drop offs and builders rubble disposal
facilities
Finalise draft basic assessment reports
(DBAR’s)
2013/14 DBAR’s advertised for public comment
Consider comments and finalise final
BAR
Submit final BAR to DEADP
Table 55: Integrated waste management programme
7.2.5 INTEGRATED HUMAN SETTLEMENT PLAN (IHSP)
Page | 169
Bitou Municipality adopted an Integrated Human Settlement Plan in September 2011. During 2012
the Municipality, with assistance of the Build Environment Support Programme (BESP) consultants
CNdV and IQ Vision initiated a process to update and revise the draft Sustainable Human Settlement
Plan (SHSP) into a more credible plan. The primary objective of this initiative was:
“ To draft a “sustainable human settlement plan” that will assist the Municipality by providing sound
strategic context to the issue of housing supply and demand and thereby ensure that residents have
proper access to sustainable housing solutions”.
Bitou Municipality and Provincial Housing Department together with IQ Vision, and the Professional
Resource Team (PRT) drafted a ‘Multi-year Human Settlement Planning and Financials 2012 –
2018’. This plan is registered with the Professional Resource Team. The short term objective is the
provision of basic services and the long term objective to create sustainable human settlements, with
beneficiaries taking greater responsibility. The multiyear plan makes provision for the following:
A multi-year housing plan, high, medium and long term
A municipal housing needs assessment
The identification, surveying and prioritization of informal settlements
The identification of well-located land for housing
The identification of areas for densification
Sustainability criteria on identified land
A project pipeline and detailed implementation plans
Derive linkages between housing and urban renewal and the integration of housing, planning and
transportation frameworks.
The objective of this review process of the IHSP:
a. To ensure effective allocation of limited resources, financial and human, to a wide variety of
potential development initiatives;
b. To ensure more integrated development through coordinating cross-sector role players to
aligning their development interventions in one plan
c. To ensure budget allocations to the Bitou Municipality are most effectively applied for
maximum impact;
d. To provide effective linkages between the Bitou spatial development framework and the
location of housing projects which include a range of social economic environmental and
infrastructure investment.
e. To provide the Bitou IDP and budgeting process with adequate information about the housing
plan, its choices, priorities parameters as well as strategic and operational requirements
f. To ensure that the local and district municipal HSP’s are integrated
g. To match demand and supply in all areas and
h. To ensure there is an indicative project pipeline and multi-year human settlement planning
and financial schedule at both the municipal and provincial level.

Page | 170
The following table provides progress information regarding planned housing projects for the next
three years:
HOUSING PIPELINE; 2015/2016 1) Qolweni
Completion of 258 HD. Top structures. 2) Kwanokuthula;
Completion of 126 HD. Top Structures. 3) Green Valley;
Application for funding to purchase portion 28 of the farm Wittedrift 306.(18,75ha)(Colledge land)for housing project.Development includes 325 top structures, at the clinic, rugbyfield and Colledge land.
4) New Horizons Application for funding to purchase portion 20 of the farm Hillview no. 437 for housing project. (14, 56ha). Construction of +- 800 top structures.
5) Kwanokuthula; Application for construction of 441 civil engineering services.
6) Social housing project. (Erf 4367 Ultra City) Appointment of Social Housing Institution for establishing a rental housing project.(165 Units)
2016/2017/ & 2018
1) Qolweni Application for construction of 433 Top structures.
1) Kwa-Nokuthula; Construction of 300 civil engineering services.
2) Green Valley; Application for construction of 325 Civil services.
3) New Horizons Application for construction of 800 civil services.
4) Application for funding; Social housing project.(Erf 4367)
Table 56: Housing pipeline
7.2.6. LOCAL INTEGRATED TRANSPORT PLAN
The preparation of the District Integrated Transport Plan (DITP) is the responsibility of the
Eden District Municipality (EDM) as outlined in the National Land Transport Act (NLTA) and
is designed to provide a vision of transport for the district Municipality (DM), a register
summarising the conditions and issues surrounding transport, identifying priority projects
and developing an implementation plan that emphasises the transport priorities for local
officials in the various local municipalities (LMs). Part of this process includes the
preparation of a Local Integrated Transport Plan (LITP) for the LMs.
The current LITP for Bitou LM has been prepared in 2010 by Vela VKE Consulting
Engineers. In accordance with the NLTA, the LITP must be updated annually. An update
was undertaken in 2011 by Pendulum Consulting which focused on updating the Current
Public Transport Record and the Operating License Strategy for Bitou LM. In 2012 the

Page | 171
Western Cape Government’s (WCG) Department of Transport and Public Works called for
bids for updating the EDM DITP, including LITPs for the LMs, in terms of the Minimum
Requirements for preparing ITPs, with a particular focus on updating the following chapters
of the ITP:
Chapter 3: Transport Register
Chapter 6: Transport Needs Assessment
Chapter 8: Transport Improvement Proposals and Implementation Budget and
Programs
A DITP Steering Committee (i.e. the Eden District Transport Forum) has been established,
as well as a working group in Bitou LM that formed part of the consultation process and was
designed to facilitate the preparation of the Bitou LM ITP.
Bitou LM forms part of the EDM and comprise of the main town of Plettenberg Bay and
surrounding settlements of Keurboomsrivier, Kranshoek, Kurland, Nature’s Valley and
Wittedrift.
7.2.6.1 TRANSPORT REGISTER
Bitou LM is one of seven LMs contained in the EDM, which also includes George,
Kannaland, Mossel Bay, Oudtshoorn, Hessequa and Knysna. Bitou LM is one of the
smallest municipalities in terms of population size within the EDM. According to the 2011
Census a total of 49 162 people reside in Bitou LM. The Municipality is classified as a
Category B Municipality with medium capacity and is responsible for basic service delivery
The population is diversified across race groups and culture and are characterized by
varying socio-economic levels of development. Bitou LM regional gross value added GGP
of R1.086 billion in 2009 accounted for 6.6% of the region’s economy. Bitou LM’s regional
gross value added GGP increased at an annual average rate of 6.3% from R665.087 million
in 2001 to R1,086 billion in 2009. Bitou LM is ranked 5th in the economic contribution to the
EDM Economy. In 2009, Bitou LM contributed 7.8% of the total GGP in EDM.
Bitou LM is the second most densely populated (49%) LM in the EDM. Approximately 22.5%
of the working population in the Bitou LM are unemployed. About 65% % of the population
of the Bitou LM population live below the poverty line. This is very worrisome since this
indicates more and more individuals and households are dependent on grants as their
income is low.
7.2.6.1.1 PUBLIC TRANSPORT SERVICES AND INFRASTRUCTURE
Taxi services operating from the towns in Bitou LM are administered by 2 taxis associations
based in Plettenberg Bay. Rank surveys were undertaken in 2011 as part of the update of
the Current Public Transport Record (CPTR) and Operating Licensing Strategy (OLS). The
highest demand for taxis occurs on a weekday, particular because of homework and home-

Page | 172
school trips. Most of the settlements in the Bitou LM are small and thus there is not a great
demand for motorised travel. Public transport is required for inter-town movement as the
towns quite far from one another. Most daily activities can usually be accomplished on foot
since the distance to be travelled is relatively small in comparison to the greater distances
between towns and settlements.
Route utilisation and passenger waiting times are important criteria when determining
whether additional vehicles are required on a route. Generally passenger waiting time is
not an issue in Bitou LM, with passengers waiting on average 15 minutes for a taxi during
the peak periods. Most taxi routes in the Bitou LM are operating close to capacity.
Although quite an extensive rail network exists in EDM there are no passenger rail services
that exist in Bitou LM. Commercial bus services that operate through the Bitou LM are
Greyhound, Citiliner, Translux, City to City, SA Roadlink and Intercape. All bus services
operate along the N2 route. There are 6 buses going to Durban via Port Elizabeth and back,
3 morning buses and 3 evening buses. The buses traveling to East London are only two
buses in the evening and back. There is one bus to Port Elizabeth and Queenstown.
There is three formal taxi facility located in Bitou LM. Furthermore, there are four informal
facilities and stopping points in Bitou LM. There is no railway infrastructure located within
Bitou LM.
7.2.6.1.2 ROADS AND TRAFFIC
The road network through Bitou LM consists of nearly 230 km of national and provincial
roads. The provincial RNIS system reports that the estimated asset value of the provincial
road network in Bitou is R0.4 billion (2012 rands). The surfaced road network accounts for
99% of this amount.
The Average Annual Daily Traffic (AADT) and the Annual Average Daily Truck Traffic
(AADTT) in Bitou LM are as follow:
7 456 AADT and 927 AADTT between Mossgas and Mossel Bay which amounts to
12.4% of heavy vehicles.
999 AADT and 10 690 AADTT Eastern side of Groot Brak I/C which amounts to 9.3%
of heavy vehicles. 3 517 AADT and 258 AADTT between R328 T/O & Oudtshoorn
which amounts to 7.3% of heavy vehicles.
The road section with the highest number of accidents is Main Street in Plettenberg Bay with
254 accidents over this period, resulting in 36.3 accidents per annum. Marine Drive in
Plettenberg Bay follows this with 200 accidents over this period, resulting in 28.6 accidents
per annum. The roundabout at the N2/ Marine Way/ Theron Street in Plettenberg Bay has
also been identified as a road safety hazardous location. A total of 135 accidents were
recorded for the period 2005 – 2012, i.e. 20 accidents per annum.
7.2.6.1.3 NON-MOTORISED AND LEARNER TRANSPORT

Page | 173
As part of undertaking the Update of the CPTR and OLS for the EDM 2 NMT locations were
identified in Plettenberg Bay as area with high volumes of pedestrian activity. These
included Park Lane between Wilder and High Streets and along the Main Road (N2) in the
vicinity of Piesang Valley Road foot bridge.
Records received from the Eden District Municipality Education Department (EDMED) in
2011 indicated that there were a total of 5 primary, secondary and combined schools in Bitou
LM that were served by 7 learner contract routes and each of these schools received a
learner subsidy from the Western Cape Education Department (WCED).
7.2.6.1.4 EMERGENCY MEDICAL SERVICES
The EMS is a subsidiary of the Department of Health and is divided into emergency and
Healthnet services. Healthnet is not an emergency service, but it provides services for
patients going for treatments and to collect medication. There is 1 Patient Transport Vehicle
(PTV) servicing the 1 sub-station within Bitou LM.
7.2.6.2. OPERATING LICENSING STRATEGY
An OLS is a strategic document that should enable planning authorities to make
recommendations and representations to the Provincial Regulatory Entity (PRE) in respect
of applications for operating licences for all types of public transport, with the exception of
tourism and charter services. As these recommendations are binding in terms of section
39(4) of the National Land Transport Act (NLTA, Act 5 of 2009), the OLS must provide the
planning authority with reliable and accurate information on which to base its decisions. This
section is an extract from the 2011 OLS for the Bitou LM which was informed by the 2011
CPTR.
7.2.6.2.1. PROCESS
The CPTR data collection in Bitou LM was carried out during October and November 2011.
The surveys, which included NMT surveys, cordon surveys and taxi rank surveys, were done
on a typical weekday (06:00 to 18:00) and on a Saturday (08:00 to 14:00) to establish the
fluctuation in demand.
The relevant legislation, national and provincial policies guiding the OLS and the disposal of
operating licences were used to develop the OLS. The LM’s OLS contains an analysis of
the utilisation of minibus taxi services in relation to the available capacity. The analysis is
based on the utilisation levels obtained through surveys, as well as the operating license
information and resulting capacities obtained from the PRE.
In order to develop an OLS and make recommendations regarding the issuing of operating
licenses, it was important to analyse each route separately with regard to the demand and

Page | 174
supply of public transport services. A route in this context refers to a single origin-destination
or a combination of routes with the same origin and destination, but with route variations
distinguishing them. Additionally, information from the EDM Mobility Strategy is
incorporated into the observations and recommendations.
The actual route driven by the operator varies depending on the demand at any point in time
as well as the actual destination of the passenger. In this way, the operators respond to the
demand and make minor adjustments to the service to suit the needs of the demand.
Therefore, where a route serves the same origin and destination, but has minor route
variations, it is treated as a single route.
7.2.6.2.2. RECOMMENDATIONS
The resulting recommendations focus on current capacity, whether or not additional
operating licences can be issued and the enforcement of illegal operations.
Analysis of the PRE information of the existing licenses reveal that there are too many
operating licences issued on existing taxi routes when compared with the perceived
(surveyed) demand. Most of the routes can potentially warrant an investigation into
additional operating licenses. Seemingly, unlicensed operators are meeting the passenger
demand on such routes. Some of these operators may include those awaiting
documentation from the PRE. Most of the routes can potentially warrant an investigation
into additional operating licenses. Seemingly, unlicensed operators are meeting the
passenger demand on such routes. Some of these operators may include those awaiting
documentation from the PRE.
Law enforcement is a vital component, but there are a number of challenges to enforcement
in the short-term and the various strategies are recommended to improve the current
conditions. These include additional resources for enforcement, the enforcement of illegal
operations, training and the provision of a public transport depot in the EDM.
7.2.6.2.3. IMPLEMENTATION
The following prioritised actions are required for implementation of the proposed public
transport strategies:
Assistance to the local authorities in managing operating license applications
Identification of routes with significantly high numbers of illegal operators in order to
utilise law enforcement services effectively
Update of the PRE EDM public transport registration database.
The implementation of an IPTN for the EDM
Maintain close relations with the PGWC to ensure intimate knowledge of NLTA-related
processes and impact on public transport operations.
The implication of the prioritised projects is not clear at this stage as it is subject to the
implementation of the IPTN for the EDM.
7.2.6.3. TRANSPORT NEEDS ASSESSMENT

Page | 175
In order to identify particular issues with respect to transport in the Bitou LM a public meeting
was held on 30 October 2012 in New Horizons, Plettenberg Bay. The overall aim of the
meeting was to ensure that any member of the public, as well as key identified interested
parties, have an adequate opportunity to provide input into the updating and reviewing of
the EDM ITP. The following issues were raised in the meeting:
Taxi – related issues
Lack of proper public transport infrastructure (embayment and shelter) and services
at taxi ranks
Illegal taxi operators
Informal taxi ranks to be upgraded to formal structures.
Non – motorised transport
Additional bicycle lanes and more pedestrian crossings are needed for cyclist and
children.
Pedestrian routes are required along frequented roads.
Potential pedestrian crossing locations where identified where pedestrian tend to
cross roads. Of great concern was the crossing of the N2 especially between Kwa-
Nokuthula and New Horizons. A need for a footbridge or a roundabout was identified.
Road conditions and road safety
Generally roads require more maintenance, especially after heavy rainy seasons.
A few gravel roads in the area do require surfacing.
Drag racing occurs in the area.
Intersection where traffic lights need to be erected where identified.
Freight
Heavy vehicle drivers are picking up hitch-hikers along the N2 as this is a cheaper
means of transport for the hitch-hikers.
People with special needs
There is a need for public transportation for persons with special needs, including the
elderly.
Emergency Medical Transportation
Only 1 ambulance is allocated per Municipality which is located in one town.
Additional ambulances are required which could more efficiently service the
Plettenberg Bay.
Parking Facilities
Parking facilities are required at the local beach.
7.2.6.4. FUNDING STRATEGY AND SUMMARY OF PROPOSALS AND
PROGRAMS
Summary of project proposals

Page | 176
The aim of this chapter is to summarise the project proposals, to develop a list of prioritised
projects through project prioritisation and to arrive at an implementation plan that is
affordable, given the available budgets and the different sources of funding available to the
planning authority.
Project proposals were identified from the following sources: Previous projects contained in
the 2010 ITP which were not implemented, reports and documents that describe needs as
identified through previous public participation processes, stakeholder inputs and studies,
public participation meetings and meetings and discussions and working groups with LM
representatives. From the comments, suggestions, remarks and complaints gathered
during the meetings with all the relevant parties mentioned above, an initial summary of
issues/needs was compiled. The issues were then categorised into different transport focus
areas. The projects are listed hereafter and the prioritised projects are highlighted in blue.
List of projects
N
o PROJECT
CASH FLOW
2013/14 2014/15 2015/16 2016/17 2017/18
NON-MOTORISED TRANSPORT
1 Create a Pedestrian priority zone within the CBD
(850m)
5 600
000
5 600
000
9 500
000
2 Wittedrift road to Green Valley pedestrian walkway
along MR395 (1300m)
2 300
000
3 Kwa-Nokuthula Primary School pedestrian crossing 70 000
4 Development of a local area NMT Plan 300 000
5 Walkway along Marine Drive (MR383) from N2 to the
taxi rank in Plettenberg CBD 400 000
1 500
000
1 500
000
6 Walkway along Beacon Way 2 700
000
7 Walkway and cycleway along Piesang Valley Road
(DR1775) 500 000
4 500
000
4 500
000
8 New Horizon, Formosa Primary School pedestrian
crossing 70 000
9 Walkway and cycle lane along MR390 from N2/8 to
MR395 (about 2 km and 1.5m wide) 400 000
4 000
000
4 600
000
1
0
Cycleway along MR395 from Wittedrift to N2/8
(approximately 8 km) 400 000
5 000
000
4 600
000
1
1
Walkway and cycleway along N2 between Craggs and
Kurland 400 000
4 000
000
3 600
000
1
2
Walkway (about 5km)and taxi embayments (x3) along
Longships Drive (MR382) 400 000
4 000
000
6 000
000
1
3
Walkway along beach front road from Beacon Isle Hotel
to Robberg
4 000
000
6 000
000
1
4
Cycleway along DR1770 between N2 and Plettenberg
Bay via Kranshoek
6 500
000
6 500
000
1
5
Speed humps (x3)on taxi routes in Ward 5 (Kwa-
Nokuthula) 60 000
1
6
Improve safety around Marine Drive pedestrian
crossing 150 000

Page | 177
1
7
Pedestrian bridge across N2 between Kwa-Nokuthula
and new Horizons 500 000
5 000
000
4 500
000
TOTAL BUDGET REQUIRED PER PSO3 PROGRAM
PER ANNUM
11 070
000
8 770
000
26 300
000
35 760
000
27 750
000
TOTAL BUDGET REQUIRED PER PSO3 PROGRAM
FOR NEXT 5 YEARS 109 650 000
PUBLIC TRANSPORT
1
8
Scholar bus stop at Keurboomstrand on MR394,
including a public transport embayment 200 000
1
9 Upgrading of Plettenberg Bay Taxi Rank 500 000
7 500
000
7 500
000
2
0
Shelter and embayment needed along MR389
between roundabout and Odwell Way 400 000
2
1 New rank at “Coming Together” node along N2
8 000
000
10 000
000
2
2
Taxi embayments along the N2 in the vicinity of New
Horizon 400 000
2
3 2 taxi stops for Kurland in new extension 800 000
2
4 2 taxi stops for Kranshoek along the main road 800 000
2
5
Taxi embayment and shelter along Marine Drive/
Challenge intersection 400 000
2
6
Taxi embayment and shelter along Marine Drive/ Cutty
Shark intersection 400 000
2
7
Taxi embayment and shelter along Marine Drive/ Muller
intersection 400 000
2
8
Taxi embayment and shelter along Magoto Street in
Kurland 400 000
2
9
Taxi embayment and shelter at Jakobregop/ Steve Biko
intersection, Kurland 400 000
3
0
Taxi embayment and shelter at Sksona/ Biko
intersection, Kwa-Nokuthula 400 000
3
1
Taxi embayment and shelter at the 2nd Skosana/
Sishuba intersection (not at the rank), Kwa-Nokuthula 400 000
3
2
Taxi embayment and shelter at Gqamlamu/ January
intersection in Kwa-Nokuthula 400 000
3
3
Taxi embayment and shelter at Shishuba/ Tshembese
intersection, Kwa-Nokuthula 400 000
3
4
Improved public transport and learner transport
services as part of an Integrated Public Transport
Network
400 000
3
5
Manage operating license applications and improved
communication between taxi operators and the PRE 20 000
3
6 Law enforcement services 20 000
3
7
Update of the PRE EDM public transport registration
database
2 000
000
3
8
Close relations with the WCG to ensure knowledge of
NLTA- related processes and impact on public transport
operations
120 000
3
9
Identification of all un-scheduled stops in the town and
identification for a suitable location 200 000
TOTAL BUDGET REQUIRED PER PSO3 PROGRAM
PER ANNUM 860 000
10 100
000
10 300
000
10 400
000
10 800
000
TOTAL BUDGET REQUIRED PER PSO3 PROGRAM
FOR NEXT 5 YEARS 42 460 000

Page | 178
ROADS
4
0 Traffic signals at N2/ Beacon Way junction 300 000
4 700
000
4
1 Safety investigation along Main Street, Plettenberg Bay 300 000
4
2
Safety investigation along Marine Drive, Plettenberg
Bay 300 000
4
3
Safety investigation at N2/ Marine Driver intersection,
Plettenberg Bay 300 000
4
4
Development of a Transport Master plan to respond to
growth and development opportunities 500 000
4
5
Parking at Robberg 5 to be re-established (about 2 km
of angled parking)
1 500
000
2 000
000
4
6 Ring road system to decongest the CBD 400 000
4 000
000
6 000
000
4
7 Resurfacing of streets
4 000
000
5 000
000
6 000
000
5 000
000
5 000
000
4
8 Rehabilitation of roads
2 000
000
8 000
000
8 000
000
4
9
Upgrading of the Beacon Way corridor (portion of the
N2 to Plett CBD to be re-built) 400 000
5 000
000
4 600
000
5
0 Surface Kranshoek Road (DR7207)
3 000
000
6 700
000
5
1
Storm water improvement along Green Oak Street
(construction of a speed hump) 70 000
5
2
Implementation of traffic signals at Sishuba/ N2 at Kwa-
Nokuthula 300 000 470 000
TOTAL BUDGET REQUIRED PER PSO3 PROGRAM PER
ANNUM
7 600
000
23 200
000
19 300
000
13 970
000
19 770
000
TOTAL BUDGET REQUIRED PER PSO3 PROGRAM FOR
NEXT 5 YEARS 83 840 000
TOTAL BUDGET PER YEAR 19 530
000
42 070
000
55 900
000
60 130
000
58 320
000
Table 57: List of LITP projects
After estimation of the cost of implementation of the priority projects, the next step would be
to identify all possible sources of funding available to transport over the five-year
implementation period. The available funding then needs to be matched with the costs of
implementation to determine the affordability cut-off line.
The municipal budget for transport projects in Bitou LM is expected to be R36.5 million over
the next 3 years. Discussions with the officials of the EDM indicated that they do not have
a dedicated budget for transport, but that it comprises budget items of the LM’s and the
Province. EDM is not the designated road authority for provincial roads. Therefore the final
prioritisation of the roads projects, as well as budget allocations, is based on final
prioritisation conducted by the WCG on the PLTF. The road projects included on the WCG
are listed below.
Roads projects of WCG

Page | 179
The LM projects were prioritised in one-on-one meetings with the various municipal officials which
Bitou LM eventually revised indicating their preferred priority projects. Prioritisation of road
maintenance projects took place through the Infrastructure Management Query Software (IMQS)
Pavement Management System.
7.2.7. AIR QUALITY MANAGEMENT PLAN
The Air Quality Management Plan is a statutory requirement in the National Environmental
Management: Air Quality Act 39 of 2004 section 15(1). The objective of the plan is to
investigate the state of air quality in the region with respect to the relevant knowledge and
capacity. With the promulgation of the National Environmental Management: Air Quality Act
the focus of air quality management shifted from source control to management of pollutants
in the ambient environment through air quality management planning.
The Bitou Air Quality Management plan was approved on the 27 June 2013 and the Council
resolution number is C/4/47/06/13.
Section 24 of the Constitution provides for the rights of citizens to an environment that is not
harmfull to their health or well-being. The Air Quality Act 39 of 2004 seeks to generally give
effect to that right and requires as per section 15 of that Act
Bitou Municipality will pursue the vision and mission of the AQMP through a series of nine
objectives, each aimed at supporting the air quality management plan compiled for EDM
Objective 1: Set Air Quality Goals
Objective 2: Set Up Air Quality Manager System
Objective 3: Carry Out Risk Assessment
Project Description '2012/13 '2013/14 '2014/15 '2015/16 '2016/17 '2017/18 Period
total
C0816:
Rehab/Reseal
DR1770, rehab
DR1775, MR382 &
MR390 -
Plettenberg Bay
Rehabilitation &
Reseal of
DR1775, MR382
and MR390 near
Plettenberg Bay.
46 920 0 0 0 0 0 46 920
C0865.05: Flood
Damage Repairs
to DR1615 -
Sedgefield
(Hoogekraal)
Flood damage
repairs to DR1615
near Sedgefield
0 0 0 501 599 0 1 100
TOTAL 46 920 0 0 501 599 0 48 020
Page | 180
Objective 4: Assess and Select Control Measures
Objective 5: Implement of Intervention and Monitoring Effectiveness
Objective 6: Revise Air Quality Goals
Objective 7: Integrate the AQMP into the IDP
Objective 8: Compliance Monitoring
Objective 9: Review the Air Quality Management Plan
In various sections of the AQMP Bitou Municipality executes its air quality management
obligations in close co-operation with Eden’s AQO. Following this approach will provide the
best co-operation to air quality management in the Bitou region
7.2.8. COASTAL MANAGEMENT PLAN
Bitou’s location along the coast and its vegetation makes coastal management one of the
most important plans that should accompany the IDP. The community proposed a wetlands
project and this is aimed at preserving the wetlands and its biodiversity. There is also
conservation that needs to take place especially along the Indian Ocean and the Keurbooms
River.
The National Environmental Management: Integrated Coastal Management Act, Act 24 of
2008 (ICM Act) specifies a number of responsibilities for Municipalities regarding the
sustainable development and management of the coastal environment. In terms of chapter
6 of the National Environmental Management: Integrated Coastal Management Act 24 of
2008 it is required that all coastal Municipalities develop a Coastal Management Programme
(CMP).
Coastal management in the Western Cape is managed at district level Municipalities and
Bitou Municipality is located within Eden District Municipality. Eden District Municipality has
drafted a Coastal Management Programme. The drafts await endorsement by the Nation
Department of Environmental Affairs.
The draft CMP provides a vision for the entire district which expresses “the coastal zone is
Eden’s most significant asset and must be nurtured through innovative and integrated
cooperative management interventions that will ensure both the environmentally sustainable
functioning and enhancement of the natural systems, while optimizing economic and social

Page | 181
benefits, protecting the diverse cultural heritage, maintaining its unique sense of place,
increasing awareness through education and ensuring the spiritual well-being of all users.”
The CMP outlined objectives that seek to give effect to the vision of the CMP, are the
following:
1. Public access
Public access was viewed as the highest priority of Eden Costal Management Programme.
Reasonable and equitable access to the coastal public property must be recognized as a
basic human right. All known legal coastal access must be clearly demarcated and indicated
on the maps and on the ground. Keurbooms was identified as one of the coastal areas with
public access that were not clearly indicated for the public and requires special attention
2. Infrastructure spatial planning and development
Existing infrastructure within the coastal zone must be maintained or upgraded so as to
prevent degradation of the environment and all existing spatial planning strategies must be
strictly enforced. All future infrastructure and developments should be restricted to land
already zoned for that purpose and no new zonings must be considered within the coastal
protection zone. Future spatial planning strategies must consider the coastal protection zone
as a no-go area for infrastructure or developments and set back lines must be determined
as a matter of priority.
3. Biodiversity protection, conservation & enhancement
Biodiversity must also be protected and conserved through innovative spatial planning
strategies, a network of protected conservation areas, proactive management and the
prevention of over exploitation. Biodiversity should be enhanced through alien eradication,
re-introduction and nurturing of indigenous fauna, flora and rehabilitation programmes
4. Water quality and quantity
Organs of state and other interested NGO’s must co-operate to ensure that water resources
are managed in such a way as to ensure a clean and healthy environment that supports
ecosystem functioning and the well-being of all users.
5. Education and awareness

Page | 182
The value of the Municipality environment and its people must be communicated at all levels
of basic education and within communities and a culture of learning, co-operation and sense
of ownership fostered between organs of state and civil society.
6. Economic development, tourism and recreation
Confidence and an enabling environment must be created in the Municipality in order to
attract private investors and government programmes to boost the economy, create jobs
and raise the profile of the area; all within a framework that preserves the integrity of a district
as a whole.
The plan requires the Municipality to address the following actions:
Outcome / Response Required Municipal Action Timeframe
Development of blue flag beaches
Continuous provision of services and
facilities.
Effective management and development
of coastal management committee
Providing open public access to beaches
2013/2014
2014/2015
Equal access to economic opportunities
and public resources
Municipality is developing an Integrated
Coastal Zone Management Plan
(ICZMP).
Awareness and education campaigns to
inform and educate the public on
opportunities that exists and the rights
they can practice within coastal zones.
2013-2018
Exploiting tourism and economic growth
potential that exists
ICZMP will focus on coastal
management strategies that will protect
the coastal zone and maintenance
facilities and service provision
2013-2018
Conserving natural resources and
protecting critical bio diversity area.
Municipality is in the process of
developing an overall Environmental
Management Framework(EMF)
Environmental Management Programs
for the following estuaries:
Piesang River
Salt River
Matjies River
2014/2015
2015/2016
Coastal Planning Scheme By-laws Development and approval of By-laws 2013/2014
2014/2015
Table 58: Coastal management implementation plan
7.2.9. Fleet management plan

Page | 183
Due to the IDP lending itself to concerns around officials abusing the use of Municipal
vehicles.
It is imperative that we implement a new Fleet Management Policy. This policy is currently
in circulation to all Department HOD`s to get their inputs and must form part of the agenda
at the next council meeting.
The new Fleet Management Policy will ensure that we at Bitou Municipality strive towards
us operating an efficient and cost effective Fleet of vehicles to better enable us to deliver on
Service Delivery.
Fleet Management are in the process of the Fleet replacement project, whereby a decision
was made to rather procure our fleet with an outright purchase of vehicles. This decision
was based on the high operational cost associated with the leasing of vehicles.
This project will address some of the service delivery issues that surround the following
departments: Electrical, Waste –Refuse, Public Safety, Water and Roads.
Project cost: R 6 000 000.00
The procurement of vehicles that each department requires in order to meet its service
delivery demands will be resolved by July 2015.
DEPARTMENT VEHICLE DESCRIPTION QUANTITY
Electrical Bakkies Cherry Picker Hydraulic Crane Truck
8 1 1
Waste –Refuse collection Refuse compactor Trucks Bakkies
2 2
Public Safety Bakkies MPV Sedans
7 1 7
Water Department Trucks 2
Roads Bakkies TLB -Grader
1 1
The Fleet replacement plan will be an on-going exercise to ensure that our fleet is able to deliver
during the execution process of our department’s demands.
7.2.10. DISASTER MANAGEMENT PLAN
As per Section 53 (1) of the Disaster Management Act, 57 of 2005 each Municipality must:
Prepare a disaster management plan for its area according to the circumstances prevailing in the
area;
a. co-ordinate and align the implementation of its plan with those of other organs of state and
institutional role-players; and
b. Regularly review and update its plan; and through appropriate mechanisms, processes and
procedure established in terms of Chapter 4 of the MSA, consult the local community on the
preparation or amendment of its plan.
The disaster management plan for a municipal area:
a. forms an integral part of a Municipality’s Integrated Development Plan;

Page | 184
b. anticipates the types of disasters that are likely to occur in the municipal area and their
possible effect;
c. places emphasis on measures that reduce the vulnerability of disaster-prone areas,
communities and households;
d. seeks to develop a system of incentives that will promote disaster management in the
Municipality;
e. identifies the areas, communities or households at risk;
f. takes into account indigenous knowledge relating to disaster management;
g. promotes disaster management research;
h. identifies and address weaknesses in capacity to deal with disasters;
i. provides for appropriate prevention and mitigation strategies;
j. facilitates maximum emergency preparedness; and
k. Contains contingency plans and emergency procedures in the event of a disaster.
A regional disaster risk assessment was completed in April 2006 by the Eden DM. Fires (Wild
Mountain - and shack fires); flooding, drought and road accidents were identified during this
assessment process as the main disasters faced by Bitou Municipality. Natural disasters pose a
serious threat to the natural assets and resources of the Municipality.
A fully equipped municipal disaster management centre for the region is located in George at the
offices of Eden DM. The Eden Municipal Disaster Management Centre (EMDMC) provides a 24 hour
call taking and dispatch facility. An organisational facility is also available that is not only used as a
Joint Operation Centre (JOC) during disasters, but also as a venue for planning sessions outside
disaster periods. A tactical facility is available as well as offices for various emergency services. The
aim is to make it a one stop centre for all incident reporting. This centre is a big advantage to Bitou
Municipality as it is too costly for Bitou to have its own disaster management centre.
Disaster management functions are currently performed by the Fire and Disaster Management Sub
Directorate. The Municipality is also participating in capacity building exercises coordinated by
EMDMC in collaboration with the Provincial Disaster Management Centre. The following training was
provided:
a. Disaster management planning
b. Development of contingency plans
Bitou Municipality entered into a shared fire fighting service agreement with Eden DM. This entails
the following:
Bitou provides infrastructure, equipment, vehicles and operational cost for Kurland sub-fire
station.
Eden DM covers all personnel related cost
Bitou Municipality drafted and approved a Level 1 Disaster Management Plan in April 2008. This
plan made provision for:
1. the allocation of responsibilities to various role players;
2. the coordination of the responsibilities;
3. prompt disaster response and relief;
4. the establishment of communication links and dissemination of information; and
5. other matters that may be prescribed.

Page | 185
Bitou Municipality just completed a Level 2 Disaster Management Plan. The plan will be submitted
for Council approval in May 2014.
The Municipality will develop detailed programmes to address the above requirements during this
IDP period.
Outcome / Response Required Municipal Action Timeframe
Ensure Safety of Community Risk identification Annually
Ensure Safety of Community Upgrade and replace emergency
equipment for the fire department
2014/15
2015/16
Ensure Safety of Community Install new and replace existing fire
hydrants
2014/14
2014/15
Immediate Relief to Victims Operating Budget Annually
Emergency Housing Kit Operating Budget Annually
Awareness (Fire prevention) Awareness Campaigns Annually
Updated & signed fire fighting service
agreement Renewal of agreement with Eden DM Annually
Table 59: Disaster management plan implementation plan
7.2.11. THUSONG SERVICE CENTRE PROGRAMME
The Municipality is working closely with all sector departments and management of the Thusong
Centre to upgrade, maintain and manage the facility as an asset for the community of Bitou. The
Municipality started to make provision for the Thusong Centre in its operational budget and will
continue doing so.
There are currently requests to upgrade the Thusong Centre and the Kranshoek centre. The
provincial government is working tirelessly to revive Thusong Centres and to restore the initial
purpose of these centres of being a one stop government service centre.
Challenges of Simunye Thusong Centre:
1. The Thusong Centre is too small and cannot be upgraded and the existing offices cannot be
extended. As a result the Department of Social Development will vacate their office for bigger
premises;

Page | 186
2. The revenue generated by the centre is not sufficient to sustain it;
3. A lot of maintenance needs to be under taken to revive it and maintain its aesthetics.
Outcome / Response Required Municipal Action Timeframe
Signed lease agreements with all
tenants Draft lease agreements
2013/14
Viable funding model Investigate funding model for centre
Budget for Centre
2013/14
2014/15 & 2015/16
Table 60: Thusong centre implementation programme is continuous.
7.2.12 RISK MANAGEMENT PLAN
Risk management is as much about identifying opportunities as avoiding or mitigating
losses. It is a logical and systematic process of establishing the context, identifying,
analysing, evaluating, treating, monitoring and communicating risks associated with any
activity, function or process, in a way that enables an organisation to minimise losses and
maximise opportunities.
Section 62 of the Municipal Finance Management Act (MFMA), No. 56 of 2003, states that
the Accounting Officer should take all reasonable steps to ensure that the Municipality has
and maintains effective, efficient and transparent systems of financial and risk management
and internal control, as well as the effective, efficient and economical use of the resources
of the municipality.
In order to ensure the inclusion of all the factors impacting on Risk Management within the
Municipality it is important to identify the environment within which the Municipality operates.
As with most municipal disciplines the risk management environment has altered
substantially and requires a complete review of current polices, practices and assumptions.
The Municipality identified its risk environment which is summarised on the figure below:

Page | 187
Table 61: Risk environment
Council has adopted a risk management policy and strategy in compliance with the Municipal
Finance Management Act and King II during June 2008. Operational and Strategic Risk Assessment
workshops were conducted and the following top risks per department were identified:
TOP RISKS PER DEPARTMENT
MSID CORPORATE SERVICES
1. Insufficient Funding 1. Insufficient Funding
2. Shortage of Skills and
Personnel
2. Shortage of Skills and Personnel
3. Non Compliance to legislation
and Policies
3. Non Compliance to legislation and Policies
4. Health and Safety risks 4. Health and Safety risks
5. Poor Staff Discipline 5. Non Implementation of Council Resolutions
6. Water and electricity losses 6. Fraud and Unethical Behaviour
7. Ageing fleet and Infrastructure 7. Poor Interdepartmental Communication
8. Illegal Connections 8. Abuse of Sick leave
9. Climate Change 9. Inadequate office space
Risk Strategy
DirectorsLine Management
Internal Audit
WorkersCommunity
External Assurance
Providers Auditor
General
Risk Environment
PolicyPlan
Standard Operating
Procedure
Risks and Opportunities(Risk Register)
Council
Audit Committee
Risk Committee
• Governance• Legislation• National and
Provincial Government
• Local Economic Development
• Grants
• Natural Disasters• Accidents• Injuries
• Service failures• Aging Infrastructure• Loss of skills• Economy• Repairs and
Maintenance
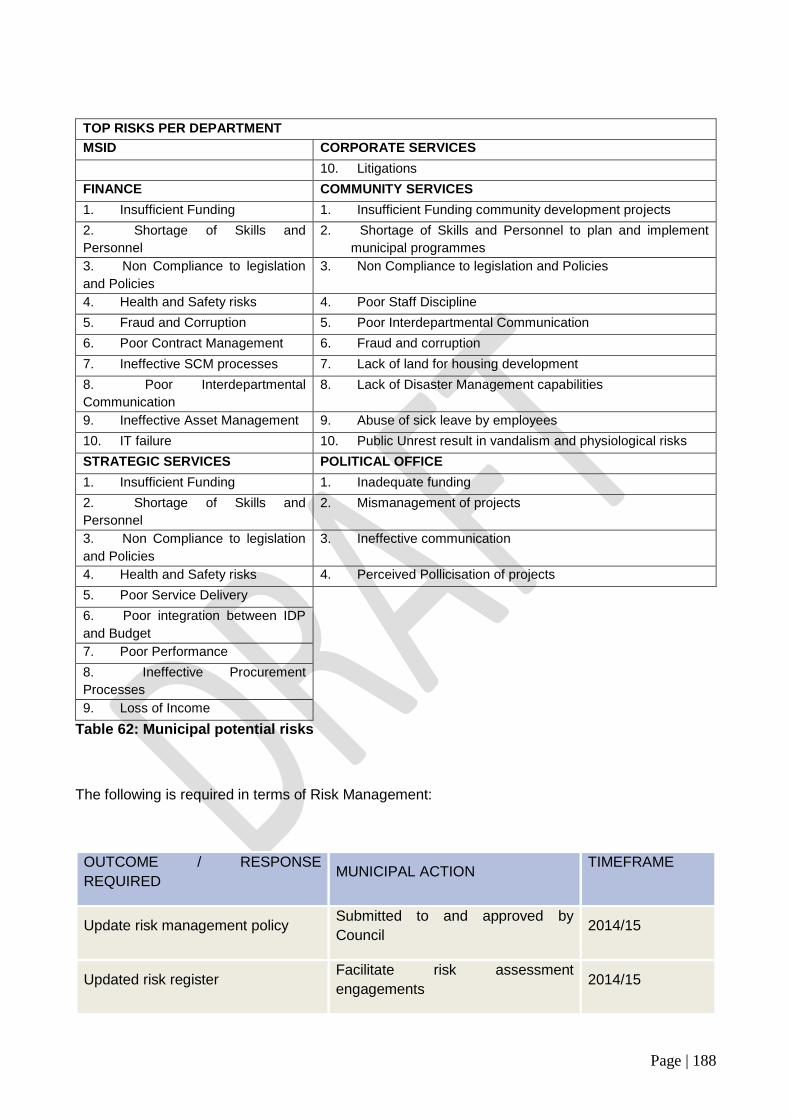
Page | 188
TOP RISKS PER DEPARTMENT
MSID CORPORATE SERVICES
10. Litigations
FINANCE COMMUNITY SERVICES
1. Insufficient Funding 1. Insufficient Funding community development projects
2. Shortage of Skills and
Personnel
2. Shortage of Skills and Personnel to plan and implement
municipal programmes
3. Non Compliance to legislation
and Policies
3. Non Compliance to legislation and Policies
4. Health and Safety risks 4. Poor Staff Discipline
5. Fraud and Corruption 5. Poor Interdepartmental Communication
6. Poor Contract Management 6. Fraud and corruption
7. Ineffective SCM processes 7. Lack of land for housing development
8. Poor Interdepartmental
Communication
8. Lack of Disaster Management capabilities
9. Ineffective Asset Management 9. Abuse of sick leave by employees
10. IT failure 10. Public Unrest result in vandalism and physiological risks
STRATEGIC SERVICES POLITICAL OFFICE
1. Insufficient Funding 1. Inadequate funding
2. Shortage of Skills and
Personnel
2. Mismanagement of projects
3. Non Compliance to legislation
and Policies
3. Ineffective communication
4. Health and Safety risks 4. Perceived Pollicisation of projects
5. Poor Service Delivery
6. Poor integration between IDP
and Budget
7. Poor Performance
8. Ineffective Procurement
Processes
9. Loss of Income
Table 62: Municipal potential risks
The following is required in terms of Risk Management:
OUTCOME / RESPONSE
REQUIRED MUNICIPAL ACTION
TIMEFRAME
Update risk management policy Submitted to and approved by
Council 2014/15
Updated risk register Facilitate risk assessment
engagements 2014/15

Page | 189
OUTCOME / RESPONSE
REQUIRED MUNICIPAL ACTION
TIMEFRAME
Compile a risk register for each
department
Appointment of a Risk Manager /
Official
Provide budget for post
Recruitment and selection process 2014/15
Table 63: Implementation of the risk programme
7.2.13. WORKPLACE SKILLS PLAN
Bitou Municipality has a skills development plan which is updated and reviewed every year in line
with the prescripts of the Skills Development Act 1998 (Act No. 97 of 1998). The act aims to improve
the quality of life of the labour force, their prospects of work, improve productivity in the workplace
and to encourage workers to participate in leadership and other programmes.
The Municipality promotes and implements skills development strategies to capacitate its staff to
participate in the implementation the objectives of the Integrated Development Plan.
The workplace skills plan is the key strategic planning document relating to workplace training,
career path and employment equity for the Municipality. The workplace skills plan is prepared
annually and each municipal department is required to implement the plan with the support of the
Corporate Services Department. The budget is made available for skills development and is
reviewed quarterly to ensure implementation of the plan.
7.2.14. PERFORMANCE MANAGEMENT POLICY FRAMEWORK
The policy framework approved by Council prescribes the methodology that the Municipality
implemented to measure the overall performance of the organisation. The performance
management system is discussed in Chapter 9 of this document.
OUTCOME / RESPONSE
REQUIRED MUNICIPAL ACTION
TIMEFRAME
Implement performance
management incrementally to all
levels of staff
Implementation of performance
management to all level in a phased
approach
On-going
Review Performance Management
Framework
Submitted reviewed framework to
Council 2013/14

Page | 190
OUTCOME / RESPONSE
REQUIRED MUNICIPAL ACTION
TIMEFRAME
Quarterly performance reports in
terms of the top layer SDBIP Submit quarterly reports to Council On going
Table 64: PMS implantation programme
7.3 OTHER MUNICIPAL FUNCTIONS
7.3.1. CEMETERIES
The Municipality currently has 8 cemeteries located throughout the municipal area. The majority of
the cemeteries have limited capacity. The table below indicates the capacity of cemeteries as of
2013.
Location Nr of Cemeteries Current Occupancy
(%)
Plettenberg Bay 1 100%
Wittedrift 2 75%
Kranshoek 1 75%
Kwa-Nokuthula 1 50%
New Horizon 1 100%
The Crags 2 60%
Table 65: Status of cemeteries
The capacity of the existing cemeteries is inadequate for the area and finding vacant land
for new cemeteries or extensions to existing cemeteries needs to be explored given the
current capacity challenges. The Municipality made provision in the budget (2013/14) for the
planning and development of a cemetery.
Bitou Municipality appointed Marike Vreken Urban and Environmental Planners to conduct
an investigation into the suitability of five alternative sites to establish a new regional
cemetery consisting of at least 12 ha and also incorporate an integrated urban development.
Phase 1 of the study is to investigate the five sites and to identify the most suitable
alternative. Phase 2 will be the design of the cemetery and integrated development as well
as obtaining authorisations and development rights for the new regional cemetery and
integrated urban development. This report serves as Phase 1 of this study.
Site alternatives
Bitou Municipality identified five potential properties that could be used for cemetery
purposes. The properties are listed below and shown in Figure 1.
Site A Portion 28 of Knysna Farm Wittedrift No 306;

Page | 191
Site B: Portion 1 of Knysna Farm Ganse Vallei No 444;
Site C: Portion 3 of Knysna Farm Hill View No 437;
Site D: Portion 33 of Knysna Farm Hill View No 437;
Site E: Portion 7 of Knysna Farm Harkerville No 428.
7.3.2 AIRFIELDS AND LANDING STRIPS
Bitou Municipality has one public airfield, namely the Plettenberg Bay Airport. It is located to
the southwest between Plettenberg Bay town and Kranshoek. The airport precinct has a
land area of approximately 62 hectares.
Location ICAO Code IATA Code Usage Runway Runway
Dimensions
Plettenberg Bay FAPG PBZ Civilian Paved,
lighted
1 220 x 20
meters
Table 66: Airfield information
Commencing in March 2014, the airport is currently being service by scheduled flights
between Johannesburg and Cape Town on Fridays, Saturdays and Sundays. The airline
concerned is operating a 19 seat commuter aircraft and operates on a number of routes to
smaller towns such as Margate, Lephalale and Kathu. The airline undertook, at its own
expense to do painting and maintenance on the airport building as well as installing an X-
ray baggage scanner and a metal detector to ensure CAA and ICAO compliance.

Page | 192
Figure 34: CemAir aircraft landing for the first time at Plettenberg Bay Airport
Additional security personnel were trained and certified in the use of the equipment and work shifts
on the days of the scheduled service. The fire brigade was certified as being compliant with CAA
requirements for the scale of the airport operation.
The airline operator, at their own expense, placed on station 300 litres of fire retardant at the airport,
as well as sending a certified Fire Instructor to train fire brigade personnel on emergency procedures
regarding the aircraft being used.
The runway at 1220m can accommodate aircraft capable of carrying 50 passengers. If the demand
for larger planes increases the runway could be extended by a further 250 metres without having to
acquire additional land.
The entire airport precinct is to be surveyed to establish with certainty, current land usage, and
potential future land use areas. This will be the basis of a strategic business plan, to ensure maximum
returns for the broader community from this unique asset.
Land can then be made available through sale or public private partnership for development and
occupancy by suitable commercial enterprises, not only in aviation, but sectors such as ICT, logistics,
light manufacture and the like.
An upgrade of the airport will encourage current general aviation activities such as air charter, aircraft
maintenance organisations and flight training. The airport is a unique strategic asset and should be
evaluated on a rolling ten, twenty, and thirty year timeline. The economic multiplier effect of the

Page | 193
airport should be in the region of 1: 3.3 from on–airport activities. The value to tourism through ease
of access to Plettenberg Bay and surrounding areas has high economic potential, in addition to the
development potential in terms of relevant land development and appropriate business mix.
7.4 SECTOR DEPARTMENTS
Chapter 5 of the MSA provides direction on co-operative governance, encouraging municipalities to
develop their strategies in line with other organs of state so as to give effect to the five-year strategic
plan. It goes further to inform that the IDP must link, integrate and co-ordinate development plans
for the Municipality. Resources and capacity must align with the implementation of the plan, forming
the foundation on which the annual budget must be based. The plan must also be compatible with
national development plans and planning requirements binding on a Municipality in terms of
legislation.
The IDP should therefore guide where sector departments allocate their resources at local
government sphere. The Municipality should however also take into consideration the sector
department’s policies and programmes when developing its own policies and strategies. For this
reason it is in the interest of the sector departments to participate in municipal IDP planning
processes to ensure alignment between programmes.
7.4.1 SECTOR DEPARTMENTS FOOT-PRINT
The Department of Local Government is championing a process which is called an IDP
indaba (Colloquium of All spheres of government). The indaba is divided into two. In the first
indaba provincial and national departments present to municipalities their focus areas. This
process is followed by a submission of municipal priorities for sector departments. These
priorities are meant to be catalytic for further development and investment promotion.
After receiving the municipal priorities, departments then allocate resources to address the
proposed priorities, if these priorities are in line with the department’s strategic focus areas.
The IDP indaba 1 was held on the 06 October 2014 in Mosselbay. The Municipal Manager
HOD’s and IDP Manager attended the joint planning initiative. The Municipal manager
presented the municipal case for the Western Cape Joint Planning initiative. A
comprehensive list of proposed interventions were presented at the INDABA 1.

Page | 194
INDABA 2 was also held in Mosselbay, sector departments presented their interventions for
the 2015/2016 and beyond projects. There were a number of agreements riched between
the Municipality and Province.
Municipality Ref No: Project
Description
Salient
Points of
Discussion
On Site
Agreement /
Action Items
Deadline
(Per
Quarter)/
Urgent
Matters end
March)
Progress
(Sector
update/Response)
Agreement
Status
No response
Partially
addressed
Fully
addressed
Bitou
EDM
Agreement
81_2014
Accessibility
at Green
Valley Clinic
The
municipality
requested
funding from
the
Department
of Health in
order to
make the
Wittedrift
Clinic more
accessible.
The clinic is
currently a
shared
facility at the
community
hall, the road
is of poor
quality and
the parking
area is
unpaved.
It was
agreed that
a bilateral
with Bitou
municipality
and the
Department
of Health be
set up to
discuss the
issue of
accessibility
to the Green
Valley Clinic
as well as
the
possibility of
adding an
annexure in
the future.
15-Apr-14
June 2014:
DOH: Letter
written to
Municipality on
this. Health will do
paving project in
2014/15 financial
year if funding can
be acquired.
July 2014:
Bitou Municipality:
The municipality
is reliant on the
commitment
made by the
department of
health.
November 2014:
DOH: Just
comments to
review this
understanding:
DOH is planning
to pave the area.
Letter sent to
Municipality
asking them to
pave the road to
the facility. Still
awaiting reply.
DLG: For
municipal
response
January 2015:
DOH: Status quo
remains.
February 2015:
DOH: DOH will
initiate paving
project before end
of financial year.
Letter written to
Municipality re
request for
improved access.
Awaiting response
from Municipality
Referred to
muncipality

Page | 195
re feasibility of
improved access.
IDP Indaba
Update:
DOH: The paving
has been
completed
March 2015 :
DLG: DOH awaits
response from the
municipality with
regard to the
feasibility of
improved access.
For Municipal
Attention
Table 67: Indaba 2 agreements

Page | 196
CHAPTER 8 BUDGET FRAMEWORK
Executive Summary
The application of sound financial management principles for the compilation of Bitou Municipality’s financial plan is essential and critical to ensure that Bitou Municipality remains financially viable and that municipal services are provided sustainably, economically and equitably to all communities. Bitou Municipality’s business and service delivery priorities were reviewed as part of this year’s planning and budgeting process. Where appropriate, funds were transferred to address crucial service delivery needs and to ensure compliance with legislative requirements and to meet service delivery obligations. The current year adjustment budget is reflective of this principle and supports the municipality’s quest for financial sustainability. Bitou Municipality has embarked on implementing a range of revenue collection strategies to optimize the collection of debt owed by consumers and to ensure that all revenue due is billed and collected. Furthermore, Bitou Municipality has undertaken various customer care initiatives to ensure the municipality truly involves all citizens in the process of ensuring true community participation. National Treasury’s MFMA Circular No. 77 and 75 were used to guide the compilation of the 2015/16 MTREF. The main challenges experienced during the compilation of the 2015/16 MTREF can be summarized as follows:
• The slow recovery from the economic downturn that is still hampering growth and
development not only locally but provincially and nationally. • Limited available own funding to fund much needed infrastructure. • Above average population growth placing a strain on infrastructure and housing needs. • Ageing and poorly maintained water, roads and electricity infrastructure; • The increased cost of bulk electricity as a result of continued annual increases which is
placing upward pressure on service tariffs to residents. • Wage increases for municipal staff that continue to exceed consumer inflation, as well as the
need to fill critical vacancies; • Availability of affordable capital/borrowing. The following budget principles and guidelines directly informed the compilation of the 2015/16 MTREF: • The 2014/15 February Adjustments Budget priorities and targets, as well as the base line
allocations contained in this Adjustments Budget were adopted as the upper limits for the new baselines for the 2015/16 annual budget; where appropriate a zero base approached has been used.
• Tariff and property rate increases should be affordable and should generally not exceed inflation as measured by the CPI, except where there are price increases in the inputs of services that are beyond the control of the municipality, for instance the cost of bulk electricity and the continued escalation in the fuel price. In addition, tariffs need to remain or move towards being cost reflective, and should take into account the need to address infrastructure backlogs;
In view of the aforementioned, the following table is a consolidated overview of the proposed 2015/16 Medium-term Revenue and Expenditure Framework:

Page | 197
Table 68 Consolidated Overview of the 2015/16 MTREF
Description Adjusted Budget R’000
Budget Year 2015/16 R’000
Budget Year 2016/17 R’000
Budget Year 2017/18 R’000
Total Operating revenue 477,439 510,145 544,325 592,945
Total Operating Expenditure 488,468 500,555 529,011 571,405
Surplus/(Deficit) for the year 38,582 54,365 56,002 47,739 Total Capital Expenditure 72,528 82,581 71,719 67,051
Table 68: Consolidated overview of the 2015/2016 MTREF
Total operating revenue has grown by 6.9% or R 32, 7 million for the 2015/16 financial year when compared to the 2014/15 last Adjustments Budget. For the two outer years, operational revenue will increase by 6.7% and 8.9% respectively, equating to a total revenue growth of R 115, 5 million over the MTREF when compared to the 2014/15 financial year. Total operating expenditure for the 2015/16 financial year has been appropriated at R 500,5 million and translates into a budgeted surplus of R 54,3 million after taking into consideration capital funding from own revenue and Loan funding. When compared to the 2014/15 Adjustments Budget, operational expenditure has grown by 2.5% in the 2015/16 budget and increase by 5.7% for 2016/2017 and increases by 8.0% for 2017/2018 being the outer years of the MTREF. The operating surplus for the two outer years steadily increase by R 2,0 million for 2016/2017 and decrease by R 8,2 Million for 2017/2018 after capital funding is accounted for. These surpluses will be used to fund capital expenditure and to further ensure cash backing of reserves and funds. The capital budget of R 82, 5 million for 2015/16 is 13.8% more when compared to the 2014/15 Adjustments Budget. This is mainly due to loan and own funding increasing. The capital program decreases to R 71, 7 million in the 2016/17 financial year and R 67, 0 million in the 2017/18 financial year. The major portion of the capital budget will be funded from Government grants and subsidies as the municipality’s cash position is still under pressure thereby limiting its own funds to capital financing. A portion of the capital budget will be funded from borrowing over MTREF with anticipated borrowings not exceeding R 21, 0 Million per year over the MTREF. It needs to be noted that Bitou Municipality has not yet reached its prudential borrowing limits and so there is still room for increasing borrowing over the medium-term. It is however very important to ensure that the municipality sufficiently improves financially prior to the taking up of additional capital loan funding excessively more than the total current annual redemption. The repayment of capital and interest (debt services costs) will substantially increase over the MTREF and will therefore have an effect on the improved financial position of the municipality.
Operating Revenue Framework
For Bitou Municipality to continue improving the quality of life of its citizenry through the delivery of high quality services, it is necessary to generate sufficient revenue from rates and service charges. It is also important to ensure that all billable revenue is firstly correctly charged and secondly adequately collected. The prevailing economic circumstances are adding to the difficulties in collecting the revenue due to the municipality and additional savings initiatives will need to be implemented in the MTREF to ensure the financial sustainability of the municipality. The expenditure required to address the needs of the community will inevitably always exceed available funding; hence difficult choices have to be made in relation to tariff increases and balancing expenditures against realistically anticipated revenues.
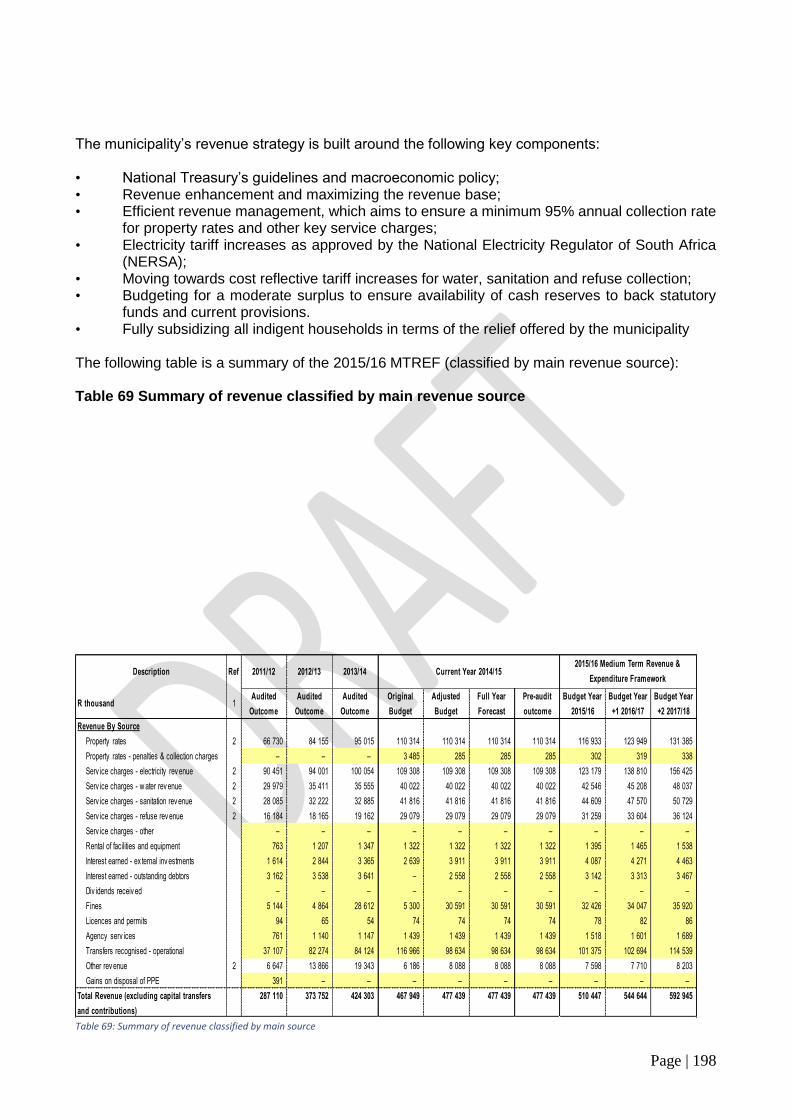
Page | 198
The municipality’s revenue strategy is built around the following key components: • National Treasury’s guidelines and macroeconomic policy; • Revenue enhancement and maximizing the revenue base; • Efficient revenue management, which aims to ensure a minimum 95% annual collection rate
for property rates and other key service charges; • Electricity tariff increases as approved by the National Electricity Regulator of South Africa
(NERSA); • Moving towards cost reflective tariff increases for water, sanitation and refuse collection; • Budgeting for a moderate surplus to ensure availability of cash reserves to back statutory
funds and current provisions. • Fully subsidizing all indigent households in terms of the relief offered by the municipality
The following table is a summary of the 2015/16 MTREF (classified by main revenue source): Table 69 Summary of revenue classified by main revenue source
Table 69: Summary of revenue classified by main source
Description Ref 2011/12 2012/13 2013/14
R thousand 1Audited
Outcome
Audited
Outcome
Audited
Outcome
Original
Budget
Adjusted
Budget
Full Year
Forecast
Pre-audit
outcome
Budget Year
2015/16
Budget Year
+1 2016/17
Budget Year
+2 2017/18
Revenue By Source
Property rates 2 66 730 84 155 95 015 110 314 110 314 110 314 110 314 116 933 123 949 131 385
Property rates - penalties & collection charges – – – 3 485 285 285 285 302 319 338
Serv ice charges - electricity rev enue 2 90 451 94 001 100 054 109 308 109 308 109 308 109 308 123 179 138 810 156 425
Serv ice charges - w ater rev enue 2 29 979 35 411 35 555 40 022 40 022 40 022 40 022 42 546 45 208 48 037
Serv ice charges - sanitation rev enue 2 28 085 32 222 32 885 41 816 41 816 41 816 41 816 44 609 47 570 50 729
Serv ice charges - refuse rev enue 2 16 184 18 165 19 162 29 079 29 079 29 079 29 079 31 259 33 604 36 124
Serv ice charges - other – – – – – – – – – –
Rental of facilities and equipment 763 1 207 1 347 1 322 1 322 1 322 1 322 1 395 1 465 1 538
Interest earned - ex ternal inv estments 1 614 2 844 3 365 2 639 3 911 3 911 3 911 4 087 4 271 4 463
Interest earned - outstanding debtors 3 162 3 538 3 641 – 2 558 2 558 2 558 3 142 3 313 3 467
Div idends receiv ed – – – – – – – – – –
Fines 5 144 4 864 28 612 5 300 30 591 30 591 30 591 32 426 34 047 35 920
Licences and permits 94 65 54 74 74 74 74 78 82 86
Agency serv ices 761 1 140 1 147 1 439 1 439 1 439 1 439 1 518 1 601 1 689
Transfers recognised - operational 37 107 82 274 84 124 116 966 98 634 98 634 98 634 101 375 102 694 114 539
Other rev enue 2 6 647 13 866 19 343 6 186 8 088 8 088 8 088 7 598 7 710 8 203
Gains on disposal of PPE 391 – – – – – – – – –
Total Revenue (excluding capital transfers
and contributions)
287 110 373 752 424 303 467 949 477 439 477 439 477 439 510 447 544 644 592 945
2015/16 Medium Term Revenue &
Expenditure FrameworkCurrent Year 2014/15

Page | 199
Table 70 Percentage of revenue by main revenue source
Table 71: Percentage of revenue by main revenue source
Revenue generated from services charges remain the major source of revenue for the municipality amounting to 47.3% of total revenue. The major sources of revenue for the 2015/2016 financial year can be summarized as follows:
Table 72: Major sources of revenue for 2015/2016
Property rates is the second largest revenue source totaling 22.9% or R 116,9 million and increases to R123, 9 million by 2016/17. The third largest source is grants and subsidies totaling R 101, 3 million and mainly comprises of Equitable Share allocated through the Division of Revenue Act and Provincial housing allocation for the construction of Houses. Other operating grants include the Finance management grant, municipal systems improvement grant as well as EPWP incentive grant. Other revenue consists of various items such as income received from permits and licenses, building plan fees, connection fees, fines collected and other sundry receipts and totals R 42, 6 Million for the 2015/2016 financial year. Departments have been urged to review the tariffs of these items on an annual basis to ensure they are cost reflective and market related. Table 73 Operating Transfers and Grant Receipts
Description Ref
R thousand 1Adjusted
Budget%
Budget Year
2015/16%
Budget Year
+1 2016/17%
Budget Year
+2 2017/18%
Revenue By Source
Property rates 2 110 314 23.11% 116 933 22.91% 123 949 22.76% 131 385 22.16%
Property rates - penalties & collection charges 285 0.06% 302 0.06% 319 0.06% 338 0.06%
Serv ice charges - electricity rev enue 2 109 308 22.89% 123 179 24.13% 138 810 25.49% 156 425 26.38%
Serv ice charges - w ater rev enue 2 40 022 8.38% 42 546 8.34% 45 208 8.30% 48 037 8.10%
Serv ice charges - sanitation rev enue 2 41 816 8.76% 44 609 8.74% 47 570 8.73% 50 729 8.56%
Serv ice charges - refuse rev enue 2 29 079 6.09% 31 259 6.12% 33 604 6.17% 36 124 6.09%
Serv ice charges - other – 0.00% – 0.00% – 0.00% – 0.00%
Rental of facilities and equipment 1 322 0.28% 1 395 0.27% 1 465 0.27% 1 538 0.26%
Interest earned - ex ternal inv estments 3 911 0.82% 4 087 0.80% 4 271 0.78% 4 463 0.75%
Interest earned - outstanding debtors 2 558 0.54% 3 142 0.62% 3 313 0.61% 3 467 0.58%
Div idends receiv ed – 0.00% – 0.00% – 0.00% – 0.00%
Fines 30 591 6.41% 32 426 6.35% 34 047 6.25% 35 920 6.06%
Licences and permits 74 0.02% 78 0.02% 82 0.02% 86 0.01%
Agency serv ices 1 439 0.30% 1 518 0.30% 1 601 0.29% 1 689 0.28%
Transfers recognised - operational 98 634 20.66% 101 375 19.86% 102 694 18.86% 114 539 19.32%
Other rev enue 2 8 088 1.69% 7 598 1.49% 7 710 1.42% 8 203 1.38%
Gains on disposal of PPE – 0.00% – 0.00% – 0.00% – 0.00%
Total Revenue (excluding capital transfers
and contributions)
477 439 100.00% 510 447 100.00% 544 644 100.00% 592 945 100.00%
2014/15 Medium Term Revenue & Expenditure Framework
Source Amount (R Million) Percentage
Assessment Rates 116.93 22.91%
Electricity revenue 123.18 24.13%
Water revenue 42.55 8.34%
Sewerage Charges 44.61 8.74%
Refuse Charges 31.26 6.12%
Grants and subsidies 101.37 19.86%

Page | 200
Table 73: Operating transfers and grant receipts
Tariff Setting Tariff-setting is a pivotal and strategic part of the compilation of any budget. When rates, tariffs and other charges were revised, local economic conditions, input costs and the affordability of services were taken into account to ensure the financial sustainability of the Municipality.
National Treasury continues to encourage municipalities to keep increases in rates, tariffs and other charges as low as possible. Municipalities should justify in their budget documentation all increases in excess of the upper boundary of the South African Reserve Bank’s inflation target. Circular 72 state that, if municipalities continue to act in this manner that increase tariff above inflation, the National Treasury will have no other option but to set upper limits of tariff increases for property rates and service charges to which municipalities will have to conform. Excessive increases are likely to be counterproductive to economic growth and development, resulting in higher levels of non-payment.
The 14.2 percent increases in the average Eskom bulk purchase price once again exceeds the upper boundary of the Reserve bank inflation target resulting in an average proposed increase of 12.6% in the municipal electricity tariff. Other factors contributing to the rising cost include the anticipated collectively agreed upon wage increase which is also likely to be above upper boundary, the excessive increase in the price of operational cost like chemicals, spares and other materials that collectively contribute to the extent that tariffs needs to be increased annually.
Property Rates
Description Ref 2011/12 2012/13 2013/14
R thousandAudited
Outcome
Audited
Outcome
Audited
Outcome
Original
Budget
Adjusted
Budget
Full Year
Forecast
Budget Year
2015/16
Budget Year
+1 2016/17
Budget Year
+2 2017/18
RECEIPTS: 1, 2
Operating Transfers and Grants
National Government: 21 526 26 425 32 804 44 701 44 701 44 701 60 730 67 444 74 158
Local Gov ernment Equitable Share 18 978 23 375 29 614 40 946 40 946 40 946 57 298 65 012 71 575
Finance Management 1 250 1 250 1 300 1 450 1 450 1 450 1 450 1 475 1 550
Municipal Sy stems Improv ement 790 800 890 934 934 934 930 957 1 033
EPWP Incentiv e 502 1 000 1 000 1 371 1 371 1 371 1 052 – –
Municipal Infrastructure Grant (MIG) 6 – – – – – – – –
Provincial Government: 19 873 43 167 53 904 72 265 53 917 53 917 40 645 35 250 40 381
Housing 16 327 39 287 46 705 63 324 43 527 43 527 30 419 25 224 29 723
Proclaimed Roads 800 (498) 1 140 100 100 100 766 – –
Library Serv ices - Conditional Grant 425 468 525 2 007 2 007 2 007 1 471 1 559 1 653
Library Serv ices - MRF Grant 2 069 3 439 4 884 6 578 6 578 6 578 7 853 8 324 8 824
CDW - Operational Support 52 54 33 35 35 35 36 38 40
Thusong Centre – 218 218 221 221 221 100 105 141
Prov incial Management Support Grant 200 200 400 – 1 449 1 449 – – –
Total Operating Transfers and Grants 5 41 399 69 592 86 708 116 966 98 618 98 618 101 375 102 694 114 539
Capital Transfers and Grants
National Government: 24 065 29 203 15 949 26 914 26 914 26 914 29 703 28 253 26 199
Municipal Infrastructure Grant (MIG) 12 075 14 655 14 845 18 914 18 914 18 914 19 622 20 253 21 199
Intergrated National Electrification Program (INEG) 2 000 500 – 5 000 5 000 5 000 7 000 8 000 5 000
ACIP – – 1 104 3 000 3 000 3 000 3 081 – –
Neighbourhood Dev elopment Partnership 9 990 213 – – – – – – –
Municipal Drought Relief – 13 835 – – – – – – –
Other capital transfers/grants [insert desc] – – – – – – – – –
Provincial Government: – 732 19 060 300 20 847 20 847 14 771 12 116 –
Housing – – 18 589 – 20 547 20 547 14 611 12 116 –
Sport and Recreation Facilities – 200 – – – – – – –
Library Serv ices - MRF Grant – – 320 – – – 160 – –
Internal Audit Grant – 532 150 – – – – – –
Library Serv ices - Conditional Grant – – – 300 300 300 – – –
District Municipality: – – 329 – 1 372 1 372 – – –
Emergency Funding NDMC – – 329 – 1 372 1 372 – – –
Total Capital Transfers and Grants 5 24 065 29 935 35 337 27 214 49 133 49 133 44 474 40 369 26 199
TOTAL RECEIPTS OF TRANSFERS & GRANTS 65 464 99 527 122 045 144 180 147 750 147 750 145 849 143 063 140 738
Current Year 2014/152015/16 Medium Term Revenue &
Expenditure Framework

Page | 201
Property rates cover the cost of the provision of general services. Determining the effective property rate tariff is therefore an integral part of the municipality’s budgeting process. The municipality has recently completed the compilation of Supplementary Valuation roll 2 did not add significantly to the revenue base and it is anticipated that the trend will remain over the duration of the validity of the current valuation roll. A moderate, increase of 6% in the assessment rates tariff is none the less proposed for the 2015/2016 financial year. The following stipulations in the Property Rates Policy are highlighted: • The first R 15 000 of the market value of a property used for residential purposes is exempted
from the rate-able value (Section 17(h) of the MPRA). • In terms of the property rates policy of the municipality all residential properties (excluding
vacant stands) with a value of up to R 350,000 are exempted from paying assessment rates. • 100% rebate will be granted to registered indigents in terms of the Indigent Policy, based on
the maximum limits as contained in the policy. • Relief measures based on income also provides for rebates varying from 40% where the
monthly income of an owner is less than R 3,630 per month to 10% where the monthly income is less than R 6,050 per month.
• The following conditions apply to the granting of the rebates
- The rate-able property concerned must be occupied only by the applicant and his/her spouse.
- The applicant must submit proof of his/her age and identity and also proof of the annual income.
- The property must be categorized as residential. • The Municipality may also award a 100% rebate on the assessment rates of rate-able
properties of certain classes such as registered welfare organizations, institutions or organizations performing charitable work and public benefit organizations as defined in the property rates policy of the municipality. The owner of such a property must apply to the Chief Financial Officer in the prescribed format and at the prescribed date in order to qualify for the relief.
The categories of rate-able properties for purposes of levying rates and the proposed rates for the 2015/16 financial year based on a 6% increase from 1 July 2015 is contained below: Table 74 Comparison of proposed rates 2015/2016 to levied for 2014/15
Category Current Tariff (1 July 2014)
Proposed tariff (from 1 July 2015)
c/R c/R
Residential properties 0.494 0.523
State owned properties 0.494 0.523
Business & Commercial 0.825 0.875
Agricultural 0.123 0.130
Vacant land 0.641 0.679
Industrial 0.825 0.875
Non-permitted use 1.031 1.093
Public benefit organizations 0.825 0.875 Table 74: Comparison of proposed rates
Sale of Water and Impact of Tariff Increases

Page | 202
South Africa faces similar challenges with regard to water supply as it did with electricity, since demand growth outstrips supply. Budget Circular 67 makes specific reference to the fact that water tariffs should be cost reflective and that municipalities should ensure that water complies with all applicable quality standards. The water tariff structure must therefore ensure that: • Water tariffs are fully cost-reflective – including the cost of maintenance and renewal of
purification plants, water networks and the cost associated with reticulation expansion; • Water tariffs are structured to protect basic levels of service and ensure the provision of free
water to the poorest of the poor (indigent); and • Water tariffs are designed to encourage efficient and sustainable consumption. A tariff increase of 6.4% from 1 July 2015 for water is proposed. This is based on input cost assumptions inclusive of the increase in the cost of bulk water from Department of Water Affairs, standard levels set by the same department and increased wage bill of 6% and the cost of other inputs increasing by between 6% and 7%. In addition 6 kℓ water per month will again be granted free of charge to residents where the value of the property is below R 350, 000. A summary of the proposed tariffs for households (residential) and non-residential are as follows: Table 75 Proposed Water Tariffs
CATEGORY CURRENT TARIFFS
2014/15 PROPOSED TARIFFS
2015/16
Rand per kℓ Rand per kℓ
RESIDENTIAL
Basic/Minimum Charge 264.44 p.m. 281.36
(i) 0 to 25 kℓ Incl. in Basic charge Incl. in Basic charge
(ii) Above 25 to 30 kℓ 6.21 6.61
(iii) Above 30 to 40 kℓ 8.69 9.25
(iv) Above 40 to 50 kℓ 10.55 11.23
(v) Above 50 to 60 kℓ 13.66 14.53
(vi) Above 60 to 70 kℓ 17.39 18.50
(vii) Above 70 kℓ 34.15 36.34
NON-RESIDENTIAL
(i) 0 – 60 kℓ 8.57 9.12
(ii) Above 60 to 100 kℓ 19.41 20.65
(iii) Above 100 to 200 kℓ 22.19 23.61
(iv) Above 200 kl Excl. Laundromats 24.93 26.53
(v) Above 200 kl Laundromats 22.19 23.61 Table 75: Proposed water tariffs
The following table shows the impact of the proposed increases in water tariffs on the water charges for a single dwelling-house: Table 76 Comparison between current water charges and increases (Domestic)
Monthly Current amount Proposed amount Difference (Increase)
Percentage change
consumption payable payable
kℓ R R R
25 264.44 281.36 16.92 6.4%
30 295.47 314.38 18.91 6.4%
40 382.41 406.88 24.47 6.4%
50 487.94 519.17 31.23 6.4%
60 624.54 664.51 39.97 6.4%

Page | 203
70 798.42 849.52 51.10 6.4%
100 1822.80 1939.46 116.66 6.4% Table 76: Comparison between current water charges and increases
The tariff structure of the 2014/15 financial year has not been changed.
Sale of Electricity and Impact of Tariff Increases
NERSA has announced the revised bulk electricity pricing structure. A 14.2% increase in the Eskom bulk electricity tariff to municipalities will be effective from 1 July 2015. Considering the Eskom increases, the consumer tariff had to be increased by 12.6% to offset the additional bulk purchase cost as well as recover the additional cost components such as the increase in the wage bill, general expenditure and increased maintenance and material cost for the 2015/2016 financial year. The continued above average increase in electricity prices has resulted in a downward trend in the average consumption patterns of consumers in an attempt to mitigate the effect of the increased cost of electricity resulting in a negative impact on the municipal electricity revenue. The Minister of Finance in his budget speech announced a 2 cent charge per kWh on electricity, which has not been included in the tariffs nor in the purchase costs for purposes of drafting the proposed budget. Clarity is still sought in this regard and the impact on this on the budget will be made public as soon as possible. Registered indigents as well as sub-economic consumers will again be granted 50 kWh per month free of charge. The following table shows the impact of the proposed increases in electricity tariffs on the electricity charges for domestic customers:
Table 76 Comparison current vs. new electricity charges (Domestic up to 60A connection)
Monthly Current amount Proposed amount Difference Percentage
change
Consumption payable Payable (Increase)
kWh R R R
100.00 79.44 89.52 10.08 12.69
250.00 212.42 239.38 26.96 12.69
500.00 560.12 631.20 71.08 12.69
750.00 894.01 1007.46 113.45 12.69
1 000.00 1250.92 1409.66 158.74 12.69
2 000.00 2678.57 3018.48 339.91 12.69 Table 76: Comparison current vs. new electricity charges
Sanitation and Impact of Tariff Increases
A tariff increase of 6.8% for sanitation from 1 July 2015 is proposed. The increase in tariffs can also be ascribed to rising wage cost, the increase in electricity used in purification and pumping processes, the service standards set by Department of Water and Sanitation and the general increase in the price of goods and services. It must also be emphasized that the municipality must ensure that purification processes complies with quality standards and that green drop status is maintained. Additional budgetary allocation was made for the full time employment of process controllers and other waste water purification staff members critical in maintaining high quality purification processes and results.

Page | 204
Table 77 Comparison between current sanitation charges and increases
TARIFF PER Annum
TARIFF PER Annum
R R
Single Residential 3,904.00 4,169.47
Shops, B&B’s Offices, Hotels 6,002.00 6,410.14
Single residential used for business purposes, restaurants 7,803.00 8,333.61
Group housing and resort zones 3,904.00 4,169.47
Residential property valuation below R350,000 (70% / 50%rebate on single residential tariff)
1,171.20 2,084.74
Septic tank removals 360.00 384.48
Sanitation fee no waterborne sewerage 1,525.00 1,628.70 Table 77: Comparison between current charges and increases
The following table shows the impact of the proposed increases in sanitation tariffs on the amounts charged per consumer category Table 78 Comparison between current sanitation charges and new, per consumer type
Consumer type
Current amount
Proposed amount
Difference
payable Payable (% increase) R R R
Single Residential 3,903.90 4,169.37 265.47 6.8%
Shops, B&B’s Offices, Hotels
6,001.80 6,409.92 408.12 6.8%
Single residential used for business purposes, restaurants
7,802.55 8,333.12 530.57 6.8%
Group housing and resort zones
3,903.90 4,169.37 265.47 6.8%
Residential property valuation below R350,000
1,171.20 2,084.74 913.54 78%
Septic tank removals 359.74 384.20 24.46 6.8%
Sanitation fee no waterborne sewerage
1,524.60 1,628.27 103.67 6.8%
Table 78: Comparison between current charges and new per customer type
Waste Removal and Impact of Tariff Increases
Budget circular 66 and 67 state that municipalities should strive to budget for a moderate surplus in order to ensure that the required funding levels are maintained and to ensure that the provision for the rehabilitation of the land fill site is cash backed. The Municipality is currently in a process to close the current land fill site and it is therefore of essence that sufficient funds are available for the rehabilitation of the landfill site estimated to be in excess of R 6 Million. The construction of a waste transfer facility will commence upon conclusion of the revised EIA process and for the time being, the municipality has no alternative but to transport its waste to the Petro SA dumpsite in Mosselbay at an exorbitant cost. In an attempt to reduce this cost, composting of green waste will be done to reduce the volumes. Recycling is promoted to further reduce the volumes and subsequent cost of transporting of waste. The combined cost of transporting, composting and recycling is estimated at R 3.4 Million for the 2015/2016 financial year.

Page | 205
In accordance with the National Treasury directive cost reflective tariff setting is engaged with resulting in an increase of 7.5% in the waste removal tariff with effect from 1 July 2015. To avoid further higher than normal increases in the refuse tariff it is essential that consumers make use of composting and recycling to reduce refuse volumes. In order to ensure that all owners of property contribute fairly towards to cost associated with the service, an availability charge for refuse was implemented in the 2014/2015 budget year as the refuse facilities needs to make provision for all possible units of refuse generated measured in terms of all approved erven. The following table compares current and proposed amounts payable from 1 July 2015:
Table 79 Comparison between current waste removal fees and increases
Current Tariff Proposed Tariff
Difference %
2014/2015 2015/2016 Per Annum Difference
One removal per bin per week Per Annum (R) Per Annum (R) Per Annum
Domestic 80ℓ container removed once a week
2,065.80 2,220.74 154.94 7.5%
Domestic 240ℓ container removed once a week
2,167.39 2,329.94 162.55 7.5%
Business/Commercial 80ℓ container removed twice a week
2,686.66 2,888.16 201.50 7.5%
Business/Commercial 240ℓ container removed once a week
2,955.04 3,176.67 221.63 7.5%
Table 79: Comparison between current waste removal fees and increases
Overall impact of tariff increases on households
The following table shows the overall expected impact of the tariff increases on a large and small household, as well as an indigent household receiving free basic services. Note that in all instances the overall impact of the tariff increases on household’s bills has been kept to between 6% and 7.5%, with the increase for indigent households 0% due to full subsidization.

Page | 206
Table 80 MBRR Table SA14 – Household bills
Table 80: MBRR table SA 14-Household bills
Operating Expenditure Framework
Bitou Municipality’s expenditure framework for the 2015/16 budget and MTREF is informed by the following: • The asset renewal strategy and the repairs and maintenance plan; • Balanced budget constraint (operating expenditure should not exceed operating revenue)
unless there are existing uncommitted cash-backed reserves to fund any deficit; • The financial recovery of the municipality to ensure the required funding levels are achieved
and maintained.
2011/12 2012/13 2013/142015/16 Medium Term Revenue & Expenditure
Framework
Audited
Outcome
Audited
Outcome
Audited
Outcome
Original
Budget
Adjusted
Budget
Full Year
Forecast
Budget Year
2015/16
Budget Year
2015/16
Budget Year
+1 2016/17
Budget Year
+2 2017/18
Rand/cent % incr.
Monthly Account for Household - 'Middle
Income Range'
1
Rates and services charges:
Property rates 216.92 252.31 266.01 281.99 281.99 281.99 6.1% 299.12 316.81 335.65
Electricity : Basic lev y 265.20 183.60 187.20 201.05 201.05 201.05 12.7% 226.56 255.31 287.71
Electricity : Consumption 770.00 1 017.50 1 087.50 1 167.98 1 167.98 1 167.98 12.7% 1 316.19 1 483.22 1 671.44
Water: Basic lev y 204.47 237.59 251.85 264.44 264.44 264.44 6.4% 281.36 299.37 318.53
Water: Consumption 24.00 27.90 29.55 31.05 31.05 31.05 6.4% 33.05 35.15 37.40
Sanitation 250.58 3 494.00 309.83 325.33 325.33 325.33 6.8% 347.42 371.00 396.25
Refuse remov al 131.25 152.50 163.17 172.17 172.17 172.17 7.5% 185.08 199.00 213.92
Other – – – – – – – – – –
sub-total 1 862.42 5 365.40 2 295.11 2 444.01 2 444.01 2 444.01 10.0% 2 688.78 2 959.86 3 260.90
VAT on Serv ices 230.37 715.83 284.07 302.68 302.68 302.68 10.5% 334.55 370.03 409.54
Total large household bill: 2 092.79 6 081.23 2 579.18 2 746.69 2 746.69 2 746.69 10.1% 3 023.33 3 329.89 3 670.44
% increase/-decrease 190.6% (57.6%) 6.5% – – 10.1% 10.1% 10.2%
Monthly Account for Household - 'Affordable
Range'
2
Rates and services charges:
Property rates 153.58 178.64 188.34 199.66 199.66 199.66 6.1% 211.78 224.31 237.65
Electricity : Basic lev y 265.20 183.60 187.20 201.05 201.05 201.05 12.7% 226.56 255.31 287.71
Electricity : Consumption 385.00 417.50 444.50 477.39 477.39 477.39 12.7% 537.97 606.24 683.17
Water: Basic lev y 204.47 237.59 251.85 264.44 264.44 264.44 6.4% 281.36 299.37 318.53
Water: Consumption – – – – – – – – – –
Sanitation 250.58 3 494.00 309.83 325.33 325.33 325.33 6.8% 347.42 371.00 396.25
Refuse remov al 131.25 152.50 163.17 172.17 172.17 172.17 7.5% 185.08 199.00 213.92
Other – – – – – – – – – –
sub-total 1 390.08 4 663.83 1 544.89 1 640.04 1 640.04 1 640.04 9.2% 1 790.17 1 955.23 2 137.23
VAT on Serv ices 173.11 627.93 189.92 201.65 201.65 201.65 9.6% 220.97 242.33 265.94
Total small household bill: 1 563.19 5 291.76 1 734.81 1 841.69 1 841.69 1 841.69 9.2% 2 011.14 2 197.56 2 403.17
% increase/-decrease 238.5% (67.2%) 6.2% – – 9.2% 9.3% 9.4%
-1.28 -1.09 -1.00 - Monthly Account for Household - 'Indigent'
Household receiving free basic services
3
Rates and services charges:
Property rates – – – – – – – – – –
Electricity : Basic lev y 265.20 183.60 187.20 201.05 201.05 201.05 12.7% 226.56 255.31 287.71
Electricity : Consumption – – – – – – – – – –
Water: Basic lev y 204.47 237.59 251.85 264.44 264.44 264.44 6.4% 281.36 299.37 318.53
Water: Consumption – – – – – – – – – –
Sanitation 250.58 3 494.00 309.83 325.33 325.33 325.33 6.8% 347.42 371.00 396.25
Refuse remov al 131.25 152.50 163.17 172.17 172.17 172.17 7.5% 185.08 199.00 213.92
Other (851.50) (4 067.69) (912.05) (962.99) (962.99) (962.99) 8.0% (1 040.42) (1 124.68) (1 216.41)
sub-total – – – – – – – – – –
VAT on Serv ices – – – – – – – – – –
Total small household bill: – – – – – – – – – –
% increase/-decrease – – – – – – – –
Ref
Current Year 2014/15
Description

Page | 207
• Continued provision of basic services and financial sustainability • Operational gains and efficiencies will be directed to ensure appropriate cash backing of
statutory funds, provisions and reserves as well as funding the capital budget and other core services.
The following table is a high level summary of the 2015/16 budget and MTREF (classified per main type of operating expenditure):
Table 13 Summary of operating expenditure by standard classification item
The budgeted allocation for employee related costs for the 2015/16 financial year totals R 170, 3 Million, which equals 34% of the total operating expenditure. Based on the collective SALGBC wage agreement, salary increases have been factored into this budget at a percentage increase of 6% for the 2015/16 financial year. An annual increase of 6% has been included respectively for the 2016/2017 and 2017/2018 financial year In order to ensure economic viability and to not overstretch the already limited financial resources, cash management strategy and vacancies have to be significantly rationalized downwards and budgeted in a staggering manner. Only the positions that are critical for service delivery have been included in the 2015/2016 budget. These positions are mainly at electricity services, water and waste water, cemeteries and parks and to some extent the revenue and supply chain section. In line with National Treasury advocacy on use of external service providers, departments are to provide detailed exit plan on use of consultants before any positions can be funded and appointments be made within each directorate. In this MTREF funding of new post has been done in a staggering approach, meaning core service delivery positions and some critical positions are funded since last year and continue to take priority again. The cost associated with the remuneration of public office bearers is determined by the Minister of Co-operative Governance and Traditional Affairs in accordance with the Remuneration of Public Office Bearers Act, 1998 (Act 20 of 1998). The remuneration cost of councilors is partially subsidized through the equitable share allocation awarded to the municipality in terms of the division of revenue Act. An allocation in the amount of R 57 million is awarded to Bitou for the 2015/2016 financial year. The provision of debt impairment was determined based on an annual collection rate of 93.2% and the Debt Write-off Policy of the Municipality. The current average collection rate equals 97.5% as at end of February 2015 and it is anticipated that the recovery of debt, through the increase in debt
Description Ref 2011/12 2012/13 2013/14
R thousand 1Audited
Outcome
Audited
Outcome
Audited
Outcome
Original
Budget
Adjusted
Budget
Full Year
Forecast
Pre-audit
outcome
Budget Year
2015/16
Budget Year
+1 2016/17
Budget Year
+2 2017/18
2015/16 Medium Term Revenue &
Expenditure FrameworkCurrent Year 2014/15
Expenditure By Type
Employ ee related costs 2 100 829 111 342 132 990 145 381 149 341 149 341 149 341 170 376 187 915 201 954
Remuneration of councillors 3 735 4 043 4 701 5 032 5 047 5 047 5 047 5 029 5 343 5 691
Debt impairment 3 10 468 11 650 28 167 15 920 36 289 36 289 36 289 37 192 39 166 41 229
Depreciation & asset impairment 2 25 578 29 396 30 791 22 821 18 555 18 555 18 555 19 798 20 729 21 910
Finance charges 12 792 13 559 13 683 13 837 14 358 14 358 14 358 14 482 14 873 14 894
Bulk purchases 2 64 256 70 626 76 836 79 694 79 694 79 694 79 694 91 012 103 939 118 706
Other materials 8 – 2 548 3 044 3 155 3 536 3 536 3 536 3 503 3 665 3 851
Contracted serv ices 10 999 18 876 19 773 19 573 23 188 23 188 23 188 19 802 17 854 17 867
Transfers and grants 632 2 332 2 438 2 700 3 550 3 550 3 550 4 014 2 881 3 005
Other ex penditure 4, 5 78 138 86 943 97 945 152 581 154 829 154 829 154 829 135 264 132 559 142 208
Loss on disposal of PPE 25 – – 80 80 80 80 83 87 90
Total Expenditure 307 451 351 315 410 368 460 774 488 468 488 468 488 468 500 555 529 011 571 405

Page | 208
collection action will reach a level of 97% upon conclusion of the current financial year. The provision amounts to R 15,920 million for the 2015/16 financial year. Provision for depreciation and asset impairment has been informed by the Municipality’s Asset Management Policy. Depreciation is widely considered a proxy for the measurement of the rate at which assets are consumed. Budget appropriations in this regard total R 19, 7 million for the 2015/16 financial year and equates to 4% of the total operating expenditure. Finance charges consist primarily of the repayment of interest on long-term borrowing (cost of capital). Finance charges make up 3% (R14, 4 million) of operating expenditure excluding annual redemption for 2015/16 and remains constant through the remainder of the MTREF. Bitou Municipality has nearly reached its prudential limits for borrowing and care needs to be taken to ensure that annual finance charges remains within the affordability threshold of ratepayers and consumers considering the prevailing economic circumstances. Bulk purchases are directly informed by the purchase of electricity from Eskom. The annual price increases have been factored into the budget appropriations and directly inform the revenue provisions. The expenditure includes electricity distribution losses which equals 17%, Water distribution losses as at 30 June 2014 amounted to 7% and a concerted effort is necessary to ensure the reduction of the losses to within acceptable norms. Other materials comprise of amongst others the purchase of materials and spares for maintenance, cleaning materials and chemicals. In line with Bitou Municipality’s repairs and maintenance plan this group of expenditure has been prioritized to ensure sustainability of Bitou Municipality’s infrastructure. For 2015/16 the appropriation against this group of expenditure has slightly decreased by 0.99% Contracted services relates to the provision of services by means of the appointment of service providers where the necessary in-house skills are not available or have not yet been adequately developed. Certain functions also require the contracting of specialist knowledge contracted from time to time due to the fact that the municipality cannot afford to employ experts on a full-time basis. This category of expenditure decreases by (R3, 3 million). This again emphasizes the need to build capacity to ensure certain functions are performed in-house as recommended by National Treasury. Other expenditure comprises of various line items relating to the daily operations of the municipality. This group of expenditure has also been identified as an area in which cost savings and efficiencies can be achieved. Other expenditure decrease by 12.63% for the 2015/16 financial year and reduces with 2% for the 2016/2017 year, where-after it increase by 7.28% for the 2017/2018 year. The following graph gives a breakdown of the main expenditure categories for the 2015/16 financial year.
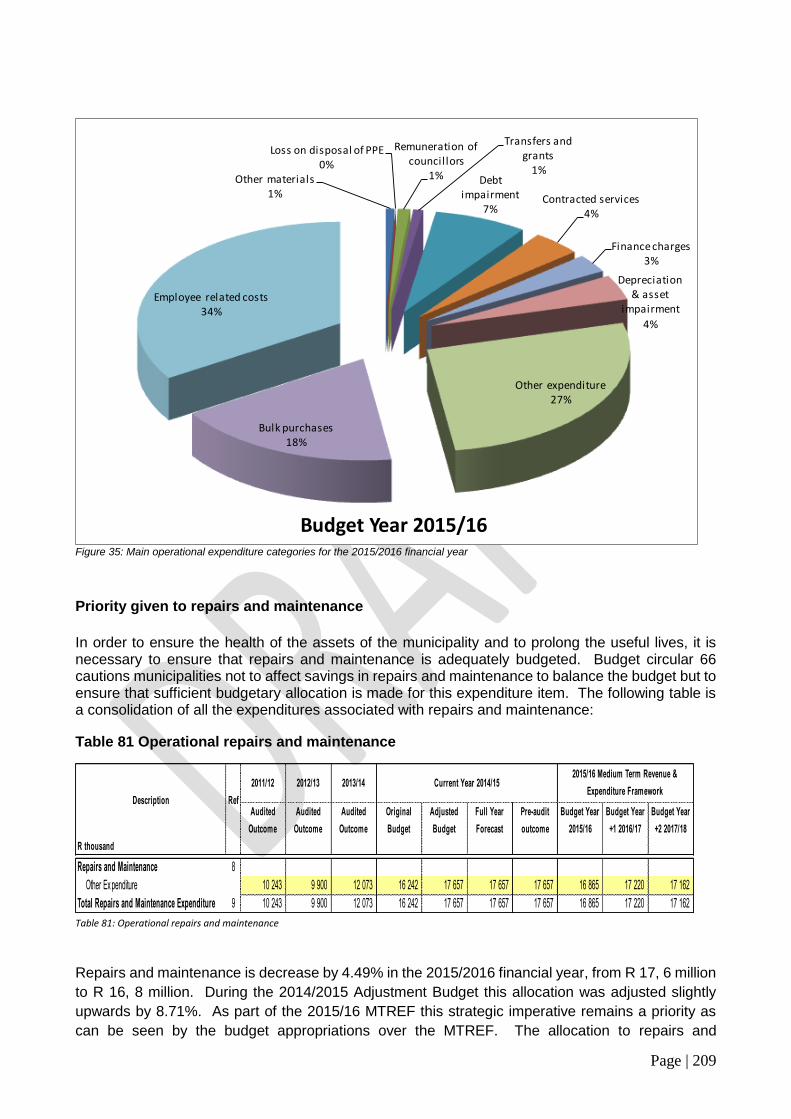
Page | 209
Figure 35: Main operational expenditure categories for the 2015/2016 financial year
Priority given to repairs and maintenance
In order to ensure the health of the assets of the municipality and to prolong the useful lives, it is necessary to ensure that repairs and maintenance is adequately budgeted. Budget circular 66 cautions municipalities not to affect savings in repairs and maintenance to balance the budget but to ensure that sufficient budgetary allocation is made for this expenditure item. The following table is a consolidation of all the expenditures associated with repairs and maintenance:
Table 81 Operational repairs and maintenance
Table 81: Operational repairs and maintenance
Repairs and maintenance is decrease by 4.49% in the 2015/2016 financial year, from R 17, 6 million
to R 16, 8 million. During the 2014/2015 Adjustment Budget this allocation was adjusted slightly
upwards by 8.71%. As part of the 2015/16 MTREF this strategic imperative remains a priority as
can be seen by the budget appropriations over the MTREF. The allocation to repairs and
Other materials1%
Loss on disposal of PPE0%
Remuneration of councillors
1%
Transfers and grants
1%Debt
impairment7%
Contracted services4%
Finance charges3%
Depreciation & asset
impairment
4%
Other expenditure27%
Bulk purchases18%
Employee related costs34%
Budget Year 2015/16
2011/12 2012/13 2013/14
Audited
Outcome
Audited
Outcome
Audited
Outcome
Original
Budget
Adjusted
Budget
Full Year
Forecast
Pre-audit
outcome
Budget Year
2015/16
Budget Year
+1 2016/17
Budget Year
+2 2017/18
R thousand
2015/16 Medium Term Revenue &
Expenditure FrameworkCurrent Year 2014/15
Description Ref
Repairs and Maintenance 8
Other Ex penditure 10 243 9 900 12 073 16 242 17 657 17 657 17 657 16 865 17 220 17 162
Total Repairs and Maintenance Expenditure 9 10 243 9 900 12 073 16 242 17 657 17 657 17 657 16 865 17 220 17 162

Page | 210
maintenance gradually increases over the MTREF and is reliant on the financial recovery of the
municipality to be further supplemented.
The table below provides a breakdown of the repairs and maintenance in relation to asset class:
Table 81 Repairs and maintenance per asset class
Table 82: Repairs and maintenance per asset class
For the 2015/16 financial year, 51.3% or R 8, 6 million of total repairs and maintenance will be spent on infrastructure assets. Electricity infrastructure receives an allocation totaling 14.5% (R2, 8 million), road infrastructure has received a slightly higher proportion of this allocation totaling 15.8% (R2, 6 million), sanitation 12.1% (R2,0 million) and water 4.7% (R801,000). Community assets have been allocated R 2, 8 million of total repairs and maintenance equating to 16.9%.
Free Basic Services: Basic Social Services Package
The social package assists households that are poor or face other circumstances that limit their ability to pay for services. To receive these free services the households are required to register in terms of Bitou Municipality’s Indigent Policy. It is estimated that between 6000 and 7000 households will receive subsidy on tariffs and rates in the 2015/2016 financial year, either by means of the full basket of services given as Indigent subsidies or in terms of the property value threshold where owners of properties with a value of less than R 350, 000 qualify for services at sub-economic tariffs. The estimated expenditure on free and subsidized services, inclusive of assessment rate rebates will exceed to R 21 Million for the 2015/2016 financial year. The results of Census 2011 has also shown that the population of Bitou have significantly increased over the last 10 years, making it the fourth fastest growing area, measured by population in the country from census to census. The indigent process is one of self-registration therefore households needing assistance must annually apply for the subsidy. Detail relating to free services, cost of free basis services, revenue lost owing to free basic services as well as basic service delivery measurement is contained in Table 27 MBRR A10 (Basic Service Delivery Measurement) The cost of the social package of the registered indigent households is largely financed by national government through the local government equitable share received in terms of the annual Division of Revenue Act.
Description Ref 2011/12 2012/13 2013/14
R thousandAudited
Outcome
Audited
Outcome
Audited
Outcome
Original
Budget
Adjusted
Budget
Full Year
Forecast
Budget Year
2015/16
Budget Year
+1 2016/17
Budget Year
+2 2017/18
Current Year 2014/152015/16 Medium Term Revenue &
Expenditure Framework
EXPENDITURE OTHER ITEMS
Depreciation & asset impairment 25 578 29 396 30 791 22 821 18 555 18 555 19 798 20 729 21 910
Repairs and Maintenance by Asset Class 3 10 243 9 900 12 073 16 242 17 657 17 657 16 865 17 220 17 162
Infrastructure - Road transport 1 793 1 659 3 144 2 485 2 465 2 465 2 667 2 805 2 950
Infrastructure - Electricity 1 688 1 540 2 022 2 874 2 832 2 832 2 445 2 543 2 645
Infrastructure - Water 31 134 255 722 682 682 801 833 866
Infrastructure - Sanitation 959 1 257 983 2 828 3 360 3 360 2 037 2 123 2 213
Infrastructure - Other 881 623 523 690 – – 718 746 –
Infrastructure 5 352 5 213 6 927 9 598 9 338 9 338 8 667 9 050 8 674
Community 2 097 1 846 1 958 1 832 1 861 1 861 2 854 2 655 2 729
Heritage assets – – – – – – – – –
Inv estment properties – – – – – – – – –
Other assets 6, 7 2 794 2 841 3 189 4 812 6 458 6 458 5 344 5 515 5 760
TOTAL EXPENDITURE OTHER ITEMS 35 821 39 296 42 865 39 063 36 212 36 212 36 663 37 949 39 072

Page | 211
Capital expenditure
The following table provides a breakdown of budgeted capital expenditure by vote: Table 82 2015/16 Medium-term capital budget per vote
Table 83: Medium-term capital budget per vote
An amount of R 48.47 million has been appropriated for the development of infrastructure that represents 58.69% of the total capital budget. New assets represent 95.5 cent or R 78, 8 million of the total capital budget while asset renewal equates to 4.5% or R 3.6 million. Further detail relating to asset classes and proposed capital expenditure is contained in Table 26 MBRR A9 (Asset Management). In addition to the MBRR Table A9, MBRR Tables SA34a, b, c provides a detailed breakdown of the capital program relating to new asset construction, capital asset renewal as well as operational repairs and maintenance by asset class. The following is a list of projects to be undertaken over the medium-term:
Vote Description Ref 2011/12 2012/13 2013/14
R thousand 1Audited
Outcome
Audited
Outcome
Audited
Outcome
Original
Budget
Adjusted
Budget
Full Year
Forecast
Pre-audit
outcome
Budget Year
2015/16
Budget Year
+1 2016/17
Budget Year
+2 2017/18
Capital expenditure - Vote
Multi-year expenditure to be appropriated 2
Vote 1 - Council – – – – – – – – – –
Vote 2 - Office of the Municipal Manager – – – – – – – – – –
Vote 3 - Community Serv ices – 351 1 745 6 000 6 767 6 767 6 767 12 668 260 –
Vote 4 - Corporate Serv ices – – – – – – – – – –
Vote 5 - Financial Serv ices – – – 1 000 1 000 1 000 1 000 1 000 – –
Vote 6 - Strategic Serv ices – – – – – – – – – –
Vote 7 - Municipal Serv ices and Infrastructure Dev elopment – 8 981 28 910 – 100 100 100 – 877 2 438
Capital multi-year expenditure sub-total 7 – 9 331 30 654 7 000 7 867 7 867 7 867 13 668 1 137 2 438
Single-year expenditure to be appropriated 2
Vote 1 - Council 43 11 – – – – – – – –
Vote 2 - Office of the Municipal Manager 10 – 44 – 223 223 223 310 – –
Vote 3 - Community Serv ices 17 577 334 26 858 4 814 20 906 20 906 20 906 25 848 21 244 24 343
Vote 4 - Corporate Serv ices – 30 248 – 686 686 686 – – –
Vote 5 - Financial Serv ices 2 414 59 1 508 1 483 2 384 2 384 2 384 1 859 – –
Vote 6 - Strategic Serv ices 38 218 369 – 114 114 114 150 – –
Vote 7 - Municipal Serv ices and Infrastructure Dev elopment 17 470 30 290 9 863 32 409 40 347 40 347 40 347 40 747 49 338 40 271
Capital single-year expenditure sub-total 37 551 30 942 38 890 38 706 64 661 64 661 64 661 68 914 70 582 64 613
Total Capital Expenditure - Vote 37 551 40 273 69 544 45 706 72 528 72 528 72 528 82 581 71 719 67 051
2015/16 Medium Term Revenue &
Expenditure FrameworkCurrent Year 2014/15

Page | 212
Table 84: Capital budget
Provision. Provision. Provision. FUNDING
Budget Budget Budget Sources
2015/2016 2016/2017 2017/2018
5 5 112 003 1 FURNITURE AND EQUIPMENT 40 000.00 CRR
5 5 210 046 1 FURNITURE AND EQUIPMENT 70 000.00 CRR
5 5 312 016 1 TOOLS AND EQUIPMENT 1 100 000.00 CRR
5 5 312 046 1 FURNITURE AND EQUIPMENT 240 000.00 CRR
5 5 320 012 1 PURCHASE OF LAND (GRANTS) 6 887 428.00 5 711 227.00 6 729 888.00 Housing
5 5 322 015 1 LDV LONG WHEEL BASE DIESEL 300 000.00 CRR
5 5 330 018 1 BOOK DETECTION SYSTEM 160 000.00 Library MRF Grant
5 5 330 039 1 UPGRADE OF MUNICIPAL BUILDINGS 750 000.00 500 000.00 Library MRF Grant
5 5 330 046 1 FURNITURE AND EQUIPMENT 165 000.00 Library MRF Grant
5 5 340 012 1 FIRE HYDRANTS 80 000.00 CRR
5 5 340 013 1 TOOLS AND EQUIPMENT 400 000.00 CRR
5 5 342 013 1 TOOLS AND EQUIPMENT 60 000.00 CRR
5 5 342 015 1 TRAILOR 200 000.00 CRR
5 5 342 032 1 LAND AND BUILDINGS 2 2 700 000.00 External Loans
5 5 350 034 1 EQUIPMENT 188 000.00 CRR
5 5 350 035 1 UPGRADE OF SPORTS FACILIT: MIG 438 596.00 2 562 275.00 1 754 386.00 MIG
5 5 412 003 1 FURNITURE AND EQUIPMENT 200 000.00 CRR
5 5 510 047 1 FURNITURE AND EQUIPMENT 200 000.00 CRR
5 5 540 013 1 COMPUTER EQUIPMENT 1 400 000.00 CRR
5 5 540 020 1 DR SERVER/STORAGE PROJECT 191 370.00 CRR
5 5 540 021 1 MAIN BUILDING NETWORK SWITCHES 58 965.00 CRR
5 5 540 022 1 COMPUTER REPLACEMENT 655 012.00 CRR
5 5 540 023 1 WIRELESS EQUIPMENT 175 665.00 CRR
5 5 540 026 1 WIRELESS UPGRADES 147 500.00 CRR
5 5 540 027 1 MANAGEMENT SOFTWARE 30 000.00 CRR
5 5 560 016 1 WATER MANAGEMENT DEVICES 1 000 000.00 External Loans
5 5 740 003 1 FURNITURE AND EQUIPMENT 1 150 000.00 CRR
5 5 820 023 1 TOOLS AND EQUIPMENT 140 000.00 130 000.00 40 000.00 CRR
5 5 820 032 1 STORM WATER IMPROVEMENTS 3 1 689 208.00 MIG
5 5 820 061 1 HOUSING SERVICES-QOLWENI 1 851 226.00 1 535 083.00 1 808 882.00 Housing
5 5 820 102 1 RURAL INFRASTRUCTURE DEV-CRR 366 013.00 CRR
5 5 820 105 1 INTEGRATED TRANSPORT PLAN-CRR 200 000.00 CRR
5 5 820 107 1 NON-MOTORISED TRANS FAC-CRR 900 000.00 980 000.00 1 000 000.00 CRR
5 5 820 200 1 SAFELY HOME PROGRAM-CRR 60 000.00 260 000.00 CRR
5 5 820 205 1 COMMUNITY DEVELOP PLAN-CRR 100 000.00 CRR
5 5 820 206 1 COMMUNITY DEVELOP PLAN-EFF 750 000.00 External Loans
5 5 820 207 1 KRANSHOEK-UPGRADING OF GRAVEL 1 315 789.00 2 441 461.00 2 631 579.00 MIG
5 5 820 208 1 UPGRADING OF UNPAVED ROADS-CRR 500 000.00 CRR

Page | 213
The following graph provides a breakdown of the capital budget to be spent on infrastructure related projects over the MTREF.
Figure 33 Capital Infrastructure Program
5 5 820 209 1 REHABILIT OF PAVED ROADS-CRR 3 646 771.00 3 426 291.00 3 308 407.00 CRR
5 5 820 307 1 KWANO:UPGRADING GRAVEL ROAD-MI 1 315 789.00 1 816 451.00 1 245 263.00 MIG
5 5 820 308 1 KWANO-UPGRADE SISHUBA EXT-MIG 877 193.00 1 754 386.00 MIG
5 5 824 000 1 REPLACEMENT OF FLEET VEHICLE 6 000 000.00 CRR
5 5 824 001 1 NEW PLAN & MACHINERY 2 500 000.00 CRR
5 5 830 006 1 WASTE TRANSFER STATION (G) 877 193.00 MIG
5 5 830 007 1 WASTE TRANSFER STATION 5 000 000.00 External Loans
5 5 830 100 1 WASTE TRANSFER ST:E&M-MIG 3 698 919.00 MIG
5 5 830 101 1 WASTE TRANSFER ST:E&M-EFF 1 268 800.00 External Loans
5 5 840 033 1 KWANO OUTFALL SEWER 1 754 386.00 2 631 579.00 MIG
5 5 840 034 1 TOOLS AND EQUIPMENT 170 000.00 40 000.00 80 000.00 CRR
5 5 840 061 1 QOLWENI/BOSSIESGIF 2 408 756.00 1 997 401.00 2 353 660.00 Housing
5 5 840 102 1 UPGRADING OF PUMPSTATION-GRANT 2 702 632.00 ACIP
5 5 840 103 1 UPGRADING OF PUMPSTATION-CRR 1 000 000.00 CRR
5 5 840 104 1 UPGRADING OF PUMPSTATION-EFF 600 000.00 500 000.00 External Loans
5 5 840 105 1 UPGRADING OF TELEMATRY-CRR 770 000.00 CRR
5 5 840 107 1 UPGRADE WASTE WATER TREAT-CRR 80 000.00 700 000.00 CRR
5 5 840 108 1 UPGRADE BPS PUMPSTATION-GRANT
5 5 840 109 1 UPGRADE BPS PUMPSTATION-CRR 405 000.00 917 000.00 CRR
5 5 840 200 1 UPGRADE BPS PUMPSTATION-EFF 1 000 000.00 3 890 000.00 4 890 000.00 External Loans
5 5 840 202 1 UPGRADE PBS OUTFALL SEWER-CRR 366 000.00 CRR
5 5 840 206 1 SECURITY FOR SITE SITES-CRR 250 000.00 250 000.00 250 000.00 CRR
5 5 840 207 1 PUMP STATION EQUIPMENT-CRR 300 000.00 CRR
5 5 840 036 1 STORMWATER IMPROV-GRANT 1 066 048.00 Disaster
5 5 850 016 1 ELECTIFICATION:HOUSING PROGRAM 6 140 351.00 7 017 544.00 4 385 965.00 INEP
5 5 850 046 1 TOOLS AND EQUIPMENT 150 000.00 150 000.00 CRR
5 5 850 062 1 STREET LIGHTS-GRANT 1 130 934.00 1 497 136.00 MIG
5 5 850 063 1 STREET LIGHTS-CRR 500 000.00 400 000.00 300 000.00 CRR
5 5 850 064 1 ELECTRICITY MASTER PLANS-CRR 2 183 000.00 2 800 000.00 CRR
5 5 850 065 1 ELECTRICITY MASTER PLANS-EFF 7 131 200.00 8 988 800.00 External Loans
5 5 850 066 1 UNIT DEVELOPMENT PLAN-CRR 1 300 000.00 4 000 000.00 1 750 000.00 CRR
5 5 850 067 1 UNIT DEVELOPMENT PLAN-EFF 2 000 000.00 1 000 000.00 2 000 000.00 External Loans
5 5 850 206 1 SECURITY KEY SITES-CRR 150 000.00 150 000.00 CRR
5 5 860 023 1 TOOLS AND EQUIPMENT 53 000.00 150 000.00 CRR
5 5 860 047 1 RETICULATION UPGRADES & REPLAC 400 000.00 900 000.00 700 000.00 External Loans
5 5 860 049 1 KEURBOOMS WATER SUPPLY AND ABS 877 193.00 2 438 071.00 MIG
5 5 860 055 1 WATER DEMAND MANAGEMENT(PRESSU 355 000.00 455 000.00 20 000.00 CRR
5 5 860 061 1 QOLWENI/BOSSIESGIF 1 669 261.00 1 384 192.00 1 631 078.00 Housing
5 5 860 062 1 ROODEFONTEIN DAM UPGRADES 3 877 193.00 1 754 386.00 MIG
5 5 860 084 1 SUPPLY TO KWANO & SURROUNDS 6 745 851.00 2 430 923.00 MIG
5 5 860 091 1 WATER TREAMENT WORKS UPGRD-CRR 375 000.00 CRR
5 5 860 102 1 KURLAND WTW,WATER SUPP,BOREHOL 877 193.00 1 754 386.00 MIG
5 5 860 103 1 UDP KRANSHOEK WATER SUPP-GRANT 1 754 386.00 2 631 579.00 MIG
5 5 860 105 1 NEW NATURESVALLEY RES&PIPELINE 500 000.00 2 000 000.00 CRR
5 5 860 107 1 DISTRIBUTION SYSTEMS-CRR 2 525 000.00 3 241 000.00 CRR
5 5 860 108 1 BULK SUPPLY SYSTEMS-GRANT
5 5 860 109 1 BULK SUPPLY SYSTEMS-CRR 1 695 000.00 1 800 000.00 CRR
5 5 860 200 1 WDM:TELEMETRY@RESERV&PUMPSTATI 570 000.00 200 000.00 70 000.00 CRR
5 5 860 206 1 SECURITY FOR KEY SITES-CRR 300 000.00 270 000.00 270 000.00 CRR
5 5 860 207 1 PUMP STATION EQUIPMENT-EFF 500 000.00 500 000.00 500 000.00 External Loans
82 581 264.00 71 719 341.00 67 051 495.00
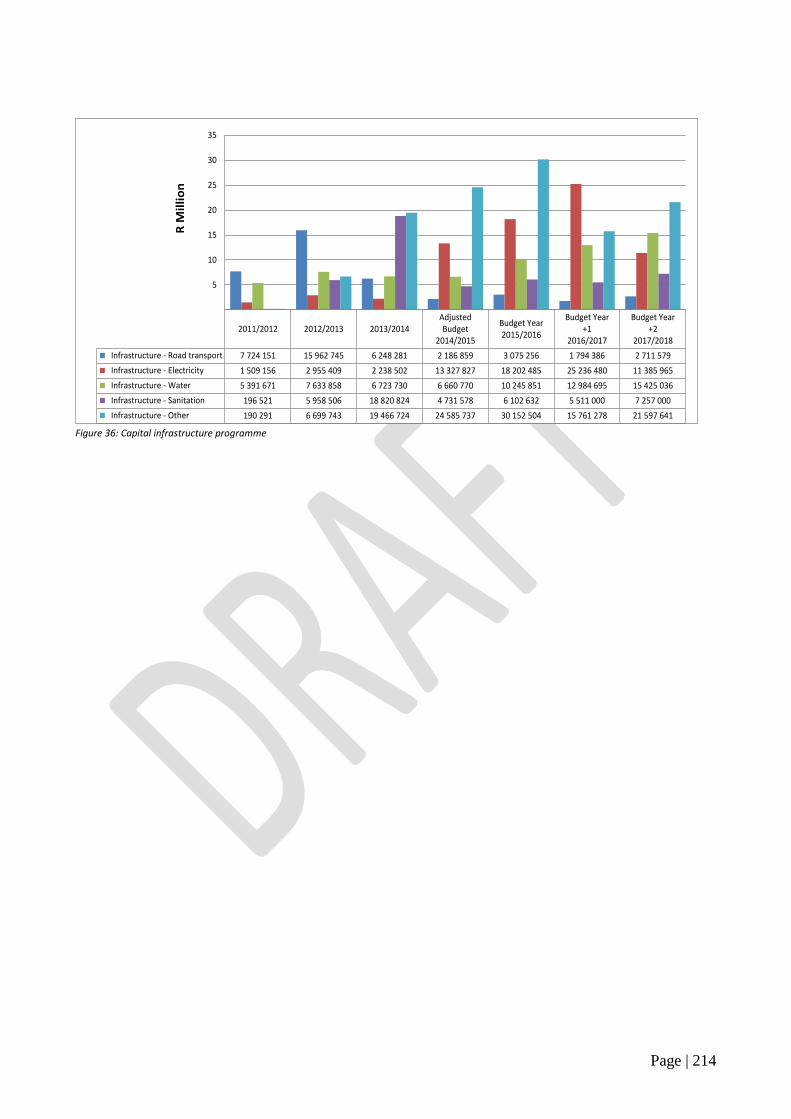
Page | 214
Figure 36: Capital infrastructure programme
2011/2012 2012/2013 2013/2014AdjustedBudget
2014/2015
Budget Year2015/2016
Budget Year+1
2016/2017
Budget Year+2
2017/2018
Infrastructure - Road transport 7 724 151 15 962 745 6 248 281 2 186 859 3 075 256 1 794 386 2 711 579
Infrastructure - Electricity 1 509 156 2 955 409 2 238 502 13 327 827 18 202 485 25 236 480 11 385 965
Infrastructure - Water 5 391 671 7 633 858 6 723 730 6 660 770 10 245 851 12 984 695 15 425 036
Infrastructure - Sanitation 196 521 5 958 506 18 820 824 4 731 578 6 102 632 5 511 000 7 257 000
Infrastructure - Other 190 291 6 699 743 19 466 724 24 585 737 30 152 504 15 761 278 21 597 641
5
10
15
20
25
30
35
R M
illi
on

Page | 215
CHAPTER 9: PERFORMANCE MANAGEMENT
This Chapter deals with the implementation and monitoring of the IDP projects and programmes
aimed at achieving the vision and objectives of the Municipality as set out in this document. The IDP
and Budget are implemented through a Service Delivery and Budget Implementation Plan (SDBIP).
The Top Layer SDBIP is used as a scorecard to measure, monitor, evaluate and report on
institutional performance (monthly, quarterly, bi-annual and annual basis). The Departmental SDBIP
measures the performance of the departments and performance agreements and plans are used to
measure the performance of employees.
9.1 PERFORMANCE MANAGEMENT
The Performance Management System implemented at the Municipality is intended to provide a
comprehensive, step by step planning system that helps the Municipality to manage the process of
performance planning and measurement effectively. The PM System serves as primary mechanism
to monitor, review and improve the implementation of the Municipality IDP and eventually the budget.
The performance management policy framework was approved by Council which provided for
performance implementation, monitoring and evaluation at organisational as well as individual levels.
Figure 37: Bitou Municipality performance management framework is reflected in the diagram below:
Figure 37: Bitou Municipality performance management framework
9.2 ORGANISATIONAL PERFORMANCE
The organisational performance of the Municipality is evaluated by means of a municipal scorecard
(Top Layer SDBIP) at organisational level and through the service delivery budget implementation

Page | 216
plan (SDBIP) at directorate and departmental levels. The Top Layer SDBIP set out consolidated
service delivery targets and provides an overall picture of performance for the Municipality as a
whole, reflecting performance on its strategic priorities.
Figure 38: Bitou Municipality's performance management system
The departmental SDBIP capture the performance of each defined department which reflects on the
strategic priorities of the Municipality. The SDBIP provides detail of each outcome for which the
senior management is responsible for, in other words a comprehensive picture of the performance
of that directorate/sub-directorate.
9.3 INDIVIDUAL PERFORMANCE
The Municipality have implementing a performance management system for all its senior managers
(Section 56 and 57 employees). This has led to specific focus on service delivery. Each manager
has to develop a scorecard which is based on the balanced scorecard model. At the beginning of
each financial year (01 July 2015) all senior managers (Section 57 employees) will sign Performance
Agreements for the 2015/ 2016 financial year.

Page | 217
The Municipality has instituted all performance management committees including the performance
audit committee is tasked to audit performance outcomes against the planned KPI’s and Targets.
To improve service delivery and employee morale, the Municipality is planning to cascade
Performance management to the lower levels in the organisation beginning with the middle
managers in the initial roll-out (2014/ 2015).
9.4 KEY PERFORMANCE INDICATORS (KPI'S)
Section 38 (a) of the Systems Act requires Municipalities to set appropriate key performance
indicators as a yardstick for measuring performance, including outcomes and impact, with
regard to the community development priorities and objectives set out in its Integrated
Development Plan. Section 9 (1) of the Regulations to this Act maintains in this regard, that
a Municipality must set key performance indicators, including input indicators, output
indicators and outcome indicators in respect of each of the development priorities and
objectives.
Every year, as required by Section 12 (1) of the Regulations to the Systems Act, the
Municipality also set performance targets for each of the key performance indicators. The
IDP process and the performance management process are therefore seamlessly
integrated. In addressing the challenge of developing smart indicators the following general
key performance indicators are prescribed in terms of section 43 of the Act were adopted
by the Municipality as a barometer of writing smart KPI’s and targets:
a. The percentage of households with access to basic level of water, sanitation,
electricity and solid waste removal;
b. the percentage of households earning less than R1100.00 per month with access to
free basic services;
c. the percentage of a Municipality's capital budget actually spent on capital projects
identified for a particular financial year in terms of the Municipality's integrated
development plan;
d. the number of jobs created through Municipality's local economic development
initiatives including capital projects;
e. the number of people from employment equity target groups employed in the three
highest levels of management in compliance with a Municipality's approved
employment equity plan;
f. the percentage of a Municipality's budget actually spent on implementing its
workplace skills plan; and
g. financial viability as expressed by the following ratios:
Where-
'A' represents debt coverage
'B' represents total operating revenue received
'C' represents operating grants

Page | 218
'D' represents debt service payments (i.e. interest + redemption) due within the
financial year;
(ii)
Where-
'A' represents outstanding service debtors to revenue
'B' represents total outstanding service debtors
'C' represents annual revenue actually received for services;
(iii)
Where-
'A' represents cost coverage
'B' represents all available cash at a particular time
'C' represents investments
'D' represents monthly fixed operating expenditure.
9.5 PERFORMANCE REPORTING
Performance is reported on a regular basis and it includes the evaluation of performance,
the identification of poor performance and corrective actions to improve performance.
9.5.1 QUARTERLY REPORTS
Reports on the performance in terms of the Top Level SDBIP are generated from the system
and submitted to Council. This report is published on the municipal website on a quarterly
basis. Informal performance evaluations for the municipal manager and the heads of
departments, followed after the adoption of the first quarter performance report. This is done
in accordance to the performance agreements signed by the incumbents as well as the
performance regulations governing the performance of municipal managers and managers
directly accountable to the municipal manager.
9.5.2 MID-YEAR ASSESSMENT
The performance of the first 6 months of the financial year should be assessed and reported
on in terms of section 72 of the MFMA. This assessment must include the measurement of
performance, the identification of corrective actions and recommendations for the
adjustments of KPI’s, if necessary.
The format of the report must comply with the section 72 requirements. This report is
submitted to Council for approval before 25 January of each year and published on the
municipal website. A section 72 report was adopted by Council on 22 January 2015 (Council
Resolution number: C/6/264/01/15) and it was placed on the municipal website as per the
legal requirement. Mid-year performance evaluations for the municipal manager and the
heads of departments followed in accordance to the municipal performance regulations for
municipal managers and managers reporting directly to the municipal manager.
9.5.3 ANNUAL ASSESSMENT

Page | 219
The performance of the financial year should be assessed and reported on in terms of
section 46 of the MSA. The Municipality will analyse its performance and report on its
performance annually before the end of August. The performance report will be submitted
to the Office of the Auditor-General for audit purposes where after it will be included in the
annual report of the Municipality. The Annual Report is completed in the new format
prescribed by National Treasury.
The draft 2013/ 2014 Annual Report was tabled in Council on the 22nd January 2015
(Council Resolution number C/6/265/01/15). Copies of the annual report were placed in all
public offices, it was also advertised in the local newspapers on 29 January 2015, and also
placed on the municipal website.