bison conservation in the northern great plains michel …€¦ · bison conservation in the...
TRANSCRIPT

BISON CONSERVATION IN THE NORTHERN GREAT PLAINS
By
MICHEL THOMAS KOHL
B.S., University of Montana, Missoula, Montana 2008, USA
Thesis
presented in partial fulfillment of the requirements
for the degree of
Master of Science
in Wildlife and Fisheries Biology
The University of Montana,
Missoula, Montana
June 2012
Approved by:
Sandy Ross, Associate Dean of The Graduate School
Graduate School
Paul R. Krausman, Committee Chair
Wildlife Biology Program
Kerry R. Foresman
Division of Biological Science
Mark Hebblewhite
Wildlife Biology Program
Kyran Kunkel
Wildlife Biology Program

ii
Kohl, Michel, M.S., May 2012 Wildlife Biology
Bison Conservation in the Northern Great Plains
Chairperson: Paul R. Krausman
Temperate grasslands are the least protected ecosystem in the world. In North America, only <
4% of tallgrass prairie, 64% of mixed-grass prairie, and 66% of shortgrass prairie are intact.
Historically, grazing played an important role in maintaining prairie landscapes through nutrient
cycling and the diversification of vegetation structure and composition. Within grasslands, the
plains bison (Bos bison) was the most numerous and influential grazer. However, by 1900 bison
were reduced to ≤ 1,000 animals throughout North America. Today, bison are scattered
throughout their historical range, numbering > 500,000 individuals. Recent questions have
surfaced regarding the success of this effort, however, because < 21,000 plains bison are
managed as conservation herds (n = 62) and 8% of those herds are managed on areas of > 2,000
km2. In addition, >100,000,000 cattle now graze rangelands in the U.S. and Canada leading to
questions regarding the ecological significance of replacing bison with livestock. Our objectives
were to increase knowledge regarding the ecological similarities between bison and cattle, and to
determine how both species can be managed to mimic ecological patterns that approximate
historical bison populations. We used behavioral observations, movement analyses, and
Resource Selection Function (RSF) analyses too quantify similarities and differences between
the bison and cattle in the Northern Great Plains. We observed a higher proportion of time spent
grazing by cattle (45-49%) than bison (26-28%) and a greater amount of time spent at water. We
used First-Passage-Time (FPT) analyses to compare the spatial scale of bison and cattle within
pastures. We report selection of spatial scales by bison of 1.8 – 9.0 x greater than currently
provided. Lastly, RSF analysis identified important resources including selection of water
resources by bison. These results have implications when bison are used to meet grazing
restoration objectives because water resources may alter grazing regimes important for prairie
obligate species (i.e. grassland birds). For livestock, the time spent at water and grazing
encourages grazing practices that increase grazing rotation and movement across the landscape.
These may include changes in timing and intensity of grazing, and adjustable mineral and water
resources.

iii
ACKNOWLEDGMENTS
This project was a cooperative effort between groups and organizations. Kyran Kunkel
was essential in the establishment of this project and allowed me to take the project in directions
I envisioned. The staff at the American Prairie Reserve was always engaged with a positive
outlook for the project. I thank Bryce Christensen, Damien Austin, and Ganay Johnson for
advice and understanding of comments and concerns. The staff at the Northern Great Plains
Program of World Wildlife Fund was exceptional. In particular, I thank Kristy Bly who played
an important role in this project through her facilitation of internal politics, logistical assistance,
and engaging questions. In addition, I had the pleasure of working with the incredible staff at
Grasslands National Park that provided access, accommodations, and hospitality on trips to the
North. Of them, I thank Rob Sissons for his logistical assistance. Also, I thank Wes Olson for
providing his immeasurable knowledge of bison to this project and to him and his wife, Johanne,
for their hospitality, encouragement, and thoughtfulness. I thank Keith Aune, of Wildlife
Conservation Society, for his dedication to this project and to bison conservation as a whole.
Lastly, this project would not be what it is without access to land and animals provide by the
Barnard and Weiderrick Ranches. In addition, Gene Barnard, Jerry Mahan, and Chuck Mahan
were incredible neighbors and hosts during my time in south Phillips County. Kenneth Plourde
was instrumental in data collection, analysis, and providing needed conversation during the long
wet summer months. Kristina Gunderson, Anna Derey-Wilson, and Taylor King assisted with
volunteer and data entry work. Shawn Cleveland served as a sounding board for questions and
concerns throughout the project. I thank the Boone and Crockett Program and Fellows for their
companionship. In particular, Jerod Merkle was always available, assisting in coursework and
research during the early years of this project. Accordingly, I would like to recognize my

iv
committee, Kyran Kunkel, Kerry Foresman, and Mark Hebblewhite for their guidance and
encouragement. Lastly, I thank 3 people that facilitated my research, my career, and my
personnel life. Jeanne Franz made the day brighter, the path easier, and the lunch sweeter, thus,
will always have my thanks. Second, none of this would be possible without my advisor, Dr.
Paul R. Krausman. His guidance, understanding, and faith in a kid from north-eastern Montana
cannot be overstated. Paul was a greater mentor in research, personal life, and attire and I will
always carry this knowledge with me. Lastly, I thank my family who has encouraged and
supported me throughout my education career. In particular, I thank my beautiful wife, Erin,
who has struggled through distant summers and long winters with me over the past 3 years and I
am eternally indebted to you. Research funding was provided by the American Prairie Reserve,
the Boone and Crockett Wildlife Conservation Program at the University of Montana, the M. J.
Murdock Charitable Trust, the Wildlife Conservation Society Research Fellowship Program, and
the World Wildlife Fund- Northern Great Plains Program. Educational expenses were supported
by the Alfred P. Sloan Foundation, the Boone and Crockett Wildlife Conservation Program at the
University of Montana, the Montana Institute on Ecosystems, and the University of Montana.
v
TABLE OF CONTENTS
ABSTRACT……………………………………………………………………………… ii
ACKNOWLEDGEMENTS…...………………………………………………………….iii
TABLE OF CONTENTS……………………………………………………………......... v
LIST OF TABLES………………………………..…………………………………….. vii
LIST OF FIGURES…………...…………………………………………………………viii
CHAPTER 1. Introduction……..………………………………………………………. 1
THESIS FORMAT……………………………………………………………….. 6
LITERATURE CITED…………………………………………………………… 7
CHAPTER 2. Bison Versus Cattle: Are They Ecologically Synonymous?................ 12
TITLE PAGE………………………..………………………………………….. 12
ABSTRACT……………………….…………………………………………..... 13
KEY WORDS…………………...………………………………………………. 14
INTRODUCTION…………….………………………………………………… 14
METHODS…………………...…………………………………………………. 18
Study Area…………………………………………………………………. 18
GPS Data Collection……………………………………………………….. 21
Landscape Variables…...……………………………………………..……. 22
Behavior……………………………………………………………………. 22
Movement…………………………………………………………………... 23
Resource Selection…………………………………………………………. 25
RESULTS…………………………………………………………………..…… 27
Behavior…………………………………………………………………….. 27
Movement…………………………………………………………………... 28

vi
Resource Selection…………………………………………………………. 29
Bison…………………………………………………………………….. 29
Cattle…………………………………………………………………...... 29
DISCUSSION…………………………………………………………………… 30
Behavior…………………………………………………………………….. 30
Movement………………………………………………………………....... 32
Resource Selection…………………………………………………………. 33
IMPLICATIONS…………………………………………………………...….... 35
ACKNOWLEDGMENTS…………………………….………………………… 36
LITERATURE CITED………………………………………………………….. 36
APPENDIX……………………………………………………………………… 63
Appendix A: Vegetation Classification…….………………………..……. 63
Appendix B: Grazing Time and Intensity…………………………….….. 64
Appendix C: Resource Selection Function – APR……………………...... 65
Appendix D: Resource Selection Function – GNP (Summer)…………... 66
Appendix E: Resource Selection Function – GNP (Annual)………......... 67
Appendix F: Resource Selection Function – Barnard………………....... 68
Appendix G: Resource Selection Function – Weiderrick…………….…. 69
Appendix H: Summary of Results…………………………..….…………. 70
Appendix I: Spatial Use………..………………………………………….. 71

vii
LIST OF TABLES
Chapter 2
Table 1. Description of grazing pastures and stocking densities for animals owned
by American Prairie Reserve (APR), Parks Canada (PC), Weiderrick
Ranch (WR) and Barnard Ranch (BR). Analysis was performed on annual
bison range (Park) and within summer home range (NE Corner) in
Grasslands National Park (GNP). The GNP is located 20 km southeast of
Val Marie, SK, Canada and other sites are located 74 km south of Malta,
MT, USA. ….…….………………………………………………………59
Table 2. Collar ID, fix interval, and collection dates for female bison in
Grasslands National Park (GNP) and American Prairie Reserve (APR) and
collection dates for female cattle on Barnard Ranch (Br) and Weiderrick
Ranch (WR)………………………………………………………..……. 60
Table 3. Proportion of time of behavioral activities observed from 1 June – 31
August (2010, 2011) of bison on American Prairie Reserve (APR) and
Grasslands National Park (GNP) and cattle on Barnard Ranch (BR) and
Weiderrick Ranch (WR)……………………………………...………..... 61
Table 4. Coefficient estimates from Resource Selection Functions of summer
2010 and 2011 bison use on American Prairie Reserve (APR) and
Grasslands National Park (GNP). Analysis was calculated within summer
range (summer) and within annual range (annual) in GNP. Coefficient
values were calculated for cattle on Barnard and Weiderrick Ranches.
Dashes identify non-significant values. Variables unavailable for
calculation are identified by NA. Significance at > 0.05. ….………...... 62

viii
LIST OF FIGURES
Chapter 2
Figure 1. Inventory of bison and cattle numbers from historic to current periods in
North America. Bison historic estimates are estimated from commonly
accepted literature on historic bison numbers. Bison estimates from 1890
to present were collected by Boyd 2003 and Gates et al. 2010.
Conservation herds denote bison herds that are not managed for
commercial purposes. Cattle inventory numbers were provided by U.S.
Department of Agriculture and Statistics Canada. …………...………... 50
Figure 2. Location of bison and cattle study sites. Bison herds were located at
American Prairie Reserve (diamond) and Grasslands National Park (star).
Two cattle herds are located in pastures adjacent to APR bison herd. The
GNP is located 20 km southeast of Val Marie, SK, Canada and other sites
are located 74 km south of Malta, MT, USA ……….…………………... 51
Figure 3. Location of bison and cattle pastures for bison-cattle study on and
adjacent to American Prairie Reserve. White identifies artificial stock
reservoirs and remnant pools within ephemeral streams. ….…………… 52
Figure 4. Location of Grasslands National Park bison pasture for bison-cattle
study. White identifies perimeter of artificial stock reservoirs and remnant
pools within ephemeral streams. Dashed line identifies main ecotour route
through the park. ..……………………………………………………… 53
Figure 5. Results of First Passage Time (FPT) analysis for 1 female bison during
summer 2010 on American Prairie Reserve (A) and in Grasslands National
Park (B) and for one domestic female during summer 2010 on Barnards

ix
Ranch (C) and on Weiderrick’s Ranch (D. Peaks in variance of FPT
identify the spatial scale at which consumers perceive their resources. X-
axis is a measure of a circles radius……………………....……………... 54
Figure 6. Probability of use for intermediate green vegetation (NDVI values) for
bison on Grasslands National Park (GNP) and American Prairie Reserve
(APR) and cattle on APR. Selection of NDVI was compared across entire
pasture (Ann) and within summer range (Sum) on GNP. Selection was fit
to a quadratic relationship for both species to identify whether selection
was occurring for intermediate forage biomass.......………………….…. 55
Figure 7. Visual comparison of fence effect of First Passage Time analysis (FPT)
for bison and cattle on Grasslands National Park (GNP) and American
Prairie Reserve (APR). Dotted lines represent average transversable
distance across pastures. Cattle on Barnard Ranch (A) demonstrate a
small-scale selection within their pasture (circle). Bison on GNP (B) do
not identify scales under 5,000 m radii, however, average transferable
distance across the pasture coincides with secondary peaks at ~10,000 m
radii supporting areas around 6,000 m radii as the scale of selection by
bison in a large pasture….………....………….……….…………………56
Figure 8. Graphical representation of transversable distance across Grasslands
National Park bison. Kernel density home range estimate (95%)
overlayed on GPS locations from 2010 and 2011. Measurement lines (12
km) of transversable distance provides support to hypothesis that seasonal

x
use is identified by FPT analysis at scales >10,000 m radii, thus ~6,000 m
radii represent spatial scale use....…………………………………….…. 57
Figure 9. Probability of use for bison and cattle in relation to distance to water.
Calculated using averaged values from RSF across years and locations for
bison and cattle on GNP and APR..………………………………….…. 58

1
CHAPTER 1
INTRODUCTION
Grasslands historically encompassed ~30% (46,000,000 km2) of Earth’s landmass,
comprising almost 42% of the planets plant cover (Anderson 2006). Today, temperate
grasslands (~12,000,000 km2) are the least protected biome in the world as a result of human-
induced modification (Hoekstra et al. 2005). These include a host of human disturbances that
result in habitat conversion and degradation. Nearly 46% of temperate grassland habitats have
been converted from native grassland and < 5% of remaining temperate grasslands are protected
(Hoekstra et al. 2005). In North America, temperate grassland, once covered 162,000 km2, but
conversion has now surpassed 50% (Hoekstra et al. 2005) leaving < 4% of tallgrass prairie, 64%
of mixed-grass prairie, and 66% of shortgrass prairie intact (Samson and Knopf 1996).
Human modification and degradation has direct impacts on endemic populations as
evidenced by the widespread and continuous population declines of grassland songbirds (Knopf
1996). Less intuitive are the cumulative effects caused by alterations to disturbance processes.
Historically, prairie ecosystems were continuously in a state of flux, shifting by processes that
include variable weather patterns and climatic conditions, and disturbance regimes (i.e. grazing,
fire). Of these processes, grazing played a critical role in maintaining prairie landscapes through
nutrient cycling (Coppock et al. 1983, McNaughton et al. 1997, Knapp et al. 1999), and the
diversification of vegetation structure and composition (Hartnett 1996, Knapp et al. 1999,
Fuhlendorf et al. 2006). In North America, historical estimates of large grazers are difficult to
quantify (Shaw 1995), however it is assumed they were of substantial quantity to have
significant effects on vegetation structure and composition. Of these grazers, bison (Bos bison)
were the most numerous and influential herbivore (Samson and Knopf 1994, Shaw 1995).

2
The first bison (i.e., steppe bison; Bos priscus) appeared in North America during the
middle Pleistocene (300,000 – 130,000 years ago) after crossing the Beringia land bridge from
Asia (Shapiro et al. 2004). This species reached a maximum distribution during the last glacial
period (Wisconsinan, 100,000-12,000 years B.P.) marking the southern expansion of bison into
the grasslands of central North America. Recurrent glacial events forced rapid biological,
taxonomic, and evolutionary differences in the steppe bison (van Zyell de Jong 1993) leading to
multiple speciation. The subsequent speciation resulted in modern bison (Bos bison), which
diverged around 5,000 years ago into the plains bison (B. b. bison) and the wood bison
subspecies (B. b. anthabascae; Gates et al. 2010).
Plains bison (bison) ranged across North America from the eastern seaboard into Florida;
westward to the Cascade and Rocky mountains, northward to mid-Alberta and Saskatchewan,
and southward into Mexico (Reynolds et al. 1982, Danz 1997) encompassing the largest
distribution of any indigenous large herbivore in North America (Gates et al. 2010). Throughout
the Great Plains, bison functioned as a keystone species (Knapp et al. 1999) or foundational
species (Soule et al. 2003) interacting with pronghorn (Antilocapra americana), elk (Cervus
elaphus), deer (Odocoileus spp.), prairie dogs (Cynomys spp.), wolves (Canis lupus), grizzly
bears (Ursus arctos) and grassland bird species through ecosystem alterations (Coppock et al.
19983, Krueger 1986, Knopf 1996, Freese et al. 2007). In addition, bison functioned as strong
interactors within grassland systems through facilitation of vegetative heterogeneity (Knapp et al.
1999, Fuhlendorf et al. 2008). Wallowing activities resulted in standing water following rain or
snowmelt (Knapp et al. 1999), in turn, supporting numerous plant species (Collins and Uno
1983, Polley and Wallace 1986), and providing habitat for amphibians (Bragg 1940, Corn and
Peterson 1996). Vegetation communities were affected through grazing, physical disturbance,
3
nutrient cycling, and seed dispersal (McHugh 1958, Knapp et al. 1999). These activities directed
grassland heterogeneity that supported many prairie obligate species in the tall, mixed, and short-
grass prairie (Powell 2006, Fuhlendorf et al. 2008 Gates et al. 2010).
Prior to the arrival of Europeans in North America, the estimates of bison numbers range
from 15 – 100 million animals (Dary 1989, Shaw 1995), however most estimates range from 30-
60 million bison (Seton 1929, McHugh 1972, Lott 2002), and most bison were located in the
Great Plains region. Bison numbers declined rapidly following European settlement primarily
due to subsistence and commercial hunting by Native Americans and European settlers for hides
and meat (Hornaday 1887, Isenberg 2000) and competition with domestic livestock and domestic
and wild horses (McHugh 1972, Dary 1989, Danz 1997, Isenberg 2000). As a result, <1,000
bison were in North American by 1890 (Hornaday 1887, Seton 1929) and wild, free-ranging
bison were extirpated from Canada (Freese et al. 2007) and nearly extirpated from the U.S.
(Meagher 1973).
The destruction of the bison herds led to the first major conservation movement in the
U.S. to preserve a species on the brink of extinction (Coder 1975). These efforts were led
predominantly by private individuals (e.g., Charles Goodnight, Walking Coyote, Michel Pablo,
Charles Allard, and others) who established small herds throughout the Great Plains (Boyd
2003). Private herds would later form the foundation for most of the public and private plains
contemporary herds (Boyd 2003). The second conservation effort was led by the American
Bison Society (formed 1905) who influenced the U.S. Congress to establish public conservation
herds at Wichita Mountains National Wildlife Refuge, Oklahoma, USA, the National Bison
Range, Montana, USA, and Fort Niobrara National Wildlife Refuge, Nebraska, USA, (Coder

4
1975, Danz 1997). Federal conservation began in Canada with the 1907 purchase of plains
bison for the Canadian Parks systems (Freese et al. 2007).
These conservation efforts resulted in a rapid increase in the bison population, doubling
between 1888 and 1902 (Coder 1975). Bison were safe from extinction in 1909 (Coder 1975)
and a conservation focus shifted to commercial production. Bison increased steadily through the
1970s to ~30,000 animals in North America (McHugh 1972), half of which resided in
conservation herds (Freese et al. 2007). In the 1980s, commercial bison production further
increased, resulting in >500,000 bison throughout North America (Boyd 2003) however, only
20,504 animals were located in 62 conservation herds (Gates et al. 2010). The International
Union for Conservation of Nature (IUCN) Bison Specialist Group classified conservation herds
according to numerical status, geographic status, population size, breeding competition, predator
presence, diseases presence, and cattle gene introgression (Gates et al. 2010).
The ecological significance of losing bison has been questioned as conservation herds
remain stagnant (Boyd 2003, Freese et al. 2007, Sanderson et al. 2008, Gates et al. 2010).
Through a concerted effort, conservation organizations (e.g., The Nature Conservancy, World
Wildlife Fund [WWF], Wildlife Conservation Society) and state and federal agencies (Utah
Division of Wildlife, Montana Fish Wildlife & Parks, U.S. Fish and Wildlife Service, Parks
Canada) are focusing their efforts toward preserving intact prairie habitat within the Great Plains.
Bison, viewed as an important component of the historical grazing process, are thus being
reestablished as wild, free-ranging bison herds throughout their historical habitat (Freese et al.
2007).
The objectives of these conservation efforts and similar initiatives occurring across North
America are to restore bison to their historical range, thus conserving bison and returning an

5
important ecological process to the landscape in an effort to maintain and restore the prairie
landscape. Similar to these overall conservation objectives, I had 2 objectives. My first
objective was to provide knowledge that leads toward landscape scale-prairie conservation. As
exemplified by the current population data of bison and cattle, bison are no longer North
America’s dominant grazer, thus it is important to understand the similarities and differences
between the species to understand whether cattle can serve as a proxy for evolutionary grazing
patterns. My second objective was to determine how existing bison and cattle populations could
use the landscape in similar ecological patterns to historical bison populations.

6
THESIS FORMAT
Chapter 1 is an overview of the entire thesis. Chapter 2 was written and formatted as an
individual manuscript that will be submitted for publication in The Journal of Rangeland
Ecology and Management. Because this is a collaboration among researchers, co-authors are
included in the publications and I use we throughout the remainder of the thesis.
7
LITERATURE CITED
Anderson, R. C. 2006. Evolution and origin of the central grassland of North America: climate,
fire, and mammalian grazers. Journal of the Torrey Botanical Society 133:626-647.
Boyd, D. P. 2003. Conservation of North American bison: status and recommendations [thesis].
Calgary, Canada: University of Calgary. 235 p.
Bragg, A. N. 1940. Observations on the ecology and natural history of Anura: I habits, habitat,
and breeding of Bufo congantus say. American Naturalist 74: 424-438.
Coder, G. D. 1975. The national movement to preserve the American buffalo in the United States
and Canada between 1880 and 1920 [dissertation]. Columbus, OH, USA: Ohio State
University. 348. P.
Collins, S. L., and G. E. Uno. 1983. The effect of early spring burning on vegetation in buffalo
wallos. Bulletin of the Torrey Botanical Club 110: 474-481.
Coppock, D. L., J. E. Ellis, J. K. Detling, M. I. Dyer. 1983. Plant-herbivore interactions in a
North American mixed-grass prairie. II. Responses of bison to modification of vegetation
by prairie dogs. Oecologia 56:10-15.
Corn, S. P., and C. R. Peterson. 1996. Prairie legacies – amphibians and reptiles. In: F. B.
Samson and F. L. Knopf [EDS.]. Prairie Conservation. Washington D.C. USA Island
Press. p. 125-134
Danz, H. P. 1997. Of bison and man: from the annals of a bison yesterday to a refreshing
outcome from human involvement with American’s most valiant of beats. Niwot, CO,
USA: University Press of Colorado. 231 p.
Dary, D. A. 1989. The buffalo book: the full saga of the American Animal. Chicago, IL, USA:
Swallow Press. 384 p.

8
Freese, C. H., K. E. Aune, D. P. Boyd, J. N. Derr, S. C. Forrest, C. C. Gates, P. J. P. Gogan, S.
M. Grassel, N. D. Halbert, K. Kunkel, and K. H. Redford. 2007. Second chance for the
plains bison. Biological Conservation 136:175-184.
Fuhlendorf, S. D., D. M. Engle, J. Kerby, and R. Hamilton. 2008. Pyric herbivory: rewilding
landscapes through the recoupling of fire and grazing. Conservation Biology 23:588 –
598.
Fuhlendorf, S. D., W. C. Harrell, D. M. Engle, R. G. Hamilton, C. A. Davis, and D. M. Leslie Jr.
2006. Should heterogeneity be the basis for conservation? Grassland bird response to fire
and grazing. Ecological Applications 16:1706-1716.
Gates, C. C., C. H. Freese, P. J. P. Gogan, and M. Kotzman. 2010. American bison: status survey
and conservation guidelines 2010. Gland, Switzerland: IUCN 978-2-8317-1149-2. 154 p.
Hartnett, D. C., K. R. Hickman, L. E. Fischer Walter. 1996. Effects of bison grazing, fire, and
topography on floristic diversity in tallgrass prairie. Journal of Range Management
49:413-420.
Hoekstra, J. M., T. M. Boucher, T. H. Ricketts, and C. Roberts. 2005. Confronting a biome
crisis: global disparities of habitat loss and protection. Ecology Letters 8:23-29.
Hornaday, W. T. 1887. The extermination of the American bison with a sketch of its discovery
and life history. Washington, D.C. USA: Report of the U.S. National Museum, 1887,
Part 2. 181 p.
Isenberg, A. C. 2000. The destruction of the bison: an environmental history 1750-1920.
Cambridge, UK: Cambridge University Press. 218 p.

9
Knapp, A. K., J. M. Blair, J. M. Briggs, S. L. Collins, D. C. Hartnett, L. C. Johnson, and E. G.
Towne. 1999. The keystone role of bison in North American tallgrass prairie. BioScience
49: 39-50.
Knopf, F. L. 1996. Prairie legacies – birds. In: F. B. Samson and F. L. Knopf [EDS.]. Prairie
conservation: preserving North America’s most endangered ecosystem. Washington,
D.C., USA: Island Press. p. 135-148.
Krueger, K. 1986. Feeding relationships among bison, pronghorn, and prairie dogs: an
experimental analysis. Ecological Society of America 67:760-770.
Lott, D. F. 2002. American bison: a natural history. Los Angeles, CA, USA: University of
California Press. 229 p.
McHugh, T. 1958. Social behavior of the American buffalo (Bison bison bison). Zoologica 43:1-
40.
McHugh, T. 1972. The time of the buffalo. Lincoln, NE, USA: University of Nebraska Press.
339 p.
McNaughton, S. J., F. F. Banyikwa, and M. M. McNaughton. 1997. Promotion of the cycling of
diet-enhancing nutrients by African grazers. Science 278:1798-1800.
Meagher, M. M. 1973. The bison of Yellowstone National Park. Mammoth, WY, USA: National
Park Service Scientific Monograph Series 1. 161 p.
Polley, H. W. and L. L. Wallace. 1986. The relationship of plant species heterogeneity to soil
variation in buffalo wallows. American Midland Naturalist 112: 178-186.
Powell, F. L. A. 2006. Effects of preseribed burns and bison (Bos bison) grazing on breeding
bird abundances in tallgrass prairie. The Auk 123: 183-197.

10
Reynolds, H. W., R. D. Glaholt, and A. W. L. Hawley. 1982. Bison. In: J.A. Chapman and G.A.
Feldhamer [EDS.]. Wild mammals of North America: biology, management, and
economics, pp.972-1007. Baltimore, MD, USA: The Johns Hopkins University Press. p.
972-1007.
Samson, F. B. and F. L. Knopf. 1994. Prairie conservation in North America. BioScience 44:418-
421.
Samson, F. B. and F. L. Knopf. 1996. Prairie conservation: preserving North America’s most
endangered ecosystem. Washington D.C. USA: Island Press. 339 p.
Sanderson, E. W., K. H. Redford, B. Weber, K. Aune, D. Baldes, J. Berger, D. Carter, C. Curtin,
J. Curtin, J. Derr, S. Dobrott, E. Fearn, C. Fleener, S. Forrest, C. Gerlach, C. C. Gates, J.
E. Gross, P. Gogan, S. Grassel, J. A. Hilty, M. Jensen, K. Kunkel. D. Lammers, R. List,
K. Minkowski, T. Olson, C. Pague, P. B. Robertson, and B. Stephenson. 2008. The
ecological future of the North American bison: conceiving long-term, large-scale
conservation of wildlife. Conservation Biology 22:252-266.
Seton, E. T. 1929. Lives of game animals, 4 volumes. Garden City, NY, USA: Doubleday, Doran
& Co. 2640 p.
Shapiro, B., A. J. Drummond, A. Rambaut, M. C. Wilson, P. E. Matheus, A. V. Sher, O. G.
Pybus, M. T. P. Gilbert, I. Barnes, J. Binladen, E. Willerslev, A. J. Hansen, G. F.
Baryshnikov, J. A. Burns, S. Davydov, J. C. Driver, D. G. Forese, C. R. Harington, G.
Keddie, P. Kosintsev, M. L. Kunz, L. D. Martin, R. O. Stephenson, J. Storer, R. Tedford,
S. Zimov, and A. Cooper. 2004. Rise and fall of the Beringian Steppe bison. Science
306:1561-1565.

11
Shaw, J. H. 1995. How many bison originally populated western rangelands? Rangelands
17:148-150.
Soule, M. E., J. A. Estes, J. Berger, and C. Martinez Del Rio. 2003. Ecological effectiveness:
conservation goals for interactive species. Conservation Biology 17:1238-1250.
van Zyll de Jong, C.G. 1993. Origin and geographic variation of recent North American bison.
Alberta: Studies in the Arts and Sciences 3:21-35.

12
CHAPTER 2
Bison Versus Cattle: Are They Ecologically Synonymous?
Michel T. Kohl1, Paul R. Krausman
1, Kyran Kunkel
2, David M. Williams
3.
Authors are 1 Boone and Crockett Program in Wildlife Conservation, Wildlife Biology Program,
University of Montana, Missoula, MT 59812, USA; and 2 Wildlife Biology Program, University
of Montana, Missoula, MT 59812, USA; and 3 Boone and Crockett Quantitative Wildlife
Laboratory, Department of Fisheries and Wildlife, Michigan State University, East Lansing, MI
48824, USA.
Research was funded by the Alfred P. Sloan Foundation, American Prairie Reserve, Boone and
Crockett Wildlife Conservation Program at the University of Montana, M.J. Murdock Charitable
Trust, Montana Institute on Ecosystems by the National Science Foundation EPSCoR program
grant EPS-1101342, The University of Montana, Wildlife Conservation Society Research
Fellowship Program, and the World Wildlife Fund-Northern Great Plains Program.
Any opinions, findings and conclusions or recommendations expressed in this material are those
of the author(s) and do not necessarily reflect the views of the Montana Institute on Ecosystems
or the National Science Foundation.
At the time of research, Kohl was a Boone and Crockett Fellow, Boone and Crockett Wildlife
Conservation Program, Wildlife Biology Program, University of Montana, Missoula, MT 59812,
USA.
Correspondence: Michel Kohl, Boone and Crockeet Program in Wildlife Conservation, Wildlife
Biology Program, University of Montana, Missoula, MT 59812, USA. Email:

13
ABSTRACT
Historically, the plains bison (Bos bison) was the most numerous and influential grazer.
Today, only 500,000 bison occupy North America amongst > 100,000,000 cattle leading to
questions of the ecological significance of livestock replacing bison at a landscape scale. To
restore historical grazing processes, bison are translocated onto landscapes manipulated for cattle
use through water development. We hypothesized that bison would use these landscapes
similarly to cattle, resulting in less heterogeneous grazing (primary objective of bison
restoration). We quantified differences between bison populations at different locations and
spatial scales and compared bison and cattle on similar locations and spatial. We used
behavioral observations, movement analyses, and Resource Selection Functions (RSFs) to
identify differences in ecologically significant activities of cattle and bison. Cattle spent a
higher proportion of time grazing (45-49%) than bison (26-28%) and a greater amount of time at
water. Bison moved at a greater rate than cattle. First Passage Time (FPT) movement analyses
identified selection of a bison foraging patch (11,690 ha) 4.4 x larger than cattle (2665 ha).
Similarly to cattle, bison selected water and riparian shrub communities; however species
differed in selection of elevation and Normalized Difference Vegetation Index. This study has
implications when bison and cattle are used to meet range restoration objectives, particularly if
increased vegetation heterogeneity is a goal. For bison, large landscapes that include variation in
topography and vegetation communities are required. Furthermore, limiting artificial water may
facilitate bison grazing patterns that approximate historical bison use. For livestock, alterations
to grazing practices such as changes in timing and intensity of grazing (i.e. duration, stocking
level), and use of adjustable mineral and water resources may increase vegetation heterogeneity
across spatial scales.

14
KEY WORDS
Behavior, first-passage time, grazing, resource selection functions, water
INTRODUCTION
The near extinction and subsequent recovery of plains bison (Bos bison) throughout
North America was the first and greatest conservation success in North America. Today ~
500,000 bison occupy North America because of the cooperation of private individuals, non-
profit organizations, and the federal governments of the U.S., Canada, and Mexico. Despite the
numerical recovery of the species, recent questions have surfaced regarding the success of these
efforts because < 21,000 plains bison are managed as conservation herds (n = 62). Thirteen
percent (n = 8) of conservation herds are outside of their historical range, 92% (n = 57) have <
1,000 individuals, and only 8% (n = 5) are managed on areas of > 2,000 km2 (Boyd 2003, Gates
et al. 2010). Thus, many conservation groups and state and federal agencies question the
ecological significance of replacing bison with domestic cattle at a landscape scale.
Historically, bison were the dominant grazer throughout the Great Plains, affecting
vegetation communities through grazing, physical disturbance, nutrient cycling, and seed
dispersal (McHugh 1958, Knapp et al. 1999). These activities directed grassland heterogeneity
that supported many prairie obligate species (e.g., grassland songbirds) in the tall, mixed, and
short grass prairie (Powell 2006, Fuhlendorf et al. 2006, Gates et al. 2010). Following the
reduction of the bison herds, they were replaced by domestic cattle and a significant shift
occurred, resulting in overgrazing and then rotational grazing regimes that favor landscape-scale
vegetation homogeneity (Holecheck 2006).
Cattle, which share a common ancestor with bison in B. priscus, are the result of wild
aurochs (B. primigenius) domestication ~10,000 years ago in the Near East (Edwards et al.

15
2007). European cattle were introduced to Mexico by Hernando Cortez in 1515, and eventually
the U.S. in 1540 (Holecheck et al. 2006). Cattle slowly expanded throughout the U.S. until the
1870s when the reduction in bison provided valuable rangeland for cattle in the northern and
central Great Plains (Holecheck et al. 2006). Cattle numbers continued to rise throughout the
1900s expanding to 95% of the Great Plains grassland (Gates et al. 2010). Today, livestock
numbers on rangelands in the U.S. and Canada are two times higher than historical bison
estimates (Fig. 1), yet there is limited peer-reviewed data that compares the ecological
similarities and differences between introduced livestock and bison, particularly when managed
as wild populations on large, complex landscapes (Fuhlendorf et al. 2010).
Bison co-evolved with the grassland biome of North America whereas European cattle
were domesticated on woodland-grassland-farmland landscapes for the past 10,000 years (Bailey
et al. 1996) resulting in fundamental ecological differences. Bison groups generally consist of
small bachelor groups and mixed groups consisting of females, calves, yearlings, and young
males (McHugh 1958). These groups vary in size throughout the year (Lott and Minta 1983)
ranging from a few individuals to >100 (Lott and Minta 1983, van Vuren 1983, Rutberg 1984)
and are influenced by behavior (i.e., breeding season [Krueger 1986, Shaw and Meagher 2000])
and open habitats (van Vuren 1979). Cattle groups are dependent on specific range management
techniques employed by operators.
Bison use higher elevation and steeper slopes than cattle when occupying the same range
(van Vuren 1983). Additionally, burns (Coppedge and Shaw 1998, Knapp et al. 1999, Schuler et
al. 2006), and prairie dog colonies (Cynomys spp.; Coppock et al. 1983, Krueger 1986, Wydeven
and Dahlgren 1985), are selected. Bison generally use upland areas (Peden et al. 1974, van
Vuren 1979, Philips 2000), whereas cattle use lowlands and riparian areas (Peden et al. 1974,

16
Gillen et al. 1984, Smith et al. 1992). Within use areas, forage is a predictor (Phillips 2000),
with bison primarily using areas consisting of warm-season gramminoids (Peden et al. 1974,
Wydeven and Dahlgren 1985, Steuter et al. 1995). In the short-grass prairie, approximately 90%
of bison diet consists of gramminoids (van Vuren 1979) and > 95% in the mixed-grass prairie
(Wydeven and Dahlgren 1985, Krueger 1986). Cattle use cool-season grasses and forbs more
than bison (Peden et al. 1974, Plumb and Dodd 1993). Cattle also spend more time grazing
(Plumb and Dodd 1993) and near water and riparian areas than bison (Fuhlendorf et al. 2010).
Specifically, cattle may spend half their time within 200 m of water (van Vuren 1979, Gillen et
al. 1984, Porath et al. 2002), however, only Allred et al. (2011) have explicitly tested for water
and riparian use differences between cattle and bison in a large landscape. They reported that
cattle selected riparian areas and areas closer to water, whereas bison avoided them.
Water is a fundamental requirement of life and has often been listed as a limiting factor
for wildlife and livestock in the western U.S. (Valentine 1947, Krausman 2002, Cain III et al.
2008). Since the 1940s, wildlife managers provided water for large ungulates including mule
deer (Odocoileus hemionus [Elder 1954, Krausman and Etchberger 1995]), bighorn sheep (Ovis
canadensis [Blong and Pollard 1968, Cain III et al. 2008]), and pronghorn (Antilocapra
americana [Deblinger and Alldredge 1991]). Although controversial, (Krausman et al. 2006,
Cain III et al. 2008) water availability may expand animal distribution, increase productivity,
reduce mortality, and increase fitness (Rosenstock et al. 1999). Despite questionable benefits to
wildlife (Rosenstock et al. 1999), water developments in the western U.S. are a necessity for
livestock and have a direct bearing on livestock grazing capacity. Areas located <1.6 km from
water are classified as high value, water distances between 1.6 km and 3.2 km are considered
medium value, and areas >3.2 km are considered ungrazeable for cattle (Holecheck et al. 2006).

17
More importantly, heavy use of areas near water by cattle (van Vuren 1979, Gillen et al. 1984,
Porath et al. 2002) may result in alterations to species composition, ecosystem structure, and
disruptions of ecosystem functioning in riparian areas (Fleischner 1994). These effects are
exacerbated during times of water scarcity such as drought, and hot, dry periods (James et al.
1999). In comparison to historical grazers such as bison, increased cattle use of areas near water
sources can result in a more severe and larger animal impact zone (Steuter and Hidinger 1999).
Regardless of the ecological implications, water sources have been developed for livestock
across the western U.S. (Valentine 1947, Williams 1954) to increase forage use and grazing
uniformity (Bailey 2004, 2005).
Despite the strong association between cattle and water, the importance of water to bison
habitat selection has received little attention, but when addressed, the results vary across studies.
For example, bison in Yellowstone National Park remain closer to water during drought, and will
make daily round trips of up to 9.5 km to water (McHugh 1958). In concordance, bison at Prince
Albert National Park, Saskatchewan, Canada, more strongly used meadows surrounded by water
during summer (Fortin et al. 2003). However, these areas contained areas where snow or open
water is readily available (Meagher 1973), thus, are not representative of historical water scarcity
found in the Great Plains. Bison may have traveled several days without water (Hornaday
1887a) at distances up to 80 – 160 km in search of water (Dary 1989), which may explain the
lack of relationship between water and bison in landscapes with limited water (van Vuren 1979,
Phillips 2000, Babin 2009).
Data are available regarding the spatial and ecological use of bison and cattle, however
direct comparisons between bison and cattle are difficult because of different management
practices (i.e., pasture size, stocking densities, management priorities) and confounding

18
environmental factors (Plumb and Dodd 1993, Towne et al. 2005, Fuhlendorf et al. 2010).
Fuhlendorf et al. (2010) reported nine studies that compared bison and cattle with an ecological
focus, only two of which attempted to control for confounding effects (Plumb and Dodd 1993;
Towne et al. 2005). Recent work on the Tallgrass Prairie Reserve was the third study to control
for confounding effects and the first to occur on pasture sizes > 300 ha (Allred et al. 2011).
Thus, our objectives were to compare the behavior, movement, and resource use of bison
and cattle on large landscapes (>1,000 ha) within the Northern Great Plains. This area is the
focus of a number of new and potential bison translocation efforts. These efforts have a high
likelihood of occurring on landscapes manipulated for cattle through the use of water
developments and fence construction. Because these translocation efforts are implemented
alongside domestic livestock operations, we were provided opportunities for side-by-side
comparisons of bison and cattle. Furthermore, with multiple bison populations within the region,
we were able to compare landscapes used by bison across vegetation communities and spatial
scales. We hypothesized that bison would use these landscapes similar to cattle, replacing
historical bison use of the landscape resulting in less heterogeneous grazing. As such, we
predicted bison and cattle on similar landscapes would demonstrate comparable ecological
behaviors including resource use, movement, and grazing behaviors. We also predicted bison
would differ in their ecological behaviors when under different management structures including
pasture size and water density.
METHODS
Study Area
We conducted our bison-cattle comparison study on two study areas within the
northwestern glaciated plain ecoregion (Forrest et al. 2004) of north-central Montana and

19
southwestern Saskatchewan, Canada, in 2010 and 2011 (Fig. 2). In north-central Montana, we
compared bison and cattle simultaneously on properties owned and leased from the Bureau of
Land Management (BLM) by private ranchers and the American Prairie Reserve (APR). The
APR is located 74 km south of Malta, Montana (Philips County) on Regina Road. The area
borders C.M. Russell and U.L. Bend National Wildlife Refuges. To compare bison across
spatial scales, vegetation communities, and water availability, a second bison site was selected
150 km north in Grasslands National Park (GNP).
Dominant plant species on APR are representative of a sagebrush steppe system that
include blue grama (Bouteloua gracilis), needlegrass (Stipa spp.), crested wheatgrass (Agropyron
cristatum), silver sagebrush (Artemsia cana), and Wyoming big sagebrush (Artemisia tripartita).
Sedges (Carex spp.), cacti, and forb species are also common in the area. Dominant plant
species in GNP are representative of the mixed-grass prairie ecosystems and include blue grama
(Bouteloua gracilis), needlegrass (Stipa spp.), western wheatgrass (Pascopyrum smithii), and
silver sagebrush (Artemsia cana).
Large ungulates on APR and GNP include mule deer, white-tail deer (Odocoileus
virginianus), and pronghorn. Elk (Cervus elaphus) are also on APR. Black-tailed prairie dogs
(Cynomys ludovicianus) and coyotes (Canis latrans) are common in both areas. Greater sage
grouse (Centrocecus urophasinus), Baird’s sparrows (Ammodramus bairdii), and mountain
plover (Charadrius montanus) are grassland bird species of conservation concern found
throughout the area.
The APR lies in a semi-arid region consisting of upland flats intersected by coulees and
ephemeral streams flowing toward the Missouri River. Yearly precipitation ranges from 25.4 –
27.9 cm; however 2010 and 2011 were 150-200% above normal (45.6 cm, 57.1 cm respectively).
20
Mean annual temperature is 6.5°C and ranges from -8.4°C in January to 20.8°C in July.
Elevation lies between 700 and 825 m. Soil primarily contains heavy clay loams with moderate
amounts of salt resulting in high imperability by water. Thus, most water developments remain
full throughout the year. Reynolds Hill Road passes through the eastern section of the pasture
and receives low to moderate levels (~30 vehicles/day) of use throughout the summer with
heavier use (~ 250 vehicles / day) during hunting season (1 September – 25 November).
Grasslands National Park also lies in a semi-arid region and consists of similar
topographic features as APR. The Frenchman River runs through the southern section of the
park with consistent, regulated flow throughout the year. Annual precipitation ranges from 30-
33 cm, however 2010 and 2011 were 140-200% above normal (46.5 cm, 53.1 cm respectively).
Mean annual temperature is 3.4°C and ranges from -13.4°C in January to 18.8°C in July.
Elevation lies between 750 and 900 m. The main ecotour road passes through the center of the
park (~ 6,000 visitors / year) from north to south and receives low to moderate levels of use
throughout the summer, however recreational use is rare in the core summer range.
Bison on APR were contained within a 3,555 ha electrified pasture from 1 May through
31 October of each year (Fig. 3). The pasture is leased from the BLM and contains 15 artificial
reservoirs. An ephemeral stream maintained small remnant pools during the study. Bison on
GNP were in an 18,153 ha pasture containing 26 reservoirs (Fig. 4). Importantly, bison typically
used only the north-east portion of the park (4,200 ha; average 95% kernel monthly home range
estimate). This area contained five reservoirs (three of which were permanent throughout
summer), one large depression, and three ephemeral channels which contained remnant pools
during the study. In addition to reservoirs, the Frenchman River provides water throughout the
year, except when frozen.
21
Two cattle herds adjoined the APR bison herds. The Weiderrick Ranch grazed 100
cow/calf pairs (red and black Angus) from 1 July – 15 October on 2 rotational pastures (1,090
and 1,408 ha) administered by BLM which contained 5 – 7 reservoirs / pasture (Fig. 3). The
Barnard Ranch grazed ~140 cow/calf pairs (red Hereford and red Angus) on two rotational
pastures (777 and 1,000 ha) that contained 6 – 8 reservoirs / pasture and were partially
administered by BLM and owned by the Barnard Ranch. One pasture was bisected by Reynolds
Hill Road. Topography of all cattle pastures was similar to APR and all cattle pastures contained
ephemeral streams similar to APR. Stocking density was similar across bison and one cattle
pasture (Table 1).
GPS Data Collection
We deployed Global Positioning System (GPS) radiocollars (Lotek 3300, Lotek 4400,
Lotek Wireless Fish and Wildlife Monitoring, Newmarket, Ontario, Canada and NSG-LD2,
North Star Science and Technology, LLC, Kind George, Virginia, USA) on adult female bison
and cattle. Bison were immobilized (carfentanil [4-8 µg/kg, IM] and xylazine [0.05-0.1 mg/kg,
IM], A3080, or butrphanol, atipamezole medetomidine [BAM], and reversed with naltrexone and
tolazine [for carfentanil and xylazine], K. Kunkel, American Prairie Reserve, personnel
communication) by air powered darts (Pneu-Dart Inc, Williamsport, PA, USA) fired from the
ground. Cattle were physically restrained in a cattle squeeze-shoot. Collars were scheduled to
obtain locations every 1, 2, or 3 hours from 1 June – 31 August (or until collar failure) in 2010
and 2011 (Table 2). The GPS locations were censored from analysis when bison moved outside
of study pastures. This research was approved by The University of Montana Animal Care and
Use Board (Animal Use Protocol# 014-10PKWB) and Parks Canada (Permit #: GRA-2010-
5415).

22
Landscape Variables
Abiotic variables (i.e., aspect, slope, and elevation) were developed from the 30 m2
Montana Digital Elevation Model. Biotic variables included vegetation community and 250 m2
Normalized Difference Vegetation Index data (NDVI [Moderate Resolution Imagine
Spectroradiometer {Huete et al. 2002}]). Vegetation classifications on GNP were based on field
work completed by ground sampling (R. Sissons, GNP, unpublished data). Landcover type was
classified on APR using remotely sensed data and was designed to allow for comparison between
vegetation communities on GNP. We delineated 10 vegetation communities (e.g., eroded,
upland grassland, disturbed, sloped grassland, shrub/riparian, valley grassland, treed,
unclassified, sage-brush, water bodies). We use a dynamic measure of vegetation productivity
by estimating primary productivity from mid-month NDVI estimates (Tucker and Sellers 1986).
We analyzed anthropogenic variables using Euclidiean distance estimates (km) for fence, water,
and roads. We located permanent water sources using Bureau of Land Management (Malta Field
Office, Malta, MT, USA) and Parks Canada (GNP Headquarters, Val Marie, Canada)
topographic maps. We inspected water developments monthly to confirm water availability
throughout summer. Additional water sources (i.e., hardpans, rainfall, coulees) are generally
semi-permanent (< 1 week), thus we assumed they were homogenous throughout the landscape
and did not influence overall movement patterns of bison and cattle relative to permanent water
sources.
Behavior
To understand how bison and cattle differ in behaviors, we conducted behavioral
observations. Observations occurred near semi-permanent to permanent water sources because
water is an anthropogenic alteration that is largely homogenous throughout the western U.S.,

23
whereas cross fencing is determined by grazing practices and goals. Observations occurred for
one week/month/study group from 1 June – 1 October. Observations (<4 hours) occurred during
daylight hours twice per day and were focused on periods of high movement periods identified
from previous observations. Behavior of mixed groups (female, calf, subadult males) was
determined using instantaneous scan sampling (15 min. intervals; Altmann 1974) from distances
>100 m (Komers et al. 1992). A sampling unit consisted of a group of > 2 animals separated
from other groups by > 100 m (Fortin et al. 2003). Observation periods began when a watering
event (i.e., the start of an adult animal drinking water) was not occurring, at which point we
recorded behavior (e.g., moving, feeding, nursing, bedded, wallowing, social activities). When a
watering event occurred, the observation period ceased and weather data (i.e., temperature, cloud
cover, wind speed) and time spent at water (TSW [i.e., time from initial drinking activity to time
when animal was > 1 body length from water source]) was recorded in seconds.
We calculated proportional differences in ecological significant behaviors (i.e. moving,
grazing). We used ANOVA to compare differences in TSW between species and study
locations. Lastly, a multiple analysis of variance (MANOVA) was used to calculate the
influence of temperature on TSW. Statistical analyses were conducted using the Rcmdr package
in R (Fox 2005).
Movement
We predicted that bison movement rates (MR) to be larger than cattle on similar
landscapes because of their expected requirement for landscapes at orders of magnitudes larger
than domestic cattle. We also predicted bison on APR would have smaller movement rates than
bison on GNP due to restricted landscape availability, thus inability to move across the landscape
in search of additional resource patches. Movement rates, calculated as distance (d) in meters
24
divided by time (t) in seconds, has a non-normal distribution, thus we used a negative binomial
regression to test this hypothesis. Negative binomial regression, a type of generalized linear
model (GLM), uses the log link function to, in this case, calculate MR differences between
species and study groups. Coefficients are interpreted according to a one unit change in the
predictor variable. Thus, the difference in the log of the response variables expected counts is
expected to change by the respective regression coefficient, given other predictor variables are
held constant. Analyses were performed in R and negative binomial regression was performed
using the MASS package (Venables and Ripley 2002).
To calculate the effect of landscape on movement rates, we used First Passage Time
(FPT) analyses that measure the search effort along a pathway (Fauchald and Tveraa 2003) to
identify the spatiotemporal scale of a biologically relevant move (Turchin 1998, Morales et al.
2005). Specifically, FPT incorporates step-length, turning angles and tortuosity (Fauchald and
Tveraa 2003) to estimate the spatial scale at which the consumer perceives a resource. Variance
in FPT, calculated by the time it takes an animal to travel across a circle of a specified radius
(Fauchald and Tverra 2003), allows ecologists to identify area-restricted search (ARS) behavior
from movement behavior between patches. Unlike many ungulates (including cattle) in which
ARS behavior is assumed to include bedding and feeding sites (Fryxell et al. 2008), we assumed
bison ARS behavior consist of bedding sites and calving areas and movement behaviors
consisted of foraging bouts.
First-passage time analyses were conducted in the adehabitatLT package of R (Calenge
2006). Circles of radii between 50 – 15,000 m, increasing at 25 m increments, were applied to
each GPS location along an individual movement path for bison and 50-10,000 m, increasing at
25 m increments, for cattle. Location data (GPS) was used from the focal sampling period (June
25
– August 2010, 2011) except for 2011 for APR bison (Table 2). The omission of 2011 for APR
bison was due to temporary bison movements outside of the designated study pasture which
necessitated data censoring, thus resulting an inadequate sample size for FPT analysis. Where a
circle intersected the path between GPS locations, the FPT (�����) was calculated by estimating
the absolute value of forward movement (�����) plus the backward movement (����) in
seconds. First Passage times were not calculated in instances of missed locations which created
breaks along the path (Williams et al. 2012). Furthermore, variation in FPT increases with
increasing circles radii, thus variance in FPT was divided by the area of the circle (Frair et al.
2005, Williams et al. 2012). Combined, peaks in the variance of FPT per unit area (varFPT/area)
identified the spatial scale of resources across 2010 and 2011 summers for each individual.
Resource Selection
We used a resource selection function (RSF) framework to compare resource use of bison
and cattle during summer (1 June – 31 August; Manly et al. 2002). Our specified covariates
were vegetation community, water availability, and additional abiotic, biotic, and anthropogenic
covariates. However, RSFs assume independence among observations (Hosmer and Lemeshow
2000) leading to increased Type I error rates (Gillies et al. 2006). This issue is of importance
when identifying resource use in grouping species such as bison and cattle and when comparing
resource selection across locations that differ in available resources. Random effects can
accommodate temporal and spatial autocorrelation among individuals and groups (Breslow and
Clayton 1993) and correct for unbalanced number of locations among individuals (Bennington
and Thyane 1994, Gillies et al. 2006). As a result, the inclusion of a random effect for
individuals allowed for identification of individual variability in resource selection and resulted
in a population estimate of resource selection (Neter et al. 1996).

26
We used generalized linear mixed-models (GLMM) with a random-intercept for each
animal to allow for interpretation of selection among different populations and species
(Hebblewhite and Merrill 2008, Bolker et al. 2009). Furthermore, we treated each animal month
as an individual (i.e. Animal1_June2010, Animal2_June2010, Animal1_July2010, etc.) to
provide a population estimate across the summer months while taking into account changing
availability in our dynamic measure of vegetation productivity, NDVI. The form of the mixed-
effects model for individual animal () with a random intercept (Skrondal and Rabe-Hesketh
2004) is given as:
���� = ��� +��� +���� +�����+. . . +����� +��
where ����� is proportional to the predicted probability of use as a function of covariates with
fixed regression coefficients ��…�, and ��…� are the selection coefficients estimated from fixed-
effects logistic regression (Manly et al. 2002). Because the fixed and random intercepts
��� +��� are meaningless in a use-available design, they are often dropped, resulting in a
predicted relative probability. Although��� is dropped when estimating the RSF, the addition of
a random intercept can improve model fit and change coefficients dramatically because of the
correlation within groups (Skrondal and Rabe-Hesketh 2004).
Due to the 10-fold increase in pasture size from APR to GNP, we estimated RSFs at the
third order scale (Johnson 1980) on APR and in GNP. On APR, we randomly sampled monthly
availability (n = 1,000) across individual months within a given pasture for bison and cattle. In
GNP, we randomly sampled monthly availability (n = 1,000) within a 95% fixed kernel monthly
home range (third order) using Geospatial Modeling Environment 6.0 (Beyer 2012). In GNP, we
also estimated RSFs at a constrained second order scale to understand whether resource selection
differed across spatial scales in GNP. We define this as constrained second order resource

27
selection because the area is used throughout the year, however we cannot explicitly state
whether this area would encompass the bison’s annual population range if no peripheral fence
existed. We estimated the constrained second order selection by randomly sampling monthly
availability (n = 2,000) across the entire park. A GLMM was estimated using the lme4 package
(Bates et al. 2011) for R 2.14.2 (R Development Core Team 2008) and included our covariates
(described above) that influenced bison and cattle resource selection in previous studies. For
categorical covariates, we selected shrub communities as the reference category for vegetation
due to previous relationships between shrub and riparian communities and bison and cattle
reported in the literature. East facing slopes were selected as a reference category in relation to
other cardinal direction because of perceived heat exposure. We assumed that north facing
slopes were cooler, and west and south facing slopes were warmer than east facing slopes, thus
influence the selection of aspect. All variables were screened for collinearity by calculating the
Pearson’s correlation between variables and using |r| > 0.6 as the threshold for removing a
covariate (Hosmer and Lemeshow 2000). Because analysis coefficients are relative to all other
model variables, no model selection technique was used, thus allowing a direct comparison of
covariates across location and species.
RESULTS
Behavior
We collected 87 behavioral observations spanning 155.3 hours across all study areas
from 22 May – 23 August 2010 and 2011. Observations resulted in 544 watering events across
2010 and 2011. We were unable to collect observation data and watering events for 1.5 months
on the Barnard Ranch in 2010 due to grazing rotation. Access was limited to Weiderrick
Pastures in 2010 and 2011 due to weather conditions. Cattle spent proportionately more time

28
grazing than bison (Table 3). Bison demonstrated similar behavior in APR and GNP for grazing
(26.2, 27.5% respectively) and movement (11.1, 7.6% respectively). Cattle on the Barnard and
Weiderrick Ranches were similar to one another but differed from bison in grazing (49.1, 45.0%
respectively) and movement (1.7, 5.0% respectively). Analysis of TSW followed our prediction
that cattle and bison differed in TSW (F1 = 75.07, P < 0.01). Cattle populations did no differ in
TWS (F1 = 2.29, P < 0.13), however bison populations were statistically different in their TSW
(F1 = 19.68, P < 0.01). Furthermore, temperature (F5 = 9.12, P < 0.01), location (F2 = 31.58, P <
0.01), and the interaction between temperature and location (e.g., GNP, APF, Cattle [F5 = 9.12, P
< 0.01]) were important in explaining TSW.
Movement
Bison moved at a significantly faster rate than cattle (β = 0.62 + 0.08 SE, P = < 0.001).
Cattle did not statistically differ in their movement rates across locations (β = -0.17 + 0.27 SE, P
= < 0.206), however, bison differed across locations with bison moving at faster rates on APR (β
= 0.41 + 0.11 SE, P = < 0.001) and GNP (β = 0.69 + 0.0822 SE, P = < 0.0005) than cattle
(combined). Thus, bison on APR and GNP moved at a rate 51 and 99% faster than cattle,
respectively, following our prediction that bison would demonstrate higher movement rates than
cattle.
Variance in FPT was maximized at 5,162 + 17.7 (patch area = 8,368 ha) and 6,100 +
457.1 (patch area = 11,690 ha) m radii for bison in APR and GNP (Fig. 5), respectively, whereas
cattle on Barnard and Weiderrick Ranches were maximized at 2,785 + 230.1 (area = 2,435 ha)
and 3,040 + 568.1 (area = 2,901 ha) m radii, respectively (Fig. 5). Bison in GNP also showed
increased variance in FPT at 9,904 + 914.9 m radii, however no large scale response was found
on APR (Fig. 5). Cattle on the Barnard Ranch showed hierarchical selection at a smaller scale

29
located at 395 + 118.0 m radii (Fig. 5). Cattle on Weiderrick Ranch also appeared to select
resources at a fine scale (1,400 + 636.4) in 2011 but no selection was obvious in 2010.
Resource Selection
We obtained > 9,000 GPS telemetry locations of bison on APR (n = 2) and GNP (n = 3.5)
encompassing 28 animal months during summer (June – August 2010, 2011). We obtained >
7,000 GPS telemetry locations of cattle on Barnard (n = 2.5) and Weiderrick (n = 2.5) Ranches
encompassing 24 animal months during the same period (Table 2).
Bison. Resource selection by Bison on APR (Table 4) was similar across years except for
distance to fencing and sagebrush communities, which were selected in 2010 and avoided in
2011. Aspect showed no clear statistically significant trends across years. Bison selected higher
elevation and water sources and avoided roads and steeper slopes. Resource selection by bison
in GNP within the constrained second order (within full pasture [Table 4]) and third order
(within summer range [Table 4]) showed large similarities for some covariates across time and
space, particularly in selection of higher elevations and water. Avoidance of steep slopes
occurred at both scales and avoidance occurred for most vegetation communities, including
sagebrush, upland grassland, and disturbed communities across time and space. Bison
demonstrated a quadratic response to NDVI (Fig. 6) except on APR in 2011. Lastly, avoidance
of fence varied across years and spatial scale.
Cattle. Resource selection by cattle on the Barnard Ranch (Table 4) and Weiderrick
Ranch (Table 4) were nearly identical across time and space. All cattle demonstrated strong
selection for water resources except cattle on the Barnard Ranch in 2011, however that result was
not significant (0.42, P = 0.27). Cattle on both ranches selected low elevations and cattle on the
Barnard Ranch selected areas closer to roads, however no comparison to cattle on the Weiderrick

30
Ranch could be made because of the lack of major roads in the area. Cattle avoided steep slopes
and avoided all vegetation types in relation to riparian shrub communities. Contrary to bison,
cattle demonstrated a linear response to NDVI except on the Barnard Ranch in 2010 (Fig. 6).
DISCUSSION
Interest in bison and prairie conservation has been renewed with range and wildlife
managers questioning the impacts of and differences between domestic and native grazers on the
landscape. In particular, bison and cattle share a common ancestry, however evolutionary
changes which have taken place over the past 600,000 years (MacHugh et al. 1997), lead to
questions of whether the two species are, or can, serve as ecological synonyms of one another.
Furthermore, complications arise when addressing these questions due to different management
strategies between bison and cattle (Plumb and Dodd 1993, Towne et al. 2005, Allred et al.
2011).
In addition, bison are effectively extinct at what is thought be ecologically relevant scales
(Freese et al. 2007). However, a definition of this spatial scale for bison has, until recently, been
subjective. For example, Lott (2002) approximated an ecological functional scale for a bison
herd within a sustainable prairie ecosystem to be as large as 1,300,000 ha. In support of large
areas, Sanderson et al. (2008) stated that landscapes > 200,000 ha are exceptional contributors to
the ecological recovery of bison, yet no quantitative work has demonstrated the true scale that
bison operate at until this study.
Behavior
Water developments are the primary tool used on public and private lands to improve
grazing uniformity. In the U.S., ~34,000 water development projects have been implemented on
Bureau of Land Management lands since 1936 (L. Pack, Bureau of Land Management, personnel
communication). Despite the ecological impacts of cattle around water (Fleischner 1994), the

31
beneficial impacts of livestock water development on wildlife species are controversial and many
times unsubstantiated (Broyles 1995, Krausman et al. 2006). In particular, only Allred et al.
(2011) have directly compared the influence of water resources on bison and cattle while
accounting for management and environmental factors. Through the use of resource selection
analyses, they were able to quantify selection (cattle) and avoidance (bison) of riparian areas and
water resources, however the inclusion of behavioral observations, allows for a stronger
understanding of bison physiology and thus, bison requirement of water resources on the
landscape.
Similarly to Plumb and Dodd (1993), we report bison spending less time grazing than
cattle. Grazing is an important ecological process for maintaining and restoring prairie
landscapes through nutrient cycling (Coppock et al. 1983, Knapp et al. 1999) and increased
vegetation structure and composition (Hartnett 1996, Knapp et al. 1999, Fuhlendorf et al. 2006).
As a result, increased grazing time by cattle in combination with stocking levels 2 x historic
bison estimates may further exacerbate homogenous grazing across the landscape resulting in a
continued decline of prairie obligate species (Knopf 1996).
Historical accounts state that bison would graze for multiple days before attaining water
(Dary 1979), at which time they would drink heavily (Hornaday 1887a, Dary 1979) which was
exemplified by van Vuren (1979) who calculated bison water events to last 21.3 minutes in a
desert landscape. Based on this information and the evolutionary adaptation of bison to the
Great Plains, we predicted bison would spend less time at water than cattle. We also predicted
bison in GNP would spend increased time at water than APR due to GNP’s decreased water
availability in the north-east corner of the park, thus imitating a historic water landscape. We
report, however, shorter watering periods in GNP which may be due to high precipitation levels
32
during the study which permitted water acquisition from temporary water sources during bison
grazing periods. Even in the event of a dry year, bison TSW in GNP may not be highly
influenced by water availability because water is always available within 5km, thus providing
greater water availability than historical periods.
Movement
Due to differing evolutionary histories and approximations of bison space use (above),
we predicted bison and cattle would show differences in the spatial scale at which they perceive
their resources. As predicted, bison identified larger patch scales than cattle according to the
FPT analysis. In fact, we report bison on APR identifying resource patches at a spatial scale 1.8
x that of currently available areas given fence constriction. Similarly, FPT identified resource
patches for bison in GNP at 2.7 and 5.50 – 9.0 x greater than their seasonal kernel home range
estimate. Interestingly, cattle selected patch sizes 2.4 – 3.5 x greater than their available pasture
unit.
If FPT truly identifies the ecological resource size of bison (5,162 + 17.7– 6,100 + 457.1
m radii), then this may be the first quantitative evidence that bison require larger landscapes than
currently provided by managers. In addition, FPT identifies a single resource patch, implying
that multiple patches are necessary, particularly when considering long temporal scales which
bison may have operated at historically (Seton 1929). It is important to note, however, that
variance in FPT is a function of area which may be influenced by the incorporation of a defined
boundary (i.e., fencing), a factor that no previous FPT study has dealt with. Specifically, area
calculations would incorporate space that is unavailable for use leading to inconclusive findings.
The FPT analysis appeared to be strongly influenced by pasture size, with the largest FPT
peaks coinciding with the largest transversable distance across pastures for cattle and bison on

33
APR (Fig. 7). Similarly, the largest scale of selection by bison in GNP coincides with the
largest seasonal use of bison (Fig. 8). More importantly, the selection by cattle of spatial scales
smaller (2,785 + 230.1 - 3,040 + 568.1 m radii) than their available pasture unit provides support
to the possibility that bison spatial scales are larger than their current pasture availability on APR
(Fig. 7). If this is the case, the peak in FPT by bison in GNP at ~6,100 m radii may in fact
represent that spatial scale of selection by bison during the summer months. Contrary to
previous FPT work in which selection has occurred within spatial scales, FPT analysis of bison
may identify temporal scales, in which bison use a single patch at ~6,100 m radii (11690 ha)
until overgrazed, upon which they move to another region of similar scale in the following year.
This further encourages larger landscapes because the probability of increased heterogeneity
increases with larger spatial scopes (Morrison 2002), thus allowing for temporal selection of
resources.
Resource Selection
Cattle located on the Weiderrick and Barnard ranches demonstrated strong selection for
riparian areas, lowlands, and water resources as predicted by other studies (van Vuren 1983,
Gillen et al .1984, Porath et al. 2002, Allred et al. 2011). Furthermore, we report maximum areas
of use to be < 3 km from water for cattle (Fig. 9). Similar to previous research, we report
selection of higher elevations for bison (van Vuren 1979, Phillips 2000); however we report
avoidance of most vegetation communities by bison populations on APR and GNP in relation to
shrub/riparian areas, a finding contrary to previous literature. These riparian areas were
generally found within steep drainage areas where water availability may exist, thus explaining
the selection of these areas. We were, however, unable to quantify all available water in these
locations due to its semi-permanent nature.

34
We also report variance in selection of bison on APR for fencing. We predicted electrical
fencing would result in a negative stimulus that would increase fence avoidance by bison,
however avoidance varied across years. This may be a result of biotic factors across the
landscape that outweighs the impact of electrical fencing. Similarly, we did not expect fencing
to have an impact in GNP at any spatial scale, thus the selection of fencing at the second order
may be a result of selection for other biotic factors.
We report selection for water resources by bison across location and spatial scale, a
finding contrary to other work throughout the literature (van Vuren 1979, Phillips 2000, Babin
2009, Allred et al. 2011). However, our findings, similar to McHugh (1958), do support use of
areas only up to 10 km from water sources (Fig. 9). Due to significant precipitation, we
predicted increased avoidance of permanent water resources resulting in a decrease in water
selection. Despite adjusted spatial estimates of water resources used for the RSF analysis, it is
likely we underestimated the total water available for bison, which would predict greater
avoidance of water due to decreased necessity to seek permanent water sources. It may be
possible, however, that bison populations were located in areas consisting of high water densities
which prevented avoidance if bison were unable to leave areas of significant water.
In terms of grazing, NDVI explains a linear estimate of the plant canopy cover (Tucker
and Sellers 1986) allowing identification of tradeoffs between forage quality and quantity
(Fryxell 1991). As a result, maximum net intake occurs at intermediate biomass where daily
energy intake and forage biomass intersect (Hebblewhite et al. 2008), but this selection may be
scale dependent (Wilmshurst et al. 1999, Fortin et al. 2002, Fortin et al. 2003). We report
differing selection relationships in relation to NDVI by bison and cattle (Fig. 6). A quadratic
relationship was fit to each species to maintain consistency within the study; however it is

35
evident that cattle may be maximizing intake rate by selecting areas of higher forage biomass
(Fig. 6). Previous work has varied across studies with cattle selecting for maximum intake
(Distel et al. 1995), previously grazed areas (Silvia Cid and Brizuela 1998), higher forage quality
(Bailey 1995), or areas of intersecting forage quantity and quality (Senft et al. 1985). Similar to
other studies (Coppock et al. 1983, Coppedge and Shaw 1998, Bergman et al. 2001), bison
selected for intermediate biomass except at the third order scale in 2011 on APR and GNP (Fig.
6). We hypothesize these differences in 2011 are due to abundant rainfall throughout the year
which may have resulted in areas of high biomass with abnormally high nutrient quality, thus
reducing the relationship between forage quality and quantity.
IMPLICATIONS
Current range management techniques have been designed to maximize livestock
production through the use of cross fencing and uniformly distributed stock reservoirs,
effectively rescaling the grazing process across the landscape in a homogenous fashion
(Fuhlendorf and Engle 2001, Derner et al. 2009). However, if increased vegetation
heterogeneity leading to landscape scale prairie conservation is a goal, particularly when
maintaining domestic livestock as the dominant grazer, then alteration of grazing rotations may
reduce the impact of increased grazing periods and localized use areas by livestock (Fuhlendorf
and Engle 2001). This may be implemented through alterations to rotational grazing practice
timing, duration, and intensity across spatial and temporal scales (S. Cleveland, The Nature
Conservancy, personnel communication) or transportable water and mineral sources (Ganskopp
2001, Porath et al 2002, Bailey 2004).
If increased vegetation heterogeneity through bison grazing is an objective, then we have
demonstrated that large landscapes may be required to facilitate bison movement and resource

36
selection that approximate historical bison use. Although we have not quantified the pasture
scale that would permit historical landscape use, we have provided the first quantitative support
for the contribution of large landscape to the ecological recovery of bison. Due to the limited
area of availability for bison in this study, we encourage movement analyses of these types to be
adapted to non-constricted populations which may provide additional insight into the scale of
bison use across time and space. Within bison conservation areas, we have identified resources
of value including variable vegetation communities that occur across upland and lowland areas.
Within these areas, we recommend testing the minimum spatial requirements of water by bison
through water source reductions, thus encouraging long distance movements across the
landscape that facilitate grazing heterogeneity similar to historic use (Hornaday 1887b).
ACKNOWLEDGMENTS
We thank the private landowners who provided access to their property and technicians
K. Plourde, K. Gunderson, A. Derey-Wilson, and T. King. This material is based on work
supported by the Alfred P. Sloan Foundation, American Prairie Reserve, Boone and Crockett
Wildlife Conservation Program at the University of Montana, M.J. Murdock Charitable Trust,
Montana Institute on Ecosystems funded through the National Science Foundation EPSCoR
grant EPS-1101342, The University of Montana, Wildlife Conservation Society Research
Fellowship Program, and the World Wildlife Fund-Northern Great Plains Program.
LITERATURE CITED
Allred, B. W., S. D. Fuhlendorf, and R. G. Hamilton. 2011. The role of herbivores in Great
Plains conservation: comparative ecology of bison and cattle. Ecosphere 2(3): art26.
Doi:10.1890/ES10-00152.1
Altmann, J. 1974. Observational study of behavior: sampling methods. Behaviour 49:227-267.

37
Babin, J. 2009. Nutritional determinants of space use by bison in the Great Plains [thesis].
Quebec City, Canada: University of Laval. 44 p.
Bailey, D. W. 1995. Daily selection of feeding areas by cattle in homogeneous and
heterogeneous environments. Applied Animal Behaviour Science 45:183-200.
Bailey, D. W. 2004. Management strategies for optimal grazing distribution and use of arid
rangelands. Journal of Animal Science 82:147-153.
Bailey, D. W. 2005. Identification and creation of optimum habitat conditions for livestock.
Rangeland Ecology and Management 58:109-118
Bailey, J. F., M. B. Richards, V. A. Macaulay, I. B. Colson, I. T. James, D. G. Bradley, R. E. M.
Hedges, and B. C. Sykes. 1996. Ancient DNA suggests a recent expansion of European
cattle from a diverse wild progenitor species. Proceedings of the Royal Society of London
263:1467-1473.
Bates, D., M. Maechler, and B. Bolker. 2011. Lme4: linear mixed-effects models using S4
classes. Version 0.999375-42. URL:
http://cran.r-roject.org/web/packages/lme4/index.html.
Bennington, C. C., and W. V. Thayne. 1994. Use and misuse of mixed-model analysis of
variance in ecological studies. Ecology 75:717-722.
Bergman, C. M., J. M. Fryxell, C. C. Gates, and D. Fortin. 2001. Ungulate foraging strategies:
energy maximizing or time minimizing? Journal of Animal Ecology 70:289-300
Beyer, H. L. 2012. Geospatial Modeling Environment. Version 0.6.0.0.
URL:http://www.spatialecology.com/gme.

38
Blong, B., and W. Pollard. 1968. Summer water requirements of desert bighorn in the Santa
Rosa Mountains, California, in 1965. Sacremento, CA, USA: California Fish and Game
Department 54. 7 p.
Bolker, B. M., M. E. Brooks, C. J. Clark, S. W. Geange, J. R. Poulsen, M. H. H. Stevens, and J.
S. White. 2009. Generalized linear mixed models: a practical guide for ecology and
evolution. Trends in Ecology and Evolution 24:127-135.
Boyd, D. P. 2003. Conservation of North American bison: status and recommendations [thesis].
Calgary, Canada: University of Calgary. 235 p.
Breslow, N. E. and D. G. Clayton. 1993. Approximate inference in generalized linear mixed
models. Journal of the American Statistical Association 88:9-25.
Broyles, B. 1995. Desert wildlife water developments: questioning use in the southwest. Wildlife
Society Bulletin 23:663-675.
Cain III, J. W., P. R. Krausman, J. R. Morgart, B. D. Jansen, and M. P. Pepper. 2008. Responses
of desert bighorn sheep to removal of water sources. Wildlife Monographs 171:1-32.
Calenge, C. 2006. The package adehabitat for the r software: a tool for the analysis of space and
habitat use by animals. Ecological Modelling 197:516-519.
Coppedge, B. R., and J. H. Shaw. 1998. Bison grazing on seasonally burned tallgrass prairie.
Journal of Range Management 51:258-264.
Coppock, D. L., J. E. Ellis, J. K. Detling, M. I. Dyer. 1983. Plant-herbivore interactions in a
North American mixed-grass prairie. II. Responses of bison to modification of vegetation
by prairie dogs. Oecologia 56:10-15.
Dary, D. A. 1989. The buffalo book: the full saga of the American Animal. p. 32. Chicago, IL,
USA: Swallow Press. 384 p.

39
Deblinger, R. D., and A. W. Alldredge. 19991. Influence of free water on pronghorn distribution
in a sagebrush/steppe grassland. Wildlife Society Bulletin 19:321-326.
Derner, J. D., W. K. Lauenroth, P. Stapp, and D. J. Augustine. 2009. Livestock as ecosystem
engineers for grassland bird habitat in the western Great Plains of North America.
Rangeland Ecology and Management 62:111-1118.
Distel, R. A., E. A. Laca, T. C. Griggs, and M. W. Demment. 1995. Patch selection by cattle:
maximization of intake rate in horizontally heterogeneous pastures. Applied Animal
Behaviour Science 45:11-21.
Edwards, C. J., R. Bollongino, A. Scheu, A. Chamberlain, A. Tresset, J. Vigne, J. F. Baird, G.
Larson, S. Y. W Ho, T. H. Heupink, B. Shapiro, A. R. Freeman, M. G. Thomas, R.
Arbogast, B. Arndt, L. Bartosiewics, N. Benecke, M. Budja, L. Chanix, A. M. Choyke, E.
Coqueugniot, H. Dohle, H. Goldner, S. Hartz, D. Helmer, B. Herzig, H. Hongo, M.
Maskour, M. Ozdogan, E. Pucher, G. Roth, S. Schade-Lindig, U. Schmolcke, R. J.
Schulting, E. Stephan, H. Uermann, I. Voros, B. Voytek, D. G. Bradley, and J. Burger.
2007. Mitochondrial DNA analysis shows a near eastern Neolithic origin for domestic
cattle and no indication of domestication of European aurochs. Proceedings of the Royal
Society of London 274:1377-1385.
Elder, J. B. 1954. Notes on summer water consumption by desert mule deer. Journal of Wildlife
Management 18:540-541.
Fauchald, P., and T. Tveraa. 2003. Using first-passage time in the analysis of area-restricted
search and habitat selection. Ecology 84:282-288.
Fleischner, T. L. 1994. Ecological costs of livestock grazing in western North America.
Conservation Biology 8:629-644.

40
Forrest, S. C., H. Strand, W. H. Haskins, C. Freese, J. Proctor, and E. Dinerstein. 2004. Ocean of
grass: a conservation assessment for the Northern Great Plains. Bozeman, MT, USA:
Northern Plains Conservation Network and Northern Great Plains Ecoregion. 191 p.
Fortin, D., J. M. Fryxell, and R. Pilote. 2002. The temporal scale of foraging decisions in bison.
Ecology 83:970-982.
Fortin, D., J. M. Fryxell, L. O’Brodovich, and D. Frandsen. 2003. Foraging ecology of bison at
the landscape and plant community levels: the applicability of energy maximization
principles. Oecologia 134:219-227.
Fox, J. 2005. The r commander: a basic statistics graphical user interface for r. Journal of
Statistical Software 14:9:1-41.
Frair, J. L., E. H. Merrill, D. R. Visscher, D. Fortin, H. L. Beyer, and J. M. Morales. 2005. Scales
of movement by elk (Cervus elaphus) in response to heterogeneity in forage resources
and predation risk. Landscape Ecology 20:273-287.
Freese, C. H., K. E. Aune, D. P. Boyd, J. N. Derr, S. C. Forrest, C. C. Gates, P. J. P. Gogan, S.
M. Grassel, N. D. Halbert, K. Kunkel, and K. H. Redford. 2007. Second chance for the
plains bison. Biological Conservation 136:175-184.
Fryxell, J. M. 1991. Forage quality and aggregation by large herbivores. American Naturalist
131:781-798.
Fryxell, J. M., M. Hazell, L. Borger, B. D. Dalziel, D. T. Haydon, J. M. Morales, T. McIntosh,
and R. C. Rosatte. 2008. Multiple movement modes by large herbivores at multiple
spatiotemporal scales. PNAS 105:19114-19119
Fuhlendorf, S. D., and D. M. Engle. 2001. Restoring heterogeneity on rangelands: ecosystem
management based on evolutionary grazing patterns. BioScience 51:625-632.

41
Fuhlendorf, S. D., B. W. Allred, and R. G. Hamilton. 2010. Bison as keystone herbivores on the
Great Plains: can cattle serve as proxy for evolutionary grazing patterns. Bronx, NY,
USA: American Bison Society Working Paper No. 4. 48 p.
Fuhlendorf, S. D., W. C. Harrell, D. M. Engle, R. G. Hamilton, C. A. Davis, and D. M. Leslie Jr.
2006. Should heterogeneity be the basis for conservation? Grassland bird response to fire
and grazing. Ecological Applications 16:1706-1716.
Ganskopp, D. 2001. Manipulating cattle distribution with salt and water in large arid-land
pastures: a GPS/GIS assessment. Applied Animal Behavior Science 73-251-262.
Gates, C. C., C. H. Freese, P. J. P. Gogan, and M. Kotzman. 2010. American bison: status survey
and conservation guidelines 2010. Gland, Switzerland: IUCN 978-2-8317-1149-2. 154 p.
Gillen, R. L., W. D. Krueger, and R. F. Miller. 1984. Cattle distribution on mountain rangeland
in northeastern Oregon. Journal of Range Management 37:549-553.
Gillies, C. S., M. Hebblewhite, S. E. Nielsen, M. A. Krawchuck, C. L. Aldridge, J. L. Frair, D. J.
Saher, C. E. Stevens, and C. L. Jerde. 2006. Application of random effects to the study of
resource selection by animals. Journal of Animal Ecology 75:887-898.
Hartnett, D. C., K. R. Hickman, L. E. Fischer Walter. 1996. Effects of bison grazing, fire, and
topography on floristic diversity in tallgrass prairie. 1996. Journal of Range Management
49:413-420.
Hebblewhite, M., E. Merrill, and G. McDermid. 2008. A multi-scale test of the forage maturation
hypothesis in a partially migratory ungulate population. Ecological Monographs 78:141-
166.
Holecheck, J. L., R. D. Pieper, and C. H. Herbel. 2006. Range management principles and
practices. 6th
ed. Upper Saddle River, NJ, USA: Prentice Hall. 456 p.

42
Hornaday, W. T. 1887a. The extermination of the American bison with a sketch of its discovery
and life history. p. 418-420. Washington, D.C. USA: Report of the U.S. National
Museum, 1887, Part 2. 181 p.
Hornaday, W. T. 1887b. The extermination of the American bison with a sketch of its discovery
and life history. p.377. Washington, D.C. USA: Report of the U.S. National Museum,
1887, Part 2. 181 p.
Hosmer, D. W., and S. Lemeshow. 2000. Applied logistic regression. 2nd Ed. New York, NY,
USA: John Wiley & Sons, Inc. 392 p.
Huete, A., K. Didan, T. Miura, E. P. Rodriguez, X. Gao, and L. G. Ferreira. 2002. Overview of
the radiometric and biophysical performance of the MODIS vegetation indices. Remote
Sensing of Environment 83:195-213.
James, C. D., J. Landsberg, and S. R. Morton. 1999. Provision of watering points in the
Australian arid zone: a review of effects on biota. Journal of Arid Environments 41:87-
121.
Johnson, D. H. 1980. The comparison of usage and availability measurements for evaluating
resource preference. Ecology 61:65-71.
Knapp, A. K., J. M. Blair, J. M. Briggs, S. L. Collins, D. C. Hartnett, L. C. Johnson, and E. G.
Towne. 1999. The keystone role of bison in North American tallgrass prairie. BioScience
49:39-50.
Knopf, F. L. 1996. Prairie legacies – birds. In: F. B. Samson and F. L. Knopf [EDS.]. Prairie
conservation: preserving North America’s most endangered ecosystem. Washington,
D.C., USA: Island Press. p. 135-148.

43
Komers, P. E., F. Messier, and C. C. Gates. 1992. Search or relax: the case of bachelor wood
bison. Behavioral Ecology and Sociobiology 31:195-203.
Krausman, P. R. 2002. Introduction to wildlife management: the basics. Upper Saddle River, NJ,
USA: Prentice Hall. 478 p.
Krausman, P. R., and R. C. Etchberger. 1995. Responses of desert ungulates to a water project in
Arizona. Journal of Wildlife Management 59:292-300.
Krausman, P. R., S. S. Rosenstock, and J. W. Cain III. 2006. Developed waters for wildlife:
science, perception, values, and controversy. Wildlife Society Bulletin 34:563-569.
Krueger, K. 1986. Feeding relationships among bison, pronghorn, and prairie dogs: an
experimental analysis. Ecological Society of America 67:760-770.
Lott, D. F. 2002. American bison: a natural history. Los Angeles, CA, USA: University of
California Press. 229 p.
Lott, D. F., and S. Minta. 1983. Home ranges of American bison cows on Santa Catalina Island,
California. Journal of Mammalogy 64:161-162.
MacHugh, D. E., M. D. Shriver, R. T. Loftus, P. Cunningham, and D. G. Bradley. 1997.
Microsatellite DNA variation and the evolution, domestication and phylogeography of
Taurine and Zebu cattle (Bos Taurus and Bos indicus). Genetics 146:1071-1086.
Manly, B. F. L., L. L. McDonald, D. L. Thomas, T. L. McDonald, and W. P. Erickson. 2002.
Resource selection by animals: statistical design and analysis for field studies. 2nd
Ed.
Kluwer Norwell, MA, USA: Academic Publishers. 240 p.
McHugh, T. 1958. Social behavior of the American buffalo (Bison bison bison). Zoologica 43: 1-
40.

44
Meagher, M. M. 1973. The bison of Yellowstone National Park. Mammoth, WY, USA: National
Park Service Scientific Monograph Series 1. 161 p.
Morales, J. M., D. Fortin, J. L. Frair, and E. H. Merrill. 2005. Adaptive models for large
herbivore movements in heterogeneous landscapes. Landscape Ecology 20:301-316.
Morrison, M. L. 2002. Habitat. In: M. L. Morrison [EDS.]. Restoring wildlife: ecological
concepts and practical applications. Washington D.C. USA: Island Press. p. 58-83.
Neter, J., M. H. Kutner, C. J. Nachtsheim, and W. Wasserman. 1996. Applied linear statistical
models. 4th
Ed. New York, NY, USA: McGraw-Hill. 1408 p.
Peden, D. G., G. M. Van Dyne, R. W. Rice, R. M Hansen. 1974. The trophic ecology of Bison
bison L. on shortgrass plains. Journal of Applied Ecology 11:489-497.
Phillips, L. B. 2000. GIS modeling of bison habitat in southwestern Montana: a study in ranch
management and conservation [thesis]. Bozeman, MT, USA: Montana State University.
87 p.
Plumb, G. E., and J. L. Dodd. 1993. Foraging ecology of bison and cattle on a mixed prairie:
implications for natural area management. Ecological Applications 3:631-643.
Porath, M. L., P. A. Momont, T. DelCurto, N. R. Rimbey, J. A. Tanaka, and M. McInnis. 2002.
Offstream water and trace mineral salt as management strategies for improved cattle
distribution. Journal of Animal Science 80:346-356.
Powell, F. L. A. 2006. Effects of preseribed burns and bison (Bos bison) grazing on breeding
bird abundances in tallgrass prairie. The Auk 123: 183-197.
R Development Core Team. 2008. R: a language and environment for statistical computing.
Vienna, Austria: R foundation for statistical computing ISBN 3-900051-07-0 URL
http://www.R-project.org.
45
Rosenstock, S. S., W. B. Ballard, and J. C. Devos, Jr. 1999. Viewpoint: benefits and impacts of
wildlife water developments. Journal of Range Management 52:302-311.
Rutberg, A. T. 1984. Birth synchrony in American bison (Bison bison): response to predation or
season? Journal of Mammalogy 65:418-423.
Sanderson, E. W., K. H. Redford, B. Weber, K. Aune, D. Baldes, J. Berger, D. Carter, C. Curtin,
J. Curtin, J. Derr, S. Dobrott, E. Fearn, C. Fleener, S. Forrest, C. Gerlach, C. C. Gates, J.
E. Gross, P. Gogan, S. Grassel, J. A. Hilty, M. Jensen, K. Kunkel. D. Lammers, R. List,
K. Minkowski, T. Olson, C. Pague, P. B. Robertson, and B. Stephenson. 2008. The
ecological future of the North American bison: conceiving long-term, large-scale
conservation of wildlife. Conservation Biology 22:252-266.
Schuler, K. L., D. M. Leslie Jr., J. H. Shaw, and E. J. Maichak. 2006. Temporal-spatial
distribution of American bison (Bison bison) in a tallgrass prairie fire mosaic. Journal of
Mammalogy 87:539-544.
Senft, R. L., L. R. Rittenhouse, and R. G. Woodmansee. 1985. Factors influencing patterns of
cattle grazing behavior on shortgrass steppe. Journal of Range Management 38:82-87.
Seton, E. T. 1929. Lives of game animals, 4 volumes. Garden City, NY, USA: Doubleday, Doran
& Co. 2640 p.
Shaw, J. H., and M. Meagher. 2000. Bison. In: S. Demarais and P. R. Krausman [EDS.].
Ecology and management of large mammals in North America. Upper Saddle River, NJ,
USA: Prentice Hall. p. 447-466.
Silvia Cid, M., and M. A. Brizuela. 1998. Heterogeneity in tall fescue pastures created and
sustained by cattle grazing. Journal of Range Management 51:644-649.

46
Skrondal. A., and S. Rabe-Hesketh. 2004. Generalized latent variable modeling: multilevel,
longitudinal, and structural equation models. New York, NY, USA: Chapman & Hall.
512 p.
Smith, M. A., J. D. Rodgers, J. L. Dodd, and Q. D. Skinner. 1992. Journal of Range
Management 45:391-395.
Steuter, A. A., and L. Hidinger. 1999. Comparative ecology of bison and cattle on mixed-grass
prairie. Great Plains Research 9:329-342.
Steuter, A. A., E. M. Steinauer, G. L. Hill, P. A. Bowers, and L. L. Tieszen. 1995. Distribution
and diet of bison and pocket gophers in a sandhills prairie. Ecological Applications
5:756-766.
Towne, E. G., D. C. Hartnett, and R. C. Cochran. 2005. Vegetation trends in tallgrass prairie
from bison and cattle grazing. Ecological Applications 15:1550-1559.
Tucker, C. J., and P. J. Sellers. 1986. Satellite remote sensing for primary production.
International Journal of Remote Sensing 7:1395-1416.
Turchin, P. 1998. Quantitative analysis of movement: measuring and modeling population
redistribution in animals and plants. Sunderland, MA, USA: Sinauer Inc. 396 p.
Valentine, K. A. 1947. Distance from water as a factor in grazing capacity of rangeland. Journal
of Forestry 45:749-754.
van Vuren, D. 1979. Ecology and behavior of bison in the Henry Mountains, Utah [thesis].
Corvallis, OR, USA: Oregon State University. 47 p.
van Vuren, D. 1983. Group dynamics and summer home range of bison in southern Utah.
Journal of Mammalogy 64:329-332.
47
Venables, W. N. and B. D. Ripley. 2002. Modern applied statistics with S. 4th
Ed. New York,
NY, USA: Springer. 512 p.
Williams, D. M., A. C. Dechen Quinn, and W. F. Porter. 2012. Landscape effects on scales of
movement by white-tailed deer in agricultural-forest matrix. Landscape Ecology 27:45-
57.
Williams, R. E. 1954. Modern methods of getting uniform use of ranges. Journal of Range
Management 7:77-81.
Wilmshurst, J. F., J. M. Fryxell, B. P. Farm, A. P. Sinclair, and C. P. Henschel. 1999. Spatial
distribution of Serengeti wildebeest in relation to resources. Canadian Journal of Zoology
77:1221-1232.
Wydeven, A. P., and R. B. Dahlgren. 1985. Ungulate habitat relationships in Wind Cave
National Park. Journal of Wildlife Management 49:805-813.

48
FIGURES
Figure 1. Inventory of bison and cattle numbers from historic to current periods in North
America. Bison historic estimates are estimated from commonly accepted literature on historic
bison numbers. Bison estimates from 1890 to present were collected by Boyd 2003 and Gates et
al. 2010. Conservation herds denote bison herds that are not managed for commercial purposes.
Cattle inventory numbers were provided by U.S. Department of Agriculture and Statistics
Canada.
Figure 2. Location of bison and cattle study sites. Bison herds were located at American Prairie
Reserve (diamond) and Grasslands National Park (star). Two cattle herds are located in pastures
adjacent to APR bison herd. The GNP is located 20 km southeast of Val Marie, SK, Canada and
other sites are located 74 km south of Malta, MT, USA.
Figure 3. Location of bison and cattle pastures for bison-cattle study on and adjacent to
American Prairie Reserve. White identifies artificial stock reservoirs and remnant pools within
ephemeral streams.
Figure 4. Location of Grasslands National Park bison pasture for bison-cattle study. White
identifies perimeter of artificial stock reservoirs and remnant pools within ephemeral streams.
Dashed line identifies main ecotour route through the park.
Figure 5. Results of First Passage Time (FPT) analysis for 1 female bison during summer 2010
on American Prairie Reserve (A) and in Grasslands National Park (B) and for one domestic
female during summer 2010 on Barnards Ranch (C) and on Weiderrick’s Ranch (D. Peaks in
variance of FPT identify the spatial scale at which consumers perceive their resources. X-axis is
a measure of a circles radius.

49
Figure 6. Probability of use for intermediate green vegetation (NDVI values) for bison on
Grasslands National Park (GNP) and American Prairie Reserve (APR) and cattle on APR.
Selection of NDVI was compared across entire pasture (Ann) and within summer range (Sum)
on GNP. Selection was fit to a quadratic relationship for both species to identify whether
selection was occurring for intermediate forage biomass.
Figure 7. Visual comparison of fence effect of First Passage Time analysis (FPT) for bison and
cattle on Grasslands National Park (GNP) and American Prairie Reserve (APR). Dotted lines
represent average transversable distance across pastures. Cattle on Barnard Ranch (A)
demonstrate a small-scale selection within their pasture (circle). Bison on GNP (B) do not
identify scales under 5,000 m radii, however, average transferable distance across the pasture
coincides with secondary peaks at ~10,000 m radii supporting areas around 6,100 m radii as the
scale of selection by bison in a large pasture.
Figure 8. Graphical representation of transversable distance across Grasslands National Park
bison. Kernel density home range estimate (95%) overlayed on GPS locations from 2010 and
2011. Measurement lines (12 km) of transversable distance provides support to hypothesis that
seasonal use is identified by FPT analysis at scales >10,000 m radii, thus ~6,000 m radii
represent spatial scale use.
Figure 9. Probability of use for bison and cattle in relation to distance to water. Calculated using
averaged values from RSF across years and locations for bison and cattle on GNP and APR.

50
51

52

53

54
A
B
C
D

55

56
APR GNP Cattle

57

58

59
Table 1. Description of grazing pastures and stocking densities for animals owned by
American Prairie Reserve (APR), Parks Canada (PC), Weiderrick Ranch (WR) and
Barnard Ranch (BR). Analysis was performed on annual bison range (Park) and within
summer home range (NE Corner) in Grasslands National Park (GNP). The GNP is
located 20 km southeast of Val Marie, SK, Canada and other sites are located 74 km
south of Malta, MT, USA.
Year Species Owner Pasture Name AUM/ha
2010 Bison APR Box Elder 0.25
2011 Bison APR Box Elder 0.18
2010 Bison PC GNP - Park 0.11
2011 Bison PC GNP - Park 0.14
2010 Bison PC GNP - NE Corner 0.14
2011 Bison PC GNP - NE Corner 0.18
2010 Cattle WR Telegraph North 0.14
2011 Cattle WR Telegraph North 0.09
2011 Cattle WR Telegraph West 0.16
2010 Cattle BR Kill Woman 0.36
2011 Cattle BR Box Elder 0.39
2011 Cattle BR Kill Woman 0.49

60
Table 2. Collar ID, fix interval, and collection dates for female bison in Grasslands National Park (GNP) and American Prairie
Reserve (APR) and collection dates for female cattle on Barnard Ranch (Br) and Weiderrick Ranch (WR).
Study
Site
Collar
ID Company
Fix-
Interval
(hr)
Data
Start
Data
End Fixes
Data
Start Data End Fixes
2010 2011
GNP 1 Lotek 1 1-Jul 31-Aug 1194 1-Jun 23-Aug 1966
2 Lotek 1 1-Jul 31-Aug 1374 -- -- --
3 Northstar 3 1-Jul 31-Aug 479 1-Jun 31-Aug 621
4 Northstar 3 1-Jul 31-Aug 473 1-Jun 31-Aug 610
APR 1 Lotek 2 1-Jun 31-Aug 1071 9-Jun 31-Aug 705
2 Northstar 2 1-Jun 30-Jul 651
2-
Jun1,2
31-
Aug1,2
253
BR 1 Lotek 2 1-Jun 16-Jul 3 533 18-Jun 31-Aug 535
2 Lotek 2 -- -- -- 10-Jun 31-Aug 881
3 Lotek 2 -- -- -- 10-Jun 31-Aug 855
4 Lotek 2 -- -- -- 10-Jun 31-Aug 750
WR 1 Lotek 2 9-Jul 31-Aug 642 6-Jul 31-Aug 660
2 N / L 4 2 9-Jul 31-Aug 716 6-Jul 31-Aug 672
3 Lotek 2 -- -- -- 6-Jul 31-Aug 663 1 Locations were censored in cases of bison movement outside of designated study pastures: June 1 – 9, 11 – 22, July 27 –
Aug. 2, Aug. 22 – 29. 2 Collar intermittent failure occurred: July 11 – Aug. 19. Collar Replacement Aug 19.
3 Animals moved to non-comparable rotational grazing pasture.
4 Northstar collar (N) used in 2010, Lotek (L) in 2011

61
Table 3. Proportion of time of behavioral activities observed from 1 June – 31 August
(2010, 2011) of bison on American Prairie Reserve (APR) and Grasslands National Park
(GNP) and cattle on Barnard Ranch (BR) and Weiderrick Ranch (WR).
Behavior Bison Cattle
(%) APR GNP BR WR
Grazing 0.26 0.28 0.45 0.49
Standing 0.15 0.18 0.24 0.20
Bedded 0.46 0.46 0.23 0.29
Moving 0.11 0.08 0.05 0.02
Tending 0.01 0.01 0.00 0.00
Other 0.01 0.01 0.02 0.00

62
Table 4. Coefficient estimates from Resource Selection Functions of summer 2010 and 2011 bison use on American Prairie Reserve
(APR) and Grasslands National Park (GNP). Analysis was calculated within summer range (summer) and within annual range
(annual) in GNP. Coefficient values were calculated for cattle on Barnard and Weiderrick Ranches. Dashes identify non-significant
values. Variables unavailable for calculation are identified by NA. Significance at > 0.05.
Bison Cattle
APR GNP (Summer) GNP (Annual) Barn Weid Variables 2010 2011 2010 2011 2010 2011 2010 2011 2010 2011
North Aspect 0.2262 -- -- -0.1892 -0.3833 -0.2953 -- 0.2435 -- --
South Aspect -- -- -- -- NA -0.2882 -- 0.3922 0.4299 0.2667
West Aspect 0.2135 -- -- -- NA 0.2608 -- 0.2472 0.4456 --
Distance to fence 0.3388 -- -0.5995 -- 0.1921 -0.6575 -- -- -- -0.3461
Distance to road 0.1706 0.1089 0.1383 0.112 0.6053 -- -- 1.6972 NA NA
Distance to water -0.4416 -0.5284 -0.1219 -- -0.4284 -0.3973 -0.5649 0.4258 -0.9565 -1.4969
Elevation 16.0968 11.95 5.4866 6.0146 18.3053 33.146 -- -- 26.8354 --
NDVI 25.6805 9.666 -17.228 -- 37.6806 -- -- -- -- 17.963
NDVI2 -32.38 -- -- -- -43.355 55.0786 -- -- -- --
Slope -0.1373 -0.0617 -0.0739 -0.0574 -0.0445 -- -0.0832 0.1554 -0.0728 -0.0455
Vegetation
Disturbed NA -- -1.3217 -1.2518 -1.8345 -1.5641 NA NA NA NA
Eroded 0.8378 -- -0.3617 -0.5754 -1.6471 -3.4417 -- 0.9504 -1.616 14.1033
Upland grassland NA -- -- -0.4645 -0.2817 -- -- -- -0.743 -1.1259
Sloped grassland -- -- -0.3539 -0.4743 -0.2692 -- -- 1.4182 -- -0.8715
Sagebrush 0.3814 -1.073 -- -0.5006 -- -1.679 -- 0.9429 -- -0.7111
Treed NA NA NA NA -- -- -1.1957 1.7603 NA NA
Water bodies -- -- NA NA NA NA NA -- -- 0.9442
Valley grassland NA NA -0.3328 -- 0.5064 -0.4314 NA NA NA NA
Unknown -- -- 2.3274 -- -1.1978 -5.7184 -- -- -- --

63
Appendix A
Vegetation Classification
Vegetation classifications on GNP were based on field work completed by ground sampling (R.
Sissons, GNP, unpublished data). Vegetation classifications on APR were designed to allow for
comparison between vegetation communities on GNP and were achieved through contracted
service. We delineated 10 vegetation communities (e.g., eroded, upland grassland, disturbed,
sloped grassland, shrub/riparian, valley grassland, treed, unclassified, sage-brush, and water
bodies). Classification was achieved using aerial photo interpretation of 1 m resolution true-
color ortho-imagery acquired in 2009. Guiding this classification was the 30m resolution Gap
Analysis Program (U.S. Geological Survey 2011), Landsat imagery (NASA 2009) and field site
visits (M. Kohl, unpublished data). Class delineations were further enhanced using Landsat
spectral signatures derived from field sites and 250 m2 Normalized Difference Vegetation Index
(NDVI [Moderate Resolution Imagine Spectroradiometer {Huete et al. 2002}]) time series, from
2009 and 2010, to define habitat specific phenology patterns.
64
Appendix B
Grazing Time and Intensity
Description of stocking densities for animal owned by American Prairie Reserve (APR), Parks Canada (PC), Weiderrick Ranch (WR)
and Barnard Ranch (BR). Analysis was performed on annual bison range (Park) in Grasslands National Park (GNP; 20 km southeast
of Val Marie, SK, Canada; other sites are 74 km south of Malta, MT, USA) and within summer range (NE Corner).
Year Species Owner Pasture Name
Pasture
Size (ha)
Start
Date
End
Date Months Number* AUMs* AUM/ha
2010 Bison APR Box Elder 3555 15-May 15-Oct 5.0 215 900 0.25
2011 Bison APR Box Elder 3555 15-May 15-Oct 5.0 147 650 0.18
2010 Bison PC GNP - Park 18,153 1-Jan 31-Dec 12.0 147 1965 0.11
2011 Bison PC GNP - Park 18,153 1-Jan 31-Dec 12.0 195 2575 0.14
2010 Bison PC GNP - NE Corner 4,200 15-May 1-Sep 3.5 147 573 0.14
2011 Bison PC GNP - NE Corner 4,200 15-May 1-Sep 3.5 195 751 0.18
2010 Cattle WR Telegraph North 1408 1-Jul 2-Sep 2.0 100 200 0.14
2011 Cattle WR Telegraph North 1408 1-Jul 9-Aug 1.3 100 130 0.09
2011 Cattle WR Telegraph West 1090 9-Aug 1-Oct 1.7 100 170 0.16
2010 Cattle BR Kill Woman 777 15-May 15-Jul 2.0 140 280 0.36
2011 Cattle BR Box Elder 1000 15-May 11-Aug 2.8 140 392 0.39
2011 Cattle BR Kill Woman 777 11-Aug 15-Oct 2.7 140 378 0.49 1
Cattle Population Estimated at Pasture Release (May 1) - Total Cow/Calf Pairs 2 Animal Unit Month Values were calculated for bison as follows:
Cow (lactating): 1:00 Cow (adult non-lactating): 0.90 Cow (dry, 12-36 months): 0.80
Bull (12-36 months): 1.20 Bull (Adult): 1.50

65
Appendix C
Resource Selection Function - APR
Resource Selection Function models incorporating all abiotic, biotic, and anthropogenic
variables for female bison from 1 June – 31 August (2010, 2011) on American Prairie Reserve.
Bold identify statistically significant variables. Asterisks identify similar significant responses
across years and underlines identify differing significant responses across years.
2010 2011
Variables β SE p β SE p
Intercept -19.0516 2.2703 <0.0005 -12.9700 2.9820 <0.0005
North aspect 0.2262 0.1078 0.0358 -0.0081 0.1317 0.9510
South aspect 0.1464 0.1074 0.1729 0.0656 0.1326 0.6209
West aspect 0.2135 0.1018 0.0361 0.1071 0.1213 0.3771
Distance to fence 0.3388 0.0551 <0.0005 -0.1354 0.0754 0.0728
Distance to road * 0.1706 0.0363 <0.0005 0.1089 0.0475 0.0219
Distance to water * -0.4416 0.1078 <0.0005 -0.5284 0.1336 <0.0005
Elevation * 16.0968 2.5866 <0.0005 11.9500 3.3900 <0.0005
NDVI * 25.6805 4.4944 <0.0005 9.6660 4.8570 0.0466
NDVI2 -32.3796 5.4012 <0.0005 -6.8040 5.6980 0.2324
Slope * -0.1373 0.0184 <0.0005 -0.0617 0.0201 0.0021
Vegetation
Disturbed -- -- -- 1.62E+01 3.48E+03 0.9963
Eroded 0.8378 0.1792 <0.0005 0.0924 0.1750 0.5976
Upland grassland -- -- -- 1.61E+01 2.85E+03 0.9955
Sloped grassland 0.1389 0.1561 0.3736 -0.2501 0.1391 0.0722
Sagebrush 0.3814 0.1159 0.0010 -1.0730 0.1047 <0.0005
Treed -- -- -- -- -- --
Water bodies -0.2262 0.5268 0.6676 -0.0706 0.3858 0.8549
Valley grassland -- -- -- -- -- --
Unknown -0.4827 0.4062 0.2347 -14.8100 324.8000 0.9636
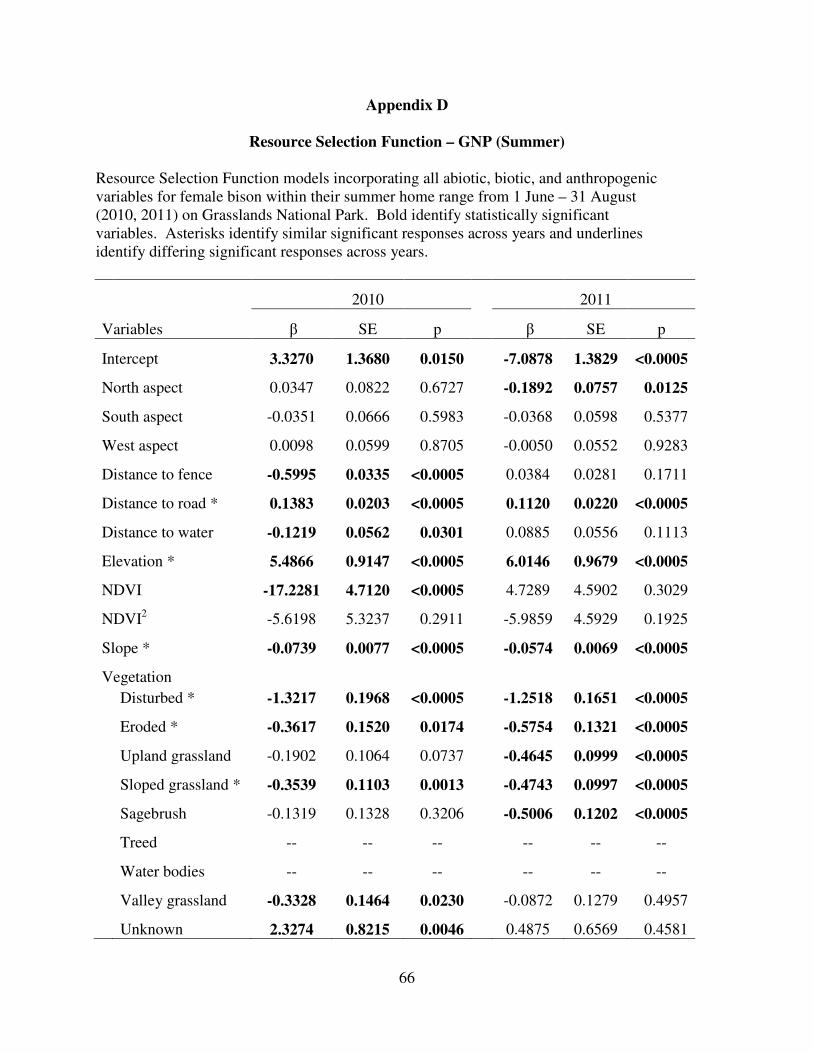
66
Appendix D
Resource Selection Function – GNP (Summer)
Resource Selection Function models incorporating all abiotic, biotic, and anthropogenic
variables for female bison within their summer home range from 1 June – 31 August
(2010, 2011) on Grasslands National Park. Bold identify statistically significant
variables. Asterisks identify similar significant responses across years and underlines
identify differing significant responses across years.
2010 2011
Variables β SE p β SE p
Intercept 3.3270 1.3680 0.0150 -7.0878 1.3829 <0.0005
North aspect 0.0347 0.0822 0.6727 -0.1892 0.0757 0.0125
South aspect -0.0351 0.0666 0.5983 -0.0368 0.0598 0.5377
West aspect 0.0098 0.0599 0.8705 -0.0050 0.0552 0.9283
Distance to fence -0.5995 0.0335 <0.0005 0.0384 0.0281 0.1711
Distance to road * 0.1383 0.0203 <0.0005 0.1120 0.0220 <0.0005
Distance to water -0.1219 0.0562 0.0301 0.0885 0.0556 0.1113
Elevation * 5.4866 0.9147 <0.0005 6.0146 0.9679 <0.0005
NDVI -17.2281 4.7120 <0.0005 4.7289 4.5902 0.3029
NDVI2 -5.6198 5.3237 0.2911 -5.9859 4.5929 0.1925
Slope * -0.0739 0.0077 <0.0005 -0.0574 0.0069 <0.0005
Vegetation
Disturbed * -1.3217 0.1968 <0.0005 -1.2518 0.1651 <0.0005
Eroded * -0.3617 0.1520 0.0174 -0.5754 0.1321 <0.0005
Upland grassland -0.1902 0.1064 0.0737 -0.4645 0.0999 <0.0005
Sloped grassland * -0.3539 0.1103 0.0013 -0.4743 0.0997 <0.0005
Sagebrush -0.1319 0.1328 0.3206 -0.5006 0.1202 <0.0005
Treed -- -- -- -- -- --
Water bodies -- -- -- -- -- --
Valley grassland -0.3328 0.1464 0.0230 -0.0872 0.1279 0.4957
Unknown 2.3274 0.8215 0.0046 0.4875 0.6569 0.4581

67
Appendix E
Resource Selection Function – GNP (Annual)
Resource Selection Function models incorporating all abiotic, biotic, and anthropogenic
variables for female bison within their annual range from 1 June – 31 August (2010, 2011) on
Grasslands National Park. Bold identify statistically significant variables. Asterisks identify
similar significant responses across years and underlines identify differing significant responses
across years.
2010 2011
Variables β SE p β SE p
Intercept -24.2664 1.5555 <0.005 21.8502 1.6601 <0.005
North aspect * -0.3833 0.0777 <0.005 -0.2953 0.1251 0.0182
South aspect -0.0312 0.0659 0.6359 -0.2882 0.0999 0.0039
West aspect 0.0623 0.0609 0.3068 0.2608 0.0948 0.0059
Distance to fence 0.1921 0.0285 <0.005 -0.6575 0.0488 <0.005
Distance to road 0.6053 0.0191 <0.005 -0.0097 0.0230 0.6726
Distance to water * -0.4284 0.0550 <0.005 -0.3973 0.0759 <0.005
Elevation * 18.3053 0.9264 <0.005 33.1460 1.4462 <0.005
NDVI 37.6806 3.5613 <0.005 11.9903 6.3138 0.0576
NDVI2 -43.3549 4.1541 <0.005 -55.0786 7.2307 <0.005
Slope -0.0445 0.0076 <0.005 -0.0088 0.0111 0.4256
Vegetation
Disturbed * -1.8345 0.1857 <0.005 -1.5641 0.2247 <0.005
Eroded -1.6471 0.1429 <0.005 -3.4417 0.1784 <0.005
Upland grassland -0.2817 0.1075 0.0088 0.2053 0.1650 0.2136
Sloped grassland -0.2692 0.1106 0.0149 0.1622 0.1682 0.3349
Sagebrush -0.0263 0.1228 0.8307 -1.6790 0.1750 <0.005
Treed -12.8528 184.6161 0.9445 -14.1364 332.9162 0.9661
Water bodies -- -- -- -- -- --
Valley grassland 0.5064 0.1438 <0.005 -0.4314 0.1930 0.0254
Unknown * -1.1978 0.3622 0.0009 -5.7184 0.5052 <0.005

68
Appendix F
Resource Selection Function – Barnard Ranch
Resource Selection Function models incorporating all abiotic, biotic, and anthropogenic
variables for female cattle from 1 June – 31 August (2010, 2011) on Barnard Ranch. Bold
identify statistically significant variables. Asterisks identify similar significant responses across
years and underlines identify differing significant responses across years.
2010 2011
Variables β SE p β SE p
Intercept 5.1889 6.3004 0.4102 4.8875 1.7845 0.0062
North aspect 0.4212 0.1606 0.0087 -0.2435 0.0571 <0.005
South aspect -0.1453 0.1482 0.3270 0.3922 0.0707 <0.005
West aspect 0.2431 0.1553 0.1175 0.2472 0.0619 <0.005
Distance to fence 0.0978 0.2302 0.6709 0.1396 0.0804 0.0825
Distance to road 0.4235 0.3813 0.2666 -1.6972 0.1188 <0.005
Distance to water * -0.5649 0.0933 <0.005 -0.4258 0.0322 <0.005
Elevation -16.3355 5.1045 0.0014 -6.5159 1.9764 0.0010
NDVI 22.9438 21.7654 0.2918 -1.3184 3.0504 0.6656
NDVI2 -9.2069 23.4070 0.6941 9.2915 3.6125 0.0101
Slope * -0.0832 0.0171 <0.005 -0.1554 0.0124 <0.005
Vegetation
Disturbed -- -- -- -- -- --
Eroded 0.2154 0.2649 0.4162 -0.9504 0.0866 <0.005
Upland grassland -0.4100 0.5788 0.4788 -1.5994 0.7328 0.0291
Sloped grassland -0.6679 0.2809 0.0174 -1.4182 0.0996 <0.005
Sagebrush -0.3051 0.1337 0.0225 -0.9429 0.0720 <0.005
Treed * -1.1957 0.2198 <0.005 -1.7603 0.2753 <0.005
Water bodies -- -- -- 0.4945 0.3756 0.1879
Valley grassland -- -- -- -- -- --
Unknown -0.1432 1.1333 0.8994 0.6246 0.4612 0.1756
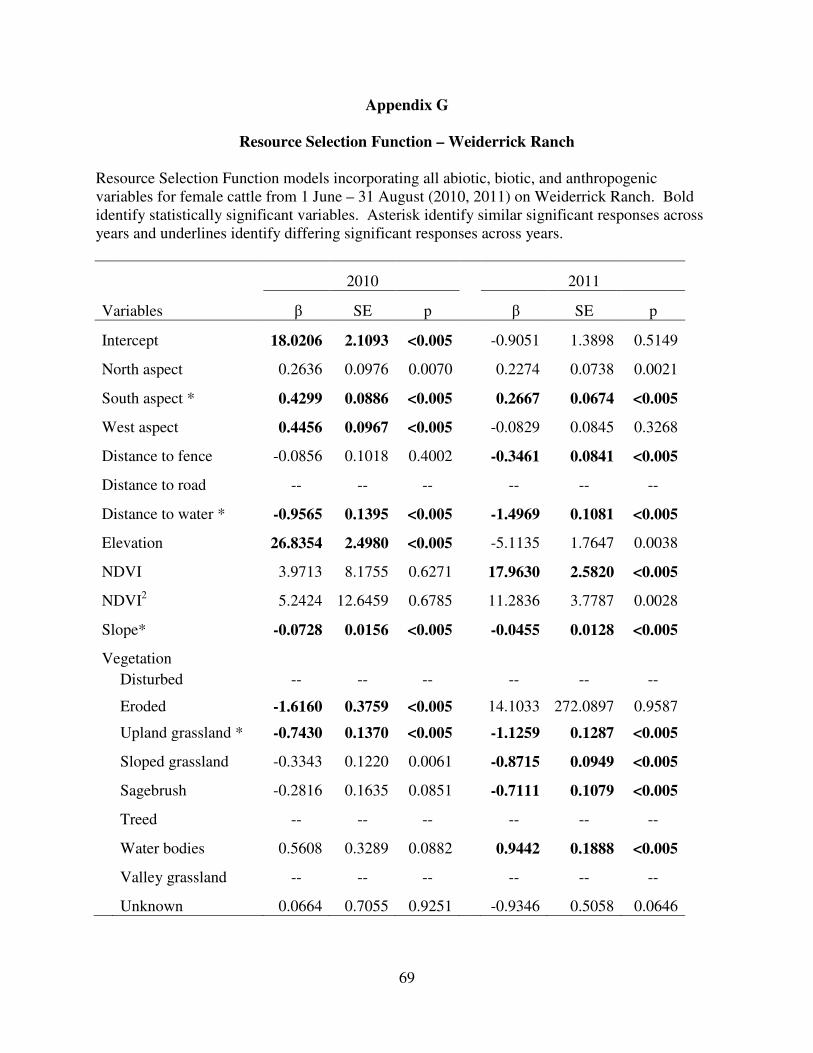
69
Appendix G
Resource Selection Function – Weiderrick Ranch
Resource Selection Function models incorporating all abiotic, biotic, and anthropogenic
variables for female cattle from 1 June – 31 August (2010, 2011) on Weiderrick Ranch. Bold
identify statistically significant variables. Asterisk identify similar significant responses across
years and underlines identify differing significant responses across years.
2010 2011
Variables β SE p β SE p
Intercept 18.0206 2.1093 <0.005 -0.9051 1.3898 0.5149
North aspect 0.2636 0.0976 0.0070 0.2274 0.0738 0.0021
South aspect * 0.4299 0.0886 <0.005 0.2667 0.0674 <0.005
West aspect 0.4456 0.0967 <0.005 -0.0829 0.0845 0.3268
Distance to fence -0.0856 0.1018 0.4002 -0.3461 0.0841 <0.005
Distance to road -- -- -- -- -- --
Distance to water * -0.9565 0.1395 <0.005 -1.4969 0.1081 <0.005
Elevation 26.8354 2.4980 <0.005 -5.1135 1.7647 0.0038
NDVI 3.9713 8.1755 0.6271 17.9630 2.5820 <0.005
NDVI2 5.2424 12.6459 0.6785 11.2836 3.7787 0.0028
Slope* -0.0728 0.0156 <0.005 -0.0455 0.0128 <0.005
Vegetation
Disturbed -- -- -- -- -- --
Eroded -1.6160 0.3759 <0.005 14.1033 272.0897 0.9587
Upland grassland * -0.7430 0.1370 <0.005 -1.1259 0.1287 <0.005
Sloped grassland -0.3343 0.1220 0.0061 -0.8715 0.0949 <0.005
Sagebrush -0.2816 0.1635 0.0851 -0.7111 0.1079 <0.005
Treed -- -- -- -- -- --
Water bodies 0.5608 0.3289 0.0882 0.9442 0.1888 <0.005
Valley grassland -- -- -- -- -- --
Unknown 0.0664 0.7055 0.9251 -0.9346 0.5058 0.0646
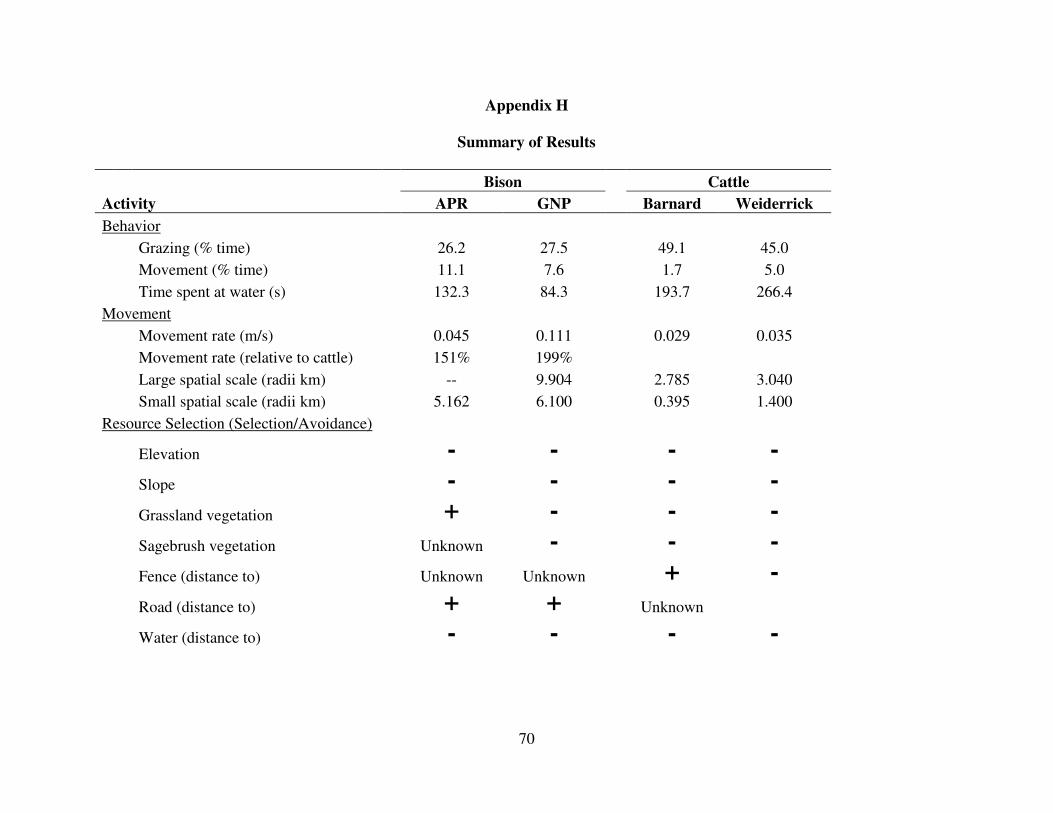
70
Appendix H
Summary of Results
Bison Cattle
Activity APR GNP Barnard Weiderrick
Behavior
Grazing (% time) 26.2 27.5 49.1 45.0
Movement (% time) 11.1 7.6 1.7 5.0
Time spent at water (s) 132.3 84.3 193.7 266.4
Movement
Movement rate (m/s) 0.045 0.111 0.029 0.035
Movement rate (relative to cattle) 151% 199%
Large spatial scale (radii km) -- 9.904 2.785 3.040
Small spatial scale (radii km) 5.162 6.100 0.395 1.400
Resource Selection (Selection/Avoidance)
Elevation - - - -
Slope - - - -
Grassland vegetation + - - -
Sagebrush vegetation Unknown - - -
Fence (distance to) Unknown Unknown + -
Road (distance to) + + Unknown
Water (distance to) - - - -

71
Appendix I
Spatial Use
Kernel density home range estimation of bison and cattle use on American Prairie Reserve
(APR; top) and bison use in Grasslands National Park (GNP; bottom). Kernels (e.g, 95, 75, 50,
25, 10%) are overlayed on G PS locations from summer (2010, 2011). Water (e.g, ephemeral
streams, artificial reservoirs) is represented in white on APR and grey on GNP.