births: provisional data for 2016 provisional . birth rate for women aged 40–44. in 2016 was 11.4...
TRANSCRIPT

U.S. Department of Health and Human Services • Centers for Disease Control and Prevention • National Center for Health Statistics • National Vital Statistics System
Vital Statistics Rapid ReleaseReport No. 002 June 2017
Births: Provisional Data for 2016Brady E. Hamilton, Ph.D., Joyce A. Martin, M.P.H., Michelle J.K. Osterman, M.H.S.,
Anne K. Driscoll, Ph.D., and Lauren M. Rossen, Ph.D. Division of Vital Statistics, National Center for Health Statistics
AbstractObjectives—This report presents
provisional 2016 data on U.S. births. Births are shown by age and race and Hispanic origin of mother. Data on marital status, cesarean delivery, preterm births, and low birthweight are also presented. This report is the first in a new annual series replacing the preliminary report series.
Methods—Data are based on 99.96% of 2016 births. Records for the states with less than 100% of records received are weighted to independent control counts of all births received in state vital statistics offices in 2016. Comparisons are made with final 2015 data and earlier years.
Results—The provisional number of births for the United States in 2016 was 3,941,109, down 1% from 2015. The general fertility rate was 62.0 births per 1,000 women aged 15–44, down 1% from 2015 to a record low for the United States. Birth rates declined to record lows for women in all age groups under 30 years in 2016. The birth rate for teenagers aged 15–19 declined 9% in 2016 to 20.3 births per 1,000 women; rates declined for both younger (aged 15–17) and older (aged 18–19) teenagers. The birth rate declined for women in their early 20s to 73.7 births per 1,000 women aged 20–24 in 2016, and for women in their late 20s to 101.9 births per 1,000 women aged 25–29. The rates for women in their 30s and 40s rose in 2016. The nonmarital birth rate declined
3% in 2016, to 42.2 births per 1,000 unmarried women aged 15–44. In 2016, 77.2% of women began prenatal care in the first trimester; 6.2% had late (beginning in the third trimester) or no prenatal care. The cesarean delivery rate declined for the fourth year in a row to 31.9%; the low-risk cesarean delivery rate declined again to 25.7% in 2016. The preterm birth rate rose for the second year in a row, to 9.84% in 2016. The low birthweight rate was also up for the second straight year to 8.16%.
Keywords: birth rates • maternal and infant health • vital statistics
IntroductionThis new report from the National
Center for Health Statistics (NCHS) is part of the National Vital Statistics System, Vital Statistics Rapid Release provisional data series. This series provides timely vital statistics for public health surveillance based on provisional data received and processed by NCHS as of a specified date. Estimates (quarterly and 12-month periods ending with each quarter) for selected key vital statistics indicators are presented and released online through Quarterly Provisional Estimates. In addition, the series includes reports that provide additional information
1
5
10
50
100
1991 1995 2000 2005 2010 20152016
15–19
15–17
18–19
Figure 1. Birth rates for females aged 15–19, by age group: United States, final 1991–2015 and provisional 2016
NOTE: Rates are plotted on a logarithmic scale. SOURCE: NCHS, National Vital Statistics System.
Rat
e pe
r 1,0
00 fe
mal
es

U.S. Department of Health and Human Services • Centers for Disease Control and Prevention • National Center for Health Statistics • National Vital Statistics System2
Vital Statistics Surveillance Report
on specific topics to help readers understand and interpret provisional natality and mortality data.
Using provisional birth data for the 12 months of 2016 (1), this report supplements the Quarterly Provisional Estimates for 2016 by including topics not shown in the quarterly estimates (births to unmarried women and the timing of prenatal care) and also presenting more detail (by race and Hispanic origin of the mother and by state of residence) for selected topics than is presented in the quarterly estimates.
This report replaces the preliminary report series which published annual birth data for data years 1997 through 2015 (2) in order to provide a consistent set of quarterly and annual releases. Except for small changes in record weights (see Technical Notes), the same processing procedure was used for provisional and preliminary data. Accordingly, these provisional data are comparable with preliminary data. As has been the case for past preliminary data findings, findings from this report will be compared with final birth data findings to assess accurateness of the estimates (2,3).
This report presents provisional data on births and birth rates and selected maternal and infant health characteristics for the United States in 2016.
MethodsFindings are based on all birth
records received and processed by NCHS for calendar year 2016 as of February 16, 2017; these records represent nearly 100% (99.96%) of registered births occurring in 2016. Comparisons in this report are based on the final data for 2015 and earlier years (3). Changes and differences presented in this report are statistically significant at the 0.05 level unless noted otherwise.
Beginning with the 2014 data year, NCHS transitioned to a new standard for estimating the gestational age of the newborn. The new measure—the obstetric estimate of gestation at delivery (OE)—replaces the measure based on the date of the last normal menses (4). Accordingly, gestational age data shown in this report are based on the OE.
Starting in 2016, all 50 states, the District of Columbia, Puerto Rico, Guam, and Northern Marianas reported race data in accordance with the revised standards issued by the Office of Management and Budget (OMB) in 1997. These standards allow for the reporting of a minimum of five race categories [American Indian or Alaska Native (AIAN), Asian, Black or African American, Native Hawaiian or Other Pacific Islander (NHOPI), and White] either by single-race (i.e., reported alone) or in combination (i.e., more than one race or multiple races) (5). The race and Hispanic origin groups shown starting with this report follow the 1997 standards and differ from the bridged-race categories shown in previous reports (3). The new categories are: non-Hispanic single-race White, non-Hispanic single-race Black or African American, non-Hispanic single-race AIAN, non-Hispanic single-race Asian, non-Hispanic single-race NHOPI, and Hispanic (for brevity, text references to non-Hispanic white or non-Hispanic black women omit the term “single-race”). Because single-race data are not available for the entire United States in 2015, comparisons between 2016 and 2015 by race are not made. For further information on differences between single- and bridged-race groups, see Technical Notes.
Population estimates by age, sex, and race and Hispanic origin for 2016 were not available as of the preparation of this report. Accordingly, birth and fertility rates by race and Hispanic origin could not be shown (but numbers and percentages of births by race
and Hispanic origin are shown). Rates by race and Hispanic origin will be presented in the 2016 final births report.
ResultsBirths and birth rates
Key findings, illustrated in Tables 1–3 and Figures 1 and 2, are listed below:
The provisional number of births for the United States in 2016 was 3,941,109, a decline of 1% from the number in 2015 (3,978,497) (Table 1). This is the second year that the number of births has declined after the increase in 2014 (3).
• Among the race and Hispanic-origin groups, the number ofbirths ranged from 9,342 birthsfor non-Hispanic NHOPI womento 2.054 million births for non-Hispanic white women (Table 2).See Table 2 for the provisionalnumber of births for other raceand Hispanic-origin groups.
• The provisional 2016 generalfertility rate for the UnitedStates was 62.0 births per 1,000women aged 15–44, a declineof 1% from the rate in 2015(62.5) and a record low rate forthe country (Table 1) (3,6).
Maternal age
• The provisional birth rate forteenagers was 20.3 births per1,000 women aged 15–19 in 2016,down 9% from 2015 (22.3) andanother record low for this agegroup (Table 1 and Figures 1 and 2)(3,6,7). The rate has declinedby 51% since 2007 (41.5), themost recent period of continueddecline, and 67% since 1991, themost recent peak. The numberof births to women aged 15–19was 209,480 in 2016 (Table 1),a decline of 9% from 2015 and53% from 2007 (444,899) (3,7).

U.S. Department of Health and Human Services • Centers for Disease Control and Prevention • National Center for Health Statistics • National Vital Statistics System3
Vital Statistics Surveillance Report
• The provisional birth rates forteenagers aged 15–17 and 18–19were 8.8 and 37.5 births per1,000 women, respectively, downby 11% and 8% from 2015 andrecord lows for both groups.
• The birth rate for females aged10–14 was 0.2 births per1,000 in 2016, which wasunchanged from 2015.
• The provisional birth rate forwomen aged 20–24 was 73.7births per 1,000 women in 2016,a decline of 4% from 2015 (76.8),reaching again another recordlow for this age group (Table 1and Figure 2) (3,6). The numberof births to women in their early20s declined by 6% from 2015(Table 1). The rate for womenaged 25–29 was 101.9 births per1,000 women, down 2% from2015 (104.3) and another recordlow for this age group (3,6). Thenumber of births to women intheir late 20s was down by lessthan 1% (–0.4%) from 2015.
• The provisional birth rate forwomen aged 30–34 in 2016 was102.6 births per 1,000 women, up
1% from 2015 (101.5) to the highest rate for this age group since 1964 (Table 1 and Figure 2) (3,6). The number of births to women in their early 30s also rose in 2016 by 1% from 2015. The rate for women aged 35–39 was 52.6 births per 1,000 women, up 2% from 2015 (51.8) to the highest rate for this age group since 1962 (3,6). The number of births to women in their late 30s increased by 4% from 2015.
• The provisional birth rate forwomen aged 40–44 in 2016 was11.4 births per 1,000 women, up4% from 2015 (11.0) to the highestrate for this age group since 1966(3,6). The number of births tothese women increased by 1%from 2015. The rate for womenaged 45–49 (which includes birthsto women aged 50 and over) was0.9 births per 1,000 women, upfrom 0.8 in 2015, and the highestrate for this age group since 1963.The number of births to womenin this age group was essentiallyunchanged in 2016 (Table 1).
• The 2016 total fertility rate (TFR)for the United States was 1,818.0births per 1,000 women, a decrease
1990 1995 2000 2005 2010 20152016
Figure 2. Birth rates, by selected age of mother: United States, final 1990–2015 and provisional 2016
NOTE: Rates are plotted on a logarithmic scale. SOURCE: NCHS, National Vital Statistics System.
Rat
e pe
r 1,0
00 fe
mal
es
15–1920–24
25–29
30–34
35–39
40–44
1
10
100
1
5
10
50
5
50
100
of 1% from the rate in 2015 (1,843.5) (3) and the lowest TFR since 1984 (3,6). The TFR estimates the number of births that a hypothetical group of 1,000 women would have over their lifetimes, based on the age-specific birth rate in a given year.
• The 2016 TFR was belowreplacement—the level atwhich a given generation canexactly replace itself (2,100births per 1,000 women). Therate has generally been belowreplacement since 1971 (3,6).
Marital status
The provisional birth rate for unmarried women in 2016 was 42.1 births per 1,000 unmarried women aged 15–44 (data not shown), down 3% from 2015 (43.5) and the eighth consecutive year of decline since the all-time peak in 2007 and 2008 (51.8) (3).
• In 2016, the number of births tounmarried women was 1,565,931, a2% decline from 2015 (1,601,527).
• The percentage of all birthsto unmarried women was39.7% in 2016, down 1%from 2015 (Table 3) (3).
• The percentage of births tounmarried women in 2016 rangedfrom 12.0% of non-HispanicAsian women to 69.7% fornon-Hispanic black women.
Maternal and infant health characteristics
Key findings, illustrated in Tables 3–6 and Figures 3 and 4, are listed below:
Prenatal care
In 2016, slightly more than three out of four women (77.2%) began prenatal care in the first trimester. Less than 1 in 10 (6.2%) had late (beginning in the third trimester) or no prenatal care (Tables 3 and 4).
U.S. Department of Health and Human Services • Centers for Disease Control and Prevention • National Center for Health Statistics • National Vital Statistics System4
Vital Statistics Surveillance Report
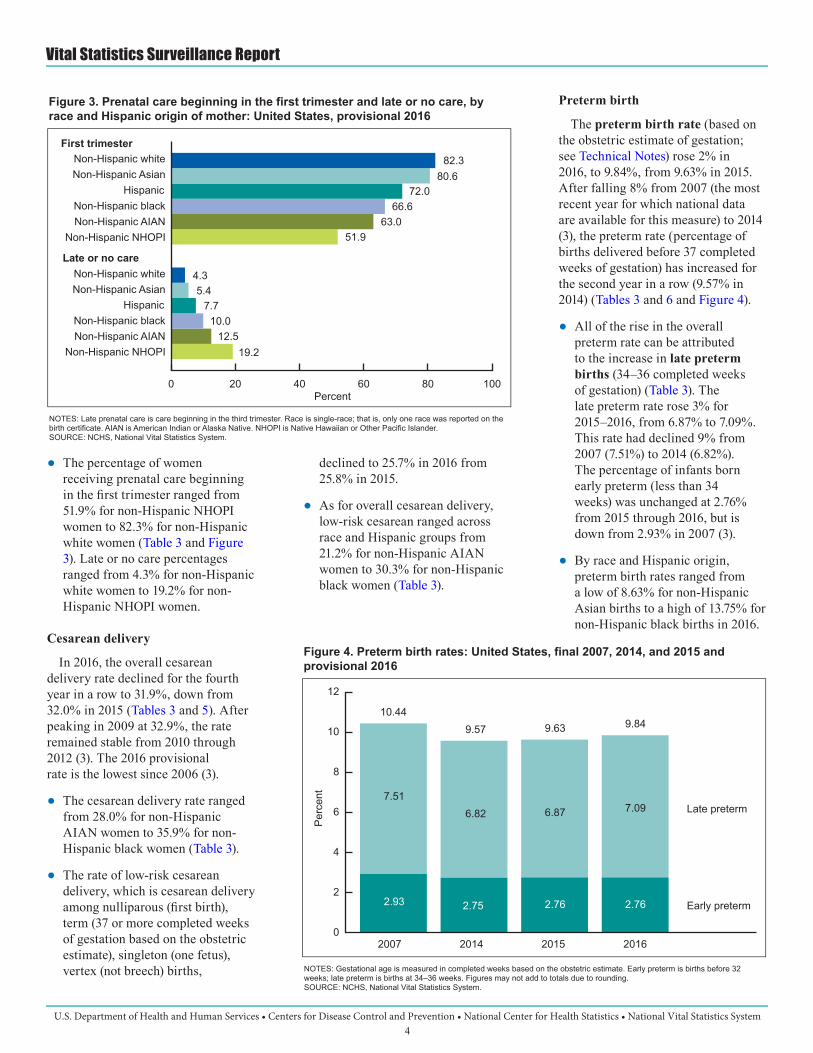
Figure 3. Prenatal care beginning in the first trimester and late or no care, by race and Hispanic origin of mother: United States, provisional 2016
NOTES: Late prenatal care is care beginning in the third trimester. Race is single-race; that is, only one race was reported on the birth certificate. AIAN is American Indian or Alaska Native. NHOPI is Native Hawaiian or Other Pacific Islander.SOURCE: NCHS, National Vital Statistics System.
Percent0 20 40 60 80 100
Non-Hispanic NHOPINon-Hispanic AIANNon-Hispanic black
HispanicNon-Hispanic AsianNon-Hispanic white
Non-Hispanic NHOPINon-Hispanic AIANNon-Hispanic black
HispanicNon-Hispanic AsianNon-Hispanic white
Late or no care
First trimester82.3
80.672.0
66.663.0
51.9
19.212.5
10.07.7
5.44.3
• The percentage of womenreceiving prenatal care beginningin the first trimester ranged from51.9% for non-Hispanic NHOPIwomen to 82.3% for non-Hispanicwhite women (Table 3 and Figure3). Late or no care percentagesranged from 4.3% for non-Hispanicwhite women to 19.2% for non-Hispanic NHOPI women.
Cesarean delivery
In 2016, the overall cesarean delivery rate declined for the fourth year in a row to 31.9%, down from 32.0% in 2015 (Tables 3 and 5). After peaking in 2009 at 32.9%, the rate remained stable from 2010 through 2012 (3). The 2016 provisional rate is the lowest since 2006 (3).
• The cesarean delivery rate rangedfrom 28.0% for non-HispanicAIAN women to 35.9% for non-Hispanic black women (Table 3).
• The rate of low-risk cesareandelivery, which is cesarean deliveryamong nulliparous (first birth),term (37 or more completed weeksof gestation based on the obstetricestimate), singleton (one fetus),vertex (not breech) births,
declined to 25.7% in 2016 from 25.8% in 2015.
• As for overall cesarean delivery,low-risk cesarean ranged acrossrace and Hispanic groups from21.2% for non-Hispanic AIANwomen to 30.3% for non-Hispanicblack women (Table 3).
Preterm birth
The preterm birth rate (based on the obstetric estimate of gestation; see Technical Notes) rose 2% in 2016, to 9.84%, from 9.63% in 2015. After falling 8% from 2007 (the most recent year for which national data are available for this measure) to 2014 (3), the preterm rate (percentage of births delivered before 37 completed weeks of gestation) has increased for the second year in a row (9.57% in 2014) (Tables 3 and 6 and Figure 4).
• All of the rise in the overallpreterm rate can be attributedto the increase in late pretermbirths (34–36 completed weeksof gestation) (Table 3). Thelate preterm rate rose 3% for2015–2016, from 6.87% to 7.09%.This rate had declined 9% from2007 (7.51%) to 2014 (6.82%).The percentage of infants bornearly preterm (less than 34weeks) was unchanged at 2.76%from 2015 through 2016, but isdown from 2.93% in 2007 (3).
• By race and Hispanic origin,preterm birth rates ranged froma low of 8.63% for non-HispanicAsian births to a high of 13.75% fornon-Hispanic black births in 2016.
Figure 4. Preterm birth rates: United States, final 2007, 2014, and 2015 and provisional 2016
NOTES: Gestational age is measured in completed weeks based on the obstetric estimate. Early preterm is births before 32 weeks; late preterm is births at 34–36 weeks. Figures may not add to totals due to rounding.SOURCE: NCHS, National Vital Statistics System.
Perc
ent
0
2
4
6
8
10
12
10.449.57 9.63 9.84
Late preterm
Early preterm
2016201520142007
7.51
2.93 2.75 2.76 2.76
6.82 6.87 7.09

U.S. Department of Health and Human Services • Centers for Disease Control and Prevention • National Center for Health Statistics • National Vital Statistics System5
Vital Statistics Surveillance Report
• Preterm rates rose in 17 states;increases were not statisticallysignificant in 25 states. No statereported a decline in their pretermbirth rate for 2015–2016 (Table 6).
Low birthweight
The low birthweight rate (LBW) also rose for the second straight year in 2016, to 8.16%, from 8.07% in 2015 (Table 3). The LBW rate (the percentage of infants born at less than 2,500 grams or 5 lb., 8 oz.) has increased 2% since 2014, following a downward trend from 2007 through 2014.
• The rate of moderately lowbirthweight births (1,500–2,499grams) rose 1% for 2016 to6.77%, from 6.67% in 2015.The percentage of very lowbirthweight (VLBW) infants(less than 1,500 grams) was notsignificantly changed at 1.39%in 2016 compared with 1.40%in 2015. The VLBW level hasdeclined from a peak of 1.49%for 2005–2007 (Table 3) (3).
• Among the six race and Hispanic- origin groups presented in thisreport, LBW rates ranged froma low of 6.97% (non-Hispanicwhite births) to a high of 13.66%(Hispanic black births).
References1. Rossen LM, Osterman MJK,
Hamilton BE, Martin JA.Quarterly provisional estimatesfor selected birth indicators,2015–Quarter 4, 2016. NationalCenter for Health Statistics.National Vital Statistics System,Vital Statistics Rapid ReleaseProgram. 2017. Available from:https://www.cdc.gov/nchs/products/vsrr/natality.htm.
2. Hamilton BE, Martin JA,Osterman MJK. Births:Preliminary data for 2015.National vital statistics reports;vol 65 no 3. Hyattsville, MD:
National Center for Health Statistics. 2016. Available from: https://www.cdc.gov/nchs/data/nvsr/nvsr65/nvsr65_03.pdf.
3. Martin JA, Hamilton BE,Osterman MJK, et al. Births:Final data for 2015. Nationalvital statistics reports; vol 66no 1. Hyattsville, MD: NationalCenter for Health Statistics.2017. Available from: https://www.cdc.gov/nchs/data/nvsr/nvsr66/nvsr66_01.pdf.
4. Martin JA, Osterman MJK,Kirmeyer SE, Gregory ECW.Measuring gestational age in vitalstatistics data: Transitioning tothe obstetric estimate. Nationalvital statistics reports; vol 64no 5. Hyattsville, MD: NationalCenter for Health Statistics.2015. Available from: https://www.cdc.gov/nchs/data/nvsr/nvsr64/nvsr64_05.pdf.
5. U.S. Office of Managementand Budget. Revisions to thestandards for the classification offederal data on race and ethnicity.Fed Regist 62(210):58782–90.1997. Available from: https://obamawhitehouse.archives.gov/omb/fedreg_1997standards.
6. National Center for HealthStatistics. Vital statisticsof the United States, 2003,Volume I, Natality. 2003.Available from: https://www.cdc.gov/nchs/products/vsus/vsus_1980_2003.htm.
7. Ventura SJ, Hamilton BE,Mathews TJ. National andstate patterns of teen births inthe United States, 1940–2013.National vital statistics reports;vol 63 no 4. Hyattsville, MD:National Center for HealthStatistics. 2014. Available from:https://www.cdc.gov/nchs/data/nvsr/nvsr63/nvsr63_04.pdf.
8. Hamilton BE, Martin JA, VenturaSJ. Births: Preliminary data for2005. National vital statistics
reports; vol 55 no 11. Hyattsville, MD: National Center for Health Statistics. 2007. Available from: https://www.cdc.gov/nchs/data/nvsr/nvsr55/nvsr55_11.pdf.
9. National Center for HealthStatistics. User guide to the 2015natality public use file. 2016.Available from: ftp://ftp.cdc.gov/pub/Health_Statistics/NCHS/Dataset_Documentation/DVS/natality/UserGuide2015.pdf.
10. National Center for HealthStatistics. Quarterly provisionalestimates–Technical Notes–Natality, 2015–Quarter 4, 2016.Available from: https://www.cdc.gov/nchs/products/vsrr/natality-technical-notes.htm.
11. National Center for HealthStatistics. U.S. StandardCertificate of Live Birth.2003. Available from: https://www.cdc.gov/nchs/data/dvs/birth11-03final-ACC.pdf.
12. National Center for HealthStatistics. Report of the Panelto Evaluate the U.S. StandardCertificates. 2000. Availablefrom: https://www.cdc.gov/nchs/data/dvs/panelreport_acc.pdf.
13. Ingram DD, Parker JD, SchenkerN, et al. United States Census2000 population with bridgedrace categories. National Centerfor Health Statistics. Vital HealthStat 2(135). 2003. Availablefrom: https://www.cdc.gov/nchs/data/series/sr_02/sr02_135.pdf.
14. Johnson D. Coding and editingmultiple race. In: 2004 JointMeeting of NAPHSIS andVSCP. Portland, OR. 2004.
15. Weed JA. NCHS proceduresfor multiple-race and Hispanicorigin data: Collection, coding,editing, and transmitting. In:2004 Joint Meeting of NAPHSISand VSCP. Portland, OR.2004. Available from: https://www.cdc.gov/nchs/data/dvs/multiple_race_docu_5-10-04.pdf.
U.S. Department of Health and Human Services • Centers for Disease Control and Prevention • National Center for Health Statistics • National Vital Statistics System6
Vital Statistics Surveillance Report
16. U.S. Office of Managementand Budget. Race and ethnicstandards for federal statisticsand administrative reporting.Statistical Policy Directive 15.1977. Available from: https://wonder.cdc.gov/WONDER/help/populations/bridged-race/Directive15.html.
17. U.S. Census Bureau. PopulationDivision. Annual estimates ofthe resident population by singleyear of age and sex for the UnitedStates: April 1, 2010 to July 1, 2016(NC– EST2016–AGESEX–RES). Available from:https://www2.census.gov/programs-surveys/popest/datasets/2010-2016/national/asrh/nc-est2016-agesex-res.csv.
18. Ventura SJ, Bachrach CA.Nonmarital childbearing inthe United States, 1940–99.National vital statistics reports;vol 48 no 16. Hyattsville, MD:National Center for HealthStatistics. 2000. Available from:https://www.cdc.gov/nchs/data/nvsr/nvsr48/nvs48_16.pdf.
19. U.S. Census Bureau.TheDataWeb: DataFerrett. CurrentPopulation Survey. 2016 MarchAnnual Social and EconomicSupplement. 2017. Available from:http://dataferrett.census.gov/.
List of Detailed Tables
Report tables1. Births and birth rates, by age
of mother: United States,final 2015 and provisional2016 . . . . . . . . . . . . . . . . . . 7
2. Births, by race andHispanic origin of mother:United States, each stateand territory, provisional2016 . . . . . . . . . . . . . . . . . . 8
3. Selected maternal and birthcharacteristics, by race andHispanic origin of mother:United States, final 2015 andprovisional 2016 . . . . . . . . 10
4. Prenatal care beginningin the first trimester andlate or no prenatal care:United States, each stateand territory, provisional2016 . . . . . . . . . . . . . . . . . . 11
5. Births, by total cesareandelivery and low-riskcesarean delivery: UnitedStates, each state andterritory, final 2015 andprovisional 2016 . . . . . . . . 12
6. Preterm and late pretermbirths: United States, eachstate and territory, final 2015and provisional 2016 . . . . . 13

U.S. Department of Health and Human Services • Centers for Disease Control and Prevention • National Center for Health Statistics • National Vital Statistics System7
Vital Statistics Surveillance Report
Table 1. Births and birth rates, by age of mother: United States, final 2015 and provisional 2016
[Data for 2016 are based on a continuous file of records received from the states. Figures for 2016 are based on weighted data rounded to the nearest individual, so categories may not add to totals. Rates are per 1,000 women in specified age group. Rates for all ages are the total number of births (regardless of the age of the mother) per 1,000 women aged 15–44]
2016 2015
Age of mother (years) Number Rate Number Rate
All ages . . . . . . . . . . . . . . . . . . . . . . . . . . . . . . . . . . . . . . . . . . . . . . . 3,941,109 62.0 3,978,497 62.5
10–14 . . . . . . . . . . . . . . . . . . . . . . . . . . . . . . . . . . . . . . . . . . . . . . . . . 2,246 0.2 2,500 0.215–19 . . . . . . . . . . . . . . . . . . . . . . . . . . . . . . . . . . . . . . . . . . . . . . . . . 209,480 20.3 229,715 22.3
15–17 . . . . . . . . . . . . . . . . . . . . . . . . . . . . . . . . . . . . . . . . . . . . . . . 54,636 8.8 61,184 9.918–19 . . . . . . . . . . . . . . . . . . . . . . . . . . . . . . . . . . . . . . . . . . . . . . . 154,844 37.5 168,531 40.7
20–24. . . . . . . . . . . . . . . . . . . . . . . . . . . . . . . . . . . . . . . . . . . . . . . . . 802,763 73.7 850,509 76.825–29. . . . . . . . . . . . . . . . . . . . . . . . . . . . . . . . . . . . . . . . . . . . . . . . . 1,147,879 101.9 1,152,311 104.330–34. . . . . . . . . . . . . . . . . . . . . . . . . . . . . . . . . . . . . . . . . . . . . . . . . 1,109,882 102.6 1,094,693 101.535–39. . . . . . . . . . . . . . . . . . . . . . . . . . . . . . . . . . . . . . . . . . . . . . . . . 546,854 52.6 527,996 51.840–44. . . . . . . . . . . . . . . . . . . . . . . . . . . . . . . . . . . . . . . . . . . . . . . . . 112,982 11.4 111,848 11.045–541 . . . . . . . . . . . . . . . . . . . . . . . . . . . . . . . . . . . . . . . . . . . . . . . . 9,025 0.9 8,925 0.8
1The birth rate for women in this age group is computed by relating the number of births to women aged 45 and over to women aged 45–49 because most of the births in this group are to women aged 45–49.
NOTE: For information on the relative standard errors of the data and further discussion, see Technical Notes.

U.S. Department of Health and Human Services • Centers for Disease Control and Prevention • National Center for Health Statistics • National Vital Statistics System8
Vital Statistics Surveillance Report
Table 2. Births, by race and Hispanic origin of mother: United States, each state and territory, provisional 2016
[By place of residence. Data are based on a continuous file of records received from the states. Figures are based on weighted data rounded to the nearest individual, so categories may not add to totals]
AreaAll races and
origins1
Non-Hispanic, single-race
Hispanic3White2 Black3American Indian or
Alaska Native2 Asian2Native Hawaiian or
Pacific Islander2
Number
United States4 . . . . . . . . . 3,941,109 2,054,564 558,338 31,432 254,636 9,342 915,917
Alabama . . . . . . . . . . . . . 59,146 34,913 17,670 114 990 36 4,579 Alaska . . . . . . . . . . . . . . . 11,202 5,781 319 2,110 691 289 810 Arizona . . . . . . . . . . . . . . 84,519 35,241 4,082 4,512 2,957 215 34,944 Arkansas . . . . . . . . . . . . . 38,171 24,894 7,062 233 804 418 4,061 California . . . . . . . . . . . . . 488,486 132,449 23,963 1,445 73,930 1,856 228,903 Colorado . . . . . . . . . . . . . 66,599 39,598 3,009 412 2,619 145 18,512 Connecticut . . . . . . . . . . . 36,001 19,537 4,455 26 2,585 6 8,619 Delaware . . . . . . . . . . . . . 10,987 5,821 2,833 13 627 3 1,431 District of Columbia . . . . . 9,862 3,071 4,806 8 436 4 1,350 Florida . . . . . . . . . . . . . . . 225,016 99,291 48,967 237 7,188 136 65,897
Georgia . . . . . . . . . . . . . . 129,995 57,932 44,405 125 5,880 102 17,959 Hawaii . . . . . . . . . . . . . . . 18,049 3,643 462 28 4,617 1,748 2,763 Idaho . . . . . . . . . . . . . . . . 22,480 17,540 217 261 363 58 3,615 Illinois . . . . . . . . . . . . . . . . 154,400 82,272 25,615 110 10,019 45 32,639 Indiana . . . . . . . . . . . . . . . 83,046 61,990 9,770 85 2,427 50 7,443 Iowa . . . . . . . . . . . . . . . . . 39,383 31,358 2,464 147 1,271 107 3,473 Kansas . . . . . . . . . . . . . . . 38,045 26,926 2,543 173 1,299 45 6,298 Kentucky . . . . . . . . . . . . . 55,414 45,114 4,904 55 1,182 67 3,138 Louisiana . . . . . . . . . . . . . 63,121 33,002 23,103 321 1,295 31 4,680 Maine . . . . . . . . . . . . . . . . 12,704 11,483 411 97 192 2 238
Maryland . . . . . . . . . . . . . 73,102 31,260 22,825 103 5,282 44 11,864 Massachusetts . . . . . . . . . 71,369 42,103 6,871 80 6,415 14 13,160 Michigan . . . . . . . . . . . . . 113,153 77,530 20,573 418 4,318 33 7,487 Minnesota . . . . . . . . . . . . 69,736 48,526 7,780 1,059 5,367 47 4,871 Mississippi . . . . . . . . . . . . 37,912 19,396 15,877 215 475 18 1,665 Missouri . . . . . . . . . . . . . . 74,645 55,396 10,447 155 1,851 198 4,136 Montana . . . . . . . . . . . . . . 12,278 9,758 57 1,346 131 22 548 Nebraska . . . . . . . . . . . . . 26,576 18,722 1,682 353 895 28 4,278 Nevada . . . . . . . . . . . . . . 36,255 13,899 4,215 303 2,669 308 13,392 New Hampshire . . . . . . . . 12,263 10,638 208 8 504 5 697
New Jersey . . . . . . . . . . . 102,121 45,854 13,796 59 12,044 36 27,879 New Mexico . . . . . . . . . . . 24,660 6,995 354 2,818 426 18 13,627 New York . . . . . . . . . . . . . 234,194 112,136 34,513 382 26,874 62 52,991 North Carolina . . . . . . . . . 120,749 65,727 27,416 1,464 4,942 114 18,359 North Dakota . . . . . . . . . . 11,381 8,485 612 875 303 14 584 Ohio . . . . . . . . . . . . . . . . . 138,074 100,209 22,338 128 4,312 55 7,420 Oklahoma . . . . . . . . . . . . 52,571 30,484 4,393 4,940 1,377 208 7,544 Oregon . . . . . . . . . . . . . . . 45,484 31,015 943 426 2,356 315 8,460 Pennsylvania . . . . . . . . . . 139,333 94,458 18,297 86 6,472 49 15,366 Rhode Island . . . . . . . . . . 10,792 6,336 783 62 568 1 2,680
South Carolina . . . . . . . . . 57,334 32,924 16,528 151 1,134 52 5,133 South Dakota . . . . . . . . . . 12,273 8,835 363 1,787 269 7 634 Tennessee . . . . . . . . . . . . 80,629 53,769 15,838 76 1,866 85 7,618 Texas . . . . . . . . . . . . . . . . 396,717 133,904 48,339 779 20,897 496 187,651 Utah . . . . . . . . . . . . . . . . . 50,464 37,791 521 467 1,186 402 7,966 Vermont . . . . . . . . . . . . . . 5,754 5,207 70 11 154 1 135 Virginia . . . . . . . . . . . . . . . 101,136 56,860 20,555 151 7,805 129 14,033 Washington . . . . . . . . . . . 90,492 53,306 3,862 1,309 8,881 1,183 16,530 West Virginia . . . . . . . . . . 19,042 17,443 587 17 170 2 378 Wisconsin . . . . . . . . . . . . 66,608 47,984 6,570 689 3,220 25 6,506
See footnotes at end of table.

U.S. Department of Health and Human Services • Centers for Disease Control and Prevention • National Center for Health Statistics • National Vital Statistics System9
Vital Statistics Surveillance Report
Table 2. Births, by race and Hispanic origin of mother: United States, each state and territory, provisional 2016
[By place of residence. Data are based on a continuous file of records received from the states. Figures are based on weighted data rounded to the nearest individual, so categories may not add to totals]
AreaAll races and
origins1
Non-Hispanic, single-race
Hispanic3White2 Black3American Indian or
Alaska Native2 Asian2Native Hawaiian or
Pacific Islander2
Wyoming . . . . . . . . . . . . . 7,382 5,759 63 200 100 6 973
Puerto Rico . . . . . . . . . . . 28,233 680 71 3 35 – 27,382Virgin Islands . . . . . . . . . . --- --- --- --- --- --- --- Guam . . . . . . . . . . . . . . . . 3,423 187 31 5 785 2,235 29 American Samoa . . . . . . . * * * * * * * Northern Marianas . . . . . 364 3 – – 56 286 –
– Quantity zero.--- Data not available.* Figure does not meet standards of reliability or precision; less than 85% of data for the area were available as of release of the provisional file; see Technical Notes.1Includes births to race and origin groups not shown separately, such as Hispanic white, Hispanic black, and non-Hispanic multiple-race women, and births with origin not stated.2Race and Hispanic origin are reported separately on birth certificates. Persons of Hispanic origin may be of any race. Race categories are consistent with the 1997 Office of Management and Budget standards; see Technical Notes. Race is single race; that is, only one race was reported on the birth certificate.3Includes all persons of Hispanic origin of any race; see Technical Notes.4Excludes data for the territories.
NOTE: For information on the relative standard errors of the data and further discussion, see Technical Notes.
—Con.

U.S. Department of Health and Human Services • Centers for Disease Control and Prevention • National Center for Health Statistics • National Vital Statistics System10
Vital Statistics Surveillance Report
Table 3. Selected maternal and birth characteristics, by race and Hispanic origin of mother: United States, final 2015 and provisional 2016
[Data for 2016 are based on a continuous file of records received from the states. Figures for 2016 are based on weighted data rounded to the nearest individual]
CharacteristicAll races and
origins1
Non-Hispanic, single-race
Hispanic3White2 Black2American Indian or
Alaska Native2 Asian2Native Hawaiian or
Pacific Islander2
Percent
Unmarried
2016 . . . . . . . . . . . . . . . . . . . . 39.7 28.4 69.7 68.1 12.0 47.7 52.52015 . . . . . . . . . . . . . . . . . . . . 40.3 --- --- --- --- --- 53.0
Prenatal care
First trimester care:2016 . . . . . . . . . . . . . . . . . . 77.2 82.3 66.6 63.0 80.6 51.9 72.02015 . . . . . . . . . . . . . . . . . . --- --- --- --- --- --- ---
Late4 or no care:2016 . . . . . . . . . . . . . . . . . . 6.2 4.3 10.0 12.5 5.4 19.2 7.72015 . . . . . . . . . . . . . . . . . . --- --- --- --- --- --- ---
Cesarean delivery
Total5:2016 . . . . . . . . . . . . . . . . . . 31.9 30.9 35.9 28.0 33.3 30.4 31.72015 . . . . . . . . . . . . . . . . . . 32.0 --- --- --- --- --- 31.7
Low risk6:2016 . . . . . . . . . . . . . . . . . . 25.7 24.7 30.3 21.2 27.5 26.6 25.12015 . . . . . . . . . . . . . . . . . . 25.8 --- --- --- --- --- 25.2
Gestational age7
Under 37 weeks:2016 . . . . . . . . . . . . . . . . . . 9.84 9.04 13.75 11.38 8.63 11.51 9.442015 . . . . . . . . . . . . . . . . . . 9.63 --- --- --- --- --- 9.14
34–36 weeks:2016 . . . . . . . . . . . . . . . . . . 7.09 6.72 8.84 8.41 6.5 8.4 6.922015 . . . . . . . . . . . . . . . . . . 6.87 --- --- --- --- --- 6.62
32–33 weeks:2016 . . . . . . . . . . . . . . . . . . 1.17 1.07 1.75 1.22 0.94 1.32 1.082015 . . . . . . . . . . . . . . . . . . 1.17 --- --- --- --- --- 1.08
Under 32 weeks:2016 . . . . . . . . . . . . . . . . . . 1.59 1.26 3.16 1.74 1.19 1.79 1.452015 . . . . . . . . . . . . . . . . . . 1.59 --- --- --- --- --- 1.44
Birthweight
Low birthweight8:2016 . . . . . . . . . . . . . . . . . . 8.16 6.97 13.66 7.77 8.43 7.65 7.312015 . . . . . . . . . . . . . . . . . . 8.07 --- --- --- --- --- 7.21
Very low birthweight9:2016 . . . . . . . . . . . . . . . . . . 1.39 1.07 2.94 1.38 1.09 1.44 1.232015 . . . . . . . . . . . . . . . . . . 1.40 --- --- --- --- --- 1.23
--- Comparable data on prenatal care and single race were not available for the 50 states and the District of Columbia in 2015, as not all states had adopted the 2003 U.S. Certificate of Live Birth.1Includes births to race and origin groups not shown separately, such as Hispanic white, Hispanic black, and non-Hispanic multiple-race women, and births with origin not stated.2Race and Hispanic origin are reported separately on birth certificates. Persons of Hispanic origin may be of any race. Race categories are consistent with the 1997 Office of Management and Budget standards; see Technical Notes. Race is single race; that is, only one race was reported on the birth certificate.3Includes all persons of Hispanic origin of any race; see Technical Notes.4Care beginning in the third trimester.5All births by cesarean delivery per 100 live births.6Low-risk cesarean is defined as singleton, term (37 or more weeks of gestation based on obstetric estimate; see Technical Notes), vertex (not breech) cesarean deliveries to women having a first birth per 100 women delivering singleton, term, vertex first births.7Completed weeks of gestation based on the obstetric estimate; see Technical Notes.8Birthweight of less than 2,500 grams (5 lb. 8 oz.).9Birthweight of less than 1,500 grams (3 lb. 4 oz.).
NOTE: For information on the relative standard errors of the data and further discussion, see Technical Notes.
U.S. Department of Health and Human Services • Centers for Disease Control and Prevention • National Center for Health Statistics • National Vital Statistics System11
Vital Statistics Surveillance Report
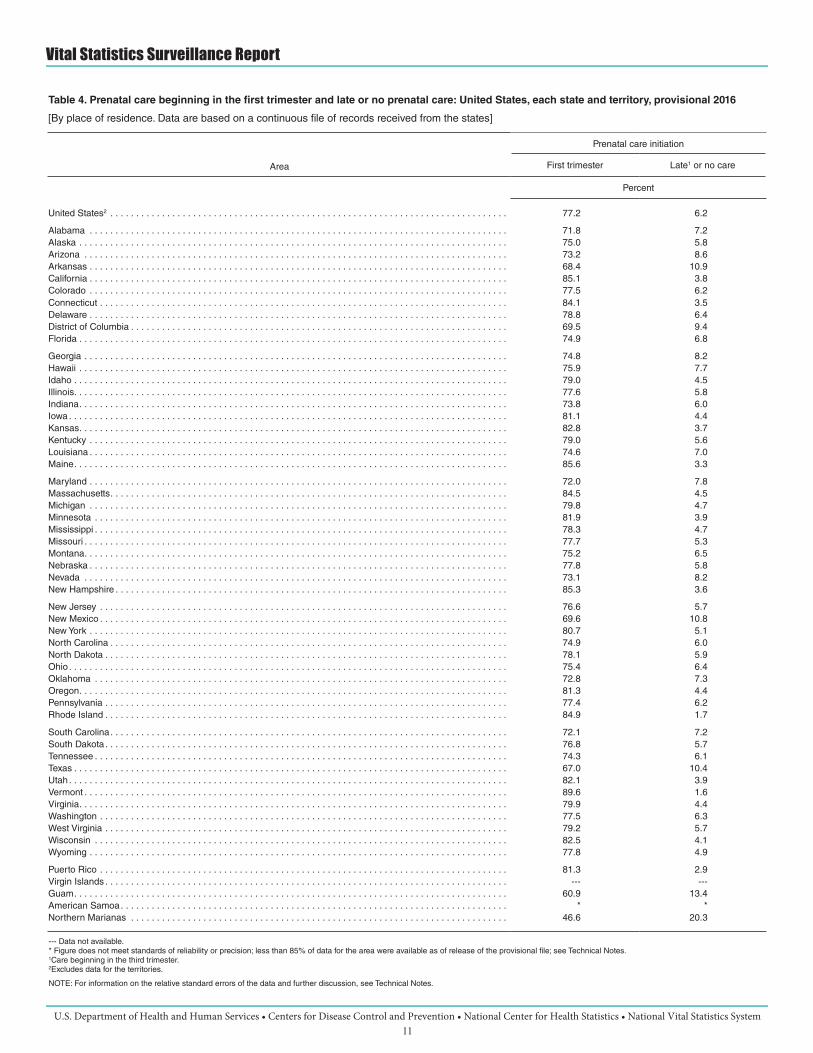
Table 4. Prenatal care beginning in the first trimester and late or no prenatal care: United States, each state and territory, provisional 2016
[By place of residence. Data are based on a continuous file of records received from the states]
Area
Prenatal care initiation
First trimester Late1 or no care
Percent
United States2 . . . . . . . . . . . . . . . . . . . . . . . . . . . . . . . . . . . . . . . . . . . . . . . . . . . . . . . . . . . . . . . . . . . . . . . . . . . . . 77.2 6.2
Alabama . . . . . . . . . . . . . . . . . . . . . . . . . . . . . . . . . . . . . . . . . . . . . . . . . . . . . . . . . . . . . . . . . . . . . . . . . . . . . . . . . 71.8 7.2Alaska . . . . . . . . . . . . . . . . . . . . . . . . . . . . . . . . . . . . . . . . . . . . . . . . . . . . . . . . . . . . . . . . . . . . . . . . . . . . . . . . . . . 75.0 5.8Arizona . . . . . . . . . . . . . . . . . . . . . . . . . . . . . . . . . . . . . . . . . . . . . . . . . . . . . . . . . . . . . . . . . . . . . . . . . . . . . . . . . . 73.2 8.6Arkansas . . . . . . . . . . . . . . . . . . . . . . . . . . . . . . . . . . . . . . . . . . . . . . . . . . . . . . . . . . . . . . . . . . . . . . . . . . . . . . . . . 68.4 10.9California . . . . . . . . . . . . . . . . . . . . . . . . . . . . . . . . . . . . . . . . . . . . . . . . . . . . . . . . . . . . . . . . . . . . . . . . . . . . . . . . . 85.1 3.8Colorado . . . . . . . . . . . . . . . . . . . . . . . . . . . . . . . . . . . . . . . . . . . . . . . . . . . . . . . . . . . . . . . . . . . . . . . . . . . . . . . . . 77.5 6.2Connecticut . . . . . . . . . . . . . . . . . . . . . . . . . . . . . . . . . . . . . . . . . . . . . . . . . . . . . . . . . . . . . . . . . . . . . . . . . . . . . . . 84.1 3.5Delaware . . . . . . . . . . . . . . . . . . . . . . . . . . . . . . . . . . . . . . . . . . . . . . . . . . . . . . . . . . . . . . . . . . . . . . . . . . . . . . . . . 78.8 6.4District of Columbia . . . . . . . . . . . . . . . . . . . . . . . . . . . . . . . . . . . . . . . . . . . . . . . . . . . . . . . . . . . . . . . . . . . . . . . . . 69.5 9.4Florida . . . . . . . . . . . . . . . . . . . . . . . . . . . . . . . . . . . . . . . . . . . . . . . . . . . . . . . . . . . . . . . . . . . . . . . . . . . . . . . . . . . 74.9 6.8
Georgia . . . . . . . . . . . . . . . . . . . . . . . . . . . . . . . . . . . . . . . . . . . . . . . . . . . . . . . . . . . . . . . . . . . . . . . . . . . . . . . . . . 74.8 8.2Hawaii . . . . . . . . . . . . . . . . . . . . . . . . . . . . . . . . . . . . . . . . . . . . . . . . . . . . . . . . . . . . . . . . . . . . . . . . . . . . . . . . . . . 75.9 7.7Idaho . . . . . . . . . . . . . . . . . . . . . . . . . . . . . . . . . . . . . . . . . . . . . . . . . . . . . . . . . . . . . . . . . . . . . . . . . . . . . . . . . . . . 79.0 4.5Illinois . . . . . . . . . . . . . . . . . . . . . . . . . . . . . . . . . . . . . . . . . . . . . . . . . . . . . . . . . . . . . . . . . . . . . . . . . . . . . . . . . . . . 77.6 5.8Indiana . . . . . . . . . . . . . . . . . . . . . . . . . . . . . . . . . . . . . . . . . . . . . . . . . . . . . . . . . . . . . . . . . . . . . . . . . . . . . . . . . . . 73.8 6.0Iowa . . . . . . . . . . . . . . . . . . . . . . . . . . . . . . . . . . . . . . . . . . . . . . . . . . . . . . . . . . . . . . . . . . . . . . . . . . . . . . . . . . . . . 81.1 4.4Kansas . . . . . . . . . . . . . . . . . . . . . . . . . . . . . . . . . . . . . . . . . . . . . . . . . . . . . . . . . . . . . . . . . . . . . . . . . . . . . . . . . . . 82.8 3.7Kentucky . . . . . . . . . . . . . . . . . . . . . . . . . . . . . . . . . . . . . . . . . . . . . . . . . . . . . . . . . . . . . . . . . . . . . . . . . . . . . . . . . 79.0 5.6Louisiana . . . . . . . . . . . . . . . . . . . . . . . . . . . . . . . . . . . . . . . . . . . . . . . . . . . . . . . . . . . . . . . . . . . . . . . . . . . . . . . . . 74.6 7.0Maine . . . . . . . . . . . . . . . . . . . . . . . . . . . . . . . . . . . . . . . . . . . . . . . . . . . . . . . . . . . . . . . . . . . . . . . . . . . . . . . . . . . . 85.6 3.3
Maryland . . . . . . . . . . . . . . . . . . . . . . . . . . . . . . . . . . . . . . . . . . . . . . . . . . . . . . . . . . . . . . . . . . . . . . . . . . . . . . . . . 72.0 7.8Massachusetts . . . . . . . . . . . . . . . . . . . . . . . . . . . . . . . . . . . . . . . . . . . . . . . . . . . . . . . . . . . . . . . . . . . . . . . . . . . . . 84.5 4.5Michigan . . . . . . . . . . . . . . . . . . . . . . . . . . . . . . . . . . . . . . . . . . . . . . . . . . . . . . . . . . . . . . . . . . . . . . . . . . . . . . . . . 79.8 4.7Minnesota . . . . . . . . . . . . . . . . . . . . . . . . . . . . . . . . . . . . . . . . . . . . . . . . . . . . . . . . . . . . . . . . . . . . . . . . . . . . . . . . 81.9 3.9Mississippi . . . . . . . . . . . . . . . . . . . . . . . . . . . . . . . . . . . . . . . . . . . . . . . . . . . . . . . . . . . . . . . . . . . . . . . . . . . . . . . . 78.3 4.7Missouri . . . . . . . . . . . . . . . . . . . . . . . . . . . . . . . . . . . . . . . . . . . . . . . . . . . . . . . . . . . . . . . . . . . . . . . . . . . . . . . . . . 77.7 5.3Montana . . . . . . . . . . . . . . . . . . . . . . . . . . . . . . . . . . . . . . . . . . . . . . . . . . . . . . . . . . . . . . . . . . . . . . . . . . . . . . . . . . 75.2 6.5Nebraska . . . . . . . . . . . . . . . . . . . . . . . . . . . . . . . . . . . . . . . . . . . . . . . . . . . . . . . . . . . . . . . . . . . . . . . . . . . . . . . . . 77.8 5.8Nevada . . . . . . . . . . . . . . . . . . . . . . . . . . . . . . . . . . . . . . . . . . . . . . . . . . . . . . . . . . . . . . . . . . . . . . . . . . . . . . . . . . 73.1 8.2New Hampshire . . . . . . . . . . . . . . . . . . . . . . . . . . . . . . . . . . . . . . . . . . . . . . . . . . . . . . . . . . . . . . . . . . . . . . . . . . . . 85.3 3.6
New Jersey . . . . . . . . . . . . . . . . . . . . . . . . . . . . . . . . . . . . . . . . . . . . . . . . . . . . . . . . . . . . . . . . . . . . . . . . . . . . . . . 76.6 5.7New Mexico . . . . . . . . . . . . . . . . . . . . . . . . . . . . . . . . . . . . . . . . . . . . . . . . . . . . . . . . . . . . . . . . . . . . . . . . . . . . . . . 69.6 10.8New York . . . . . . . . . . . . . . . . . . . . . . . . . . . . . . . . . . . . . . . . . . . . . . . . . . . . . . . . . . . . . . . . . . . . . . . . . . . . . . . . . 80.7 5.1North Carolina . . . . . . . . . . . . . . . . . . . . . . . . . . . . . . . . . . . . . . . . . . . . . . . . . . . . . . . . . . . . . . . . . . . . . . . . . . . . . 74.9 6.0North Dakota . . . . . . . . . . . . . . . . . . . . . . . . . . . . . . . . . . . . . . . . . . . . . . . . . . . . . . . . . . . . . . . . . . . . . . . . . . . . . . 78.1 5.9Ohio . . . . . . . . . . . . . . . . . . . . . . . . . . . . . . . . . . . . . . . . . . . . . . . . . . . . . . . . . . . . . . . . . . . . . . . . . . . . . . . . . . . . . 75.4 6.4Oklahoma . . . . . . . . . . . . . . . . . . . . . . . . . . . . . . . . . . . . . . . . . . . . . . . . . . . . . . . . . . . . . . . . . . . . . . . . . . . . . . . . 72.8 7.3Oregon . . . . . . . . . . . . . . . . . . . . . . . . . . . . . . . . . . . . . . . . . . . . . . . . . . . . . . . . . . . . . . . . . . . . . . . . . . . . . . . . . . . 81.3 4.4Pennsylvania . . . . . . . . . . . . . . . . . . . . . . . . . . . . . . . . . . . . . . . . . . . . . . . . . . . . . . . . . . . . . . . . . . . . . . . . . . . . . . 77.4 6.2Rhode Island . . . . . . . . . . . . . . . . . . . . . . . . . . . . . . . . . . . . . . . . . . . . . . . . . . . . . . . . . . . . . . . . . . . . . . . . . . . . . . 84.9 1.7
South Carolina . . . . . . . . . . . . . . . . . . . . . . . . . . . . . . . . . . . . . . . . . . . . . . . . . . . . . . . . . . . . . . . . . . . . . . . . . . . . . 72.1 7.2South Dakota . . . . . . . . . . . . . . . . . . . . . . . . . . . . . . . . . . . . . . . . . . . . . . . . . . . . . . . . . . . . . . . . . . . . . . . . . . . . . . 76.8 5.7Tennessee . . . . . . . . . . . . . . . . . . . . . . . . . . . . . . . . . . . . . . . . . . . . . . . . . . . . . . . . . . . . . . . . . . . . . . . . . . . . . . . . 74.3 6.1Texas . . . . . . . . . . . . . . . . . . . . . . . . . . . . . . . . . . . . . . . . . . . . . . . . . . . . . . . . . . . . . . . . . . . . . . . . . . . . . . . . . . . . 67.0 10.4Utah . . . . . . . . . . . . . . . . . . . . . . . . . . . . . . . . . . . . . . . . . . . . . . . . . . . . . . . . . . . . . . . . . . . . . . . . . . . . . . . . . . . . . 82.1 3.9Vermont . . . . . . . . . . . . . . . . . . . . . . . . . . . . . . . . . . . . . . . . . . . . . . . . . . . . . . . . . . . . . . . . . . . . . . . . . . . . . . . . . . 89.6 1.6Virginia . . . . . . . . . . . . . . . . . . . . . . . . . . . . . . . . . . . . . . . . . . . . . . . . . . . . . . . . . . . . . . . . . . . . . . . . . . . . . . . . . . . 79.9 4.4Washington . . . . . . . . . . . . . . . . . . . . . . . . . . . . . . . . . . . . . . . . . . . . . . . . . . . . . . . . . . . . . . . . . . . . . . . . . . . . . . . 77.5 6.3West Virginia . . . . . . . . . . . . . . . . . . . . . . . . . . . . . . . . . . . . . . . . . . . . . . . . . . . . . . . . . . . . . . . . . . . . . . . . . . . . . . 79.2 5.7Wisconsin . . . . . . . . . . . . . . . . . . . . . . . . . . . . . . . . . . . . . . . . . . . . . . . . . . . . . . . . . . . . . . . . . . . . . . . . . . . . . . . . 82.5 4.1Wyoming . . . . . . . . . . . . . . . . . . . . . . . . . . . . . . . . . . . . . . . . . . . . . . . . . . . . . . . . . . . . . . . . . . . . . . . . . . . . . . . . . 77.8 4.9
Puerto Rico . . . . . . . . . . . . . . . . . . . . . . . . . . . . . . . . . . . . . . . . . . . . . . . . . . . . . . . . . . . . . . . . . . . . . . . . . . . . . . . 81.3 2.9Virgin Islands . . . . . . . . . . . . . . . . . . . . . . . . . . . . . . . . . . . . . . . . . . . . . . . . . . . . . . . . . . . . . . . . . . . . . . . . . . . . . . --- ---Guam . . . . . . . . . . . . . . . . . . . . . . . . . . . . . . . . . . . . . . . . . . . . . . . . . . . . . . . . . . . . . . . . . . . . . . . . . . . . . . . . . . . . 60.9 13.4American Samoa . . . . . . . . . . . . . . . . . . . . . . . . . . . . . . . . . . . . . . . . . . . . . . . . . . . . . . . . . . . . . . . . . . . . . . . . . . . * *Northern Marianas . . . . . . . . . . . . . . . . . . . . . . . . . . . . . . . . . . . . . . . . . . . . . . . . . . . . . . . . . . . . . . . . . . . . . . . . . 46.6 20.3
--- Data not available.* Figure does not meet standards of reliability or precision; less than 85% of data for the area were available as of release of the provisional file; see Technical Notes.1Care beginning in the third trimester.2Excludes data for the territories.
NOTE: For information on the relative standard errors of the data and further discussion, see Technical Notes.

U.S. Department of Health and Human Services • Centers for Disease Control and Prevention • National Center for Health Statistics • National Vital Statistics System12
Vital Statistics Surveillance Report
Table 5. Births, by total cesarean delivery and low-risk cesarean delivery: United States, each state and territory, final 2015 and provisional 2016
[By place of residence. Data are based on a continuous file of records received from the states]
Area
Total cesarean Low-risk cesarean1
2016 2015 2016 2015
Percent
United States2 . . . . . . . . . . . . . . . . . . . . . . . . . . . . . . . . . . . . . . . . . . . . . . . . . . . . . . . . . . . . . . . . . 31.9 32.0 25.7 25.8
Alabama . . . . . . . . . . . . . . . . . . . . . . . . . . . . . . . . . . . . . . . . . . . . . . . . . . . . . . . . . . . . . . . . . . . . . 34.4 35.2 27.9 28.5Alaska . . . . . . . . . . . . . . . . . . . . . . . . . . . . . . . . . . . . . . . . . . . . . . . . . . . . . . . . . . . . . . . . . . . . . . . 23.0 22.9 19.1 20.2Arizona . . . . . . . . . . . . . . . . . . . . . . . . . . . . . . . . . . . . . . . . . . . . . . . . . . . . . . . . . . . . . . . . . . . . . . 27.5 27.6 21.7 22.5Arkansas . . . . . . . . . . . . . . . . . . . . . . . . . . . . . . . . . . . . . . . . . . . . . . . . . . . . . . . . . . . . . . . . . . . . . 32.3 32.3 25.0 24.8California . . . . . . . . . . . . . . . . . . . . . . . . . . . . . . . . . . . . . . . . . . . . . . . . . . . . . . . . . . . . . . . . . . . . . 31.9 32.3 24.9 25.3Colorado . . . . . . . . . . . . . . . . . . . . . . . . . . . . . . . . . . . . . . . . . . . . . . . . . . . . . . . . . . . . . . . . . . . . . 26.2 25.9 20.4 20.6Connecticut . . . . . . . . . . . . . . . . . . . . . . . . . . . . . . . . . . . . . . . . . . . . . . . . . . . . . . . . . . . . . . . . . . . 35.4 34.0 29.2 28.3Delaware . . . . . . . . . . . . . . . . . . . . . . . . . . . . . . . . . . . . . . . . . . . . . . . . . . . . . . . . . . . . . . . . . . . . . 31.8 31.9 23.7 25.3District of Columbia . . . . . . . . . . . . . . . . . . . . . . . . . . . . . . . . . . . . . . . . . . . . . . . . . . . . . . . . . . . . . 31.6 31.9 27.1 27.1Florida . . . . . . . . . . . . . . . . . . . . . . . . . . . . . . . . . . . . . . . . . . . . . . . . . . . . . . . . . . . . . . . . . . . . . . . 37.4 37.3 31.3 31.0
Georgia . . . . . . . . . . . . . . . . . . . . . . . . . . . . . . . . . . . . . . . . . . . . . . . . . . . . . . . . . . . . . . . . . . . . . . 33.8 33.6 28.2 27.7Hawaii . . . . . . . . . . . . . . . . . . . . . . . . . . . . . . . . . . . . . . . . . . . . . . . . . . . . . . . . . . . . . . . . . . . . . . . 25.2 25.9 19.8 20.3Idaho . . . . . . . . . . . . . . . . . . . . . . . . . . . . . . . . . . . . . . . . . . . . . . . . . . . . . . . . . . . . . . . . . . . . . . . . 23.9 24.4 18.1 19.5Illinois . . . . . . . . . . . . . . . . . . . . . . . . . . . . . . . . . . . . . . . . . . . . . . . . . . . . . . . . . . . . . . . . . . . . . . . . 31.1 31.0 24.7 24.2Indiana . . . . . . . . . . . . . . . . . . . . . . . . . . . . . . . . . . . . . . . . . . . . . . . . . . . . . . . . . . . . . . . . . . . . . . . 29.8 29.6 23.6 22.9Iowa . . . . . . . . . . . . . . . . . . . . . . . . . . . . . . . . . . . . . . . . . . . . . . . . . . . . . . . . . . . . . . . . . . . . . . . . . 30.1 29.8 23.9 23.8Kansas . . . . . . . . . . . . . . . . . . . . . . . . . . . . . . . . . . . . . . . . . . . . . . . . . . . . . . . . . . . . . . . . . . . . . . . 29.5 29.6 23.8 23.8Kentucky . . . . . . . . . . . . . . . . . . . . . . . . . . . . . . . . . . . . . . . . . . . . . . . . . . . . . . . . . . . . . . . . . . . . . 34.6 34.4 27.2 27.4Louisiana . . . . . . . . . . . . . . . . . . . . . . . . . . . . . . . . . . . . . . . . . . . . . . . . . . . . . . . . . . . . . . . . . . . . . 37.5 37.5 30.9 30.8Maine . . . . . . . . . . . . . . . . . . . . . . . . . . . . . . . . . . . . . . . . . . . . . . . . . . . . . . . . . . . . . . . . . . . . . . . . 28.9 29.4 22.4 22.9
Maryland . . . . . . . . . . . . . . . . . . . . . . . . . . . . . . . . . . . . . . . . . . . . . . . . . . . . . . . . . . . . . . . . . . . . . 33.7 34.9 28.5 29.9Massachusetts . . . . . . . . . . . . . . . . . . . . . . . . . . . . . . . . . . . . . . . . . . . . . . . . . . . . . . . . . . . . . . . . . 31.3 31.4 24.2 24.0Michigan . . . . . . . . . . . . . . . . . . . . . . . . . . . . . . . . . . . . . . . . . . . . . . . . . . . . . . . . . . . . . . . . . . . . . 32.0 31.9 26.7 26.3Minnesota . . . . . . . . . . . . . . . . . . . . . . . . . . . . . . . . . . . . . . . . . . . . . . . . . . . . . . . . . . . . . . . . . . . . 26.8 26.5 21.8 21.6Mississippi . . . . . . . . . . . . . . . . . . . . . . . . . . . . . . . . . . . . . . . . . . . . . . . . . . . . . . . . . . . . . . . . . . . . 38.2 38.0 31.8 31.2Missouri . . . . . . . . . . . . . . . . . . . . . . . . . . . . . . . . . . . . . . . . . . . . . . . . . . . . . . . . . . . . . . . . . . . . . . 30.2 30.3 24.1 23.6Montana . . . . . . . . . . . . . . . . . . . . . . . . . . . . . . . . . . . . . . . . . . . . . . . . . . . . . . . . . . . . . . . . . . . . . . 29.1 29.7 23.1 23.7Nebraska . . . . . . . . . . . . . . . . . . . . . . . . . . . . . . . . . . . . . . . . . . . . . . . . . . . . . . . . . . . . . . . . . . . . . 31.0 31.1 23.8 24.4Nevada . . . . . . . . . . . . . . . . . . . . . . . . . . . . . . . . . . . . . . . . . . . . . . . . . . . . . . . . . . . . . . . . . . . . . . 33.8 34.6 28.8 29.7New Hampshire . . . . . . . . . . . . . . . . . . . . . . . . . . . . . . . . . . . . . . . . . . . . . . . . . . . . . . . . . . . . . . . . 30.9 30.8 26.0 24.6
New Jersey . . . . . . . . . . . . . . . . . . . . . . . . . . . . . . . . . . . . . . . . . . . . . . . . . . . . . . . . . . . . . . . . . . . 36.2 36.8 30.3 30.9New Mexico . . . . . . . . . . . . . . . . . . . . . . . . . . . . . . . . . . . . . . . . . . . . . . . . . . . . . . . . . . . . . . . . . . . 24.8 24.3 18.5 18.0New York . . . . . . . . . . . . . . . . . . . . . . . . . . . . . . . . . . . . . . . . . . . . . . . . . . . . . . . . . . . . . . . . . . . . . 33.8 33.8 28.4 28.5North Carolina . . . . . . . . . . . . . . . . . . . . . . . . . . . . . . . . . . . . . . . . . . . . . . . . . . . . . . . . . . . . . . . . . 29.4 29.3 23.0 22.7North Dakota . . . . . . . . . . . . . . . . . . . . . . . . . . . . . . . . . . . . . . . . . . . . . . . . . . . . . . . . . . . . . . . . . . 26.8 27.5 18.9 20.6Ohio . . . . . . . . . . . . . . . . . . . . . . . . . . . . . . . . . . . . . . . . . . . . . . . . . . . . . . . . . . . . . . . . . . . . . . . . . 30.8 30.4 24.7 24.2Oklahoma . . . . . . . . . . . . . . . . . . . . . . . . . . . . . . . . . . . . . . . . . . . . . . . . . . . . . . . . . . . . . . . . . . . . 32.0 32.4 23.3 24.4Oregon . . . . . . . . . . . . . . . . . . . . . . . . . . . . . . . . . . . . . . . . . . . . . . . . . . . . . . . . . . . . . . . . . . . . . . . 27.2 27.1 22.1 21.7Pennsylvania . . . . . . . . . . . . . . . . . . . . . . . . . . . . . . . . . . . . . . . . . . . . . . . . . . . . . . . . . . . . . . . . . . 29.9 30.1 24.7 24.7Rhode Island . . . . . . . . . . . . . . . . . . . . . . . . . . . . . . . . . . . . . . . . . . . . . . . . . . . . . . . . . . . . . . . . . . 31.3 30.6 24.9 23.5
South Carolina . . . . . . . . . . . . . . . . . . . . . . . . . . . . . . . . . . . . . . . . . . . . . . . . . . . . . . . . . . . . . . . . . 33.5 33.7 26.0 26.9South Dakota . . . . . . . . . . . . . . . . . . . . . . . . . . . . . . . . . . . . . . . . . . . . . . . . . . . . . . . . . . . . . . . . . . 25.3 25.7 20.7 18.5Tennessee . . . . . . . . . . . . . . . . . . . . . . . . . . . . . . . . . . . . . . . . . . . . . . . . . . . . . . . . . . . . . . . . . . . . 32.6 33.2 26.5 27.6Texas . . . . . . . . . . . . . . . . . . . . . . . . . . . . . . . . . . . . . . . . . . . . . . . . . . . . . . . . . . . . . . . . . . . . . . . . 34.5 34.4 27.1 27.0Utah . . . . . . . . . . . . . . . . . . . . . . . . . . . . . . . . . . . . . . . . . . . . . . . . . . . . . . . . . . . . . . . . . . . . . . . . . 22.3 22.8 16.8 18.0Vermont . . . . . . . . . . . . . . . . . . . . . . . . . . . . . . . . . . . . . . . . . . . . . . . . . . . . . . . . . . . . . . . . . . . . . . 25.7 25.5 21.7 20.2Virginia . . . . . . . . . . . . . . . . . . . . . . . . . . . . . . . . . . . . . . . . . . . . . . . . . . . . . . . . . . . . . . . . . . . . . . . 33.0 32.9 27.0 25.1Washington . . . . . . . . . . . . . . . . . . . . . . . . . . . . . . . . . . . . . . . . . . . . . . . . . . . . . . . . . . . . . . . . . . . 27.4 27.5 22.5 22.8West Virginia . . . . . . . . . . . . . . . . . . . . . . . . . . . . . . . . . . . . . . . . . . . . . . . . . . . . . . . . . . . . . . . . . . 34.9 34.9 27.0 27.2Wisconsin . . . . . . . . . . . . . . . . . . . . . . . . . . . . . . . . . . . . . . . . . . . . . . . . . . . . . . . . . . . . . . . . . . . . 26.0 26.2 22.0 21.3Wyoming . . . . . . . . . . . . . . . . . . . . . . . . . . . . . . . . . . . . . . . . . . . . . . . . . . . . . . . . . . . . . . . . . . . . . 27.4 27.3 19.1 17.8
Puerto Rico . . . . . . . . . . . . . . . . . . . . . . . . . . . . . . . . . . . . . . . . . . . . . . . . . . . . . . . . . . . . . . . . . . . 46.2 46.7 40.6 41.4Virgin Islands . . . . . . . . . . . . . . . . . . . . . . . . . . . . . . . . . . . . . . . . . . . . . . . . . . . . . . . . . . . . . . . . . . --- 31.5 --- 25.5Guam . . . . . . . . . . . . . . . . . . . . . . . . . . . . . . . . . . . . . . . . . . . . . . . . . . . . . . . . . . . . . . . . . . . . . . . . 26.4 26.4 24.6 11.6American Samoa . . . . . . . . . . . . . . . . . . . . . . . . . . . . . . . . . . . . . . . . . . . . . . . . . . . . . . . . . . . . . . . * --- * ---Northern Marianas . . . . . . . . . . . . . . . . . . . . . . . . . . . . . . . . . . . . . . . . . . . . . . . . . . . . . . . . . . . . . 31.2 28.8 30.3 27.9
--- Data not available.* Figure does not meet standards of reliability or precision; less than 85% of data for the area were available as of release of the provisional file; see Technical Notes.1Low-risk cesarean is defined as singleton, term (37 or more weeks of gestation based on obstetric estimate; see Technical Notes), vertex (not breech) cesarean deliveries to women having a first birth per 100 women delivering singleton, term, vertex first births.2Excludes data for the territories.
NOTE: For information on the relative standard errors of the data and further discussion, see Technical Notes.

U.S. Department of Health and Human Services • Centers for Disease Control and Prevention • National Center for Health Statistics • National Vital Statistics System13
Vital Statistics Surveillance Report
Table 6. Preterm and late preterm births: United States, each state and territory, final 2015 and provisional 2016
[By place of residence. Data are based on a continuous file of records received from the states]
Area
Late preterm1 Preterm2
2016 2015 2016 2015
Percent
United States3 . . . . . . . . . . . . . . . . . . . . . . . . . . . . . . . . . . . . . . . . . . . . . . . . . . . . . . . . . . . . . . . . . 7.09 6.87 9.84 9.63
Alabama . . . . . . . . . . . . . . . . . . . . . . . . . . . . . . . . . . . . . . . . . . . . . . . . . . . . . . . . . . . . . . . . . . . . . 8.43 8.19 11.98 11.74Alaska . . . . . . . . . . . . . . . . . . . . . . . . . . . . . . . . . . . . . . . . . . . . . . . . . . . . . . . . . . . . . . . . . . . . . . . 6.78 6.84 8.90 8.95Arizona . . . . . . . . . . . . . . . . . . . . . . . . . . . . . . . . . . . . . . . . . . . . . . . . . . . . . . . . . . . . . . . . . . . . . . 6.73 6.69 9.06 9.06Arkansas . . . . . . . . . . . . . . . . . . . . . . . . . . . . . . . . . . . . . . . . . . . . . . . . . . . . . . . . . . . . . . . . . . . . . 7.81 7.66 10.83 10.82California . . . . . . . . . . . . . . . . . . . . . . . . . . . . . . . . . . . . . . . . . . . . . . . . . . . . . . . . . . . . . . . . . . . . . 6.32 6.16 8.62 8.47Colorado . . . . . . . . . . . . . . . . . . . . . . . . . . . . . . . . . . . . . . . . . . . . . . . . . . . . . . . . . . . . . . . . . . . . . 6.44 6.36 8.85 8.67Connecticut . . . . . . . . . . . . . . . . . . . . . . . . . . . . . . . . . . . . . . . . . . . . . . . . . . . . . . . . . . . . . . . . . . . 6.84 6.53 9.42 9.35Delaware . . . . . . . . . . . . . . . . . . . . . . . . . . . . . . . . . . . . . . . . . . . . . . . . . . . . . . . . . . . . . . . . . . . . . 6.92 6.44 10.06 9.87District of Columbia . . . . . . . . . . . . . . . . . . . . . . . . . . . . . . . . . . . . . . . . . . . . . . . . . . . . . . . . . . . . . 7.36 6.52 10.75 10.28Florida . . . . . . . . . . . . . . . . . . . . . . . . . . . . . . . . . . . . . . . . . . . . . . . . . . . . . . . . . . . . . . . . . . . . . . . 7.21 6.94 10.15 10.00
Georgia . . . . . . . . . . . . . . . . . . . . . . . . . . . . . . . . . . . . . . . . . . . . . . . . . . . . . . . . . . . . . . . . . . . . . . 7.88 7.53 11.22 10.76Hawaii . . . . . . . . . . . . . . . . . . . . . . . . . . . . . . . . . . . . . . . . . . . . . . . . . . . . . . . . . . . . . . . . . . . . . . . 7.84 7.44 10.55 10.11Idaho . . . . . . . . . . . . . . . . . . . . . . . . . . . . . . . . . . . . . . . . . . . . . . . . . . . . . . . . . . . . . . . . . . . . . . . . 6.71 5.96 8.94 8.15Illinois . . . . . . . . . . . . . . . . . . . . . . . . . . . . . . . . . . . . . . . . . . . . . . . . . . . . . . . . . . . . . . . . . . . . . . . . 7.25 7.17 10.34 10.16Indiana . . . . . . . . . . . . . . . . . . . . . . . . . . . . . . . . . . . . . . . . . . . . . . . . . . . . . . . . . . . . . . . . . . . . . . . 7.15 6.88 9.98 9.59Iowa . . . . . . . . . . . . . . . . . . . . . . . . . . . . . . . . . . . . . . . . . . . . . . . . . . . . . . . . . . . . . . . . . . . . . . . . . 6.89 6.60 9.28 9.03Kansas . . . . . . . . . . . . . . . . . . . . . . . . . . . . . . . . . . . . . . . . . . . . . . . . . . . . . . . . . . . . . . . . . . . . . . . 6.62 6.34 9.09 8.75Kentucky . . . . . . . . . . . . . . . . . . . . . . . . . . . . . . . . . . . . . . . . . . . . . . . . . . . . . . . . . . . . . . . . . . . . . 8.31 7.89 11.41 10.77Louisiana . . . . . . . . . . . . . . . . . . . . . . . . . . . . . . . . . . . . . . . . . . . . . . . . . . . . . . . . . . . . . . . . . . . . . 9.09 8.68 12.63 12.32Maine . . . . . . . . . . . . . . . . . . . . . . . . . . . . . . . . . . . . . . . . . . . . . . . . . . . . . . . . . . . . . . . . . . . . . . . . 6.40 6.09 8.58 8.45
Maryland . . . . . . . . . . . . . . . . . . . . . . . . . . . . . . . . . . . . . . . . . . . . . . . . . . . . . . . . . . . . . . . . . . . . . 7.10 6.96 10.14 10.03Massachusetts . . . . . . . . . . . . . . . . . . . . . . . . . . . . . . . . . . . . . . . . . . . . . . . . . . . . . . . . . . . . . . . . . 6.30 6.04 8.66 8.40Michigan . . . . . . . . . . . . . . . . . . . . . . . . . . . . . . . . . . . . . . . . . . . . . . . . . . . . . . . . . . . . . . . . . . . . . 7.25 6.97 10.16 9.89Minnesota . . . . . . . . . . . . . . . . . . . . . . . . . . . . . . . . . . . . . . . . . . . . . . . . . . . . . . . . . . . . . . . . . . . . 6.50 6.15 8.78 8.46Mississippi . . . . . . . . . . . . . . . . . . . . . . . . . . . . . . . . . . . . . . . . . . . . . . . . . . . . . . . . . . . . . . . . . . . . 9.62 9.04 13.64 13.05Missouri . . . . . . . . . . . . . . . . . . . . . . . . . . . . . . . . . . . . . . . . . . . . . . . . . . . . . . . . . . . . . . . . . . . . . . 7.36 7.16 10.17 10.01Montana . . . . . . . . . . . . . . . . . . . . . . . . . . . . . . . . . . . . . . . . . . . . . . . . . . . . . . . . . . . . . . . . . . . . . . 6.38 6.43 8.75 8.42Nebraska . . . . . . . . . . . . . . . . . . . . . . . . . . . . . . . . . . . . . . . . . . . . . . . . . . . . . . . . . . . . . . . . . . . . . 6.99 7.37 9.59 9.86Nevada . . . . . . . . . . . . . . . . . . . . . . . . . . . . . . . . . . . . . . . . . . . . . . . . . . . . . . . . . . . . . . . . . . . . . . 7.65 7.26 10.36 9.95New Hampshire . . . . . . . . . . . . . . . . . . . . . . . . . . . . . . . . . . . . . . . . . . . . . . . . . . . . . . . . . . . . . . . . 5.48 5.65 7.79 7.90
New Jersey . . . . . . . . . . . . . . . . . . . . . . . . . . . . . . . . . . . . . . . . . . . . . . . . . . . . . . . . . . . . . . . . . . . 7.06 6.96 9.75 9.76New Mexico . . . . . . . . . . . . . . . . . . . . . . . . . . . . . . . . . . . . . . . . . . . . . . . . . . . . . . . . . . . . . . . . . . . 7.11 7.05 9.96 9.54New York . . . . . . . . . . . . . . . . . . . . . . . . . . . . . . . . . . . . . . . . . . . . . . . . . . . . . . . . . . . . . . . . . . . . . 6.41 6.10 8.95 8.66North Carolina . . . . . . . . . . . . . . . . . . . . . . . . . . . . . . . . . . . . . . . . . . . . . . . . . . . . . . . . . . . . . . . . . 7.21 6.97 10.39 10.18North Dakota . . . . . . . . . . . . . . . . . . . . . . . . . . . . . . . . . . . . . . . . . . . . . . . . . . . . . . . . . . . . . . . . . . 6.67 6.10 9.14 8.44Ohio . . . . . . . . . . . . . . . . . . . . . . . . . . . . . . . . . . . . . . . . . . . . . . . . . . . . . . . . . . . . . . . . . . . . . . . . . 7.32 7.28 10.42 10.28Oklahoma . . . . . . . . . . . . . . . . . . . . . . . . . . . . . . . . . . . . . . . . . . . . . . . . . . . . . . . . . . . . . . . . . . . . 7.96 7.57 10.65 10.33Oregon . . . . . . . . . . . . . . . . . . . . . . . . . . . . . . . . . . . . . . . . . . . . . . . . . . . . . . . . . . . . . . . . . . . . . . . 5.86 5.45 7.96 7.58Pennsylvania . . . . . . . . . . . . . . . . . . . . . . . . . . . . . . . . . . . . . . . . . . . . . . . . . . . . . . . . . . . . . . . . . . 6.62 6.56 9.32 9.39Rhode Island . . . . . . . . . . . . . . . . . . . . . . . . . . . . . . . . . . . . . . . . . . . . . . . . . . . . . . . . . . . . . . . . . . 6.75 6.01 9.35 8.62
South Carolina . . . . . . . . . . . . . . . . . . . . . . . . . . . . . . . . . . . . . . . . . . . . . . . . . . . . . . . . . . . . . . . . . 7.82 7.68 11.15 11.06South Dakota . . . . . . . . . . . . . . . . . . . . . . . . . . . . . . . . . . . . . . . . . . . . . . . . . . . . . . . . . . . . . . . . . . 6.86 6.50 8.94 8.54Tennessee . . . . . . . . . . . . . . . . . . . . . . . . . . . . . . . . . . . . . . . . . . . . . . . . . . . . . . . . . . . . . . . . . . . . 8.10 7.93 11.30 10.99Texas . . . . . . . . . . . . . . . . . . . . . . . . . . . . . . . . . . . . . . . . . . . . . . . . . . . . . . . . . . . . . . . . . . . . . . . . 7.53 7.33 10.40 10.17Utah . . . . . . . . . . . . . . . . . . . . . . . . . . . . . . . . . . . . . . . . . . . . . . . . . . . . . . . . . . . . . . . . . . . . . . . . . 7.22 6.91 9.61 9.30Vermont . . . . . . . . . . . . . . . . . . . . . . . . . . . . . . . . . . . . . . . . . . . . . . . . . . . . . . . . . . . . . . . . . . . . . . 5.62 5.00 7.96 7.28Virginia . . . . . . . . . . . . . . . . . . . . . . . . . . . . . . . . . . . . . . . . . . . . . . . . . . . . . . . . . . . . . . . . . . . . . . . 6.80 6.50 9.59 9.25Washington . . . . . . . . . . . . . . . . . . . . . . . . . . . . . . . . . . . . . . . . . . . . . . . . . . . . . . . . . . . . . . . . . . . 6.02 5.87 8.14 8.11West Virginia . . . . . . . . . . . . . . . . . . . . . . . . . . . . . . . . . . . . . . . . . . . . . . . . . . . . . . . . . . . . . . . . . . 8.86 8.20 11.83 11.25Wisconsin . . . . . . . . . . . . . . . . . . . . . . . . . . . . . . . . . . . . . . . . . . . . . . . . . . . . . . . . . . . . . . . . . . . . 6.95 6.82 9.59 9.38Wyoming . . . . . . . . . . . . . . . . . . . . . . . . . . . . . . . . . . . . . . . . . . . . . . . . . . . . . . . . . . . . . . . . . . . . . 6.86 7.30 9.48 9.81
Puerto Rico . . . . . . . . . . . . . . . . . . . . . . . . . . . . . . . . . . . . . . . . . . . . . . . . . . . . . . . . . . . . . . . . . . . 8.53 8.42 11.50 11.39Virgin Islands . . . . . . . . . . . . . . . . . . . . . . . . . . . . . . . . . . . . . . . . . . . . . . . . . . . . . . . . . . . . . . . . . . --- 6.93 --- 10.59Guam . . . . . . . . . . . . . . . . . . . . . . . . . . . . . . . . . . . . . . . . . . . . . . . . . . . . . . . . . . . . . . . . . . . . . . . . 6.97 7.23 9.29 10.01American Samoa . . . . . . . . . . . . . . . . . . . . . . . . . . . . . . . . . . . . . . . . . . . . . . . . . . . . . . . . . . . . . . . * --- * ---Northern Marianas . . . . . . . . . . . . . . . . . . . . . . . . . . . . . . . . . . . . . . . . . . . . . . . . . . . . . . . . . . . . . 9.48 7.08 11.02 9.67
--- Data not available.* Figure does not meet standards of reliability or precision; less than 85% of data for the area were available as of release of the provisional file; see Technical Notes.1Births at 34–36 completed weeks of gestation based on the obstetric estimate; see Technical Notes.2Births before 37 completed weeks of gestation based on the obstetric estimate; see Technical Notes.3Excludes data for the territories.
NOTE: For information on the relative standard errors of the data and further discussion, see Technical Notes.
U.S. Department of Health and Human Services • Centers for Disease Control and Prevention • National Center for Health Statistics • National Vital Statistics System14
Vital Statistics Surveillance Report
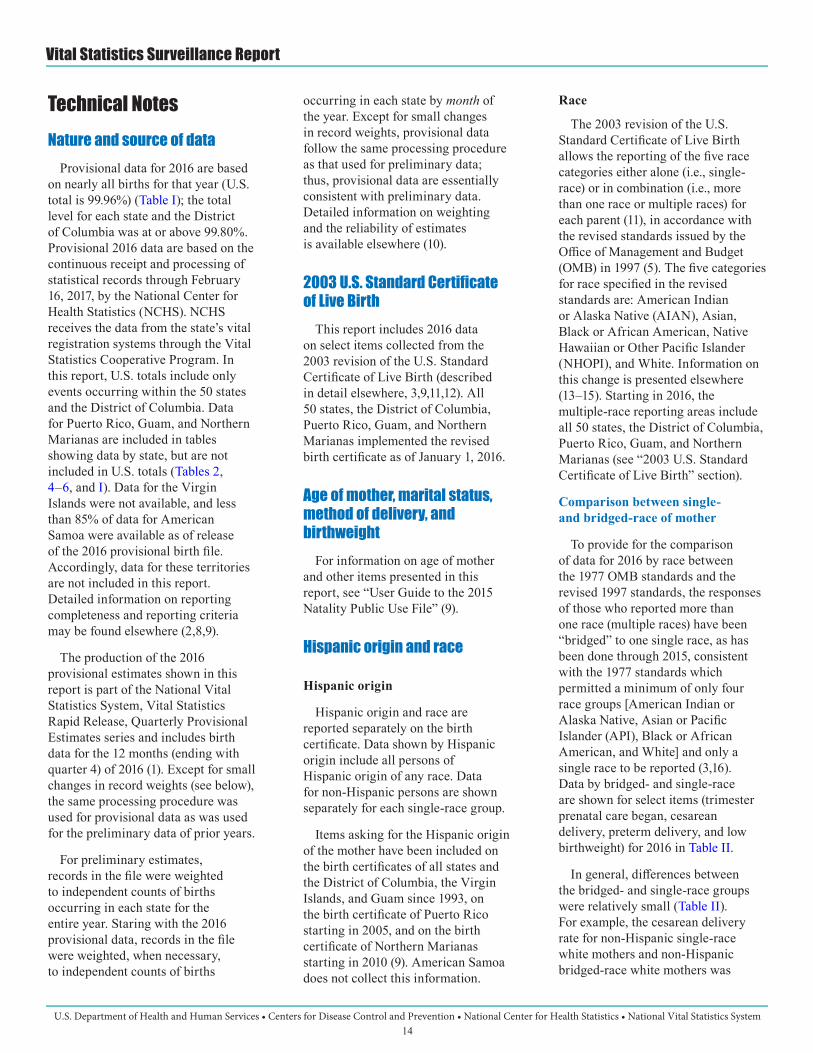
Technical NotesNature and source of data
Provisional data for 2016 are based on nearly all births for that year (U.S. total is 99.96%) (Table I); the total level for each state and the District of Columbia was at or above 99.80%. Provisional 2016 data are based on the continuous receipt and processing of statistical records through February 16, 2017, by the National Center for Health Statistics (NCHS). NCHS receives the data from the state’s vital registration systems through the Vital Statistics Cooperative Program. In this report, U.S. totals include only events occurring within the 50 states and the District of Columbia. Data for Puerto Rico, Guam, and Northern Marianas are included in tables showing data by state, but are not included in U.S. totals (Tables 2, 4–6, and I). Data for the Virgin Islands were not available, and less than 85% of data for American Samoa were available as of release of the 2016 provisional birth file. Accordingly, data for these territories are not included in this report. Detailed information on reporting completeness and reporting criteria may be found elsewhere (2,8,9).
The production of the 2016 provisional estimates shown in this report is part of the National Vital Statistics System, Vital Statistics Rapid Release, Quarterly Provisional Estimates series and includes birth data for the 12 months (ending with quarter 4) of 2016 (1). Except for small changes in record weights (see below), the same processing procedure was used for provisional data as was used for the preliminary data of prior years.
For preliminary estimates, records in the file were weighted to independent counts of births occurring in each state for the entire year. Staring with the 2016 provisional data, records in the file were weighted, when necessary, to independent counts of births
occurring in each state by month of the year. Except for small changes in record weights, provisional data follow the same processing procedure as that used for preliminary data; thus, provisional data are essentially consistent with preliminary data. Detailed information on weighting and the reliability of estimates is available elsewhere (10).
2003 U.S. Standard Certificate of Live Birth
This report includes 2016 data on select items collected from the 2003 revision of the U.S. Standard Certificate of Live Birth (described in detail elsewhere, 3,9,11,12). All 50 states, the District of Columbia, Puerto Rico, Guam, and Northern Marianas implemented the revised birth certificate as of January 1, 2016.
Age of mother, marital status, method of delivery, and birthweight
For information on age of mother and other items presented in this report, see “User Guide to the 2015 Natality Public Use File” (9).
Hispanic origin and race
Hispanic origin
Hispanic origin and race are reported separately on the birth certificate. Data shown by Hispanic origin include all persons of Hispanic origin of any race. Data for non-Hispanic persons are shown separately for each single-race group.
Items asking for the Hispanic origin of the mother have been included on the birth certificates of all states and the District of Columbia, the Virgin Islands, and Guam since 1993, on the birth certificate of Puerto Rico starting in 2005, and on the birth certificate of Northern Marianas starting in 2010 (9). American Samoa does not collect this information.
Race
The 2003 revision of the U.S. Standard Certificate of Live Birth allows the reporting of the five race categories either alone (i.e., single-race) or in combination (i.e., more than one race or multiple races) for each parent (11), in accordance with the revised standards issued by the Office of Management and Budget (OMB) in 1997 (5). The five categories for race specified in the revised standards are: American Indian or Alaska Native (AIAN), Asian, Black or African American, Native Hawaiian or Other Pacific Islander (NHOPI), and White. Information on this change is presented elsewhere (13–15). Starting in 2016, the multiple-race reporting areas include all 50 states, the District of Columbia, Puerto Rico, Guam, and Northern Marianas (see “2003 U.S. Standard Certificate of Live Birth” section).
Comparison between single- and bridged-race of mother
To provide for the comparison of data for 2016 by race between the 1977 OMB standards and the revised 1997 standards, the responses of those who reported more than one race (multiple races) have been “bridged” to one single race, as has been done through 2015, consistent with the 1977 standards which permitted a minimum of only four race groups [American Indian or Alaska Native, Asian or Pacific Islander (API), Black or African American, and White] and only a single race to be reported (3,16). Data by bridged- and single-race are shown for select items (trimester prenatal care began, cesarean delivery, preterm delivery, and low birthweight) for 2016 in Table II.
In general, differences between the bridged- and single-race groups were relatively small (Table II). For example, the cesarean delivery rate for non-Hispanic single-race white mothers and non-Hispanic bridged-race white mothers was

U.S. Department of Health and Human Services • Centers for Disease Control and Prevention • National Center for Health Statistics • National Vital Statistics System15
Vital Statistics Surveillance Report
the same (30.9%). The percentage of non-Hispanic single-race white mothers who began prenatal care in the first trimester was 82.3% compared with 82.2% for non-Hispanic bridged-race white mothers. However, differences between the two groups were relatively larger for non-Hispanic black and non-Hispanic AIAN women than for non-Hispanic white women on a number of the selected items. For example, the low birthweight rate for non-Hispanic single-race black mothers was 13.66% births compared with 13.51% for non-Hispanic bridged-race black mothers. The cesarean delivery rate for non-Hispanic single-race AIAN mothers was 28.0% compared with 28.5% for non-Hispanic bridged-race AIAN mothers. The largest difference was seen in the percentage of non-Hispanic AIAN mothers who began prenatal care in the first trimester, with 63.0% for non-Hispanic single-race AIAN mothers compared with 64.2% for non-Hispanic bridged-race AIAN mothers. Overall, the rates for non-Hispanic single-race white and black mothers were generally higher than those for non-Hispanic bridged-race white and black mothers for the select items shown, whereas the rates for non-Hispanic single-race AIAN mothers were generally lower than the rates for the bridged-race group.
Because the 1977 OMB standards combined Asian and Pacific Islander, a comparison between the race groups based on the two standards could not be made.
Information detailing the processing and tabulation of data by race is presented elsewhere (9).
Gestational ageBeginning with the 2014 data year,
NCHS transitioned to a new standard for estimating the gestational age of the newborn. The new measure—the obstetric estimate of gestation at delivery (OE)—replaces the measure based on the date of the last
normal menses (LMP) (4). National data based on OE data are available only from data year 2007 forward. Gestational age estimates differ somewhat between the OE- and LMP-based measures. For example, the 2015 OE-based preterm birth rate for the United States is 9.63%, compared with the LMP-based rate of 11.29% (3). In general, both measures show similar trends in the rate of preterm birth from 2007 to 2014. Information on and discussion of the reasons for the change, and a detailed comparison of the two measures, are presented elsewhere (4).
Population denominatorsU.S. national birth and fertility
rates for 2016 shown in this report are based on population estimates derived from the 2010 census as of July 1, 2016 (17).
Information on the national estimates of births to unmarried women (i.e., methods of determining marital status) and the computation of provisional birth rates for unmarried women is presented elsewhere (3,9,18). The birth rate for unmarried women for 2016 is estimated based on the population distribution by marital status, derived from the 2016 March (Annual Social and Economic) Supplement of the U.S. Census Bureau’s Current Population Survey, and applied to the national population estimates as of July 1, 2016, which are derived from the 2010 census (17,19).
Postcensal population estimates by age, sex, and race and Hispanic origin for 2016 at the national and state levels were not available as of the preparation of this report. Accordingly, birth and fertility rates by race and Hispanic origin and fertility rates by state could not be shown in this report. These rates will be shown in the 2016 final birth report scheduled for release in the fall of 2017.
Computing rates and percentages
In computing birth rates, age of mother was imputed if it was not stated (less than 0.6% for 2016). Marital status unknown was also imputed (for 11.6% of records in 2016). Percentages were computed using only events for which the characteristic is reported. The “not stated” category is subtracted from the total before the percentage is computed for timing of prenatal care, method of delivery, gestational age, and birthweight.
An asterisk (*) indicates that the figure does not meet standards of reliability or precision. In this report, three sets of criteria determine whether a figure meets these standards:
• The state-specific sample iscomplete enough to providereliable estimates. For example,a criterion of having at least85% of a state’s records for thetotal 12-month period is usedas a basis for providing state-specific estimates (Table I).
• Reporting for any particularvariable is at least 80% complete.(In this report, no data weresuppressed based on this criterion.)
• A rate or percentage is based on atleast 20 births in the numerator.
Rates based on fewer than 20births have a relative standard error (RSE) of about 23% or more and, therefore, are considered highly variable. However, some birth rates (based on data files that are less than 100% complete and based on 20 to 31 births) may have RSEs of 23% or more but are still shown instead of asterisks. As a result, caution should be exercised in analyzing rates based on 20 to 31 events. Additional information on random variation in numbers of events, rates, ratios, and percentages may be found in “Reliability of estimates.”

U.S. Department of Health and Human Services • Centers for Disease Control and Prevention • National Center for Health Statistics • National Vital Statistics System16
Vital Statistics Surveillance Report
Reliability of estimatesBecause the provisional estimates
of births in this report are based on files that may not be complete, they are subject to sampling variability. The notion of the sample is reflected in the record weights that are used to adjust record counts to independent control totals. The lack of completeness of the vital statistics files is due to delays in receiving and processing the live-birth records.
In addition, the natality file is subject to nonsampling errors or biases. Records that were delayed and were not included in this report are assumed to have the same characteristics as the records that were included in this report. Even if the number of vital events in this report was 100% complete and not subject to sampling variability, it might be affected by random variation. Thus, when the number of events is small and the probability of such an event is small, considerable caution must be taken in interpreting the data. Such infrequent events may be assumed to follow a Poisson probability distribution (8).
Data based on a sample, that is, where the file is less than 100% complete, are affected by sampling variation as well as by random variation. The RSE can be computed using the following formula:
where
f = the sampling fraction or the percentage of file completeness / 100 from Table I.
X = the estimated number of live births.
N = the total count of live births for the United States or any state.
RSEs may be used to compute confidence intervals for the number of events (X), for a rate (R), or for a percentage (P) and to compute statistical tests concerning the equality of two rates (R1 and R2) or two percentages (P1 and P2) (8).

U.S. Department of Health and Human Services • Centers for Disease Control and Prevention • National Center for Health Statistics • National Vital Statistics System17
Vital Statistics Surveillance Report
Table I. Total count of records and completeness of preliminary file of live births, by month: United States, each state and territory, provisional 2016[By place of occurrence]
Area
Total January February March April
Counts of records
Percent completeness
Counts of records
Percent completeness
Counts of records
Percent completeness
Counts of records
Percent completeness
Counts of records
Percent completeness
United States1 . . . . . . . . . . 3,952,582 99.964 317,419 99.998 306,637 99.997 329,294 99.998 314,247 99.997
Alabama . . . . . . . . . . . . . . 57,647 99.997 4,691 100.000 4,566 100.000 4,719 100.000 4,416 100.000Alaska . . . . . . . . . . . . . . . . 11,087 99.991 933 100.000 821 100.000 956 100.000 907 100.000Arizona . . . . . . . . . . . . . . . 85,575 99.951 7,170 100.000 6,850 100.000 6,913 100.000 6,658 100.000Arkansas . . . . . . . . . . . . . . 36,822 99.886 2,985 100.000 2,912 100.000 3,054 99.967 2,860 100.000California . . . . . . . . . . . . . . 489,627 99.995 39,424 100.000 37,884 100.000 40,944 100.000 38,720 100.000Colorado . . . . . . . . . . . . . . 67,171 99.994 5,403 100.000 5,013 100.000 5,608 100.000 5,490 100.000Connecticut . . . . . . . . . . . . 37,456 100.000 2,967 100.000 2,824 100.000 3,110 100.000 3,183 100.000Delaware . . . . . . . . . . . . . . 11,412 100.000 915 100.000 900 100.000 1,039 100.000 926 100.000District of Columbia . . . . . . 14,846 99.993 1,153 100.000 1,134 100.000 1,261 100.000 1,095 100.000Florida . . . . . . . . . . . . . . . . 225,255 100.000 18,309 100.000 17,850 100.000 18,556 100.000 17,533 100.000
Georgia . . . . . . . . . . . . . . . 130,914 99.988 10,740 99.991 10,487 100.000 10,882 99.991 10,127 100.000Hawaii . . . . . . . . . . . . . . . . 18,049 99.983 1,490 100.000 1,487 100.000 1,512 100.000 1,461 100.000Idaho . . . . . . . . . . . . . . . . . 22,178 99.986 1,692 100.000 1,682 99.941 1,987 100.000 1,817 100.000Illinois . . . . . . . . . . . . . . . . . 150,751 99.998 11,912 100.000 11,658 100.000 12,493 100.000 12,351 100.000Indiana . . . . . . . . . . . . . . . . 83,945 99.992 6,571 100.000 6,495 100.000 7,036 99.986 6,654 100.000Iowa . . . . . . . . . . . . . . . . . . 39,074 99.980 3,107 100.000 2,949 99.966 3,309 99.970 3,214 99.969Kansas . . . . . . . . . . . . . . . . 39,309 99.997 3,174 100.000 2,984 100.000 3,339 100.000 3,087 100.000Kentucky . . . . . . . . . . . . . . 53,022 99.842 4,201 100.000 4,148 99.976 4,395 100.000 4,260 100.000Louisiana . . . . . . . . . . . . . . 63,216 99.904 5,279 100.000 4,790 100.000 5,254 100.000 4,697 100.000Maine . . . . . . . . . . . . . . . . . 12,477 100.000 935 100.000 997 100.000 1,056 100.000 1,062 100.000
Maryland . . . . . . . . . . . . . . 69,815 100.000 5,631 100.000 5,355 100.000 5,729 100.000 5,658 100.000Massachusetts . . . . . . . . . . 71,986 99.997 5,497 100.000 5,485 100.000 6,010 100.000 5,845 99.983Michigan . . . . . . . . . . . . . . 112,181 99.964 8,799 99.989 8,570 100.000 9,481 100.000 9,183 99.989Minnesota . . . . . . . . . . . . . 68,817 99.994 5,387 100.000 5,469 100.000 5,686 100.000 5,589 99.982Mississippi . . . . . . . . . . . . . 37,131 100.000 3,033 100.000 2,889 100.000 3,139 100.000 2,717 100.000Missouri . . . . . . . . . . . . . . . 75,799 99.976 6,039 100.000 5,963 100.000 6,430 100.000 5,822 100.000Montana . . . . . . . . . . . . . . . 12,276 100.000 914 100.000 962 100.000 1,033 100.000 997 100.000Nebraska . . . . . . . . . . . . . . 27,088 99.922 2,090 100.000 2,049 100.000 2,311 100.000 2,270 99.956Nevada . . . . . . . . . . . . . . . 35,912 99.969 2,867 100.000 2,788 100.000 2,873 100.000 2,846 99.965New Hampshire . . . . . . . . . 12,345 99.992 971 100.000 946 100.000 1,027 100.000 1,051 100.000
New Jersey . . . . . . . . . . . . 99,827 99.929 8,001 100.000 7,630 99.987 8,309 100.000 7,949 100.000New Mexico . . . . . . . . . . . . 23,288 99.798 1,932 100.000 1,880 100.000 1,921 100.000 1,860 100.000New York . . . . . . . . . . . . . . 234,777 99.986 19,149 100.000 18,211 100.000 19,148 99.995 19,101 99.995
New York excluding New York City . . . . . . . . 114,457 99.984 9,297 100.000 8,819 100.000 9,389 99.989 9,386 99.989New York City . . . . . . . . . 120,320 99.987 9,852 100.000 9,392 100.000 9,759 100.000 9,715 100.000
North Carolina . . . . . . . . . . 122,759 99.991 9,933 99.990 9,513 99.968 9,944 100.000 9,488 99.989North Dakota . . . . . . . . . . . 13,023 100.000 1,077 100.000 982 100.000 1,060 100.000 1,041 100.000Ohio . . . . . . . . . . . . . . . . . . 138,567 99.989 10,965 100.000 10,846 100.000 11,438 99.991 11,160 100.000Oklahoma . . . . . . . . . . . . . 51,300 99.990 4,168 100.000 4,189 100.000 4,271 100.000 4,025 100.000Oregon . . . . . . . . . . . . . . . . 45,926 99.915 3,706 100.000 3,632 100.000 3,959 100.000 3,748 100.000Pennsylvania . . . . . . . . . . . 138,563 99.802 10,966 99.991 10,634 99.991 11,551 100.000 11,305 99.991
Rhode Island . . . . . . . . . . . 11,425 99.886 918 100.000 864 100.000 985 100.000 900 100.000South Carolina . . . . . . . . . . 53,802 99.996 4,444 100.000 4,242 100.000 4,503 100.000 4,099 100.000South Dakota . . . . . . . . . . . 12,907 100.000 1,011 100.000 974 100.000 1,093 100.000 1,053 100.000Tennessee . . . . . . . . . . . . . 86,347 99.947 6,952 100.000 6,743 100.000 7,118 100.000 6,879 99.971Texas . . . . . . . . . . . . . . . . . 405,568 99.899 32,818 100.000 31,172 99.994 33,605 99.997 31,372 99.997Utah . . . . . . . . . . . . . . . . . . 51,521 100.000 3,907 100.000 3,902 100.000 4,507 100.000 4,404 100.000Vermont . . . . . . . . . . . . . . . 5,566 100.000 402 100.000 463 100.000 461 100.000 450 100.000Virginia . . . . . . . . . . . . . . . . 101,166 99.994 8,156 99.988 7,912 100.000 8,608 100.000 8,189 100.000Washington . . . . . . . . . . . . 90,288 99.993 7,256 100.000 6,889 100.000 7,616 100.000 7,280 100.000
West Virginia . . . . . . . . . . . 19,841 99.798 1,586 100.000 1,559 99.936 1,683 100.000 1,511 100.000Wisconsin . . . . . . . . . . . . . 66,232 99.998 5,223 100.000 4,987 100.000 5,772 100.000 5,366 100.000Wyoming . . . . . . . . . . . . . . 6,706 100.000 570 100.000 506 100.000 600 100.000 571 100.000
Puerto Rico . . . . . . . . . . . . 28,302 100.000 2,453 100.000 2,299 100.000 2,380 100.000 2,232 100.000Virgin Islands . . . . . . . . . . . --- --- --- --- --- --- --- --- --- ---Guam . . . . . . . . . . . . . . . . . 3,427 94.864 312 100.000 277 100.000 286 100.000 266 100.000American Samoa . . . . . . . . 1,018 67.485 89 100.000 91 100.000 80 100.000 78 100.000Northern Marianas . . . . . . 1,217 85.703 94 85.106 77 96.104 101 68.317 104 81.731
See footnotes at end of table.

U.S. Department of Health and Human Services • Centers for Disease Control and Prevention • National Center for Health Statistics • National Vital Statistics System18
Vital Statistics Surveillance Report
Table I. Total count of records and completeness of preliminary file of live births, by month: United States, each state and territory, provisional 2016—Con.[By place of occurrence]
Area
May June July August
Counts of records
Percent completeness
Counts of records
Percent completeness
Counts of records
Percent completeness
Counts of records
Percent completeness
United States1 . . . . . . . . . . . . . . . . . . . . . . . . . . . . . . . . . 328,347 99.996 333,045 99.993 343,495 99.995 358,566 99.992
Alabama . . . . . . . . . . . . . . . . . . . . . . . . . . . . . . . . . . . . . 4,663 100.000 4,924 100.000 4,908 100.000 5,191 100.000Alaska . . . . . . . . . . . . . . . . . . . . . . . . . . . . . . . . . . . . . . . 951 100.000 976 100.000 947 100.000 943 100.000Arizona . . . . . . . . . . . . . . . . . . . . . . . . . . . . . . . . . . . . . . 6,798 100.000 6,841 99.985 7,143 100.000 7,799 100.000Arkansas . . . . . . . . . . . . . . . . . . . . . . . . . . . . . . . . . . . . . 2,913 99.966 3,128 99.968 3,260 99.969 3,422 99.942California . . . . . . . . . . . . . . . . . . . . . . . . . . . . . . . . . . . . . 39,624 100.000 39,830 100.000 41,136 100.000 45,101 99.996Colorado . . . . . . . . . . . . . . . . . . . . . . . . . . . . . . . . . . . . . 5,733 100.000 5,803 100.000 5,875 100.000 6,096 99.984Connecticut . . . . . . . . . . . . . . . . . . . . . . . . . . . . . . . . . . . 3,302 100.000 3,219 100.000 3,275 100.000 3,383 100.000Delaware . . . . . . . . . . . . . . . . . . . . . . . . . . . . . . . . . . . . . 983 100.000 1,010 100.000 979 100.000 964 100.000District of Columbia . . . . . . . . . . . . . . . . . . . . . . . . . . . . . 1,281 100.000 1,298 100.000 1,318 100.000 1,345 99.926Florida . . . . . . . . . . . . . . . . . . . . . . . . . . . . . . . . . . . . . . . 17,960 100.000 18,375 100.000 19,085 100.000 20,147 100.000
Georgia . . . . . . . . . . . . . . . . . . . . . . . . . . . . . . . . . . . . . . 10,641 99.991 10,909 99.982 11,283 99.991 11,608 100.000Hawaii . . . . . . . . . . . . . . . . . . . . . . . . . . . . . . . . . . . . . . . 1,491 99.933 1,454 100.000 1,504 100.000 1,615 100.000Idaho . . . . . . . . . . . . . . . . . . . . . . . . . . . . . . . . . . . . . . . . 1,869 100.000 1,908 100.000 1,876 100.000 1,992 100.000Illinois . . . . . . . . . . . . . . . . . . . . . . . . . . . . . . . . . . . . . . . . 12,887 100.000 12,926 100.000 13,619 99.993 13,722 100.000Indiana . . . . . . . . . . . . . . . . . . . . . . . . . . . . . . . . . . . . . . . 6,982 100.000 7,197 100.000 7,300 100.000 7,642 100.000Iowa . . . . . . . . . . . . . . . . . . . . . . . . . . . . . . . . . . . . . . . . . 3,371 99.970 3,300 100.000 3,370 100.000 3,472 100.000Kansas . . . . . . . . . . . . . . . . . . . . . . . . . . . . . . . . . . . . . . . 3,186 100.000 3,411 100.000 3,515 100.000 3,492 99.971Kentucky . . . . . . . . . . . . . . . . . . . . . . . . . . . . . . . . . . . . . 4,372 99.954 4,500 99.911 4,643 99.978 4,801 99.979Louisiana . . . . . . . . . . . . . . . . . . . . . . . . . . . . . . . . . . . . . 5,009 100.000 5,344 100.000 5,582 100.000 5,678 99.947Maine . . . . . . . . . . . . . . . . . . . . . . . . . . . . . . . . . . . . . . . . 1,090 100.000 1,049 100.000 1,171 100.000 1,139 100.000
Maryland . . . . . . . . . . . . . . . . . . . . . . . . . . . . . . . . . . . . . 5,952 100.000 5,923 100.000 6,269 100.000 6,271 100.000Massachusetts . . . . . . . . . . . . . . . . . . . . . . . . . . . . . . . . . 6,200 99.984 6,201 100.000 6,520 100.000 6,508 100.000Michigan . . . . . . . . . . . . . . . . . . . . . . . . . . . . . . . . . . . . . 9,669 100.000 9,678 99.990 9,965 100.000 10,097 99.990Minnesota . . . . . . . . . . . . . . . . . . . . . . . . . . . . . . . . . . . . 6,045 100.000 6,014 100.000 6,044 100.000 6,276 100.000Mississippi . . . . . . . . . . . . . . . . . . . . . . . . . . . . . . . . . . . . 2,953 100.000 3,077 100.000 3,233 100.000 3,438 100.000Missouri . . . . . . . . . . . . . . . . . . . . . . . . . . . . . . . . . . . . . . 6,138 100.000 6,508 99.985 6,777 99.985 6,933 99.957Montana . . . . . . . . . . . . . . . . . . . . . . . . . . . . . . . . . . . . . . 1,098 100.000 1,095 100.000 1,098 100.000 1,121 100.000Nebraska . . . . . . . . . . . . . . . . . . . . . . . . . . . . . . . . . . . . . 2,311 100.000 2,218 100.000 2,341 99.957 2,434 99.959Nevada . . . . . . . . . . . . . . . . . . . . . . . . . . . . . . . . . . . . . . 2,946 100.000 3,058 100.000 3,126 100.000 3,274 100.000New Hampshire . . . . . . . . . . . . . . . . . . . . . . . . . . . . . . . . 1,021 100.000 1,071 100.000 1,114 100.000 1,127 100.000
New Jersey . . . . . . . . . . . . . . . . . . . . . . . . . . . . . . . . . . . 8,485 100.000 8,576 100.000 8,921 100.000 8,793 100.000New Mexico . . . . . . . . . . . . . . . . . . . . . . . . . . . . . . . . . . . 1,907 99.948 1,963 100.000 2,028 100.000 2,110 99.953New York . . . . . . . . . . . . . . . . . . . . . . . . . . . . . . . . . . . . . 19,901 100.000 19,644 99.990 20,626 100.000 21,211 100.000
New York excluding New York City . . . . . . . . . . . . . . . . 9,743 100.000 9,697 99.990 10,261 100.000 10,375 100.000New York City . . . . . . . . . . . . . . . . . . . . . . . . . . . . . . . . 10,158 100.000 9,947 99.990 10,365 100.000 10,836 100.000
North Carolina . . . . . . . . . . . . . . . . . . . . . . . . . . . . . . . . . 10,178 100.000 10,342 100.000 10,727 100.000 11,209 100.000North Dakota . . . . . . . . . . . . . . . . . . . . . . . . . . . . . . . . . . 1,119 100.000 1,117 100.000 1,085 100.000 1,221 100.000Ohio . . . . . . . . . . . . . . . . . . . . . . . . . . . . . . . . . . . . . . . . . 11,718 99.991 11,934 100.000 12,083 99.975 12,726 99.976Oklahoma . . . . . . . . . . . . . . . . . . . . . . . . . . . . . . . . . . . . 4,146 100.000 4,330 100.000 4,374 100.000 4,669 100.000Oregon . . . . . . . . . . . . . . . . . . . . . . . . . . . . . . . . . . . . . . . 3,903 100.000 3,851 100.000 4,114 100.000 4,055 100.000Pennsylvania . . . . . . . . . . . . . . . . . . . . . . . . . . . . . . . . . . 11,876 100.000 11,762 100.000 12,228 100.000 12,538 100.000
Rhode Island . . . . . . . . . . . . . . . . . . . . . . . . . . . . . . . . . . 988 100.000 984 100.000 1,058 100.000 1,058 100.000South Carolina . . . . . . . . . . . . . . . . . . . . . . . . . . . . . . . . . 4,360 100.000 4,562 100.000 4,589 99.956 4,882 100.000South Dakota . . . . . . . . . . . . . . . . . . . . . . . . . . . . . . . . . . 1,088 100.000 1,078 100.000 1,134 100.000 1,138 100.000Tennessee . . . . . . . . . . . . . . . . . . . . . . . . . . . . . . . . . . . . 7,085 100.000 7,325 99.986 7,465 99.987 7,807 100.000Texas . . . . . . . . . . . . . . . . . . . . . . . . . . . . . . . . . . . . . . . . 32,852 99.991 33,827 99.973 34,853 99.986 37,048 99.976Utah . . . . . . . . . . . . . . . . . . . . . . . . . . . . . . . . . . . . . . . . . 4,520 100.000 4,531 100.000 4,508 100.000 4,797 100.000Vermont . . . . . . . . . . . . . . . . . . . . . . . . . . . . . . . . . . . . . . 470 100.000 500 100.000 508 100.000 538 100.000Virginia . . . . . . . . . . . . . . . . . . . . . . . . . . . . . . . . . . . . . . . 8,625 100.000 8,566 100.000 8,723 100.000 9,238 100.000Washington . . . . . . . . . . . . . . . . . . . . . . . . . . . . . . . . . . . 7,810 100.000 7,970 100.000 8,054 100.000 8,049 99.988
West Virginia . . . . . . . . . . . . . . . . . . . . . . . . . . . . . . . . . . 1,669 99.940 1,628 99.939 1,757 100.000 1,832 100.000Wisconsin . . . . . . . . . . . . . . . . . . . . . . . . . . . . . . . . . . . . 5,629 100.000 5,677 100.000 5,808 100.000 6,051 100.000Wyoming . . . . . . . . . . . . . . . . . . . . . . . . . . . . . . . . . . . . . 579 100.000 633 100.000 576 100.000 565 100.000
Puerto Rico . . . . . . . . . . . . . . . . . . . . . . . . . . . . . . . . . . . 2,376 100.000 2,348 100.000 2,189 100.000 2,473 100.000Virgin Islands . . . . . . . . . . . . . . . . . . . . . . . . . . . . . . . . . . --- --- --- --- --- --- --- ---Guam . . . . . . . . . . . . . . . . . . . . . . . . . . . . . . . . . . . . . . . . 280 100.000 289 100.000 286 100.000 320 100.000American Samoa . . . . . . . . . . . . . . . . . . . . . . . . . . . . . . . 104 100.000 87 100.000 78 100.000 80 100.000Northern Marianas . . . . . . . . . . . . . . . . . . . . . . . . . . . . . 66 95.455 103 96.117 111 93.694 112 88.393
See footnotes at end of table.

U.S. Department of Health and Human Services • Centers for Disease Control and Prevention • National Center for Health Statistics • National Vital Statistics System19
Vital Statistics Surveillance Report
Table I. Total count of records and completeness of preliminary file of live births, by month: United States, each state and territory, provisional 2016—Con.[By place of occurrence]
Area
September October November December
Counts of records
Percent completeness
Counts of records
Percent completeness
Counts of records
Percent completeness
Counts of records
Percent completeness
United States1 . . . . . . . . . . . . . . . . . . . . . . . . . . . . . . . . . 346,198 99.960 331,427 99.953 319,566 99.918 324,341 99.770
Alabama . . . . . . . . . . . . . . . . . . . . . . . . . . . . . . . . . . . . . 5,104 100.000 4,861 99.979 4,771 100.000 4,833 99.979Alaska . . . . . . . . . . . . . . . . . . . . . . . . . . . . . . . . . . . . . . . 943 100.000 941 100.000 888 99.887 881 100.000Arizona . . . . . . . . . . . . . . . . . . . . . . . . . . . . . . . . . . . . . . 7,801 100.000 7,307 99.986 6,987 99.971 7,308 99.480Arkansas . . . . . . . . . . . . . . . . . . . . . . . . . . . . . . . . . . . . . 3,243 99.753 3,006 99.834 3,015 99.635 3,024 99.603California . . . . . . . . . . . . . . . . . . . . . . . . . . . . . . . . . . . . . 44,324 99.995 42,294 99.995 39,974 99.975 40,372 99.978Colorado . . . . . . . . . . . . . . . . . . . . . . . . . . . . . . . . . . . . . 5,919 100.000 5,563 99.982 5,383 100.000 5,285 99.962Connecticut . . . . . . . . . . . . . . . . . . . . . . . . . . . . . . . . . . . 3,217 100.000 3,059 100.000 2,881 100.000 3,036 100.000Delaware . . . . . . . . . . . . . . . . . . . . . . . . . . . . . . . . . . . . . 979 100.000 941 100.000 916 100.000 860 100.000District of Columbia . . . . . . . . . . . . . . . . . . . . . . . . . . . . . 1,315 100.000 1,245 100.000 1,203 100.000 1,198 100.000Florida . . . . . . . . . . . . . . . . . . . . . . . . . . . . . . . . . . . . . . . 19,669 100.000 19,255 100.000 19,208 100.000 19,308 100.000
Georgia . . . . . . . . . . . . . . . . . . . . . . . . . . . . . . . . . . . . . . 11,352 100.000 10,885 99.991 10,858 99.982 11,142 99.937Hawaii . . . . . . . . . . . . . . . . . . . . . . . . . . . . . . . . . . . . . . . 1,564 100.000 1,580 100.000 1,372 100.000 1,519 99.868Idaho . . . . . . . . . . . . . . . . . . . . . . . . . . . . . . . . . . . . . . . . 2,035 100.000 1,868 100.000 1,698 100.000 1,754 99.886Illinois . . . . . . . . . . . . . . . . . . . . . . . . . . . . . . . . . . . . . . . . 12,934 99.985 12,376 100.000 11,835 100.000 12,038 100.000Indiana . . . . . . . . . . . . . . . . . . . . . . . . . . . . . . . . . . . . . . . 7,277 100.000 6,996 99.971 6,820 99.971 6,975 99.971Iowa . . . . . . . . . . . . . . . . . . . . . . . . . . . . . . . . . . . . . . . . . 3,419 99.971 3,190 100.000 3,152 99.968 3,221 99.938Kansas . . . . . . . . . . . . . . . . . . . . . . . . . . . . . . . . . . . . . . . 3,410 100.000 3,285 100.000 3,243 100.000 3,183 100.000Kentucky . . . . . . . . . . . . . . . . . . . . . . . . . . . . . . . . . . . . . 4,609 99.978 4,473 99.933 4,340 99.839 4,280 98.505Louisiana . . . . . . . . . . . . . . . . . . . . . . . . . . . . . . . . . . . . . 5,631 99.911 5,339 99.906 5,371 99.795 5,242 99.294Maine . . . . . . . . . . . . . . . . . . . . . . . . . . . . . . . . . . . . . . . . 1,114 100.000 1,003 100.000 924 100.000 937 100.000
Maryland . . . . . . . . . . . . . . . . . . . . . . . . . . . . . . . . . . . . . 5,979 100.000 5,858 100.000 5,568 100.000 5,622 100.000Massachusetts . . . . . . . . . . . . . . . . . . . . . . . . . . . . . . . . . 6,232 100.000 6,088 100.000 5,809 100.000 5,591 100.000Michigan . . . . . . . . . . . . . . . . . . . . . . . . . . . . . . . . . . . . . 9,621 99.969 9,149 99.913 8,945 99.877 9,024 99.845Minnesota . . . . . . . . . . . . . . . . . . . . . . . . . . . . . . . . . . . . 5,805 100.000 5,529 100.000 5,455 100.000 5,518 99.946Mississippi . . . . . . . . . . . . . . . . . . . . . . . . . . . . . . . . . . . . 3,227 100.000 3,233 100.000 3,050 100.000 3,142 100.000Missouri . . . . . . . . . . . . . . . . . . . . . . . . . . . . . . . . . . . . . . 6,602 99.985 6,291 99.952 6,041 99.950 6,255 99.904Montana . . . . . . . . . . . . . . . . . . . . . . . . . . . . . . . . . . . . . . 1,076 100.000 980 100.000 968 100.000 934 100.000Nebraska . . . . . . . . . . . . . . . . . . . . . . . . . . . . . . . . . . . . . 2,394 99.958 2,303 99.913 2,204 99.955 2,163 99.353Nevada . . . . . . . . . . . . . . . . . . . . . . . . . . . . . . . . . . . . . . 3,214 100.000 3,036 99.967 2,874 100.000 3,010 99.701New Hampshire . . . . . . . . . . . . . . . . . . . . . . . . . . . . . . . . 1,160 100.000 1,004 100.000 940 99.894 913 100.000
New Jersey . . . . . . . . . . . . . . . . . . . . . . . . . . . . . . . . . . . 8,614 100.000 8,316 99.928 8,045 99.826 8,188 99.389New Mexico . . . . . . . . . . . . . . . . . . . . . . . . . . . . . . . . . . . 2,025 100.000 1,990 99.698 1,826 99.562 1,846 98.321New York . . . . . . . . . . . . . . . . . . . . . . . . . . . . . . . . . . . . . 20,111 99.995 19,606 99.974 18,737 99.989 19,332 99.886
New York excluding New York City . . . . . . . . . . . . . . . . 9,776 99.990 9,433 99.968 8,989 99.989 9,292 99.892New York City . . . . . . . . . . . . . . . . . . . . . . . . . . . . . . . . 10,335 100.000 10,173 99.980 9,748 99.990 10,040 99.880
North Carolina . . . . . . . . . . . . . . . . . . . . . . . . . . . . . . . . . 10,810 100.000 10,324 99.990 10,054 99.990 10,237 99.961North Dakota . . . . . . . . . . . . . . . . . . . . . . . . . . . . . . . . . . 1,178 100.000 1,077 100.000 1,016 100.000 1,050 100.000Ohio . . . . . . . . . . . . . . . . . . . . . . . . . . . . . . . . . . . . . . . . . 12,026 99.983 11,423 99.991 10,855 99.972 11,393 99.982Oklahoma . . . . . . . . . . . . . . . . . . . . . . . . . . . . . . . . . . . . 4,540 100.000 4,229 100.000 4,118 100.000 4,241 99.835Oregon . . . . . . . . . . . . . . . . . . . . . . . . . . . . . . . . . . . . . . . 3,950 100.000 3,762 99.973 3,624 99.476 3,622 99.475Pennsylvania . . . . . . . . . . . . . . . . . . . . . . . . . . . . . . . . . . 11,982 99.975 11,528 99.939 10,955 99.681 11,238 97.989
Rhode Island . . . . . . . . . . . . . . . . . . . . . . . . . . . . . . . . . . 957 100.000 905 100.000 910 99.890 898 98.664South Carolina . . . . . . . . . . . . . . . . . . . . . . . . . . . . . . . . . 4,646 99.978 4,390 100.000 4,497 100.000 4,588 99.978South Dakota . . . . . . . . . . . . . . . . . . . . . . . . . . . . . . . . . . 1,143 100.000 1,047 100.000 1,066 100.000 1,082 100.000Tennessee . . . . . . . . . . . . . . . . . . . . . . . . . . . . . . . . . . . . 7,558 100.000 7,334 99.959 6,971 100.000 7,110 99.451Texas . . . . . . . . . . . . . . . . . . . . . . . . . . . . . . . . . . . . . . . . 35,975 99.708 34,498 99.748 33,684 99.709 33,864 99.737Utah . . . . . . . . . . . . . . . . . . . . . . . . . . . . . . . . . . . . . . . . . 4,419 100.000 4,210 100.000 3,910 100.000 3,906 100.000Vermont . . . . . . . . . . . . . . . . . . . . . . . . . . . . . . . . . . . . . . 463 100.000 457 100.000 418 100.000 436 100.000Virginia . . . . . . . . . . . . . . . . . . . . . . . . . . . . . . . . . . . . . . . 8,730 100.000 8,253 100.000 7,931 100.000 8,235 99.939Washington . . . . . . . . . . . . . . . . . . . . . . . . . . . . . . . . . . . 7,777 100.000 7,469 100.000 7,004 99.971 7,114 99.958
West Virginia . . . . . . . . . . . . . . . . . . . . . . . . . . . . . . . . . . 1,772 99.774 1,635 99.694 1,611 99.069 1,598 99.186Wisconsin . . . . . . . . . . . . . . . . . . . . . . . . . . . . . . . . . . . . 5,790 100.000 5,513 99.982 5,151 100.000 5,265 100.000Wyoming . . . . . . . . . . . . . . . . . . . . . . . . . . . . . . . . . . . . . 563 100.000 523 100.000 490 100.000 530 100.000
Puerto Rico . . . . . . . . . . . . . . . . . . . . . . . . . . . . . . . . . . . 2,596 100.000 2,282 100.000 2,338 100.000 2,336 100.000Virgin Islands . . . . . . . . . . . . . . . . . . . . . . . . . . . . . . . . . . --- --- --- --- --- --- --- ---Guam . . . . . . . . . . . . . . . . . . . . . . . . . . . . . . . . . . . . . . . . 276 100.000 297 100.000 259 99.228 279 37.634American Samoa . . . . . . . . . . . . . . . . . . . . . . . . . . . . . . . 87 0.000 65 0.000 78 0.000 101 0.000Northern Marianas . . . . . . . . . . . . . . . . . . . . . . . . . . . . . 95 80.000 119 93.277 125 74.400 110 81.818
--- Data not available.1Excludes data for Puerto Rico, Virgin Islands, Guam, American Samoa, and Northern Marianas.
NOTE: Percent completeness = number of records in provisional file * 100 / count of records.

U.S. Department of Health and Human Services • Centers for Disease Control and Prevention • National Center for Health Statistics • National Vital Statistics System20
Vital Statistics Surveillance Report
Table II. Comparison of selected maternal and birth (or infant) characteristics of all births, by single- and bridged-race of non-Hispanic mothers: United States, provisional 2016
Race Number of births
Prenatal care began in first
trimester Cesarean delivery Preterm1 Low birthweight2
Percent
Total of reporting area . . . . . . . . . . . . . . . . . . . . . . . . . . . . . . . . . . . . . . . . . 3,941,109 77.2 31.9 9.84 8.16
Non-Hispanic, single-race3
White . . . . . . . . . . . . . . . . . . . . . . . . . . . . . . . . . . . . . . . . . . . . . . . . . . . . . . 2,054,564 82.3 30.9 9.04 6.97Black . . . . . . . . . . . . . . . . . . . . . . . . . . . . . . . . . . . . . . . . . . . . . . . . . . . . . . 558,338 66.6 35.9 13.75 13.66American Indian or Alaska Native . . . . . . . . . . . . . . . . . . . . . . . . . . . . . . . . 31,432 63.0 28.0 11.38 7.77Asian . . . . . . . . . . . . . . . . . . . . . . . . . . . . . . . . . . . . . . . . . . . . . . . . . . . . . . 254,636 80.6 33.3 8.63 8.43Native Hawaiian or Other Pacific Islander . . . . . . . . . . . . . . . . . . . . . . . . . . 9,342 51.9 30.4 11.51 7.65
Non-Hispanic, bridged-race4
White . . . . . . . . . . . . . . . . . . . . . . . . . . . . . . . . . . . . . . . . . . . . . . . . . . . . . . 2,092,252 82.2 30.9 9.06 6.99Black . . . . . . . . . . . . . . . . . . . . . . . . . . . . . . . . . . . . . . . . . . . . . . . . . . . . . . 583,498 66.8 35.7 13.63 13.51American Indian or Alaska Native . . . . . . . . . . . . . . . . . . . . . . . . . . . . . . . . 36,196 64.2 28.5 11.31 7.89Asian or Pacific Islander . . . . . . . . . . . . . . . . . . . . . . . . . . . . . . . . . . . . . . . 277,241 79.5 32.9 8.77 8.37
1Born before 37 completed weeks of gestation based on the obstetric estimate; see Technical Notes.2Birthweight of less than 2,500 grams (5 lb. 8 oz.).3“Single-race” means that only one race is reported. Race categories are consistent with the 1997 Office of Management and Budget standards; see Technical Notes.4“Bridged-race” means that multiple-race data for the reporting states and the District of Columbia were imputed or bridged to the single-race categories of the 1977 Office of Management and Budget standards; see Technical Notes.

U.S. Department of Health and Human Services • Centers for Disease Control and Prevention • National Center for Health Statistics • National Vital Statistics System21
Vital Statistics Surveillance Report
AcknowledgmentsThis report was prepared in the
Division of Vital Statistics (DVS) under the general direction of Delton Atkinson, Director, DVS; Paul Sutton, Acting Chief, Reproductive Statistics Branch (RSB); and Joyce Martin, Team Lead, RSB Birth Team. Rajesh Virkar, Chief of the Information Technology Branch (ITB); Steve J. Steimel (ITB); Annie S. Liu (ITB); and Jasmine N. Mickens (ITB) provided computer programming support and statistical tables. Steve J. Steimel and Annie S. Liu prepared the natality file. TheData Acquisition and EvaluationBranch staff of DVS evaluatedthe quality of and acceptanceprocedures for the state data fileson which this report is based.
Suggested Citation
Hamilton BE, Martin JA, Osterman MJK, et al. Births: Provisional data for 2016. Vital statistics rapid release; no 2. Hyattsville, MD: National Center for Health Statistics. June 2017. Available from: https://www.cdc.gov/nchs/data/vsrr/ report002.pdf.
Copyright information
All material appearing in this report is in the public domain and may be reproduced or copied without permission; citation as to source, however, is appreciated.
National Center for Health Statistics
Charles J. Rothwell, M.S., M.B.A., Director
Jennifer H. Madans, Ph.D., Associate Director for Science
Division of Vital Statistics
Delton Atkinson, M.P.H., M.P.H., P.M.P., Director
Hanyu Ni, Ph.D., M.P.H., Associate Director for Science