birth and death trends 2014-2018 - louisvilleky.gov
TRANSCRIPT

Jefferson County Kentucky
January 5, 2021
Birth and Death Trends2014-2018
2
Introduction
This data brief presents 2018 preliminary data on birth and deaths indicators. Trends reveal changes in the health and wellbeing of the county and are impacted by root causes of health such as access to medical care, and the prevalence of specific risk factors. Statistics of each indicators are shown by race/ethnicity, gender, age, and other demographic characteristics where available.
In 2018, a total of 9569 resident births and 8097 deaths were registered in Jefferson County, KY, yielding a birth rate of 12.5 live births per 1,000 population and a crude death rate of 1054.2 per 100,000 population. Life expectancy at birth was 76.2 years.

3
The Global COVID-19 Pandemic
During 2020-2021, Louisville, Kentucky, and the United States, and the rest of the world were hit hard by the disease caused by the novel coronavirus (COVID-19). The virus has had a disproportionate impact on low income communities and communities of color, which made clearer the connection between root causes of health and inequitable health outcomes1.
Older adults and people who have certain illnesses are more likely to develop serious cases of COVID-19. According to the Centers for Disease Control and Prevention (CDC) 8 of every 10 COVID-19 deaths in the U.S. have occurred in adults who are 65 years old or older2. Additionally, adults of any age with certain underlying conditions are at a higher risk of severe illness from COVID-192. Many of the chronic illnesses associated with serious cases of COVID-19 are disproportionately experienced earlier in life by communities of color.
In addition to this, people of color are more likely to live in larger households; be employed in sectors or jobs where they are unable to telework or social distance, may lack benefits such as paid sick leave, and, are more likely to rely on shared or public transportation. Due to these factors there was also disproportionate early exposure to the virus in communities of color, which lead to community spread.
We provide more information on health equity and how it relates to COVID-19 in Louisville here.

4
Underlying Conditions Associated with Increased Risk of Severe COVID-192:
Many of the inequitable health outcomes discussed above are highlighted in this report. LMPHW recognizes that our community’s health outcomes are shaped by root causes of health and consequently, individual behavior and choices alone are not enough to account for differences in population and health outcomes. Root causes of health have a disproportionate and negative outcome on communities of color. However, race is a social construction not rooted in biology3. We create the unequal conditions that lead to unequal health outcomes. Because of the history of policies and investment decisions driven by racism in this country and city, exposure to unhealthy environments is concentrated among low socioeconomic status groups and people of color while access to healthy environments are concentrated among white and higher socioeconomic status communities.
Chronic Kidney Disease
Chronic Obstruc-tive Pulmonary Disease (COPD)
Heart Conditions
Immunocompromised state from solid organ
transplants
Obesity and Severe Obesity
Cancer
Pregnancy
Sickle Cell Disease
Smoking
Type 2 Diabetes

5
Key Findings
NH Blacks had higher death rates than NH Whites for most chronic disease and unnatural causes excluding chronic lower respiratory diseases, accidents, Alzheimer’s disease, suicide, and drug overdose.
From 2014-2018, the birth rate for Jefferson County decreased by 2%
From 2014-2018 the age adjusted death rate for Jefferson County increased by 4.5%.
Birth Outcomes:
Mortality:
Maternal Health and Births:
Maternal risk factors:Smoking rates during pregnancy remains a significant risk factor among Jefferson County residents.
Significant birth outcomes:Preterm birth, low birth weight and infant mortality remain a significant concern for the community. Disparities in these outcomes increased, as the gap between the rates at which non-Hispanic (NH) White mothers and NH Black mothers experience these outcomes increased between 2017 and 2018.
Age adjusted death rates for heart disease, chronic lower respiratory diseases, accidents, homicide, suicide, and drug overdose increased, while those caused by cancer, stroke, Alzheimer’s disease, diabetes, kidney diseases, influenza and pneumonia, septicemia, and motor vehicle crash decreased.
The five-year average life expectancy for females (79 years) was 5.7 years higher than for males (73.3 years). NH White five-year average life expectancy (76.6 years) was 2.9 years longer than NH Black (73.7 years)
2.9years
Death rates were higher among men for most chronic disease and unnatural causes than for women, exclusive of Alzheimer’s disease.

6
Birth Outcomes
The mean age for people who gave birth in 2018 was 28.6 years. The general fertility rate (GFR) for Jefferson County in 2018 was 62.5, a 1.5% decrease from 2014. Jefferson County’s GFR is higher than the United States’ of 59.1 births per 1,000 females age 15-44 for the same year4. Data are presented for maternal demographic and health characteristics, race and Hispanic origin, education level and major payment source.
Maternal Demographics (Percentage)
Race and Ethnicity
Non-Hispanic White
Non-Hispanic Black
Non-Hispanic Other
Hispanic
Race and Ethnicity Unknown
Age Group
Under 15
15-19
20-29
30-39
40+
Education
Less than high school
High school diploma - Associates Degree
Bachelors degree or higher
Education Unknown
Major Payment Source
Medicaid
Private Insurance
Self Pay
All other sources
Unknown
54.9
25.3
8.6
10.4
0.8
0.1
5.2
50.5
42
2.3
13.2
52
33.8
1.1
44.7
47.9
3.7
2.9
0.7
Maternal Risk and Contributing Factors (Percentage)
Previous Birth Outcomes
Previously had at least one termination of pregnancy
Previous children now deceased
Health Behaviors
Mothers self reported to be a smoker
Mothers that smoked during second trimester
Mothers that smoked during third trimester
Racial and Ethnic Distribution of Mothers that are WIC enrolled
Non-Hispanic White
Non-Hispanic Black
Non-Hispanic Other
Hispanic
Other Considerations
Current pregnancy from infertility treatment
NICU admission of the current child
28.4
2.0
16.2
8.3
8.0
19.1
52.2
34.1
43.9
1.7
12.7

7
Prenatal care initiation (PNC): Among people giving birth in 2018, 74.8% began prenatal care in the first trimester of pregnancy, compared to 73% in 2014. However, this figure declined for all groups between 2017 and 2018. The NH White group had the highest percentage (79.5%) of early PNC initiation when compared to the NH Black group and Hispanic groups at 67.1% (the lowest among race/ethnic groups).
Tobacco use among mothers: Of the people who gave birth in 2018, 9.2% reported smoking tobacco at some point while pregnant. These figures are high when compared to the 6.5% nationally4. Tobacco use among pregnant people in Jefferson county was most common earlier in pregnancy: 8.9% smoked in their first trimester, 7.4% in their second, and 7.2% in their third. However, between years 2014-2018 there was a 30.8% decrease (from 10.4% to 7.2%) in reported smoking among people in their third trimester.
90
80
70
60
50
40
30
20
10
0
70.767.1
20182017201620152014
Percentage of Mothers who Received Early Prenatal CareNH White NH Black NH Other Hispanic Overall
67.1
83.6 83.5 81.4 81
71
7973.6
79.5
71.7 71.9 72.172.676.4
74.470.6
75.976.4
14
12
10
8
6
4
2
0
4.2
2.5
20182017201620152014
Percentage of Mothers Smoking in Their Third Trimester, LouisvilleNH White NH Black NH Other Hispanic Overall
6.5
12.8
10.611.3
10
7.4
5.8
2.3
8.98.3
6.7
2.7
7.46.1
3.2
9.2
5.6
2.3

8
Method of delivery: In 2018, 65% of births were spontaneous, 33% were a result of a cesarean section and the remaining 2% were from other methods of delivery. Between years 2014-2018, the cesarean delivery trend has remained constant at an average of 32.5%, compared to a lower national rate of 31.9% in 20184.
Breast feeding initiation: In Jefferson County 79.6% of mothers had initiated breast feeding at the hospital during 2018, a 19.7% increase from 2014. In 2018, breast feeding initiation was the highest among Hispanic mothers (89.9%) followed by NH Other mothers (83.9%), NH White (82.4%), and NH Black (68.2%).
100
90
80
70
60
50
40
30
20
10
0
83.9
89.9
20182017201620152014
Percentage of Mothers that Initiated Breast Feeding at the HospitalNH White NH Black NH Other Hispanic Overall
68.2
54.9
85.2 85.1
73.474.7 77.879.3
82.486.587.890.7
82.586.6
84.3
58.1
60.365.7
40
35
30
25
20
15
10
5
0
29.5
32.4
20182017201620152014
Percentage of C-Sections as Method of delivery, LouisvilleNH White NH Black NH Other Hispanic Overall
34.633.932.3 31.5
33.537
34.633.4 3336.5
33.235.636.1
34.533.436.9
33.5 34

9
Teen pregnancy: The birth rate for females aged 15-19 in Jefferson County in 2018 was 21.9 births per 1,000, down 26.3% from 2014 (29.7 per 1,000). Since 2010 the teen birth rate has generally fallen to a new low each year. However, between 2017 and 2018 this rate increased by 7.9%. Following the national trend, birth rate among NH Black teens remain higher than NH Whites.
Period of Gestation (Pre-Term Births): Following the national trends in 2018 (10%), the Jefferson County preterm birth (percentage of births delivered at less than 37 completed weeks of gestation) rate increased 9% in 2017 to 10.9% in 2018. Notably, the percent of preterm birth increased substantially for NH Black women during that time, while it decreased for all other groups.
16
14
12
10
8
6
4
2
0
9.1 9.2
20182017201620152014
Percentage Preterm Births, LouisvilleNH White NH Black NH Other Hispanic Overall
14.113
7.5
8.8
10.6 10.6 10.2 10.910
7.88.1
7.6
10
8.78.8
13.212.3
14.6
50.0
45.0
40.0
35.0
30.0
25.0
20.0
15.0
10.0
5.0
0.020182017201620152014
Teen Birth Rates, Louisville
12.111.6
17.5
44.0
20.9
17.6
31.528.8
35.2
39.6
NH White NH Black Overall

10
Low birthweight (LBW): The percentage of infants with low birthweight (infants born weighing less than 2,500 grams) was 9.2% 2018 compared to 12.3% in 2014. Mirroring trends in preterm births, rates of low birthweight for NH White mothers declined while the rates for NH Black mothers increased. The difference in rates between NH White (6.9%), NH Black (15%), and Hispanic (6.1%) births in 2018 continues to be a significant disparities in Jefferson county.
Infant Mortality Rate (IMR): The number of deaths under one year of age per 1,000 live births is a highly sensitive proxy measure of population health in any geographic area. Between 2014 and 2018, IMR has slightly decreased from 6.7 to 5.6, which is slightly lower than the nation at 5.67 per 1,000 live births—the lowest recorded in US history5. The racial disparities in IMR between NH White (5.1) and NH Black (9.5) babies continues to persist in 2018 with a five-year (2014-2018) disparity gap averaging 5.4 deaths per 1,000 live births. The other racial and ethnic groups are not represented here due to unreliable rates resulting from a small number of deaths
16
14
12
10
8
6
4
2
0
16
14
12
10
8
6
4
2
0
10.3
6.1
20182017201620152014
Percentage of Low Birth-weight BirthNH White NH Black NH Other Hispanic Overall
15
13.8
67
9.2 9.38.8
10
6.9
9.69.1
10.4
8.68.3
9.9
13.2 13.2
15.6
20182017201620152014
Infant Mortality Rates (per 1,000 live births)NH White NH Black Overall
5.1
6.2
4.5
13.6
4.3
5.7
9.5
8.3
11.4
10

11
Louisville Metro Department of Public Health and Wellness – Agenda for Birth and Early Childhood Health Outcomes
The Louisville Metro Department of Public Health and Wellness (LMPHW) is focused on providing services, developing partnerships, and supporting policy and practice change that result in maternal health and birth equity, and opportunities for all young children and families to thrive. We utilize best practices to address the social determinants of health and systems of power, including racism. The Healthy Start program supports mothers and fathers through home visits that connect them to resources and opportunities that promote well-being during pregnancy and afterward. We further seek to address racial disparities in pregnancy by engaging with Black women in discussions about resiliency and mental health through Healthy Start Community Connections events on Facebook live. Healthy Babies Louisville focuses on reducing racial disparities in preterm birth, low birth weight and infant mortality by connecting community members, health, social service and education partners to standardize safe sleep education practices and increase access to doulas and depression screenings. The WIC program provides nutrition education, healthy foods, and connections to resources for pregnant women and children up to the age of five.
To improve maternal and child health outcomes, the Maternal and Child Health team at LMPHW works with health, social service, and equity partners to ensure access to safe sleep environments for infants and preventative abusive head trauma. The team also advocates for policies around issues such as paid parental leave, which provides health and socioeconomic benefits that positively impact breastfeeding, infant mortality, vaccination rates, maternal health, and father-infant bonding. You can access our 2019 health impact assessment of paid parental leave here, and can find our 2019 health impact assessment of The Kentucky Pregnant Workers Rights’ Act (KYPWRA) (SB18) here. LMPHW advocates at the local and national level for these policies.
12
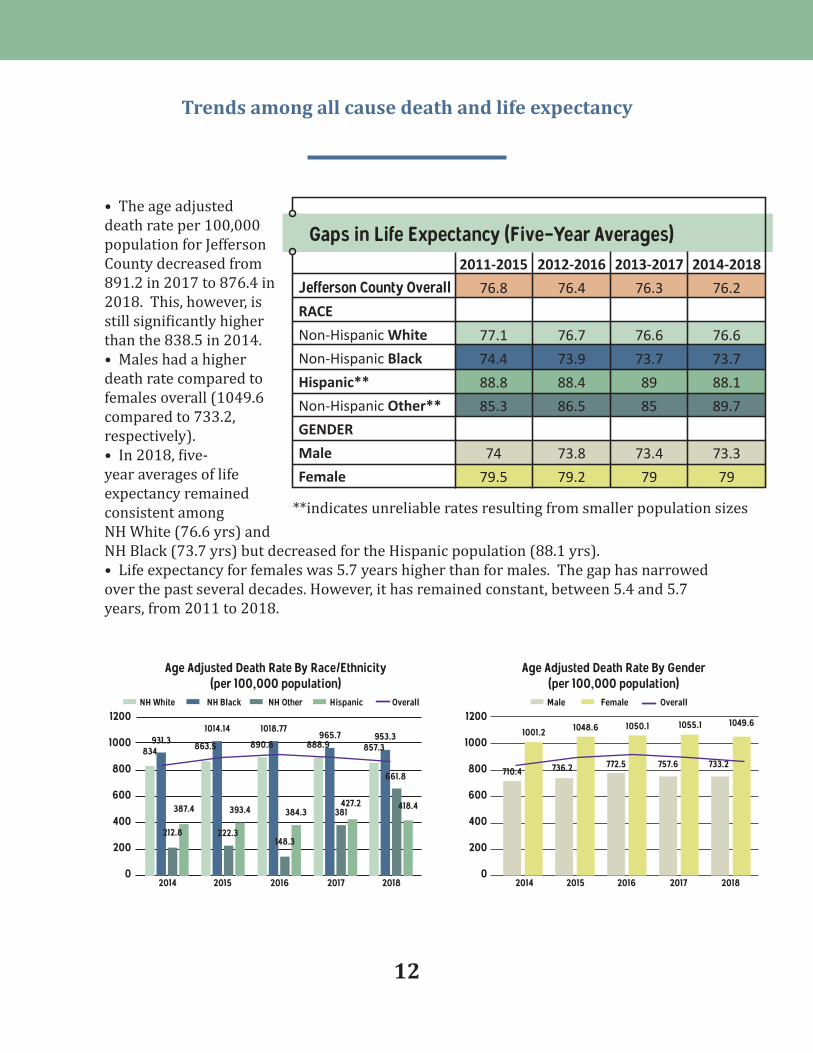
• The age adjusted death rate per 100,000 population for Jefferson County decreased from 891.2 in 2017 to 876.4 in 2018. This, however, is still significantly higher than the 838.5 in 2014. • Males had a higher death rate compared to females overall (1049.6 compared to 733.2, respectively).• In 2018, five-year averages of life expectancy remained consistent among NH White (76.6 yrs) and NH Black (73.7 yrs) but decreased for the Hispanic population (88.1 yrs).• Life expectancy for females was 5.7 years higher than for males. The gap has narrowed over the past several decades. However, it has remained constant, between 5.4 and 5.7 years, from 2011 to 2018.
Gaps in Life Expectancy (Five-Year Averages)
Jefferson County OverallRACE
Non-Hispanic White
Non-Hispanic Black
Hispanic**
Non-Hispanic Other**
GENDER
Male
Female
2011-2015
76.8
77.1
74.4
88.8
85.3
74
79.5
2012-2016
76.4
76.7
73.9
88.4
86.5
73.8
79.2
2013-2017
76.3
76.6
73.7
89
85
73.4
79
2014-2018
76.2
76.6
73.7
88.1
89.7
73.3
79
1200
1000
800
600
400
200
020182018 20172017 20162016 20152015 20142014
Age Adjusted Death Rate By Gender (per 100,000 population)
Age Adjusted Death Rate By Race/Ethnicity(per 100,000 population)
Male Female Overall
1049.6
733.2757.6772.5736.2710.4
1055.11050.11048.61001.2
**indicates unreliable rates resulting from smaller population sizes
NH White NH Black NH Other Hispanic Overall
931.31014.14
834 863.5
212.8
387.4 393.4
890.8 888.9 857.3
1018.77965.7 953.3
222.3148.3
381
661.8
384.3427.2 418.4
1200
1000
800
600
400
200
0
Trends among all cause death and life expectancy

13
In 2018, a total of 8097 resident deaths were registered in Jefferson County, yielding a crude death rate of 1054.2 per 100,000 population. The age adjusted death rate, which accounts for the aging of the population was 876.4 per 100,000 standard population.The leading cause of death in 2018 remained the mostly the same as in the previous five years. However, heart disease surpassed cancer as the leading cause of death in Jefferson County, and accidental deaths surpassed chronic lower respiratory diseases. Drug overdose rates (296)—which is mostly included in accidental deaths (505)—has surpassed the surpassed the counts of deaths due to kidney disease, diabetes, septicemia, and influenza and pneumonia. And in 2018 suicide accounted for the same number of deaths as influenza and pneumonia, accounting for 127 deaths each. Drug overdose rates is discussed in “Additional Causes of Death.”
The 11 National Center for Health Statistics (NCHS) leading causes of death in 2018 accounted for 69.4% of all deaths occurring in Jefferson County and are shown below:
Causes of Death, 2018
Heart disease(1673 deaths)
11
54321
9876 10
Kidney disease (176 deaths)
Alzheimer’s disease
(303 deaths)
Diabetes(171 deaths)
Septicemia(159 deaths)
Suicide(127 deaths)
Influenza and Pneumonia
(127 deaths)
Cancer (1582 deaths)
Accidents(505 deaths)
Stroke(335 deaths)
Chronic lower respiratory
diseases (459 deaths)

14
Cause-specific mortality trends
• Age adjusted death rates increased for four of the eleven leading causes of death between 2014 and 2018, including heart disease, accidents, chronic lower respiratory diseases, and suicide. Decreases occurred in six of the leading causes of death including cancer, stroke, Alzheimer’s disease, kidney disease, diabetes, septicemia and influenza and pneumonia.
• Age adjusted death rates for homicide and suicide increased between 2014 and 2018, while rates for motor vehicle crashes decreased.
2014 156.9 190.2 49.9 45.8 37.6 32.6 19.8 22.9 17.8 13.8 20.6
Influenzaand
Pneumonia
Chroniclower
respiratorydiseases
Heartdisease StrokeAccidentsCancerYear SuicideSepticemiaDiabetes
Kidneydisease
Alzheimer’sdisease
176 165.9 63.6 48.2 35.9 32.5 18.8 17.8 16.7 16.3 13.72018

15
Analysis of leading causes of mortality
In general, mortality due to the leading causes death are higher among the NH Black residents of Jefferson county, compared to their counterparts. Many of the causes of death that break this trend occur later in life, e.g. Alzheimer’s disease.
Heart disease: One in every four deaths in the U.S. is due to heart disease making it the leading cause of death nationwide6. Historically, cancer has been the leading cause of death in Jefferson county. However, in 2018 heart disease surpassed cancer as the leading cause of death for Jefferson county. The age adjusted death rate increased by 12.2% from 156.9 in 2014 to 176 in 2018. Notably, the age adjusted death rate for NH Black residents increased the most substantially during this time. For instance, the disparity in age adjusted death rates between NH white and NH black racial groups more than doubled during this time.
20182017201620152014
250
200
150
100
50
0
Age Adjusted Death Rate Due to Heart Disease By Race/Ethnicity (per 100,000 population)
214.6186.8
201.5207.2
174.6 162172.6173.1156.2
166.5
250
200
150
100
50
020182017201620152014
Age Adjusted Death Rate Due to Heart Disease By Gender(per 100,000 population)
Male Female Overall
136.3130.5133133.8124.4
214.7230.6233.7
200.1227.6
NH White NH Black Overall

16
Cancers:One in every four deaths in the U.S. is due to cancer7. In Jefferson county, the age adjusted death rate (per 100,000) for cancer decreased by 11.3% from 190.2 in 2014 to 168.6 in 2018. The age adjusted death rate for cancer decreased for males by 6.2% and for females by 18% between 2014-2018. In 2018, the age adjusted death rate was highest for NH Black residents. While the disparity between NH White and NH Black residents has fluctuated in recent years, it grew between 2017 and 2018.
Accidental deaths:There has been a notable increase in the age adjusted death rate due to accidental deaths in recent years. That rate decreased 16.3% from 2017 (76) to 2018 (63.6) but is still up from the 49.9 in 2014. Men had the highest age adjusted death rate of 88.5 in 2018. Accidental causes (unintentional injuries) include death from motor vehicle crash; accidental discharge of firearms; drowning and submersion; hanging, strangulation and suffocation; exposure to smoke or fire and flames; poisoning and exposure to noxious substances.
250
200
150
100
50
0
Age Adjusted Death Rate Due to Cancer By Race/Ethnicity (per 100,000 population)
178.6177.6197.3203.9210.4
169.9170.3171.8189.5
163.4
120
100
80
60
40
20
0
120
100
80
60
40
20
0
Age Adjusted Death Rate Due to Accidental Death By Race/Ethnicity (per 100,000 population)
48.649.5
59.660.4
33.9
88.976.576
56.8
70.1
250
200
150
100
50
020182018 20172017 20162016 20152015 20142014
Age Adjusted Death Rate Due to Cancer By Gender(per 100,000 population)Male Female Overall
139.3142.5154.4156.3
170
206.5200.5204218.4 204.9
20182017201620152014
Age Adjusted Death Rate Due to Accidental Death By Gender(per 100,000 population)Male Female Overall
39.8
55.6
45.845.741
98.697.898
60.8
88.5
NH White NH Black Overall
NH White NH Black Overall
20182017201620152014

17
50
45
40
35
30
25
20
15
10
5
0
50
45
40
35
30
25
20
15
10
5
0
60
50
40
30
20
10
0
60
50
40
30
20
10
0
Age Adjusted Death Rate Due to Stroke By Race/Ethnicity (per 100,000 population)
Age Adjusted Death Rate Due to Chronic LowerRespiratory Diseases By Race/Ethnicity
(per 100,000 population)
42.6
36.5
45.1
45.9
35.7
39
36.7
40.2
32.9
39.2
31.4
53.1
32.1
56.7
32.1
57.1
38.9
48.2
33.4
50.7
2018
2018
2017
2017
2016
2016
2015
2015
2014
2014
Age Adjusted Death Rate Due to Stroke By Gender(per 100,000 population)
Age Adjusted Death Rate Due to Chronic LowerRespiratory Diseases By Gender
(per 100,000 population)
Male Female Overall
Male Female Overall
34
46.7
31.5
51.1
32.4
55.1
32.5
55.6
35.8
41.1
34.6
50.6
31.7
48.7
32.2
49.6
38.9
53.4
38.1
49.8
Chronic lower respiratory diseases (CLRD): The age adjusted death rates due to CLRD increased overall by 4.8% from 2014 (46) to 2018 (48.2). Notably, this is down from an overall increase in 2015. NH White residents have the highest death rate among racial groups but is down 21.1% after a 15.5% increase in 2017. Men’s age adjusted death rate for CLRD was more than double that for women in 2018.
Stroke: Stroke is a major cause of serious disability for adults in the U.S.8. The age adjusted death rate due to Stroke decreased in Jefferson county by 4.6% from 2014 (37.6) to 2018 (35.9). Although NH Black age adjusted death rates due to stroke increased by 29.5% during that same time period.
NH White NH Black Overall
NH White NH Black Overall
2018
2018
2017
2017
2016
2016
2015
2015
2014
2014

18
50
40
30
20
10
0
30
25
20
15
10
5
0
50
40
30
20
10
0
30
25
20
15
10
5
0
Age Adjusted Death Rate Due to Diabetes By Race/Ethnicity (per 100,000 population)
Age Adjusted Death Rate Due to Suicide By Race/Ethnicity (per 100,000 population)
26
9.6
47.8
11
49.2
11.2
36
8.3
19
19.5
22.4
20.6
22.5
20.4
21.3
15.7
36.8
10
16
18.1
2018
2018
2017
2017
2016
2016
2015
2015
2014
2014
Age Adjusted Death Rate Due to Diabetes By Gender (per 100,000 population)
Age Adjusted Death Rate Due to Suicide By Gender (per 100,000 population)
Male Female Overall
Male Female Overall
14.1
6.7
14.6
6.3
20
8.3
20.2
8.3
16.2
5.5
31.1
26.1
33.1
27.5
33.6
27.5
30.9
22.9
22.6
26.7
Diabetes:A person with diabetes is at high risk of heart disease, stroke, and other serious complications, such as kidney failure, blindness, and amputations. In the last 20 years, the number of adults diagnosed with diabetes has more than doubled nationally as the US population has aged and become more overweight9. In Jefferson County the age adjusted death rates due to diabetes decreased by 22.3% from 2014 (22.9) to 2018 (17.8). The age adjusted death rate due to diabetes is highest for NH Black residents and males, although rates of death for both groups decreased by 29.3% and 27.3% respectively, from 2017 to 2018.22.3% from 2014 (22.9) to 2018 (17.8). The age adjusted death rate due to diabetes is highest for NH Black residents and males, although rates of death for both groups decreased by 29.3% and 27.3% respectively, from 2017 to 2018.
Suicide:According to the CDC suicide is a large and growing health problem resulting in one death every 11 minutes in 2018. Suicide and nonfatal self-directed violence result in an estimated $70 billion in combined medical and work loss costs in the U.S. every year. Nationally, suicide is the second leading cause of death for people aged 10 to 34 years, the second for people 35 to 54, and eighth for people 55 to 6410. In 2018, Jefferson County had 127 total deaths due to suicide. Suicides occur most frequently in NH White and male residents. A death rate for NH Black residents is provided for comparison but is unreliable due to low numbers of death by suicide for this group.
** indicates unreliable rates resulting from a small number of deaths.
NH White NH Black** Overall
NH White NH Black Overall
2018
2018
2017
2017
2016
2016
2015
2015
2014
2014

19
Drug overdose deaths: In 2018, a total of 296 individuals died of drug-induced causes in Jefferson County. Increases in recent years, have led to drug overdose deaths being among the leading causes of death for Louisville. The age adjusted death rate for drug induced causes for the total population decreased 21.2% between (49.5) 2017 and 2018 (39.4). However, it is still up 62.8% from 2014 (24.2). Notably, men were over two times more likely to die from drug overdose than women. And while NH Whites are still significantly more likely than NH Blacks to die from drug overdose, the age adjusted death rate for NH Whites decreased 24.6% from 2017 to 2018 while the rates for NH Black residents increased 1.1% during that time.
This category includes deaths from poisoning and medical conditions caused using legal or illegal drugs, as well as deaths from poisoning due to medically prescribed and other drugs. It excludes deaths indirectly related to drug use, as well as newborn deaths due to the mother’s drug use.
20182017201620152014
80
60
40
20
0
80
60
40
20
0
Age Adjusted Death Rate Due to Drug Induced DeathsBy Race/Ethnicity (per 100,000 population)
NH White NH Black Overall
20182017201620152014
Age Adjusted Death Rate Due to Drug Induced Deaths By Gender (per 100,000 population)
Male Female Overall
25.8
38.433.9
20.321.7
61.262.9
36.3
27
53.9
26.926.632.2
15.815.6
63
58.6
35.8
29
47.5

20
Homicide: The age adjusted homicide rate has declined in recent years after more than doubling between 2013-2017. However, NH Black residents are still over five times more likely to die as a result of homicide compared to their NH White counterparts, and men are almost seven times more likely to die than women. Homicide rates spiked in 2015 and have remained at a similar level for about 4 years. An age adjusted death rate for women residents is provided for comparison but is unreliable due to low numbers of death by suicide for this group.
50
45
40
35
30
25
20
15
10
5
0
50
45
40
35
30
25
20
15
10
5
0
Age Adjusted Death Rate Due to HomicideBy Race/Ethnicity (per 100,000 population)
NH White NH Black Overall
30.9
44.34747.3
25.5
5.87.37.2
3.1
5.8
20182018 20172017 20162016 20152015 20142014
Age Adjusted Death Rate Due to Homicide By Gender (per 100,000 population)
Male Female** Overall
3.23.96.36.3
2.6
27.226.826.8
13.9
20.8
** indicates unreliable rates resulting from a small number of deaths.

21
Motor vehicle crash deaths: According to vital statistics data, a total of 81 individuals died of motor vehicle crashes in Jefferson County in 2018. The age adjusted death rate for motor vehicle crash for the total population decreased by 12.1% between 2014 and 2018. The age adjusted death rate due to motor vehicle accidents for males in 2018 was nearly two and half times greater than that for females.
Alcohol impaired driving deaths:In 2018, one-person died every 50 minutes due to alcohol impaired driving deaths in the United States. 21 to 24-year-old drivers accounted for 27% of drivers in alcohol impaired fatal crashes in 201811. According to the Fatality Analysis Reporting System (FARS) data, among 165 driving deaths that occurred in Jefferson County in 2018. This differs from what we reported previously using vital statistics data. Nationally vital statistics consistently reports fewer motor vehicle accident related deaths because of differences in coding and reporting these death12. According to FARS data, 19 of the 165 (11.5%) driving deaths were alcohol impaired driving deaths in 2018. This is well below the percent over the past five years in Louisville (21.5%).
20182017201620152014
25
20
15
10
5
0
25
20
15
10
5
0
35
30
25
20
15
10
5
0
Age Adjusted Death Rate Due to Motor Vehicle Crash By Race/Ethnicity (per 100,000 population)
NH White NH Black Overall
8
1718
12.5
9.2
12
9.611
12.5
9
2018
2018
2017
2017
2016
2016
2015
2015
2014
2014
Age Adjusted Death Rate Due to Motor Vehicle Crash By Gender (per 100,000 population)
Percentage of Motor Vehicle Deaths Due toAlcohol Impaired Driving (FARS Data)
Male Female Overall
Louisville Kentucky Overall
5.9
20.9
6.9
23.3
8.6
22.8
5.8
25.5
7.9
26.3
20.9
24.6
16.3
22.4
16.8
22.1
15.3
26.8
14.7
11.5

22
Louisville Metro Department of Public Health and Wellness – Agenda to Improve Root Causes to Address Risk Factors for
Mortality
The American Public Health Association (APHA), the Centers for Disease Control and Prevention (CDC), and the National Association of County and City Health Officials (NACCHO) have all indicated that in order to create the healthiest communities possible, underlying social determinants of health must be addressed. To this end, LMPHW prioritizes supporting policy solutions towards root causes such as quality housing, food availability, and safety which can be major determinant in the developmental health for infants through young adulthood but continues to affect health throughout all ages and stages of one’s life. Louisville has received awards and recognition from the National Association of County and City Health Officials (NACCHO), the Kentucky Center for Smoke-free Policy (University of Kentucky), CityHealth, and the US Conference of Mayors for its work in promoting health equity. We continue to work across sectors to collaborate on projects that impact the health of residents of Louisville.
As is demonstrated by persistent disparities in many of the leading and supplemental causes of death outlined in this report, racism continues to impact health outcomes in Louisville. In recognition of this, Mayor Greg Fischer signed an Executive Order declaring racism a public health crisis in the city on December 1, 2020. LMPHW and the Center for Health Equity (CHE) continue to work with legislators at the state and local level on projects related to racism, equity, and public health. Additionally, CHE also continued to provide presentations and resources to the community focused on health disparities and building toward equity.
As part of our work towards promoting equitable public health, LMPHW prioritize the voices and visions of the Louisville Community and continue to develop a number of reports and health impact assessments. The subjects of recent reports and health impact assessments have included a variety of topics repealing the Louisville Metro abandoned urban property tax (2018), the use of family responsibility statements to improve children of incarcerated parent’s health outcomes (2018), Expungement policies (2020). As we look ahead to future health equity reports, we have engaged a Community Advisory Board, comprised of individuals representing a wide variety of communities and organizations, to help craft a vision for a Louisville where everyone and every community thrives. You can view past reports here.
Providing actionable data and insights

23
In 2020 APHA stated that the current state of housing in the US fails to meet the basic needs of many13. LMPHW recognizes that there are significant racial inequalities locally in access to housing that promotes health and well-being. In response to these inequalities CHE has partnered with a team from the CDC, NACHHO, and George Washington University to begin work on a new project that focuses on the impact that evictions have on health. Since the COVID-19 pandemic, LMPHW has provided analysis and support for the eviction moratorium and utility relief to keep people in their homes. LMPHW has additionally provided data support for a presentation to Metro Council’s Health and Education Committee targeted at expanding the fair housing ordinance to limit housing discrimination for individuals with a criminal record, individual who are homeless, individuals who served in the military, and on the basis of income source. The ordinance passed Metro Council on November 19, 2020 and was signed into law by Mayor Fischer.
Obesity and poor nutrition increases the risk of developing heart disease, type 2 diabetes and many types of cancer, which are among the leading causes of death in Louisville Metro. A key strategy of obesity prevention is improving access to healthy food and reducing access to unhealthy food. However, we know low-income groups and communities of color are more likely to live far away from, or otherwise face difficulty accessing nutritious and fresh foods14. For fiscal year 2021, Metro Council included a $3.5 million allocation for a community grocery, intended to operate in a manner that alleviates food deserts which persist in the county’s West and South neighborhoods. CHE was tasked with ensuring the operation met its goal of reducing food insecurity and is working with the community to fill this need.
Improving housing stability
Access to healthy food
Smoking increases the risk for many of the leading causes of death, including heart disease, cancers, respiratory illnesses, stroke, diabetes, decreased immune function, and it is linked to negative
Reducing tobacco use
24
As was demonstrated in this report, deaths due to drug overdose are now among the most frequent causes of death in Louisville. In 2018, LMPHW developed a city-wide plan to address substance use disorder in our community: Hope, Healing, & Recovery. Since this time LMPHW added three new mobile site locations for Syringe Services Program, has allocated funding to purchase Narcan for community partners and fund KY Harm Reduction Coalition to increase outreach efforts in West Louisville, and began distributing injectable naloxone in place of nasal naloxone (Narcan) to meet the growing demand for naloxone.
Suicidality is also emerging as a growing cause of death and health problem in Louisville. Over the past several years, LMPHW has made internal policy changes and provided suicide prevention training to its’ employees. to prevent suicide. In 2020, we also created a position within the Behavioral Health Equity Team to partner with the state on a suicide prevention campaign. This staff member is working on messaging for local communications and helping to build a local coalition around suicide prevention.
Accidents were the third leading cause of death in Louisville in 2018, trailing only heart diseases and cancers. To prevent these, LMPHW helped develop recommendations to amend Louisville’s complete streets policy for future road construction and reconstruction projects. On August 22, 2019 Metro Council overwhelming passed the complete streets ordinance (O-267-19). The ordinance updates the 2008 policy to meet national standards by including a health equity
Behavioral health equity
Healthy neighborhoods
outcomes in births, and fertility for both men and women15. In 2020, LMPHW provided support for two ordinances to further protect residents from the harms of vaping and tobacco use. A local licensing system was created for tobacco retailers. Additionally, zoning restrictions were enacted to help reduce tobacco retailers’ geographic density and proximity to youth-oriented facilities. Both of ordinances were passed by Metro Council in October 2020. LMPHW has additionally advocated at the state and national level for policies aimed at reducing the negative health impacts of tobacco, smoking products, and e-cigarettes including raising the legal age for purchase of tobacco products from 18 years of age to 21.

25
prioritization, establishing a public advisory committee, and creating transparency and public reporting requirements to ensure complete streets in every neighborhood. CHE continues to collaborate with Louisville Metro Department of Public Works to share public health insights and support the implementation of Complete Streets.
During the COVID-19 pandemic LMPHW has been working on a health impact assessment of Child Care Assistance Program (CCAP) reimbursement, raised funds to provide non-traditional instruction, daycare relief, and financial support for immigrant communities, and has continued to provide background research in support of COVID restrictions, such as mask mandates and closures and policies to reduce the number of people in prisons and jails.
In addition to much of the work outlined above, LMPHW launched a community health improvement plan in 2020 that is focused on equity and creating the healthiest Louisville possible. We call it Healthy Louisville 2025. The plan was developed with input from community members and LMPHW’s partners who address root causes of health in areas such as housing, transportation, education, healthcare, and the environment. The plan is carried out in close partnership with our collaborators in the community. You can track the progress and read more about each of the goals on our community dashboard, linked above.
There continue to be early signs of a decline in teen birthrate, adult smoking and smoking during pregnancy. However, other key measures of health and equity such as low birth weight and preterm births have not decreased for some groups, e.g. NH Black mothers. Injury and violent crimes such as homicides, non-fatal gunshot in Louisville are still up from where they were five years ago along with death rates due to substance abuse in the city. However, these age adjusted death rates should be viewed as relative indexes rather than as actual measures of mortality risk.
Child care
Discussion
Healthy Louisville 2025

26
Most of the data comes from 2014-2018 Kentucky Vital Statistics which are the birth and death records. The locations of these birth and death records are based on residence at time of birth or death. These outcomes have been age adjusted and county-level rates have been calculated using Census bridged population estimates from years 2014 to 2018 accessed through CDC WONDER. Additional data sources were used for health outcomes such as alcohol impaired driving deaths coming from the Fatality Analysis Reporting System Fatality Analysis Reporting System (FARS), which was accessed through MySidwalk.
All data provided is for Louisville Metro as a whole. Where possible, data is broken down by race/ethnicity, gender, year, or some combination of all three. Given small numbers for certain populations reliable data is not always available and is not always shown.
Data Notes

27
Sources:(1) Centers for Disease Control and Prevention, CDC. COVID-19 (Coronavirus Disease). COVID-19: Racial and Ethnic Health Disparities. CDC. [Online] Dec. 2020. https://www.cdc.gov/coronavirus/2019-ncov/community/health-equity/racial-ethnic-disparities/index.html (2) Centers for Disease Control and Prevention, CDC. COVID-19 (Coronavirus Disease): People at Increased Risk. Centers for Disease Control and Prevention. CDC. [Online] Nov. 2020. https://www.cdc.gov/coronavirus/2019-ncov/need-extra-precautions/index.html (3) Golash-Boza, TM. A Critical and Comprehensive Sociological Theory of Race and Racism. Sociology of Race and Ethnicity. 2016;2(2):129-141. Doi 10.1177/2332649216632242 (4) Martin JA, Hamilton BE, Osterman MJK, Driscoll AK. Births: Final data for 2018. National Vital Statistics Reports. 2019;68(13). Hyattsville, MD: National Center for Health Statistics (NCHS), Centers for Disease Control and Prevention (CDC). https://www.cdc.gov/nchs/data/nvsr/nvsr68/nvsr68_13-508.pdf(5) Ely DM, Driscoll AK. Infant mortality in the United States, 2018: Data from the period linked birth/infant death file. National Vital Statistics Reports.2020;69 (7). Hyattsville, MD: National Center for Health Statistics (NCHS), Centers for Disease Control and Prevention (CDC). https://www.cdc.gov/nchs/data/nvsr/nvsr69/NVSR-69-7-508.pdf (6) Centers for Disease Control and Prevention, CDC. Heart Disease. CDC. [Online] Sep. 2020. https://www.cdc.gov/heartdisease/facts.htm (7) U.S. Cancer Statistics Working Group. U.S. Cancer Statistics Visualizations Tool, based on 2019 submission data (1999-2017): U.S. Department of Health and Human Services, Centers for Disease Control and Prevention, CDC and National Cancer Institute, NCI. [Online] June 2020. www.cdc.gov/cancer/dataviz(8) Centers for Disease Control and Prevention, CDC. Stroke Facts. CDC. [Online] Sep 2020. https://www.cdc.gov/stroke/facts.htm (9) Centers for Disease Control and Prevention, CDC. Division of Diabetes Translation At A Glance. CDC. [Online] Aug 2020. https://www.cdc.gov/chronicdisease/resources/publications/aag/diabetes.htm (10) Centers for Disease Control and Prevention, CDC. Preventing Suicide. CDC. [Online] Apr. 2020. https://www.cdc.gov/violenceprevention/suicide/fastfact.html (11) National Highway Traffic Safety Administration’s (NHTSA) National Center for Statistics and Analysis. (2019, December). Alcohol impaired driving: 2018 data (Traffic Safety Facts. Report No. DOT HS 812 864). Washington, DC: National Highway Traffic Safety Administration. https://crashstats.nhtsa.dot.gov/Api/Public/ViewPublication/812864 (12) Mack KA, Hedegaard H, Ballesteros MF, Warner M, Eames J, Sauber-Schatz E. The need to improve information on road user type in National Vital Statistics System mortality data. Traffic Injury Prevention. 2019;20(3):276-281. doi: 10.1080/15389588.2019.1576036. Epub 2019 Apr 15. PMID: 30985191; PMCID: PMC6533142. (13) Hilovsky K, Lim K, Williams TT. American Public Health Association, APHA. Creating the Healthiest Nation: Health and Housing Equity. 2020. https://www.apha.org/-/media/files/pdf/topics/equity/health_and_housing_equity.ashx?la=en&hash=FEDA5CD7041C72CBA783AB614E5EC20CAA040DCA (14) Centers for Disease Control and Prevention, CDC. Nutrition: Healthy Food Environments. CDC. [Online] Sep 2020. https://www.cdc.gov/nutrition/healthy-food-environments/improving-access-to-healthier-food.html (15) Centers for Disease Control and Prevention, CDC. Smoking and Tobacco Use: Fast Facts and Fact Sheets. CDC. [Online] Nov 2020. https://www.cdc.gov/tobacco/data_statistics/fact_sheets/index.htm?s_cid=osh-stu-home-spotlight-001
Sources

28
If you would like further information about this report, contact Trey Allen; [email protected] | 502.574.6904
www.louisvilleky.gov/health 502.574.6520