birds of primary forest undergrowth in western …vol. 60, no. 2 birds of san blas, panama [179...
TRANSCRIPT
j. Field Ornithol., 60(2):178-189
BIRDS OF PRIMARY FOREST UNDERGROWTH IN
WESTERN SAN BLAS, PANAMA
JOHN G. BI•^KV? Department of Zoology University of Wisconsin
Madison, Wisconsin 53706 USA
Abstract.--Birds of primary forest undergrowth were sampled with mist nets at three elevations in the western part of the Kuna Indian reserve of San Bias, Panama, during April and May 1985. Eighty-five species were represented in 732 captures: 35 species in 149 captures at 50 m; 48 in 240 captures at 350 m; and 48 in 343 captures at 850 m. Species accumulation curves were similar at all sites. Capture rates (birds captured/100 mist net hours) were lower at 50 m than at higher elevations. Most frequently captured species were Red-capped Manakins (Pipra mentalis) at 50 m (15% of captures), Olive-striped Flycatchers (Mionectes olivaceus) at 350 m (7.5% of captures), and White-ruffed Manakins (Corapipo leucorrhoa) at 850 (15.5% of captures). Twelve trophic groups were represented: 10 at 50 and 350 m and 12 at 850 m. Nectarivore-insectivores and foliage insectivores accounted for most species; arboreal frugivores and frugivore-insectivores accounted for most captures. Distribution of captures among eight major trophic groups was significantly different among sites.
LAS AVES DE LA VEGETACI(•N ACHAPARRADA DE BOSQUES PRIMARIOS EN SAN BLAS, PANAMpi.
Resumen.--Las aves de la vegetaci6n achaparrada de bosques primarios fueron muestreadas con redes a tres elevaciones en la parte occidental de la reservaci6n de los Indios Kuna en San Bias, Panamfi durante abril y mayo de 1985. Ochenta y cinco especies estaban repre- sentadas en 732 capturas: 35 especies en 149 capturas a 50 m; 48 in 240 capturas a 350 m; y 48 en 343 capturas a 850 m. Las curvas acumulativas de especies fueron similares en todos los lugares. La tasa de captura (aves capturadas/100 horas redes) fue menor a 50 m que a elevaciones mayores. La especie capturada con mayor frecuencia fue Pipra mentalis a 50 m (15% de las capturadas), Mionectes olivaceus a 350 m (7.5% de las capturadas), y Corapipo leucorrhoa a 850 m (15.5% de las capturas). Doce grupos tr6ficos estaban repre- sentados: 10 a 50 y 350 m y 12 a 850 m. Nectlvoros-insectlvoros e insectlvoros de follaje comprendieron la mayorla de las capturas. La distribuci6n de las capturas entre os ocho grupos taxon6micos mayores fue significativamente diferente entre lugares.
General distribution of birds within Panama is well known (e.g., Ridge- ly 1976), but relatively little is known about distribution of bird species within the Kuna Indian reserve (Comarca de Kuna Yala) of San Bias. Previous studies in San Bias have been confined primarily to eastern areas near Colombia; much of the western section has remained unexplored. As part of an ecological survey of a newly established forest reserve in western San Bias (Fig. 1), I used mist nets to sample birds of primary forest undergrowth at three elevations. These preliminary data provide a baseline comparison for future studies in the region.
• Current address: Natural Resources Research Institute, University of Minnesota, Duluth, Duluth, Minnesota 55811 USA
178

Vol. 60, No. 2 Birds of San Blas, Panama [179
STUDY AREAS
The San Bias region of Panama encompasses four life zones (Holdridge et al. 1971, Tosi 1971): Tropical Moist Forest, Premontane Wet Forest, Tropical Wet Forest, and Premontane Rain Forest. Much of the flatter lowland belt has been converted to agricultural use. Beyond the lowlands, a steep rise of mountains is covered in forest that continues south to the Continental Divide and east in a continuous band some 240 km to the
Colombian border (see Delgado 1985). The Continental Divide forms the southern border of San Bias where it ranges in elevation from ap- proximately 850 m at Cerro Brewster to between 250-350 m at several points. Study sites were located near Cangandi (Premontane Wet Forest, 50 m), Nusagandi (Tropical Wet Forest, 350 m), and Cerro Brewster (Premontane Rain Forest, about 850 m) (Fig. 1). The three sites do not form a direct elevational transect; both Nusagandi and Cerro Brewster are located on the Continental Divide (Fig. 1).
Rainfall is highly seasonal in central Panama (Ridgely 1976); a pro- nounced dry season occurs from about January through April. Heavy rains did not start at any study site until after sampling was completed in mid-May. Consequently, differences in rainfall among the sites were minor during this study.
METHODS
I used mist nets (12 x 2.6 m, 36 mm mesh) to sample birds occurring in the understory at each site. Mist nets are a valuable tool for studies of tropical birds (e.g., Karr and Freemark 1983, Levey 1988, Loiselle 1987, Schemske and Brokaw 1981) allowing simultaneous sampling of different points with sampling independent of observer biases (Karr 1981, Levey 1988). Mist nets are, however, subject to biases (Karr 1981, Lovejoy 1974, Remsen and Parker 1983). Mist nets (36 mm mesh) are most effective at sampling birds that weigh from about 5 to 100 gm (Karr 1979); birds above or below this range may not be adequately represented in captures. Ground, canopy, and sedentary species also are likely to be poorly sampled. Problems of net avoidance may arise if birds learn the position of nets. (See Levey [1988] for a recent discourse on the use of nets.)
I operated 15 nets at ground level in relatively undisturbed primary forest at each location. Nets were placed along or close to trails (1-2 m wide) in primary forest at inter-net distances of about 20 m. I opened nets at dawn, checked them at hourly intervals, and closed them at about 1800. I noted opening and closing times to allow calculation of total mist net hours, a measure of sample effort (one mist net open for 1 h = 1 mist net h [MNH]. Captured birds were individually marked by clipping tips of one or two primaries in a numerical sequence and released at point of capture.
I operated nets for 3.5 d (15-19 May) at Cangandi and 4.5 d (8-13 April) at Nusagandi. I operated two sets of 15 nets at Cerro Brewster,

80] J.G. Blake J. Field Ornithol. Spring 1989
9* 30'-
9'15'-
CARIBBEAN SEA I '•. ß '• ,,• ,
7/ ' ' ß ß •"•, ,•//(Corn•rc• de/Kun• Y•I•).•.•
PANAMA PROVINCE • reserve 6 g 1'Okra
FIGURE 1. Locations of study sites within the western part of the Kuna Indian reserve of San Bias, Panama: Cangandi (50 m), Nusagandi (350 m), and Cerro Brewster (850 m).
each for 2 d (22-26 Apr.). The two sets of nets were separated by about 500 m at the closest point. I had not initially planned to sample two sites at Cerro Brewster, but because of the high initial capture rate (>100 birds captured on the first day) I decided to do so. Capture rates were not high enough at Cangandi to justify sampling two sites. My visits to these sites had to be coordinated with other researchers and with the
wishes of the Kuna Indians. Consequently, samples were separated by about 5 wk and could not be repeated.
I assigned species to guilds (Appendix 1) on the basis of most frequently used food and foraging location. Assignments were based on personal observations of foraging behavior and analysis of fecal samples (N > 3100) collected during this study and related studies in Costa Rica (e.g., Loiselle and Blake, in press). I supplemented those data in some cases by reference to various published sources (e.g., Skutch 1954, 1967, 1969; Wetmore 1964, 1965, 1972; Wetmore et al. 1984).
I based comparisons of capture rates (birds captured/100 mist net hours) among sites on the first 2 d of netting at each site because capture

Vol. 60, No. 2 Birds of San Blas, Panama [ 1 8 1
rates typically decline over time (e.g., Karr 1979). I compared number of captures among sites using chi-square goodness-of-fit tests (Sokal and Rohlf 1981). I calculated chi-square values from actual numbers of cap- tures, not capture rates; expected values were based on relative sample effort at each site.
I used chi-square contingency table tests to compare trophic composition among sites using all captures from each site. Such comparisons are not affected by differences in sample effort, assuming that probability of capturing individuals of different guilds is not dependent on sample day. Recapture rates were similar among sites, further justifying inclusion of all captures for such comparisons. I combined results from the two sites at Cerro Brewster for comparisons with results from Nusagandi and Cangandi because my main interest was a comparison of the three dif- ferent elevations.
I sampled vegetation within a 3-m wide belt on each side of each net (75 m2/net) to describe the habitat at each location. All woody stems > 2 cm dbh (diameter at breast height; 1.5 m) were counted and had dbh measured. I counted all shrubs (plants <2 cm dbh but at least 1.5 m tall) and visually estimated ground cover in 20% increments.
RESULTS
Habitat structure.--Habitat variables did not differ between Cerro
Brewster sites and results were combined for comparisons of habitat among the three elevations. Tree density, shrub density, and percent ground cover were greatest at Cerro Brewster (Table 1). Distribution of trees among different size classes (Fig. 2) did not differ among sites (x 2 = 9.8, df = 10, P > 0.45) despite the substantial differences among sites in number of trees in the smallest size class. Densities of palm trees and shrubs were greatest at Cangandi and declined with increasing elevation (Table 1).
Capture rates and species richness.--I captured 732 birds (601 individ- uals, 131 recaptures) representing 85 species (Table 2, Appendix 1). Fewer birds were captured at Cangandi during the first two days of netting (Table 2) than at Nusagandi (X 2 = 9.4, P < 0.005) or Cerro Brewster (line A--X 2 = 7.7, P < 0.01; line B--X 2 = 21.0, P < 0.001). Significant differences also were noted between Cerro Brewster sites (x 2 -- 4.0, ? < 0.05) but not between Nusagandi and either Cerro Brewster site.
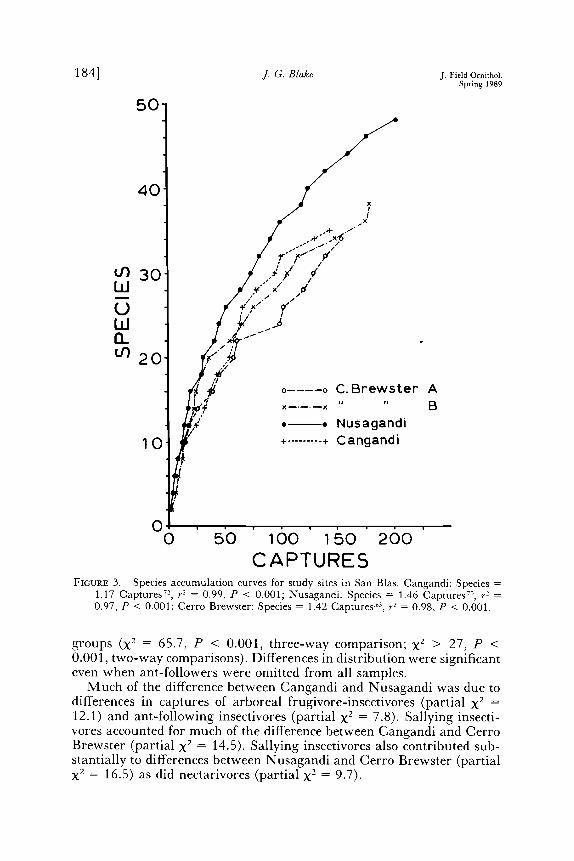
Number of species increased rapidly with total number of captures (Fig. 3). A power function provided a better fit (least square regression on In-transformed data, Sokal and Rohlf 1981) than did linear or ex- ponential models; species richness had not reached an asymptote at any site. Species accumulation curves were similar at all sites (Fig. 3); slope and intercept values did not differ.
The five most frequently captured species differed among sites (Table 3). Two species accounted for about 25% of total captures at both Can- gandi and Cerro Brewster but only about 15% at Nusagandi (Table 3).

182] J.G. Blake J. Field Ornithol. Spring 1989
220'
E 200
i,i 150
i,i 130
0 50
• 30
z
10 ÷
[-]: Cangandi
[• = Nusagandi
1 = Cerro Brewster
2-5 6-10 11-20 21-30 31-40 41-50 > 50
TREE SIZE CLASS (cm DBH)
FIGURE 2. Distributions among different size classes of trees (plants > 2 cm diameter at breast height [DBH]).
No species ranked among the 10 most frequently captured species at all sites and of 85 species captured, only 10 (12%) were present at all sites (Appendix 1).
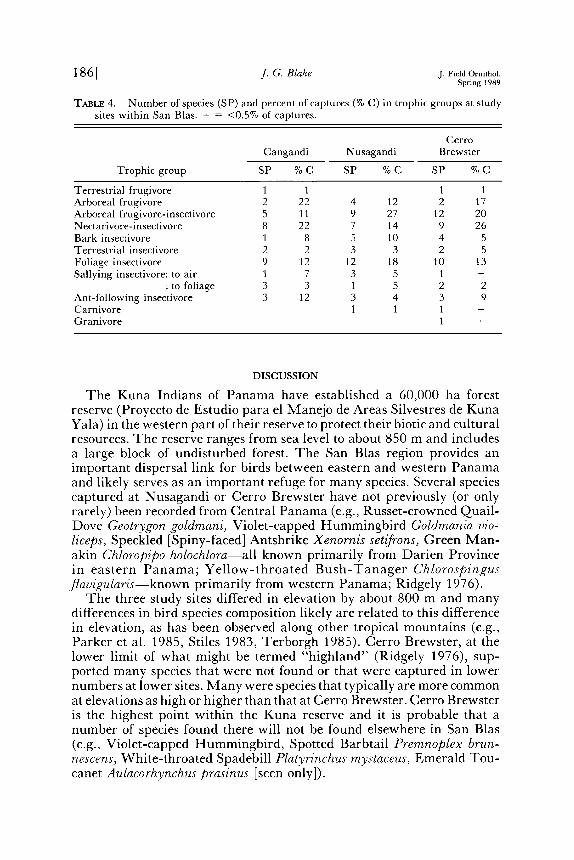
Trophic structure.--Ten trophic groups were represented by captures at Cangandi and Nusagandi; 12 groups were represented at Cerro Brew- ster (Table 4). Importance (i.e., percent representation among captures) of different groups varied among sites both with respect to species and captures. Importance also differed within a site depending on whether comparisons were based on species or captures (Table 4).
Eight major trophic groups (excluding terrestrial frugivores, carnivores, and granivores and combining both sallying insectivore groups) were represented at all sites. Distribution of species among groups did not differ between the two Cerro Brewster sites but distribution of individuals
did (X 2 = 24.9, P < 0.001). Most of the difference was due to ant-

Vol. 60, No. 2 Birds of San Blas, Panama [183
TABLE 1. Means (_+1 SE) of habitat variables from Cangandi (n = 15), Nusagandi (n = 15), and Cerro Brewster (n = 30). Densities and basal area (m 2) are per 75 m 2. Differences among means tested by ANOVA (F2,•7) or Kruskal-Wallis (X 2) tests; sig- nificance of results is given. NS = not significant.
Cerro ANOVA or X2 Variable Cangandi Nusagandi Brewster results
Tree density 13.7 11.2 16.3 F = 5.65 (1.41) (0.92) (0.95) P = 0.006
Tree basal area 0.31 0.17 0.31 NS
(0.06) (0.03) (0.05) Palm tree density 3.4 1.5 0.8 X 2 = 16.9
(0.60) (0.43) (0.21) P < 0.001 Palm tree basal area 0.013 0.007 0.007 NS
(0.003) (0.002) (0.001) Woody liana density 1.2 1.1 0.8 NS
(0.43) (0.34) (0.30)
Shrub density 26.0 21.9 38.0 X2 = 21.6 - (1.87) (1.85) (2.26) P < 0.001
Palm shrub density 11.7 8.3 2.9 X 2 = 36.8 (1.79) (0.66) (0.34) P < 0.001
Percent ground cover 39.3 38.3 63.3 F = 5.82 (7.28) (7.12) (4.73) P < 0.005
following insectivores (e.g., Bicolored Antbird Gymnopithys leucaspis); a large ant swarm was present in the first area netted. When ant-followers were omitted from the comparison, the two Cerro Brewster sites did not differ in distribution of individuals among trophic groups.
Distribution of species among trophic groups did not differ among the three elevations sampled (Cerro Brewster sites combined). I found that the three areas differed significantly in distribution of captures among
TABLE 2. Summary of netting results from San Blas. Results are for the first 2 d at a site and for all days combined. MNH = mist-net hours; Capt = number of captures; Rate = capture rate in birds/100 MNH; R = recaptures; Spec = total number of species.
Location Date MNH Capt Rate R % R Spec
Cangandi 15-16 May 302 99 32.8 13 13.1 30 15-19 May 503 149 29.6 23 15.4 35
Nusagandi 8-9 April 264 130 49.2 19 14.6 40 8-13 April 662 240 36.3 51 21.3 48
Gerro A: 22-23 April 348 162 46.6 31 19.1 34 Brewster B: 25-26 April 314 181 57.6 23 12.7 38
total: 22-26 April 662 343 51.7 57 a 16.4 48
a Includes three individuals captured on A line and recaptured on B line. These were not counted as recaptures within the B line.
84] J.G. Blake J. Field Ornithol. Spring 1989
5O
4O
or) 30
c20
ß ß Nusagandi 10 + ......... + Cangandi
o o 50 lOO 150 200
CAPTURES FIGURE 3. Species accumulation curves for study sites in San Bias. Cangandi: Species
1.17 Captures 72, r 2 = 0.99, P < 0.001; Nusagandi: Species = 1.46 Captures 7ø, r 2 0.97, P < 0.001; Cerro Brewster: Species = 1.42 Captures ©, r 2 = 0.98, P < 0.001.
groups (X 2 = 65.7, P < 0.001, three-way comparison; X 2 > 27, P < 0.001, two-way comparisons). Differences in distribution were significant even when ant-followers were omitted from all samples.
Much of the difference between Cangandi and Nusagandi was due to differences in captures of arboreal frugivore-insectivores (partial X2 _- 12.1) and ant-following insectivores (partial X2 = 7.8). Sallying insecti- vores accounted for much of the difference between Cangandi and Cerro Brewster (partial X2 = 14.5). Sallying insectivores also contributed sub- stantially to differences between Nusagandi and Cerro Brewster (partial X2 = 16.5) as did nectarivores (partial X 2 = 9.7).

Vol. 60, No. 2 Birds of San Blas, Panama [!85
o o • o n• •
e• k
186] ]. G. Blake J. Field Ornithol. Spring 1989
T^nI•E 4. Number of species (SP) and percent of captures (% C) in trophic groups at study sites within San Blas.+ = <0.5% of captures.
Cerro
Cangandi Nusagandi Brewster
Trophic group SP % C SP % C SP % C
Terrestrial frugivore 1 1 1 1 Arboreal frugivore 2 22 4 12 2 17 Arboreal frugivore-insectivore 5 11 9 27 12 20 Nectarivore-insectivore 8 22 7 14 9 26 Bark insectivore 1 8 5 10 4 5 Terrestrial insectivore 2 2 3 3 2 5
Foliage insectivore 9 12 12 18 10 13 Sallying insectivore: to air 1 7 3 5 1 +
: to foliage 3 3 1 5 2 2 Ant-following insectivore 3 12 3 4 3 9 Carnivore 1 1 1 + Granivore 1 +
DISCUSSION
The Kuna Indians of Panama have established a 60,000 ha forest reserve (Proyecto de Estudio para el Manejo de Areas Silvestres de Kuna Yala) in the western part of their reserve to protect their biotic and cultural resources. The reserve ranges from sea level to about 850 m and includes a large block of undisturbed forest. The San Blas region provides an important dispersal link for birds between eastern and western Panama and likely serves as an important refuge for many species. Several species captured at Nusagandi or Cerro Brewster have not previously (or only rarely) been recorded from Central Panama (e.g., Russet-crowned Quail- Dove Geotrygon goldmani, Violet-capped Hummingbird Goldmania vio- liceps, Speckled [Spiny-faced] Antshrike Xenornis seriftons, Green Man- akin Chloropipo holochlora--all known primarily from Darien Province in eastern Panama; Yellow-throated Bush-Tanager Chlorospingus fiavigularis--known primarily from western Panama; Ridgely 1976).
The three study sites differed in elevation by about 800 m and many differences in bird species composition likely are related to this difference in elevation, as has been observed along other tropical mountains (e.g., Parker et al. 1985, Stiles 1983, Terborgh 1985). Cerro Brewster, at the lower limit of what might be termed "highland" (Ridgely 1976), sup- ported many species that were not found or that were captured in lower numbers at lower sites. Many were species that typically are more common at elevations as high or higher than that at Cerro Brewster. Cerro Brewster is the highest point within the Kuna reserve and it is probable that a number of species found there will not be found elsewhere in San Blas (e.g., Violet-capped Hummingbird, Spotted Barbtail Premnoplex brun- nescens, White-throated Spadebill Platyrinchus mystaceus, Emerald Tou- canet Aulacorhynchus prasinus [seen only]).

Vol. 60, No. 2 Birds of San Blas, Panama [ 187
Nusagandi, at 350 m, lies in the zone between lowland and foothill regions and a large proportion of the avifauna found there is characteristic of both regions. Its position on the Continental Divide may make Nu- sagandi ecologically "higher" than other sites at similar elevations. There is little terrain above 350 m in the vicinity of Nusagandi and local climatic conditions (e.g., frequent mist, enveloping clouds, winds) are comparable to conditions usually found at higher elevations. Thus, several species occur at Nusagandi at elevations lower than is typical (e.g., Green Hermit Phaethornis guy, White-ruffed Manakin Corapipo leucorrhoa, Tawny- capped Euphonia Euphonia anneae, Bay-headed Tanager Tangara gyrola, Black-and-yellow Tanager Chrysothlypis chrysomelas [latter two species seen only]; Ridgely 1976; Wetmore 1968, 1972; Wetmore et al. 1984). Both the Green Hermit and White-ruffed Manakin undertake regular altitudinal migrations in Costa Rica (Loiselle 1987, Stiles 1985) and it is possible that the birds recorded at Nusagandi may not remain there. The occurrence of high elevation birds at lower elevations when mountain ranges are low has been noted by Ridgely (1976) as well.
Elevational changes in trophic structure of tropical bird communities likely reflect variation in abundance of food (Stiles 1983, Terborgh 1977). Two groups that showed marked differences in captures among areas were nectarivores (e.g., hummingbirds) and frugivores (e.g., manakins, Appendix 1). Many hummingbirds migrate altitudinally in response to changes in flower abundance (e.g., Stiles 1980). Similarly, frugivores comprise a large proportion of altitudinal migrants in Costa Rica (Loiselle 1987, Stiles 1985) and distribution and abundance of fruits influence spatial and temporal distribution patterns of frugivores (e.g., Loiselle 1987, Wheelwright 1983). Thus, distribution of nectarivores and frugi- votes at different elevations in San Bias may reflect differences in resource abundance among sites; a more detailed study would be required to confirm this possibility.
The rate at which birds are captured in mist nets provides an index for comparison of abundance of undergrowth birds at different forest sites. The capture rate was lower at Cangandi than at higher sites in San Bias but was similar to that found at other lowland sites in Panama (Karr 1982) and Costa Rica (Loiselle 1987). Capture rates at the Costa Rican site (Estacion Biologica La Selva) were lower than at higher sites (500 and 1000 m) in adjoining Parque Nacional Braulio (Loiselle 1987). Thus, the low capture rate at Cangandi relative to Nusagandi and Cerro Brew- ster may not be unusual. Further comparisons with other areas in San Bias, particularly additional lowland sites, would be useful.
ACKNOWLEDGMENTS
I thank the Kuna Indians for granting permission to work in their comarca and for logistical support provided. RENARE (Panamanian park service) provided permits that allowed me to conduct research in the area. I thank J. R. Karr for providing the opportunity to be involved with this project and B. Houseal, consultant to the PEMASKY project and project coordinator, for many useful suggestions. E. H. Burtt, Jr., R. J. Fuller, J. M. Hanowski, J. R. Karr, B. A. Loiselle, J. Niemi, E. Santana C., and N. T. Wheelwright

J. Field Ornithol. Spring 1989
commented constructively on an earlier draft of this paper. Support for this study was provided by a Smithsonian Tropical Research Institute short-term fellowship. Finally, I particularly thank G. de Nevers and S. Charnley for their organizational efforts and com- panionship in the field.
LITERATURE CITED
AMERICAN ORNITHOLOGISTS' UNION. 1983. Check-list of North American birds, 6th ed. American Ornithologists' Union, Washington, D.C.
DELGADO B., F. S. 1985. Present situation of the forest birds of Panama. Pp. 77-93, in A. W. Diamond and T. Lovejoy, eds. Conservation of tropical forest birds. International Council on Bird Preservation, Cambridge, England.
HOLDRIDGE, L. R., W. C. GRENKE, W. H. HATHEWAY, T. LIANG, AND J. A. Tosi, JR. 1971. Forest environments in tropical life zones: pilot study. Pergamon Press, New York.
KARR, J. R. 1979. On the use of mist nets in the study of bird communities. Inland Bird Banding 51:1-10.
ß 1981. Surveying birds in the tropics. Pp. 548-553, in C. J. Ralph and J. M. Scott, eds. Estimating numbers of terrestrial birds. Studies in Avian Biology 6.
1982. Avian extinctions on Barro Colorado Island, Panama: a reassessment. Am. Nat. 119:220-239.
, AND K. E. FREEMARKß 1983. Habitat selection and environmental gradients: dynamics in the "stable" tropics. Ecology 64:1481-1494.
LEVEY, D.J. 1988. Tropical wet treefall gaps and distribution of understory birds and plants. Ecology 69:1076-1089.
LOISELLE, B. A. 1987. Birds and plants in a neotropical rain forest: seasonality and interactions. Ph.D. diss., Univ. Wisconsin, Madison, Wisconsin.
, AND J. G. BLAKE. Diets of understory fruit-eating birds in Costa Rica, in M. L. Morrison, C. J. Ralph and J. Verner, eds. Food exploitation by terrestrial birds. In press.
LOVEJOY, T. 1974. Bird diversity and abundance in Amazon forest communities. Living Bird 13:127-191.
PARKER, T. A., III, T. S. SCHULENBERG, G. R. GRAVES, AND M. J. BI•UN. 1985. The avifauna of the Huancabamba region, northern Peru. Ornithol. Monogr. 36:169-197.
REMSEN, J. V., JR., AND T. A. PARKER III. 1983. Contribution of river-created habitats to bird species richness in Amazonia. Biotropica 15:223-231.
RIDGELY, R. S. 1976. A guide to the birds of Panama. Princeton Univ. Press, Princeton, New Jersey.
SCHEMSKE, O. W., AND N. BROKAW. 1981. Treefalls and the distribution of understory birds in a tropical forest. Ecology 62:938-945.
SKUTCH, A. 1954. Life histories of Central American birds. Pacific Coast Avifauna No. 31. 1967. Life histories of Central American highland birds. Nuttall Ornithol. Club,
Pu•ol. No. 7. 1969. Life histories of Central American birds. Pacific Coast Avifauna No. 35.
SO•L,'R. R., AND F. J. ROLF. 1981. Biometry, 2nd edition. W. H. Freeman and Company, San Francisco.
STILES, F.G. 1980. The annual cycle in a tropical wet forest hummingbird community. Ibis 122:322-343.
ß 1983. Birds: introduction. Pp. 502-530, in D. H. Janzen, ed. Costa Rican natural history. Univ. Chicago Press, Chicago.
1985. Conservation of forest birds in Costa Rica: problems and perspectives. Pp. 14i-168, in A. W. Diamond and T. Lovejoy, eds. Conservation of tropical forest birds. International Council on Bird Preservation, Cambridge, England.
TERBORGH, J. 1985. The role of ecotones in the distribution of Andean birds. Ecology 66:1237-1246.
TOSI, J. A., JR. 1971. Zonas de vida, una base ecologica para investigaciones silvicolas y inventariacion forestal en la Republica de Panama. Organizacion de las Naciones Unidas para Agricultura y Alimentacion, Rome.
Vol. 60, No. 2 Birds of San Blas, Panama [189
WETMORE, A. 1965ß The birds of the Republic of Panamaß Part 1. Tinamidae (tinamous) to Rynchopidae (skimmers). Smithsonian Misc. Coll., Vol. 150. Smithsonian Inst. Press, Washington, D.C.
ß 1968. The birds of the Republic of Panama. Part 2. Columbidae (pigeons) to Picidae (woodpeckers). Smithsonian Misc. Coll., Vol. 150. Smithsonian Inst. Press, Washington, D.C.
ß 1972. The birds of the Republic oœ Panama. Part 3. Passeriformes: Dendroco- laptidae (woodcreepers) to Oxyruncidae (sharpbills). Smithsonian Misc. Coll., Vol. 150. Smithsonian Inst. Press, Washington, D.C.
, R. F. PASQUIER, AND S. L. OLSON. 1984. The birds of the Republic of Panama. Part 4. Passeriformes: Hirundinidae (swallows) to Fringillidae (finches). Smithsonian Misc. Coil., Vol. 150. Smithsonian Inst. Press, Washington, D.C.
WHEELWRIGHT, N.T. 1983. Fruits and the ecology of the Resplendent Quetzal. Auk 100:286-301.
Received 9 Feb. 1988; accepted 24 Sep. 1988.
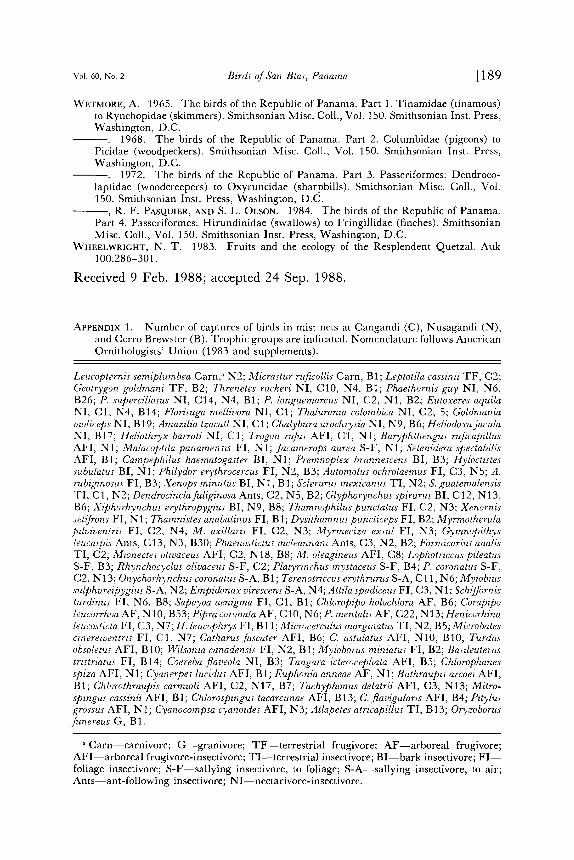
APPENDIX 1. Number of captures of birds in mist nets at Cangandi (C), Nusagandi (N), and Cerro Brewster (B). Trophic groups are indicated. Nomenclature follows American Ornithologists' Union (1983 and supplements).
Leucopternis semiplumbea Cam, a N2; Micrastur ruficollis Cam, B1; Leptotila cassinii TF, C2; Geotrygon goldmani TF, B2; Threnetes ruckeri NI, C10, N4, B1; Phaethornis guy NI, N6, B26; P. superciliosus NI, C14, N4, B1; P. longuemareus NI, C2, N1, B2; Eutoxeres aquila NI, C1, N4, B14; Florisuga mellivora NI, C1; Thalurania colombica NI, C2, 5; Goldmania vzoliceps NI, B19; Amazilia tzacatl NI, C 1; Chalybura urochrysia NI, N9, B6; Heliodoxajacula NI, B17; Heliothryx barroti NI, C1; Trogon rufus AFI, C1, N1; Baryphthengus ruficapillus AFI, N1; Malacoptila panamensis FI, N1; ]acamerops aurea S-F, N1; Selenidera spectabilis AFI, B1; Campephilus haematogaster BI, N1; Premnoplex brunnescens BI, B3; Hyloctistes subulatus BI, N1; Philydor erythrocercus FI, N2, B3; Automolus ochrolaemus FI, C3, N5; A. rubigznosus FI, B3; Xenops minutus BI, N1, B1; Sclerurus mexicanus TI, N2; S. guatemalensis TI, C1, N2; Dendrocir•clafuliginosa Ants, C2, N5, B2; Glyphorynchus spirurus BI, C12, N13, B6; Xiphorhynchus erythropygius BI, N9, B8; Thamnophilus punctatus FI, C2, N3; Xer•ornis setifrons FI, N1; Thamnistes anabatinus FI, B 1; Dysithamnus puncticeps FI, B2; Myrmotherula fulviventris FI, C2, N4; M. axillaris FI, C2, N3; Myrmeciza exsul FI, N3; Gymnopithys leucaspis Ants, C13, N3, B30; Phaenostictus mcleannani Ants, C3, N2, B2; Formicarius analis TI, C2; Mionectes olivaceus AFI, C2, N18, B8; M. oleagineus AFI, C8; Lophotriccus pileatus S-F, B3; Rhynchocyclus olivaceus S-F, C2; Platyrinchus mystaceus S-F, B4; P. coronatus S-F, C2, N 13; Onychorhynchus coronatus S-A, B 1; Terenotriccus erythrurus S-A, C 11, N6; Myiobius sulphureipygius S-A, N2; Empidonax virescens S-A, N4; Attila spadiceus FI, C3, N1; Schiffornis turdinus FI, N6, B8; Sapayoa aenigma FI, C1, B1; Chloropipo holochlora AF, B6; Corapipo leucorrhoa AF, N10, B53; Pipra coronata AF, C10, N6; P. mentalis AF, C22, N13; Henicorhina leucosticta FI, C3, N7; H. leucophrys FI, B 11; Microcerculus marginatus TI, N2, B5; Microbates cinereiventris FI, C1, N7; Catharusfuscater AFI, B6; C. ustulatus AFI, N10, B10; Turdus obsoletus AFI, B10; Wilsonia canadensis FI, N2, B1; Myioborus miniatus FI, B2; Basileuterus trzstrzatus FI, B14; Coereba flaveola NI, B3; Tangara icterocephala AFI, B5; Chlorophanes spiza AFI, N1; Cyanerpes lucidus AFI, B1; Euphonia anneae AF, N1; Buthraupis arcaei AFI, B1; Chlorothraupis carmioli AFI, C2, N17, B7; Tachyphonus delatrii AFI, C3, N13; Mitro- spingus cassinii AFI, B1; Chlorospingus tacarcunae AFI, B13; C. flavigularis AFI, B4; Pitylus grossus AFI, N1; Cyanocompsa cyanoides AFI, N3; Ariaperes atricapillus TI, B13; Oryzoborus funereus G, B1.
a Carn--carnivore; G--granivore; TF--terrestrial frugivore; AF--arboreal frugivore; AFI--arboreal frugivore-insectivore; TI--terrestrial insectivore; BI--bark insectivore; FI-- foliage insectivore; S-F--sallying insectivore, to foliage; S-A--sallying insectivore, to air; Ants--ant-following insectivore; NI--nectarivore-insectivore.