biostatic approach to diagnose diseases, using ... · pdf filebiostatic approach to diagnose...
TRANSCRIPT

Biostatic Approach to Diagnose Diseases, Using Computational ‘Nadi’
Patterns
B.Dheepika1
, V.G.S.Supathma1, R.M.P.M.Samaranayaka
1, M.G.N.A.S.Fernando
1,
N.Karunarathne2, and Sarangee Wimalasiri
2
1 University of Colombo School of Computing, Colombo 7, Sri Lanka.
2 Institutes of Indigenous Medicine, University of Colombo, Sri Lanka.
Abstract. The population in the world is increasing extremely and so the people suffering from all kind of
diseases. In future, there is a need that will arise for a new system which can early detect these diseases.
Nowadays there is a need for methods to detect diseases at early stages. Even though there are various
methods to identify diseases, those methods are expensive and painful. Technology is spreading everywhere
to make human life easier.
This research is based on applying the technology into the traditional medical approach to make the life
better. For the pulse wave’s analysis, there are few devices available at the research level. Using the device,
waves from the Vada, pitha, kafpa nadi are taken and analysis of the wave’s formation is done using
computational models and biostatic approaches to come up with the signal’s status. Using that signal will
provide the stage of the diseases/ diseases.
Approach of Traditional Ayurveda Medicine uses pulse as a means for diagnosis of diseases. These
conventional techniques are nowadays been replaced by devices using various sensors for detecting pulse
signal from radial artery at wrist position. This paper gives a brief review on such techniques developed for
diagnosis of various diseases using the concepts of ‘Tridosha’.
In this research paper we describe the process of designing the pulse detecting systems and selecting the
suitable sensor for the system design.
Keywords: pulse diagnosis, ayurveda, tridosha, data acquisition, pulse diagnosis, photoplethysmograph
1. Introduction
Nadi Pareeksha is the technique can identify the diseases accurately through the pulse. It can exactly
diagnose both physical and mental diseases as well as imbalances. The term Nadi refers to the pulse, nerves,
veins, arteries, and some sort of channel for passage of physiological and biological signals. ‘Nadi
Pareeksha’ is a traditional medical approach for diagnosis of diseases using Nadi patterns. Although in
modern medicine using this pulse inspection technique is used to detect heart rate of a person using modern
devices such as stethoscope, electrocardiography etc.
In most medical traditions, measuring patient’s pulse is considered as a key diseases diagnostic method.
Different traditions looks for different things while testing the pulses. Throughout the previous studies, we
identified few ancient traditional medical techniques such as ‘Traditional Chinese Medicine’, ‘Ayurvedic
Medicine’, ‘Ancient Egyptian Medicine’, ‘Ancient Greek Medicine’, ‘Islamic medicine’, ‘Ancient
Mongolian Medicine’, ‘Arabic medicine’ etc [1]. While checking the pulse in each tradition domain experts
consider various factors to calculate the pulse pattern and to identify the diseases.
2. Review of the Literature
Corresponding author. Tel.: +94 0774700177
E-mail address: [email protected]
International Proceedings of Chemical, Biological and Environmental Engineering, Vol. 99 (2016)
DOI: 10.7763/IPCBEE. 2016. V99. 4
26
A number of nonlinear methods have been introduced long time ago to measure the dynamic of
physiological signal such as ECG, EEG etc and achieved some meaningful result from that. But acquiring
pulse wave is a challenging task to obtain risky result. In this section we are going to analysis prior work
related pulse acquisition, used sensors and device setup.
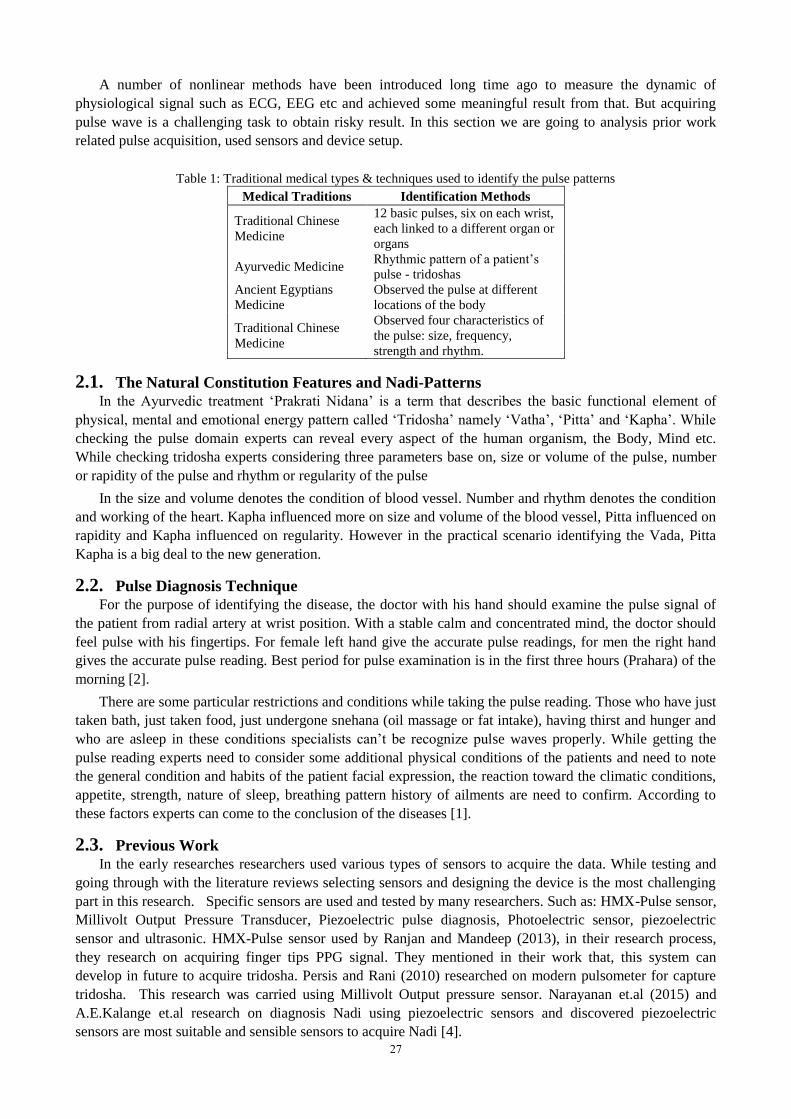
Table 1: Traditional medical types & techniques used to identify the pulse patterns
Medical Traditions Identification Methods
Traditional Chinese
Medicine
12 basic pulses, six on each wrist,
each linked to a different organ or
organs
Ayurvedic Medicine Rhythmic pattern of a patient’s
pulse - tridoshas
Ancient Egyptians
Medicine
Observed the pulse at different
locations of the body
Traditional Chinese
Medicine
Observed four characteristics of
the pulse: size, frequency,
strength and rhythm.
2.1. The Natural Constitution Features and Nadi-Patterns
In the Ayurvedic treatment ‘Prakrati Nidana’ is a term that describes the basic functional element of
physical, mental and emotional energy pattern called ‘Tridosha’ namely ‘Vatha’, ‘Pitta’ and ‘Kapha’. While
checking the pulse domain experts can reveal every aspect of the human organism, the Body, Mind etc.
While checking tridosha experts considering three parameters base on, size or volume of the pulse, number
or rapidity of the pulse and rhythm or regularity of the pulse
In the size and volume denotes the condition of blood vessel. Number and rhythm denotes the condition
and working of the heart. Kapha influenced more on size and volume of the blood vessel, Pitta influenced on
rapidity and Kapha influenced on regularity. However in the practical scenario identifying the Vada, Pitta
Kapha is a big deal to the new generation.
2.2. Pulse Diagnosis Technique
For the purpose of identifying the disease, the doctor with his hand should examine the pulse signal of
the patient from radial artery at wrist position. With a stable calm and concentrated mind, the doctor should
feel pulse with his fingertips. For female left hand give the accurate pulse readings, for men the right hand
gives the accurate pulse reading. Best period for pulse examination is in the first three hours (Prahara) of the
morning [2].
There are some particular restrictions and conditions while taking the pulse reading. Those who have just
taken bath, just taken food, just undergone snehana (oil massage or fat intake), having thirst and hunger and
who are asleep in these conditions specialists can’t be recognize pulse waves properly. While getting the
pulse reading experts need to consider some additional physical conditions of the patients and need to note
the general condition and habits of the patient facial expression, the reaction toward the climatic conditions,
appetite, strength, nature of sleep, breathing pattern history of ailments are need to confirm. According to
these factors experts can come to the conclusion of the diseases [1].
2.3. Previous Work
In the early researches researchers used various types of sensors to acquire the data. While testing and
going through with the literature reviews selecting sensors and designing the device is the most challenging
part in this research. Specific sensors are used and tested by many researchers. Such as: HMX-Pulse sensor,
Millivolt Output Pressure Transducer, Piezoelectric pulse diagnosis, Photoelectric sensor, piezoelectric
sensor and ultrasonic. HMX-Pulse sensor used by Ranjan and Mandeep (2013), in their research process,
they research on acquiring finger tips PPG signal. They mentioned in their work that, this system can
develop in future to acquire tridosha. Persis and Rani (2010) researched on modern pulsometer for capture
tridosha. This research was carried using Millivolt Output pressure sensor. Narayanan et.al (2015) and
A.E.Kalange et.al research on diagnosis Nadi using piezoelectric sensors and discovered piezoelectric
sensors are most suitable and sensible sensors to acquire Nadi [4].
27

3. Methodology
In this section, we describe the methodology of designing the pulse detecting system. As shown in the
Fig. 1, pulse diagnosis and prediction system that we designed.
And the details of the experimental methods used for detecting the human pulse and the circuits used for
signal conditioning have been given. Initial part of this research carries out the identification of the sensor.
Fig. 1: Overall design of our system
3.1. Sensor Selection
This research consists of many research components. One of the main researchable areas is selecting the
suitable sensor for the research and validates the possibility of developing the device. Acquiring pulse wave
is a challenging task. In this section we are going to analysis prior work related pulse acquisition, used
sensors and device setup.
Pulse detected on the radial artery, which is mainly related to the blood flow and heart rate of human
body. Pressure sensor is the most suitable sensor type to recognize pulse wave. However there are many
types of pulse sensors available. Such as Piezoresistive strain gauge, capacitive sensors, Electromagnetic
sensors, piezoelectric sensors, optical sensors etc [2]. While analyzing the previous work Piezoresistive
strain gauge sensors, piezoelectric sensors and optical sensors were used to capture pulse signal. Pulse can
be detected at various places. Within those pulse points’ fingertips, wrist point, neck points are more
sensitive points. Fingertip palpitation is not an exact point to capture Nadi palpitation.
Electrical and computational knowledge is essential to complete the product successfully. There are
various sensors available in the market related to medical usage. Such as Piezo-electric sensors, Infrared
Sensors , PVDF sensors, Acoustic sensors, Liquid sensors, Doppler sensors , Photo-electric sensors, Laser
and image sensors etc. These sensors are using for various usage. Combination of these sensors to produce a
maximum adoptable system will produce a positive result to the data capturing part. Here would like to
specify some main sensors and specialty of those sensors. Such as: Infrared Sensors (Accurate), PVDF
sensors (smaller but affected by temperature), Acoustic sensors (easily influenced by vibration) and Doppler
sensors (less accuracy).
Fig. 2: Grove piezoelectric vibration sensor dimension in mm
According to the domain analysis and literature review, we have identified ‘What we really need to
capture through the sensors’. The factor we need to consider while checking the patient is artery pulse
pressure. Since many pressure sensors available in the market, piezoelectric type sensor is the most suitable
28

for the ‘Nadi’ pressure identification. Piezoelectric sensors are used to capture the dynamic pressure changes
which can convert mechanical energy into the electronic energy form.
Grove-Piezo vibration sensor is the selected piezo electric sensor type for our research after analyzing
and testing various sensor types. Grove piezo vibration sensor’s special features are flexibility, vibration,
impact and touch sensitive type of sensor with 0.001Hz~1000MHz dimension, 0°C ~ 85°C Operating
Temperature, 0.625" dimension and 28 µm thickness. Fig. 2 shows the selected grove piezoelectric vibration
sensor’s dimension details. Reason for this sensor selection is Grove piezoelectric vibration sensors can be
used with wide frequency response, wide temperature range, wide dynamic range, adjustable sensitivity and
high receptivity for strong impact.
3.2. Design of the Device
According to the previous literature review and domain experts’ advice, we designed our device as a
wearable band. Flexible electronics is a new technology where the electronic circuit can mount and can use
as a flexible device, which also can work as printed circuit board. The problem we faced while setup using
flexible circuit board is to mount three sensors across the artery pulse. And hard identify the position and fix
in the correct place.
The wristband is the best suitable set up to fix the sensors and which can design as the standard product.
However, we couldn’t able to afford the cost of the wristband because of it found for an alternative
inexpensive solution.
Fig. 3: our system design
Circuit appended glove setup is another way to design the device. In glove setup, sensors can be fixed in
the three positions and, can use by a doctor to check the patient. However, the problem with the soft circuited
glove is doctors or tester’s pulse vibration, hand movement, and cells movement will affect the patient’s
pulse readings. This will cause inaccuracy in the reading. For the device design setup we selected Velcro
tape to fix the sensor and to acquire accurate readings. Fig. 3 shows the device we designed for the pulse
acquisition.
3.3. Data Acquisition
The details of the device experimental and setup methods used for detecting human Nadi readings and
the circuits used for signal conditioning are given below. In this system design, we can categorize the set up
into two different types.
1. Detecting the ‘Nadi’ position
2. Signal processing
Identifying the accurate Nadi position is one of the challenging tasks. Nadi positioning will deviate
person to person. For some people ‘Nadi’ position will be in the upper layer of the skin level and for some
people will in the deep level of the skin. In this research, we select the people with normal ‘Nadi’ positioning
to reduce the complexity and avoid the complexity in processing.
29

We got the domain experts help to capture the correct ‘Nadi’ position to proceed further data collection
part. Below image will describe the positions of the ‘Nadi’ respectively ‘Vada’, ‘Pitta’ and ‘Kapa’. The
Grove - Piezo Vibration Sensor have the advantage to detect the physical pressure change and convert into
the mechanical measurement when the pressure pressed in the wrist. The sensor is placed on the skin surface
over a palpable pulse. The ‘Nadi’ signals obtained from the Grove - Piezo Vibration Sensors are passed to
the signal processing circuitry. Since the sensor reading will be converted into the voltage reading using the
Arduino (Arduino reading between 0V to 5V). Fig. 4 will show the signal processing and ‘nadi’
identification system’s setup block diagram.
The physical signal of the ‘Vada’, ‘Pitta’, and ‘Kapha’ will captured using circuited three pressure
sensors. The reading will be converted using Arduino Uno where the input voltage is around 7V to 12V. The
sensor will fix into 50mA DC current for 3.3V pin.
Fig. 4: Block diagram of the Nadi identification
Arduino will provide the reading between (0- 1023) which need to be converted into the voltage.
Mathematically this can be shown as:
1
1023 5
Ardiuno reading (1)
5
1022Float voltage sensor Value X (2)
Converted reading will be pre-processed using Matlab. The output of the Arduino is connected to the
filter to filter out unwanted readings presented in the pulse wave. A low-pass filter is designed at the cut-off
frequency of 100Hz. The cut-off frequency is calculated by the following equation:
1
2f
RC (3)
Voltage to frequency conversion part can be design using hardware solution and software solution.
While analysing the hardware solution there are many voltage to frequency convertors available in the
market. (Crystal oscilloscope and other transducer) However in here we selected software solution to solve
this. Frequency conversion part is held using Fourier Transformation. In the readings around 50Hz of the
frequency was environmental noises. According to the literature analysis and the domain experts’ knowledge,
‘Nadi’ frequency ranges were provided. Vada (1.35Hz to 1.58 Hz), Pitta (1.16Hz to 1.33 Hz) and Kapha
(0.833Hz to 1.2 Hz) [4].
3.4. Pre-Processing
Pre-processing of the acquired signal is important as the received pulse signal may contain noises due to
the interaction of the pulse signal with the muscles, environmental noises during the time of signal acquiring.
Consequently, selecting and designing of the suitable filter to noise removal is an important step of pre-
processing module. In signal processing filters can be used to clear the waves and to obtain a de-noised and
smoothened wave. That may remove the unwanted components or features from a signal. For that we should
have an prior idea of what sort of noised and disturbances we meet in our scenario and what are the
frequencies does our signals belong to and then we can move towards a better filtration mechanism. The
Physical signal
from radial
artery
Capture using
three sensors
Convert the
reading into
voltage using Arduino
Filtering using
software filter
Convert into
the frequency
range
30
frequency ranges can be categorized in to several band-forms which consider the frequency bands the filters
should pass and which frequencies it should reject.
In this research, we are following software filtering techniques to remove noises. The software filter
designed is ‘Savitzky-Golay filter’, which can smooth the waves. Savitzky-Golay smoothing filters perform
much better than standard averaging FIR filters, which tend to filter out a significant portion of the signal's
high-frequency content along with the noise.
The following equation defines the general filter equation according to Savitzky-Golay. The particular
behaviour of the filter can be influenced by choosing appropriate filter coefficients.
1
2
1
2
1np
t i t inp
i
y a Xn
(4)
Savitzky-Golay filter is kind of low-pass filter, where k - degree of polynomial and f - frame size
parameters are considering while smoothing. Below graphic will describe how the smoothing and noise
removal function will occurring using Savitzky-Golay filter.
3.5. Feature Extraction and Pulse Detection
Acquired signal are exported in MATLAB using load command. Time and frequency domain features
are extracted using digital signal processing techniques. In here we used Fourier analysis technique to
convert the time and frequency domain. Nadi frequency is measured using the power spectrum of the signal.
The peak value of the power spectrum is considered as the frequency of that Nadi signal. Through the feature
extraction ‘Vada’, ‘Pitta’, ‘Kapha’ Nadi patterns will be extracted separately and validate the nadi patterns
using the predefined nadi pattern styles and frequency range.
4. Result
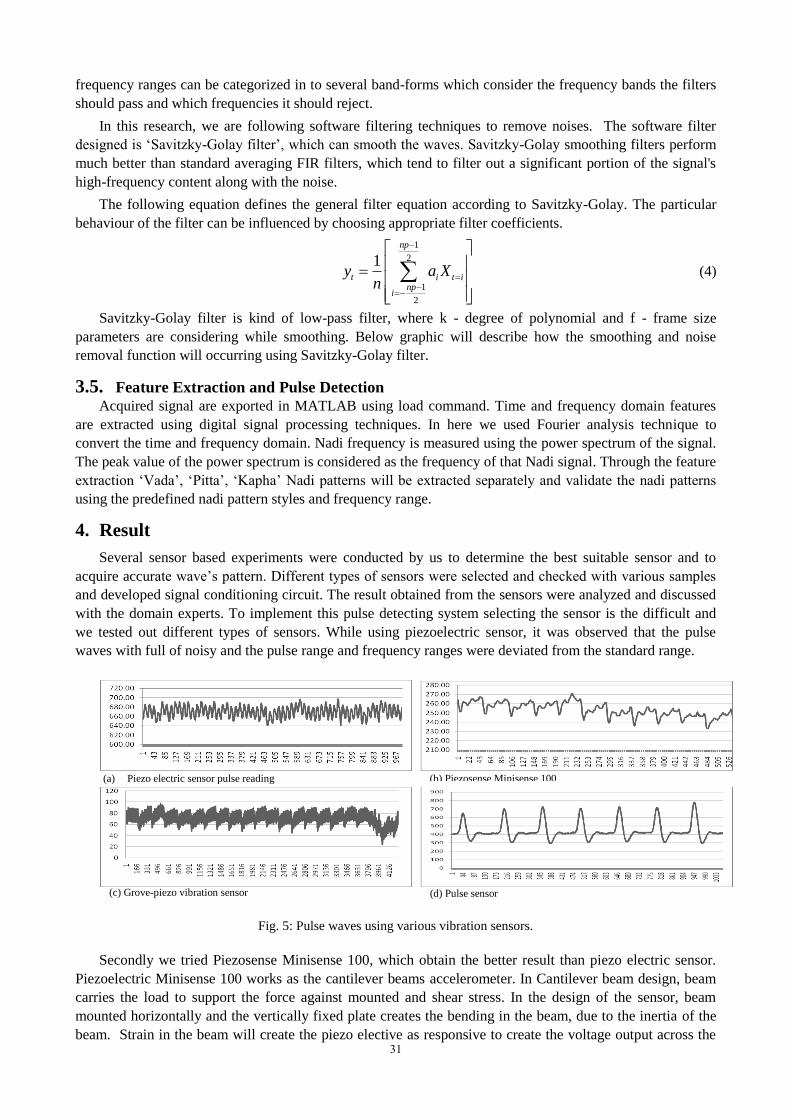
Several sensor based experiments were conducted by us to determine the best suitable sensor and to
acquire accurate wave’s pattern. Different types of sensors were selected and checked with various samples
and developed signal conditioning circuit. The result obtained from the sensors were analyzed and discussed
with the domain experts. To implement this pulse detecting system selecting the sensor is the difficult and
we tested out different types of sensors. While using piezoelectric sensor, it was observed that the pulse
waves with full of noisy and the pulse range and frequency ranges were deviated from the standard range.
Fig. 5: Pulse waves using various vibration sensors.
Secondly we tried Piezosense Minisense 100, which obtain the better result than piezo electric sensor.
Piezoelectric Minisense 100 works as the cantilever beams accelerometer. In Cantilever beam design, beam
carries the load to support the force against mounted and shear stress. In the design of the sensor, beam
mounted horizontally and the vertically fixed plate creates the bending in the beam, due to the inertia of the
beam. Strain in the beam will create the piezo elective as responsive to create the voltage output across the
(b) Piezosense Minisense 100
(a) Piezo electric sensor pulse reading
(c) Grove-piezo vibration sensor
(d) Pulse sensor
31

electrodes of the sensor. Piezo electric Minisense 100 is high responsive to the outside vibrations. The
sensitivity of the sensor and the responsive to the frequency change will effect higher in the result. In the real
environment, while checking with the pulse waves, environment factors influencing very higher in the result
because ‘Nadi’ frequency range is between 0.833Hz to 1.58 Hz [piezoelectric sensor for human pulse
detection]. Environment frequency range is above 50 Hz.
Pulse sensor is the market available sensor which cost higher. Pulse sensor’s reading and the out is
systematic and clear output. However price rate very higher than Grove piezo electric vibration sensor.
Grove piezoelectric vibration sensor is high sensitive and flexible to capture the pulse reading throughout the
research. Main Advantage is the design of the sensor. Grove piezoelectric sensor designed as the flexible
component comprising a 28 µm thick piezoelectric PVDF polymer film with screen-printed Ag-ink
electrodes laminated to a 0.125 mm polyester substrate and fitted with two crimped contacts. Hence, the
design pattern helped to be flexible to get a proper reading which data acquiring. In addition to that it is less
affected by the environmental effects when compared to Minisense 100. The main reason for this deviation is
Minisense 100 is more sensitivity than Grove piezoelectric sensor. Fig. 5 shows the obtained results using
various sensor type used for research.
Through the analysis finally identified that Grove-piezo vibration sensor is most suitable for developing
the device. Fig. 6 will provide the data collected samples using the Grove-piezo vibration sensor for Vada
Nadi pulse pattern.
Fig. 6: Result of the grove piezoelectric vibration sensor
5. Discussion
Our system designed to obtain the Ayurvedic traditional medicine waves patterns respectively Vada,
Pitta and Kapha. In this research paper we will discuss on designing the device with suitable sensor and
obtain the accurate wave pattern. This research contain the component of selecting best sensor, selecting
best design type to get optimum accurate result and best suitable mechanism to capture the waves pattern.
5.1. Comparison with Earlier Systems’ Sensor Selection
When comparing these sensors type and devices with our system, HMX-Pulse sensor used for finger tips
PPG signal. While using HMX-Pulse sensor for fingertip palpitation signal detection, they used
Photoplethysmogram transducer to operate with PPG100C amplifiers to record blood volume pulse waves.
In here mainly they used optical pressure sensors TSD200 PPG. The high-level functionality of these
processes is TSD200 transducer consist infrared emitter and photodiode detector which transmit the changes
in infrared reflection according to changing blood flow. HMX pulse sensor was used in this system, which
works as strain cantilever beam transducer.
Due to the Haemoglobin (Hg) in the blood, infrared light wavelength highly reflects. When the
transducer fixed near the capillaries, emitter and detector will change according to the capillary blood change.
Above mentioned method is one of the techniques used to capture the pulse waves. However in that research,
researcher captured only the pulse waves and analysed the pulse changes in the finger tips. In this research,
researchers considering acquiring the pulse waves from the finger tips are the best place. But in our research
we considering wrist as the best suitable place to acquire the pulse waves to obtain the Vada, Pitta and Kapha
waves. According to this research they designed a data acquisition system called “MP150 Kit” integrated
with PPG sensor and MP150 Biopac system. ‘MP150 kit’ introduced by Biopac System, Inc. Which can use
(a) Pulse wave pattern of sample 1
(b) Pulse wave pattern of sample 2
32

for Ethernet-ready data acquisition and analysis, record multiple channels with differing sample rates and
record at speeds up to 400 kHz.
Problem with this system is couldn’t acquire tridosha separately. Millivolt Output pressure is another
sensor to capture signal. Millivolt output pressure sensors have no amplifiers, filters, transistors or any other
active component which works under highest frequency response and lowest power consumption. In this
research researcher used three Millivolt output pressure sensors and mounted in the wrist and used NI USB-
6210 data acquisition card. Millivolt output pressure sensor is kind of strain gauge transducer.
Using piezoelectric transducer pulse signal can be obtained and researchers researched on the usability of
it as mentioned in previous section. Piezoelectric transducer is place on the skin and skin passed through a
signal processing. Position of the pulse is identified and adjusts to obtain appropriate pulse waves. Fig. 7
describes the pulse detection system using digital storage oscilloscope in their research.
Fig. 7: Block diagram of pulse detection system using Digital storage oscilloscope
According to these sensors used by different researchers, some of the sensors are working under the old
technologies. However we identified piezoelectric sensors is the best suit for these kinds of researches while
other sensors are good with some other specialties. Combining of these different types of sensors and
produce a multi model sensor is the efficient and accurate to obtain proper result.
5.2. Comparison with Device Designing
Design of the device is also has a very high impact on this study. There we have to consider about how
the sensors contact wrist to derive radial pulse data while reducing noise, how sensors are attached to the
device and the ease of use. In almost all the studies they have placed the pulse sensors side-by-side without
contacting one another over the radial artery in the position of the fingers Inch opening of wrist. According
to the literature the most appropriate touching area of the pulse sensor should be 30 mm for the trade-off in
repeatability and sensitivity [5].
In the context of the methods that attaches the pulse sensor to the wrist we found few options that have
been considered by other researchers. Most of the researchers have used the belt, as it is easy to fix and has
less deviation. And few researches have been conducted using a glove that can worn by the clinicians to feel
the patients pulse with three sensors attached to three fingers. But in here pulse waves acquired can be easily
influenced by the unstable finger contact pressure and noise and the pulse of the clinician. Other two
methods are rack-pinion and Electrodes [5]. Compared to other methods they are difficult to fix,
uncomfortable and has more deviation. To obtain correct pulse patterns stable and even pressure should be
provided on the sensors which placed on correct positions of wrist radial artery. In above designs they have
used few methods to apply pressure. In rack method those researchers have used copper disks incrementally
up to 20g. In glove clinician apply the pressure but that is unstable and can’t guarantee the same pressure on
all three sensors [5]. Appling pressure by using small size sphygmomanometer cuff [3], Inflated by the air
sent through an elastic tube is a better method. However, the high pressure of the cuff would produce
negative consequences such as the blood flow in the vein might congest. So according to the literature using
mechanical screw or Velcro tape [6] on belt and increase the pressure gradually is more successful. Then to
digitize the electrical signal obtained proportional to the pulse waveform signal in ‘Nadi Tarangini’ they
have used a 16-bit multifunction data acquisition card (NI USB-6210) [7]. In another study conducted in
India used an Arduino Uno for this task [8].
Comparing all these devices most of the devices are designed as wearable device and some of them are
designed as doctor wearable device. Wearable device designed by University of Peradeniya Electronic 33

Engineering students. In there the device was designed as doctor wearable device. The problem with that
device is less accuracy and the system obtains doctor’s pulse vibration too. With these analyses we designed
a device of patient wearable. In the device to reduce noises and increase interfere between skin and sensor,
used Velcro tape wearable bands shown in Figure.3.
6. Conclusion
Hence it can be concluded that “Nadi pareeksha” gives a new direction for the doctors for the detection
of diseases in early stages. If it is properly applied for the detection of various diseases like diabetic and
cancer, detection accuracy improves and as a result most of the people who are suffering from these diseases
can be cured in early stages.
But there are only very few researches done in traditional medical field due to lack of experts, domain
knowledge, and generation gap. Within those limited research up to now there are no workable commercial
products available in the world market. Still all systems are in the research level.
So in here we have tried to design a suitable sensor based pulse detection system which works on the
principle of Traditional Ayurveda Medicine. The diagnosis of a disease depends on certain specific
parameters like blood viscosity, blood volume, etc. So according to our study these parameters can be
analyzed better by a specific kind of sensor rather than any sensor. Up to now we have done sensor selection
and came up to the level of identification of pulse patterns. In future we expect to extend this research to
identify diseases using pre-identified wave patterns.
7. Future Work
Currently using our device can decompose the pulse into three components Vada, Pitta and Kappa
according to the Ayurvedic principles. We are working on to automate the diagnose diseases by identifying
the pulse patterns in the human body using Ayurvedic Nadi Pareeksha principles. And identify Diabetics
type 2 according to the different patterns and combinations of the Nadi: Vada, Pita and Kappa as our future
work.
8. References
[1] "Nadi Pariksha," in Ayurveda Amrutanam, Ayurveda Amrutanam. [Online]. Available:
http://ayurveda4all.weebly.com/nadi-pariksha.html. Accessed: Aug. 12, 2016.
[2] “WHAT IS NADI PARIKSHA (Ayurvedic Pulse Diagnosis),” AYURVEDANTAYOGA by NADI VAIDYA
RAVISHANKAR KRISHNAMURTHY, 2009. [Online]. Available:
https://ayurvedantayoga.wordpress.com/2009/03/15/what-is-nadi-pariksha/. [Accessed: 13-Aug-2016].
[3] A. E. Kalange and S. A. Gangal, "Piezoelectric sensor for human pulse detection," Defence Science Journal, vol.
57, no. 1, pp. 109–114, Jan. 2007.
[4] “Pressure Sensors,” EngineersGarage, 2012. [Online]. Available:
http://www.engineersgarage.com/articles/pressure-sensors-types-working. [Accessed: 13-Jul-2016].
[5] L. Xu, M. Q. Meng, C. Shi, K. Wang, and N. Li, "Quantitative analyses of pulse images in traditional Chinese
medicine," Medical Acupuncture, vol. 20, no. 3, pp. 175–189, Aug. 2008.
[6] D. Gaddam et al., "A Survey on Nadi Pareeksha for Early Detection of Several Diseases & Computational Models
using Nadi Patterns," International Journal of Computer Science and Information Technologies, vol. 6, no. 4, pp.
3424–3425, 2015.
[7] A. Joshi, A. Kulkarni, S. Chandran, J. V. K, and K. B. D, "Nadi Tarangini: A Pulse Based Diagnostic System,"
Annual International Conference of the IEEE Engineering in Medicine and Biology Society(EMBC), vol. 29, pp.
2207–2210, Aug. 2007.
[8] R. N, J. M. Shivaram, and Shridhar, "Design development of a system for Nadi Pariksha," International Journal of
Engineering Research and, vol. 4, no. 06, Jun. 2015.
34