biomedical discovery through data mining and …€¦ · biomedical discovery through data mining...
TRANSCRIPT

Biomedical Discovery through Data Mining and Data Science
Nicholas P. Tatonetti, PhD Columbia University
November 14th, 2016

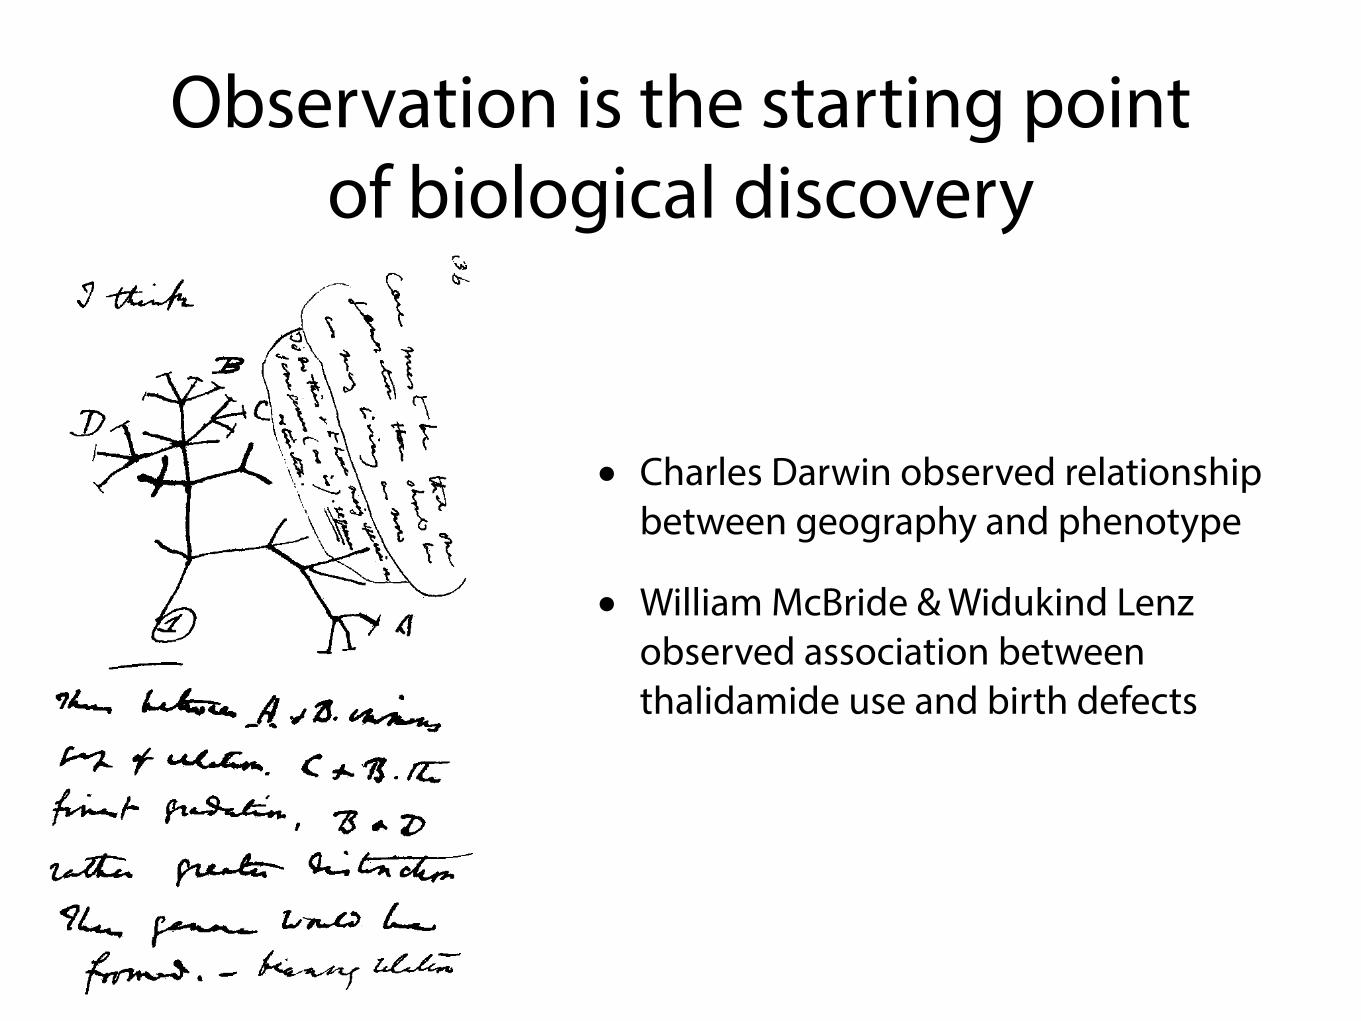
Observation is the starting point of biological discovery

Observation is the starting point of biological discovery
• Charles Darwin observed relationship between geography and phenotype
Observation is the starting point of biological discovery
• Charles Darwin observed relationship between geography and phenotype
• William McBride & Widukind Lenz observed association between thalidamide use and birth defects

The tools of observation are advancing

The tools of observation are advancing
• Human senses
The tools of observation are advancing
• Human senses
• sight, touch, hearing, smell, taste

The tools of observation are advancing
• Human senses
• sight, touch, hearing, smell, taste
• Mechanical augmentation

The tools of observation are advancing
• Human senses
• sight, touch, hearing, smell, taste
• Mechanical augmentation
• binoculars, telescopes, microscopes, microphones

The tools of observation are advancing
• Human senses
• sight, touch, hearing, smell, taste
• Mechanical augmentation
• binoculars, telescopes, microscopes, microphones
• Chemical and Biological augmentations

The tools of observation are advancing
• Human senses
• sight, touch, hearing, smell, taste
• Mechanical augmentation
• binoculars, telescopes, microscopes, microphones
• Chemical and Biological augmentations
• chemical screening, microarrays, high throughput sequencing technology

The tools of observation are advancing
• Human senses
• sight, touch, hearing, smell, taste
• Mechanical augmentation
• binoculars, telescopes, microscopes, microphones
• Chemical and Biological augmentations
• chemical screening, microarrays, high throughput sequencing technology
• What’s next?
Bytes to KB
Megabytes to Terabytes

Your doctor is observing you like never before
>99% of Hospitals have Electronic Health Records

Every drug order is an experiment.

Observation analysis in a petabyte world
Observation analysis in a petabyte world
• Darwin, McBride, and Lenz were working with kilobytes of data

Observation analysis in a petabyte world
• Darwin, McBride, and Lenz were working with kilobytes of data
• Today’s scientists are observing terabytes and petabytes of data

Observation analysis in a petabyte world
• Darwin, McBride, and Lenz were working with kilobytes of data
• Today’s scientists are observing terabytes and petabytes of data
• The human mind simply cannot make sense of that much information

Observation analysis in a petabyte world
• Darwin, McBride, and Lenz were working with kilobytes of data
• Today’s scientists are observing terabytes and petabytes of data
• The human mind simply cannot make sense of that much information
• Data mining is about making the tools of data analysis (“hypothesis generation”) catch up to the tools of observation

But, there’s a problem…

Bias confounds observations

Let’s focus on just one example...

Let’s focus on just one example...
Drug-Drug Interactions

Drug-drug interactions (DDIs)
Drug-drug interactions (DDIs)
• DDIs can occur when a patient takes 2 or more drugs

Drug-drug interactions (DDIs)
• DDIs can occur when a patient takes 2 or more drugs
• DDIs cause unexpected side effects

Drug-drug interactions (DDIs)
• DDIs can occur when a patient takes 2 or more drugs
• DDIs cause unexpected side effects
• 10-30% of adverse drug events are attributed to DDIs

Drug-drug interactions (DDIs)
• DDIs can occur when a patient takes 2 or more drugs
• DDIs cause unexpected side effects
• 10-30% of adverse drug events are attributed to DDIs
• Understanding of DDIs may lead to better outcomes

Drug-drug interactions (DDIs)
• DDIs can occur when a patient takes 2 or more drugs
• DDIs cause unexpected side effects
• 10-30% of adverse drug events are attributed to DDIs
• Understanding of DDIs may lead to better outcomes
• precaution in prescription

Drug-drug interactions (DDIs)
• DDIs can occur when a patient takes 2 or more drugs
• DDIs cause unexpected side effects
• 10-30% of adverse drug events are attributed to DDIs
• Understanding of DDIs may lead to better outcomes
• precaution in prescription
• synergistic therapies
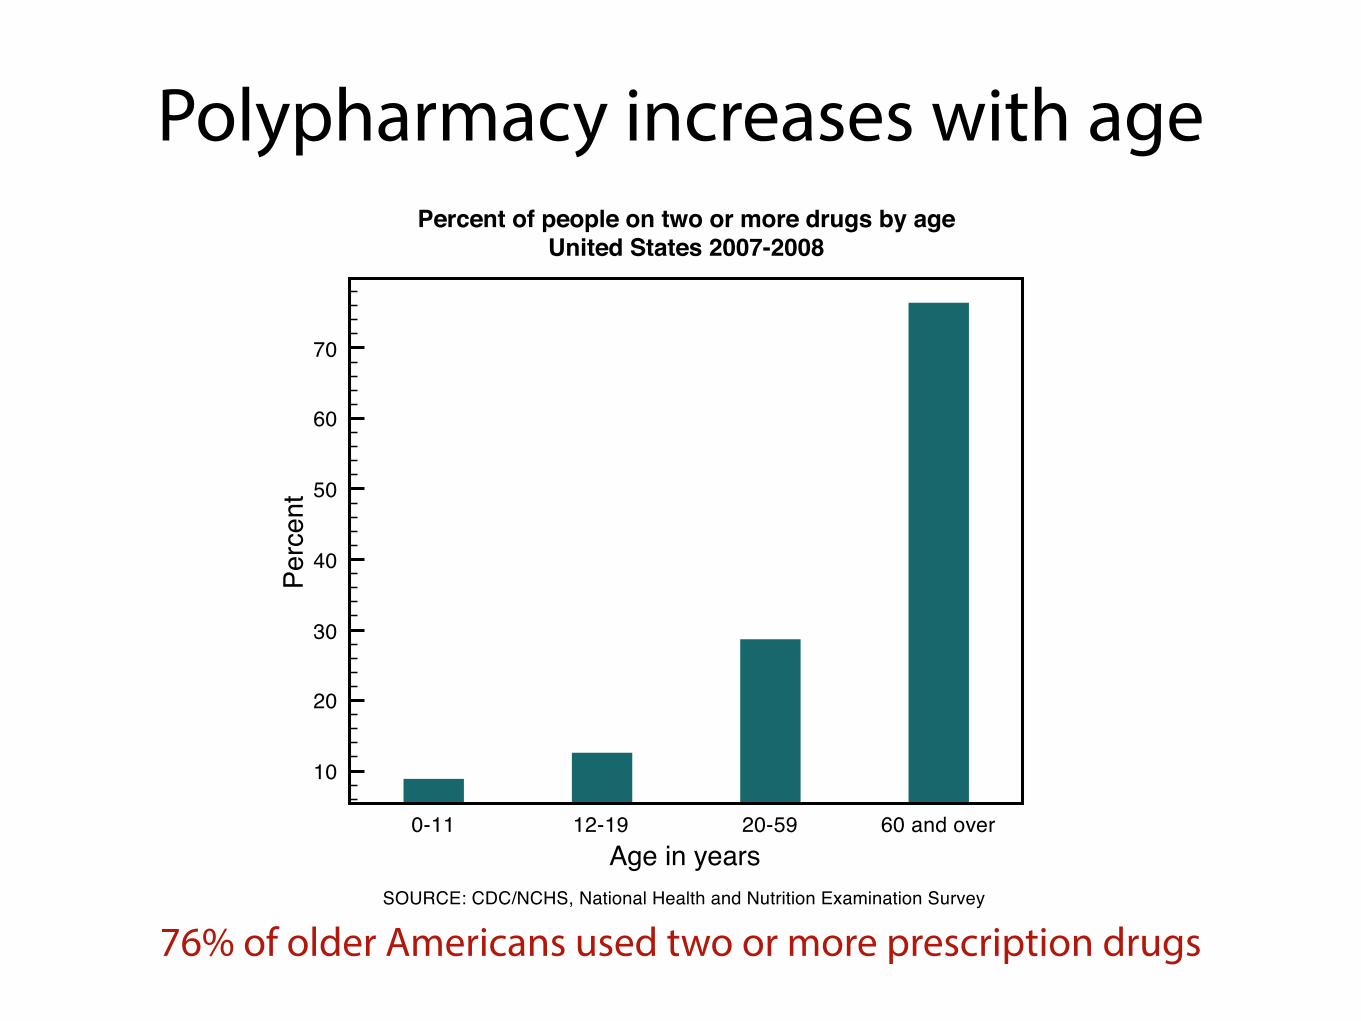
Polypharmacy increases with age
76% of older Americans used two or more prescription drugs
0-11 12-19 20-59 60 and overAge in years
10
20
30
40
50
60
70
Perc
ent
Percent of people on two or more drugs by ageUnited States 2007-2008
SOURCE: CDC/NCHS, National Health and Nutrition Examination Survey

More needs to be done to understand and identify drug-drug interactions

More needs to be done to understand and identify drug-drug interactions
• Clinical trials do not typically investigate drug-drug interactions

More needs to be done to understand and identify drug-drug interactions
• Clinical trials do not typically investigate drug-drug interactions
• Observational studies are the only systematic way to detect drug-drug interactions
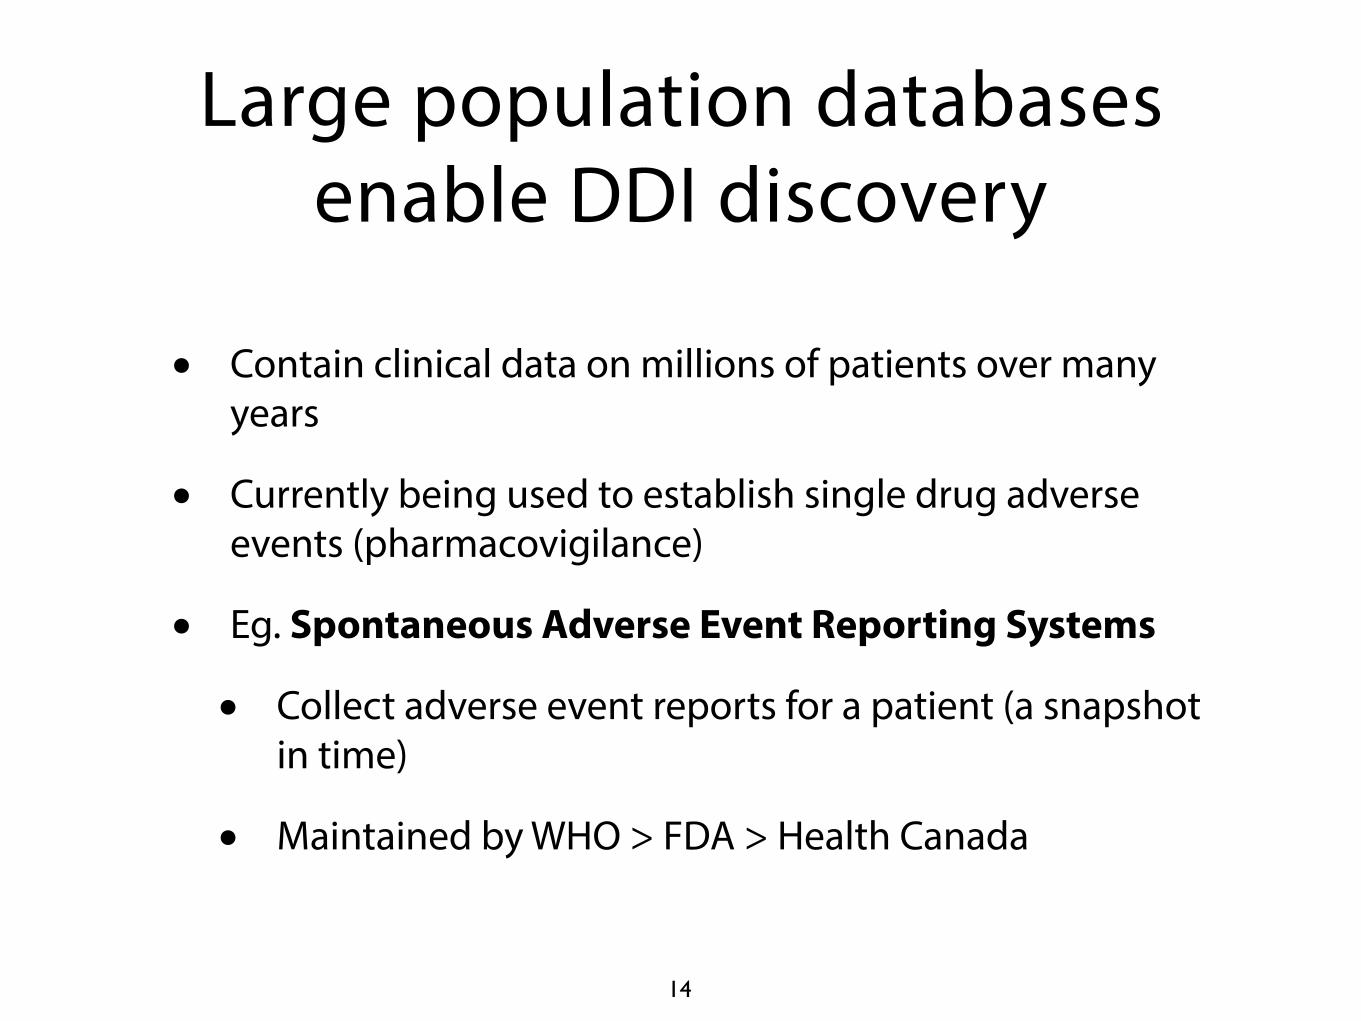
Large population databases enable DDI discovery
• Contain clinical data on millions of patients over many years
• Currently being used to establish single drug adverse events (pharmacovigilance)
• Eg. Spontaneous Adverse Event Reporting Systems
• Collect adverse event reports for a patient (a snapshot in time)
• Maintained by WHO > FDA > Health Canada
14

Observational data are messy
Adverse Events
ACUTE RESP. DISTRESS
ANEMIA
DECR. BLOOD PRESSURE
CARDIAC FAILURE
DEHYDRATION
Drugs
METFORMIN
ROSIGLITAZONE
PRAVASTATIN
TACROLIMUS
PREDNISOLONE
15
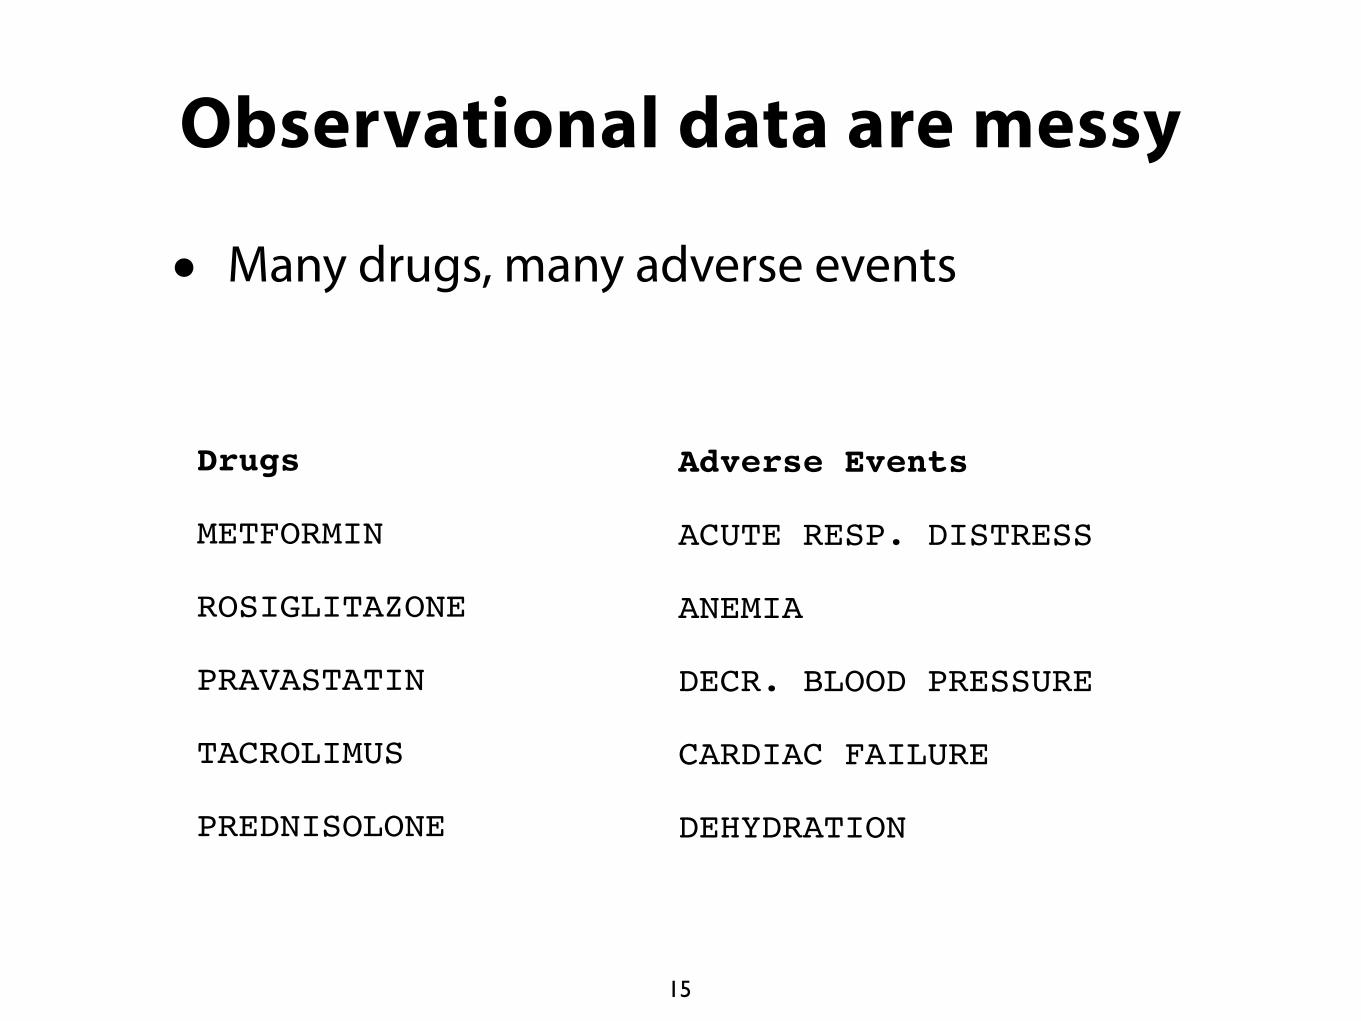
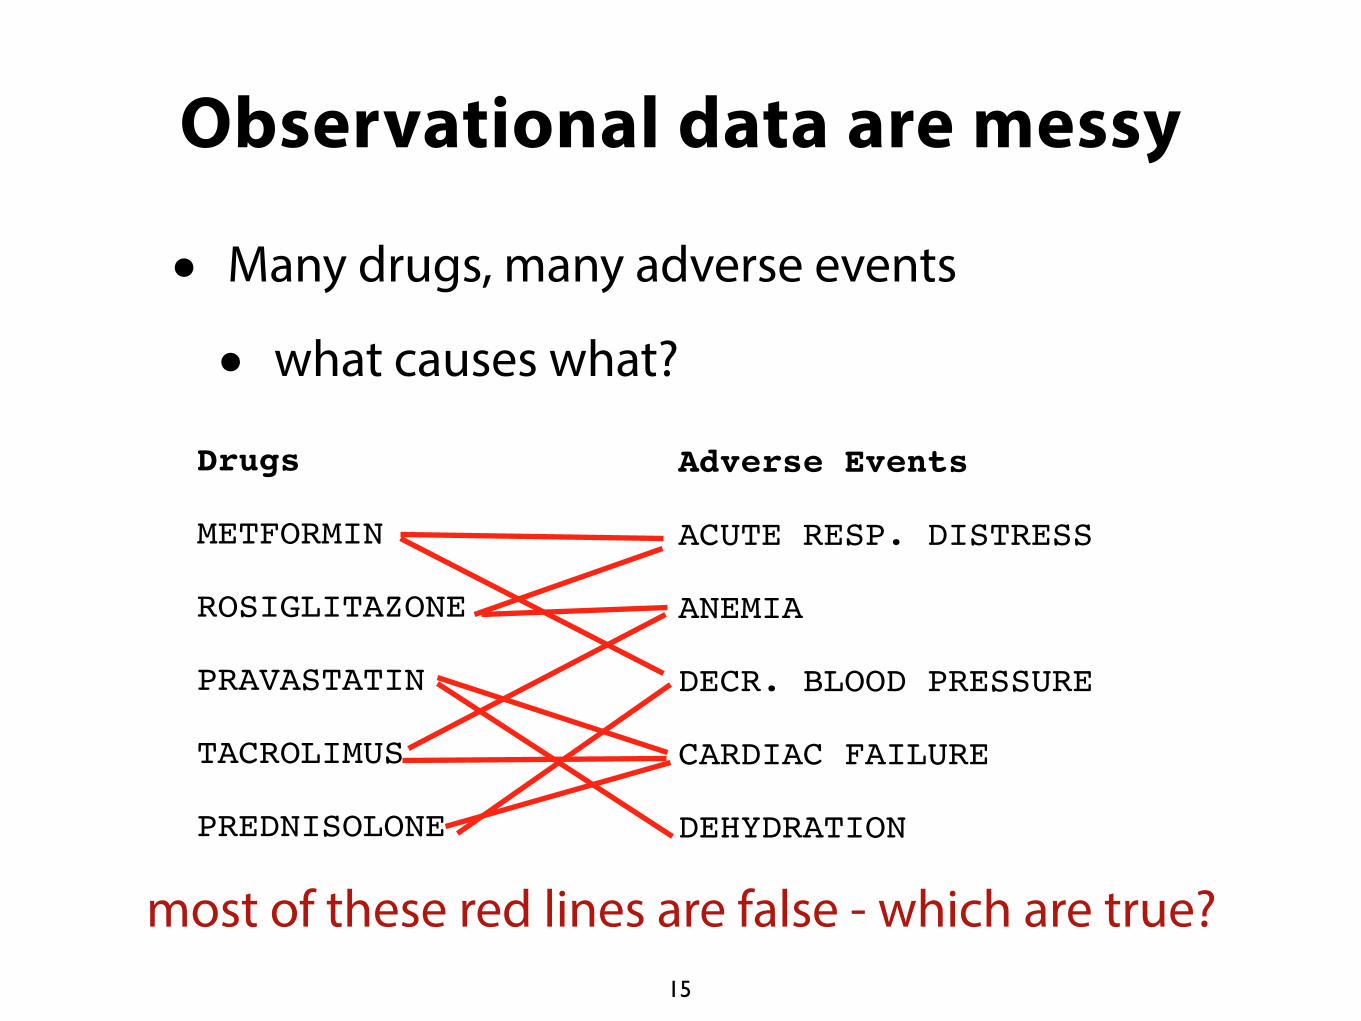
Observational data are messy
• Many drugs, many adverse events
Adverse Events
ACUTE RESP. DISTRESS
ANEMIA
DECR. BLOOD PRESSURE
CARDIAC FAILURE
DEHYDRATION
Drugs
METFORMIN
ROSIGLITAZONE
PRAVASTATIN
TACROLIMUS
PREDNISOLONE
15
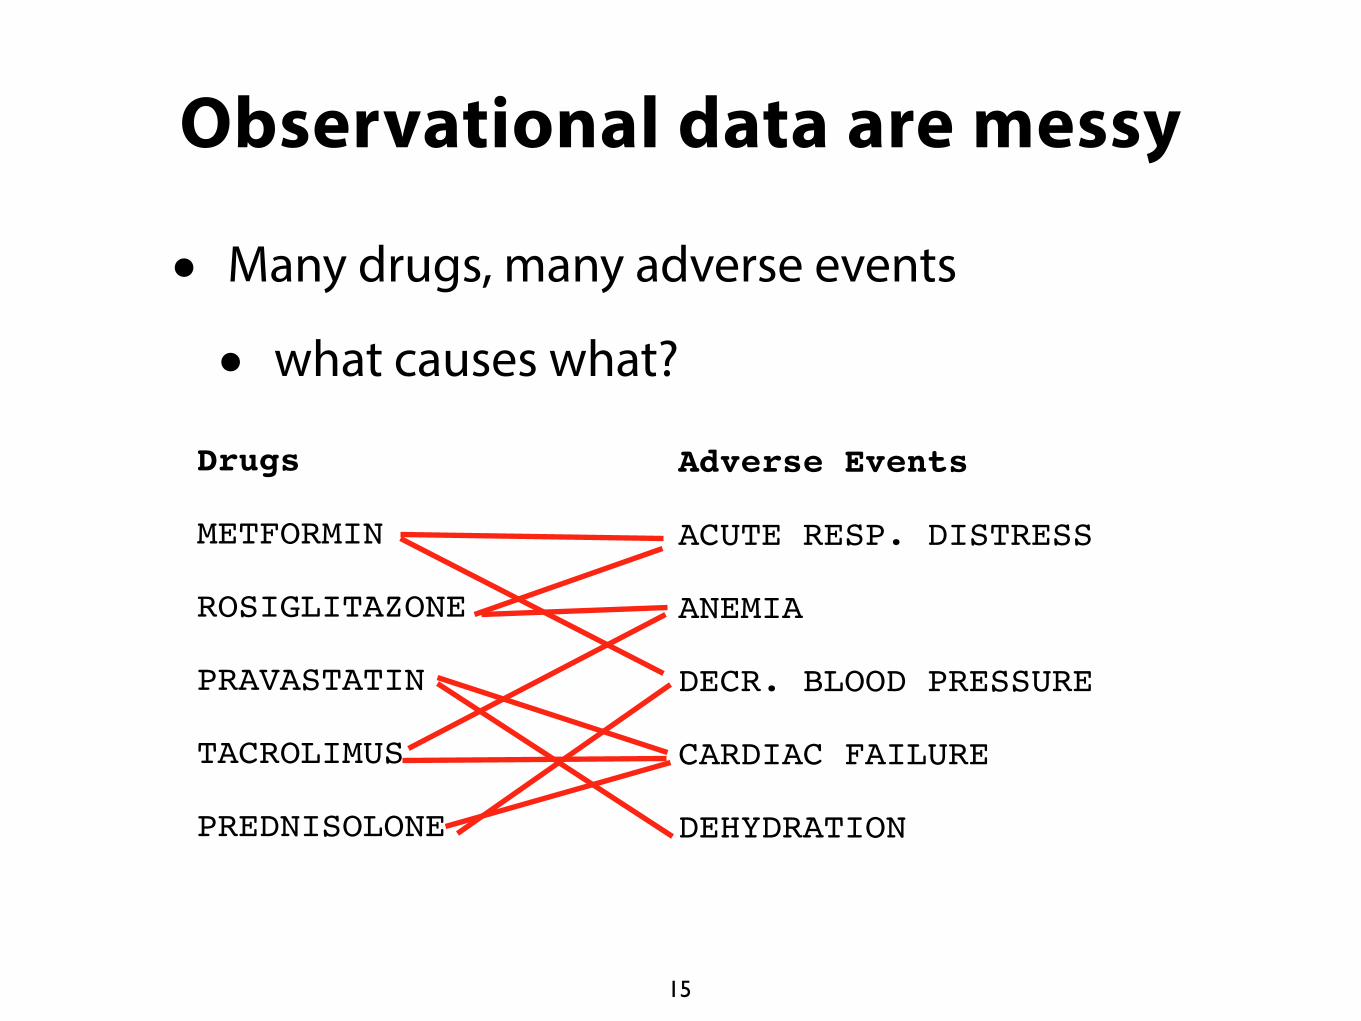
Observational data are messy
• Many drugs, many adverse events
• what causes what?
Adverse Events
ACUTE RESP. DISTRESS
ANEMIA
DECR. BLOOD PRESSURE
CARDIAC FAILURE
DEHYDRATION
Drugs
METFORMIN
ROSIGLITAZONE
PRAVASTATIN
TACROLIMUS
PREDNISOLONE
15
Observational data are messy
• Many drugs, many adverse events
• what causes what?
Adverse Events
ACUTE RESP. DISTRESS
ANEMIA
DECR. BLOOD PRESSURE
CARDIAC FAILURE
DEHYDRATION
Drugs
METFORMIN
ROSIGLITAZONE
PRAVASTATIN
TACROLIMUS
PREDNISOLONE
15
most of these red lines are false - which are true?

Observational data are confounded
16
• Spontaneous reporting systems are observational data sets (unknown biases)
• noise from concomitant drug use (co-Rx effect)
• drugs co-prescribed with Vioxx more likely to be associated with heart attacks
• noise from indications (indication-effect)
• drugs given to diabetics more likely to be associated with hyperglycemia

SCRUB Statistical CorRection of Uncharacterized Bias
• Implicitly corrects for confounding of both observed and missing variables
• Assumes some combination of the drugs and indications describes the patient covariates
• Only works on very large data sets
N. Tatonetti et al., Science Translational Medicine (2012)

0 5 10 15 20Proportional Reporting Ratio
disopyramide
dofetilide
sotalol
flecainide
propafenone
amiodarone
diltiazem
mexiletine
verapamil
quinidine
lidocaine
tirofiban
hydroxyzine
Anti-arrhythmics and Arrhythmia
Method corrects for indication biases

0 5 10 15 20Proportional Reporting Ratio
disopyramide
dofetilide
sotalol
flecainide
propafenone
amiodarone
diltiazem
mexiletine
verapamil
quinidine
lidocaine
tirofiban
hydroxyzine
Anti-arrhythmics and Arrhythmia
0 5 10 15 20Proportional Reporting Ratio
disopyramide
dofetilide
sotalol
flecainide
propafenone
amiodarone
diltiazem
mexiletine
verapamil
quinidine
lidocaine
tirofiban
hydroxyzineOriginal PRRCorrected PRR
Anti-arrhythmics and Arrhythmia
Method corrects for indication biases

Implicit correction of age differences in exposed vs non-exposed
-40 -20 0 20 40(Average Age of Cases) - (Average Age of Controls)
zanamivirmemantine
atomoxetinerivastigmine
actinomycin Dgalantamine
ethosuximidedonepezil
6-thioguaninebicalutamideretinoic acid
flutamidemethylphenidate
verteporfinthiotepa
acenocoumarolPGE2
darifenacinN-butyldeoxynojirimycin
amiodarone
OriginalCorrected
Bias, corrected. Missing data?
If there are no observations then no associations can be found.

Diseases can be identified by the side effects they elicit
21

Diseases can be identified by the side effects they elicit
Diabetes
21
Diseases can be identified by the side effects they elicit
Diabetes
level of detection
21

Diseases can be identified by the side effects they elicit
Diabetes
level of detection
unmeasuredsevere effect
21

Diseases can be identified by the side effects they elicit
Diabetes
level of detection
unmeasuredsevere effect
measuredminor effects
21

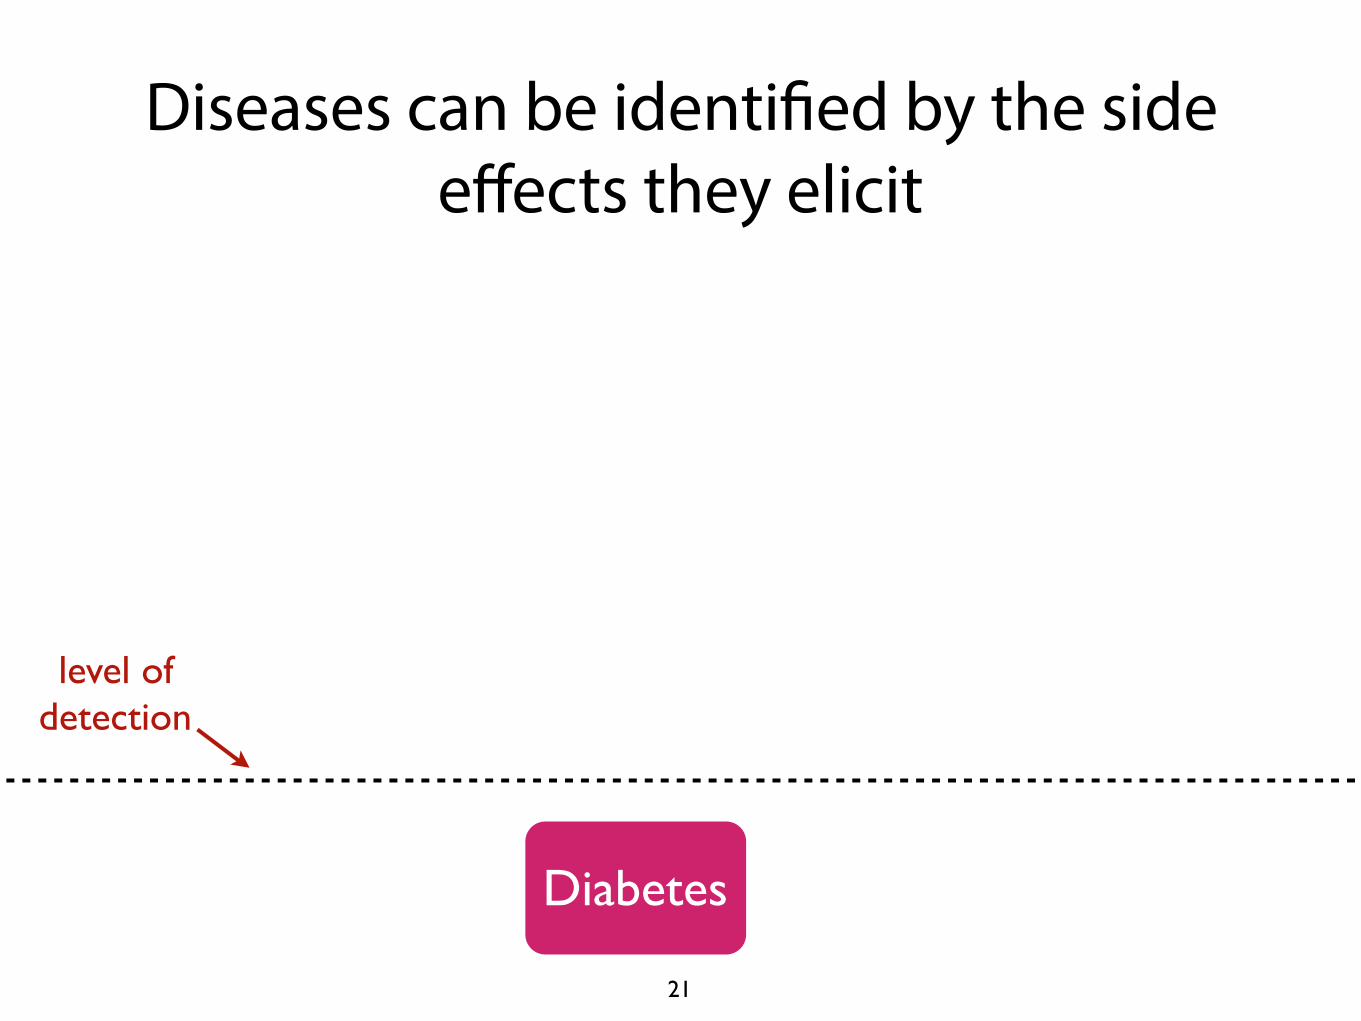
Diseases can be identified by the side effects they elicit
Diabetes
level of detection
unmeasuredsevere effect
measuredminor effects
• physicians use observable side effects to form hypothesis about the underlying disease
21

Diseases can be identified by the side effects they elicit
Diabetes
level of detection
unmeasuredsevere effect
measuredminor effects
• physicians use observable side effects to form hypothesis about the underlying disease
• e.g. you can’t see diabetes, but you can measure blood glucose
21

Severe ADE’s can be identified by the presence of more minor (and more common) side effects
Adverse Event
level of detection
unmeasuredsevere effect
measuredminor effects
22

Severe ADE’s can be identified by the presence of more minor (and more common) side effects
Adverse Event
level of detection
unmeasuredsevere effect
measuredminor effects
• First, identify the common side effects that are harbingers for the underlying severe AE
22

Severe ADE’s can be identified by the presence of more minor (and more common) side effects
Adverse Event
level of detection
unmeasuredsevere effect
measuredminor effects
• First, identify the common side effects that are harbingers for the underlying severe AE
• Then, combine these side effects together to form an “effect profile” for an adverse event
22

T2DM
Increased Blood
Glucose
PainNumbness
level of detection
unmeasuredsevere effect
Severe ADEs can be identified by the presence of more minor (and more common) side effects
measuredminor effects
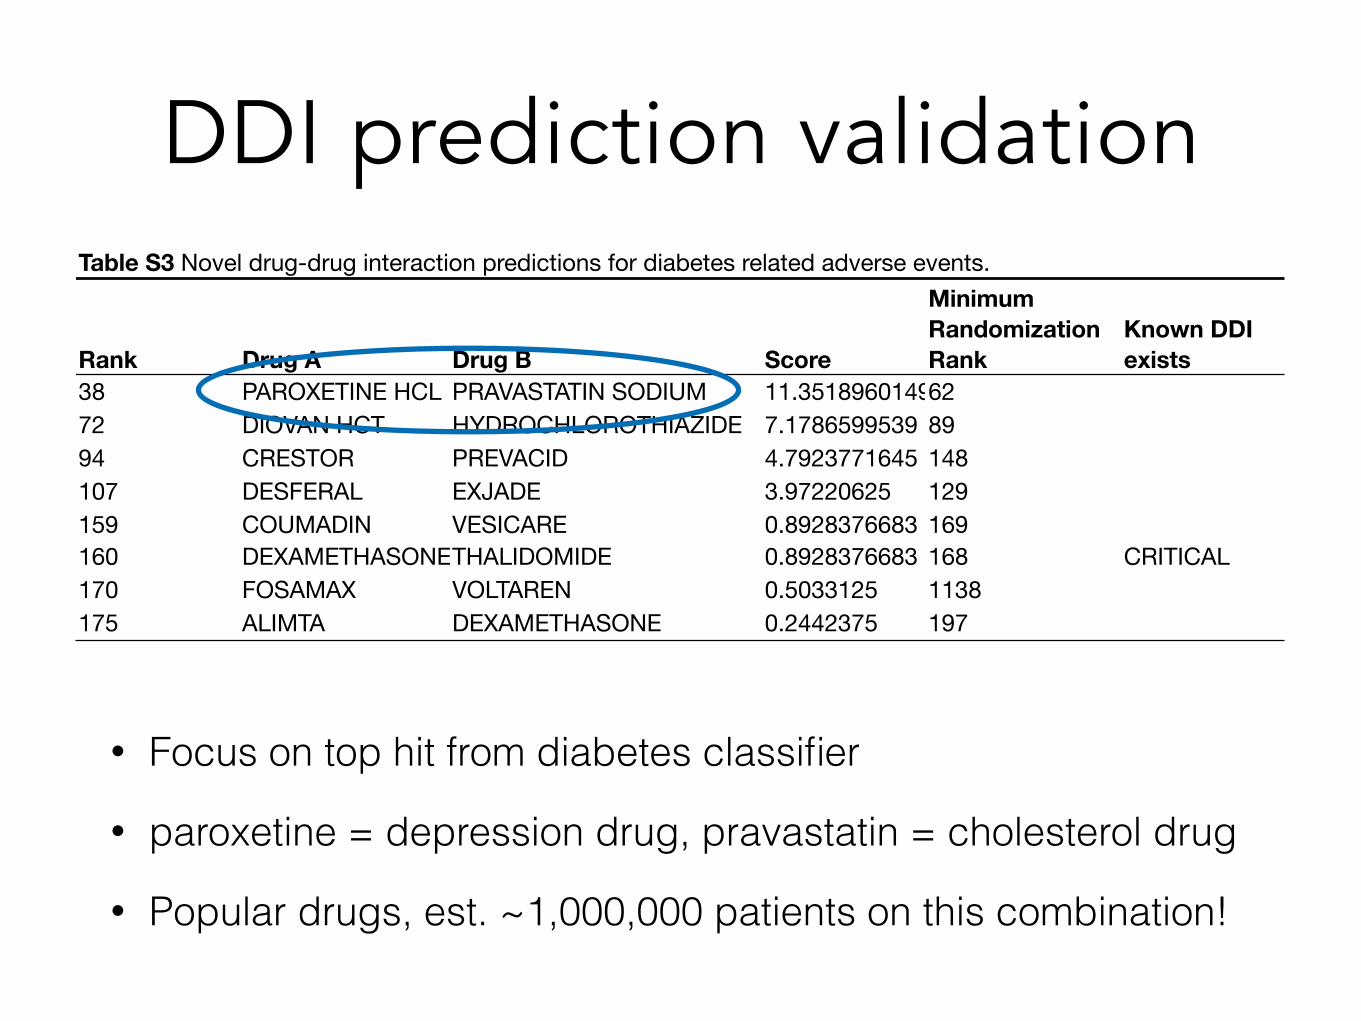
DDI prediction validationTable S3 Novel drug-drug interaction predictions for diabetes related adverse events.
Rank Drug A Drug B Score
Minimum Randomization Rank
Known DDI exists
38 PAROXETINE HCL PRAVASTATIN SODIUM 11.35189601496272 DIOVAN HCT HYDROCHLOROTHIAZIDE 7.1786599539 8994 CRESTOR PREVACID 4.7923771645 148107 DESFERAL EXJADE 3.97220625 129159 COUMADIN VESICARE 0.8928376683 169160 DEXAMETHASONETHALIDOMIDE 0.8928376683 168 CRITICAL170 FOSAMAX VOLTAREN 0.5033125 1138175 ALIMTA DEXAMETHASONE 0.2442375 197
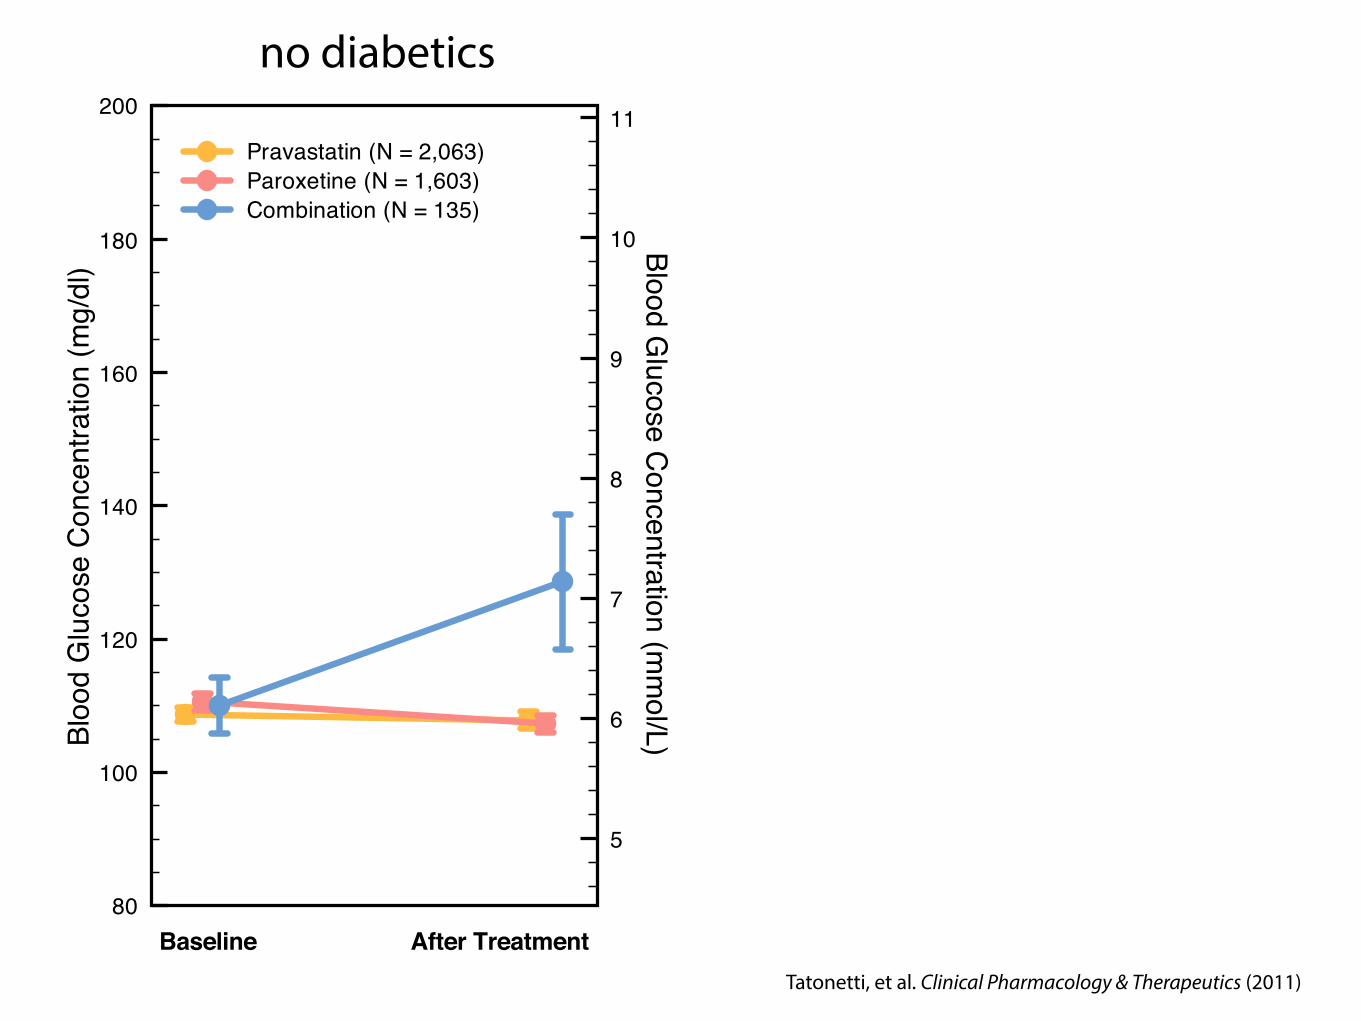
• Focus on top hit from diabetes classifier
• paroxetine = depression drug, pravastatin = cholesterol drug
• Popular drugs, est. ~1,000,000 patients on this combination!

Analyzed blood glucose values for patients on either or both of these drugs
To the electronic health records…

80
100
120
140
160
180
200
Bloo
d G
luco
se C
once
ntra
tion
(mg/
dl)
5
6
7
8
9
10
11
Blood Glucose C
oncentration (mm
ol/L)
Pravastatin (N = 2,063)
Baseline After TreatmentTatonetti, et al. Clinical Pharmacology & Therapeutics (2011)

80
100
120
140
160
180
200
Bloo
d G
luco
se C
once
ntra
tion
(mg/
dl)
5
6
7
8
9
10
11
Blood Glucose C
oncentration (mm
ol/L)
Pravastatin (N = 2,063)
Baseline After Treatment80
100
120
140
160
180
200
Bloo
d G
luco
se C
once
ntra
tion
(mg/
dl)
5
6
7
8
9
10
11
Blood Glucose C
oncentration (mm
ol/L)
Pravastatin (N = 2,063)Paroxetine (N = 1,603)
Baseline After Treatment80
100
120
140
160
180
200
Bloo
d G
luco
se C
once
ntra
tion
(mg/
dl)
5
6
7
8
9
10
11
Blood Glucose C
oncentration (mm
ol/L)
Pravastatin (N = 2,063)Paroxetine (N = 1,603)Combination (N = 135)
Baseline After Treatment
+18 mg/dl incr. p < 0.001
Tatonetti, et al. Clinical Pharmacology & Therapeutics (2011)
80
100
120
140
160
180
200Bl
ood
Glu
cose
Con
cent
ratio
n (m
g/dl
)
5
6
7
8
9
10
11
Blood Glucose C
oncentration (mm
ol/L)
Pravastatin (N = 2,063)Paroxetine (N = 1,603)Combination (N = 135)
Baseline After Treatment
no diabetics
Tatonetti, et al. Clinical Pharmacology & Therapeutics (2011)

80
100
120
140
160
180
200Bl
ood
Glu
cose
Con
cent
ratio
n (m
g/dl
)
5
6
7
8
9
10
11
Blood Glucose C
oncentration (mm
ol/L)
Pravastatin (N = 2,063)Paroxetine (N = 1,603)Combination (N = 135)
Baseline After Treatment
no diabetics
80
100
120
140
160
180
200
Bloo
d G
luco
se C
once
ntra
tion
(mg/
dl)
PravastatinParoxetineCombination (N=177)
Baseline After Treatment
including diabetics
Tatonetti, et al. Clinical Pharmacology & Therapeutics (2011)
~60mg/dlincrease

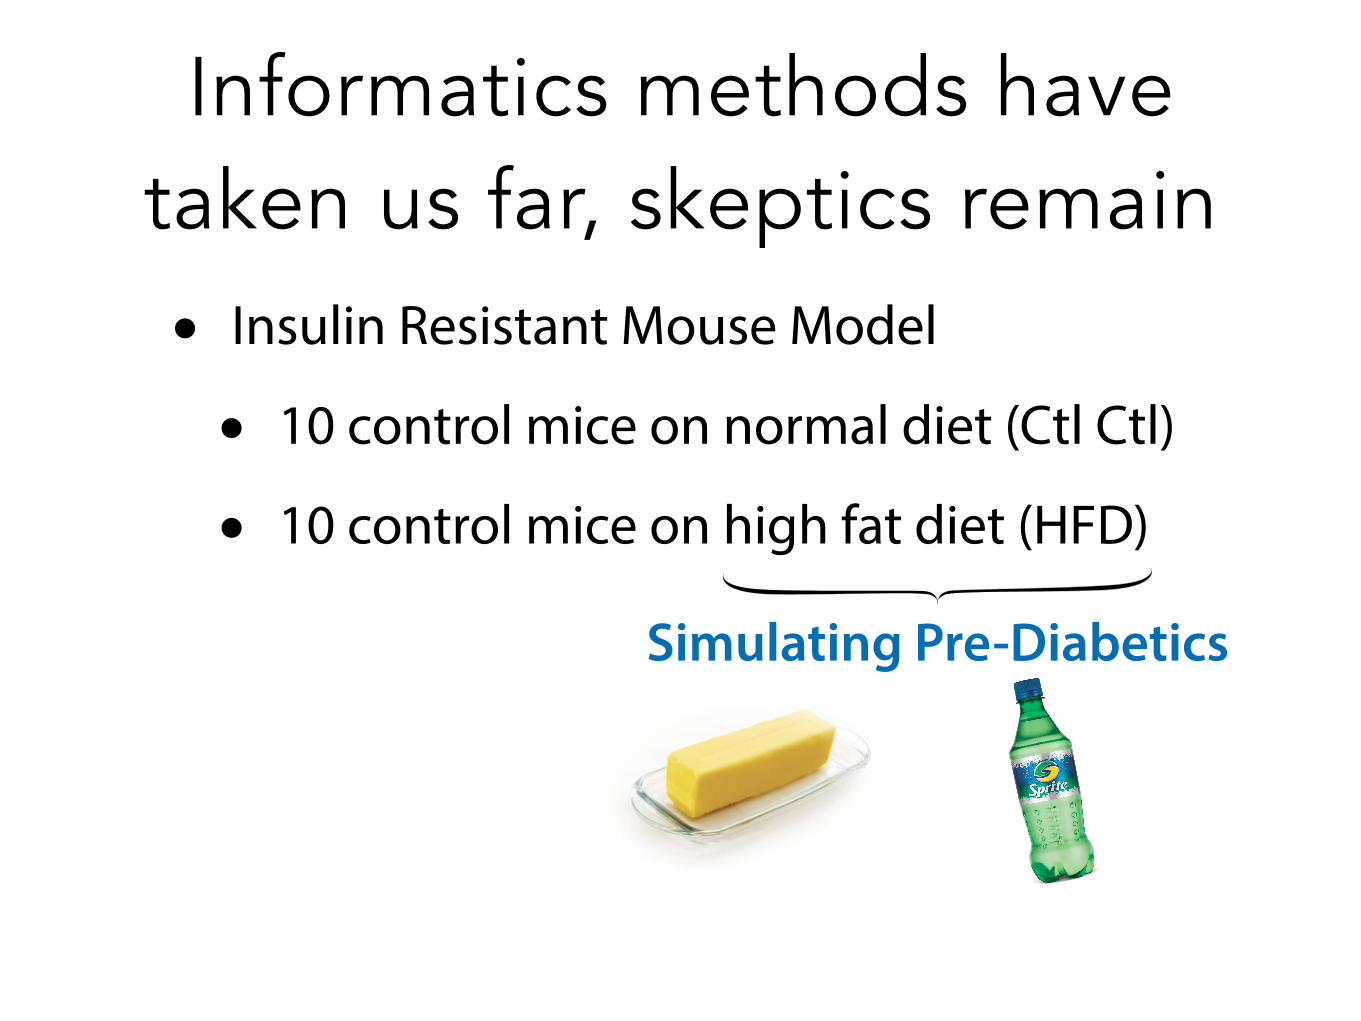
Informatics methods have taken us far, skeptics remain

Informatics methods have taken us far, skeptics remain • Insulin Resistant Mouse Model

Informatics methods have taken us far, skeptics remain • Insulin Resistant Mouse Model
• 10 control mice on normal diet (Ctl Ctl)

Informatics methods have taken us far, skeptics remain • Insulin Resistant Mouse Model
• 10 control mice on normal diet (Ctl Ctl)
• 10 control mice on high fat diet (HFD)

Informatics methods have taken us far, skeptics remain • Insulin Resistant Mouse Model
• 10 control mice on normal diet (Ctl Ctl)
• 10 control mice on high fat diet (HFD)

Informatics methods have taken us far, skeptics remain • Insulin Resistant Mouse Model
• 10 control mice on normal diet (Ctl Ctl)
• 10 control mice on high fat diet (HFD)
Simulating Pre-Diabetics

Informatics methods have taken us far, skeptics remain • Insulin Resistant Mouse Model
• 10 control mice on normal diet (Ctl Ctl)
• 10 control mice on high fat diet (HFD)
Simulating Pre-Diabetics
Informatics methods have taken us far, skeptics remain • Insulin Resistant Mouse Model
• 10 control mice on normal diet (Ctl Ctl)
• 10 control mice on high fat diet (HFD)
Simulating Pre-Diabetics
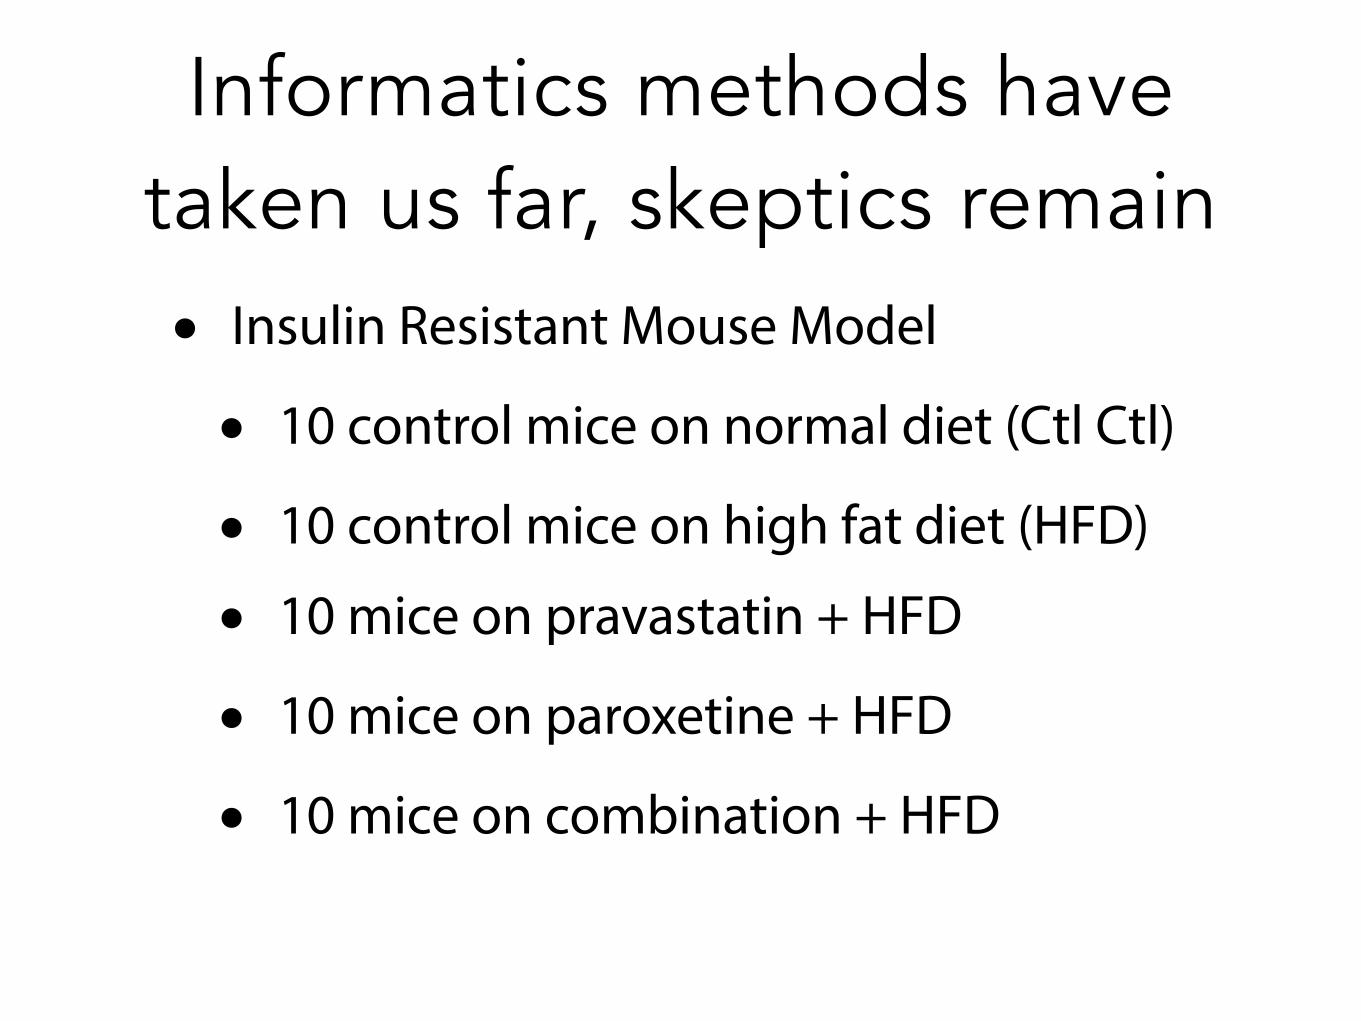
• 10 mice on pravastatin + HFD
• 10 mice on paroxetine + HFD
• 10 mice on combination + HFD
Informatics methods have taken us far, skeptics remain • Insulin Resistant Mouse Model
• 10 control mice on normal diet (Ctl Ctl)
• 10 control mice on high fat diet (HFD)

Summary of fasting glucose levels
Combin
ation
Contro
l
Paro
xetin
e
Prav
astat
in
Ctl Ctl
60
80
100
120
140
160
180
Aver
age
ITT
Fast
ing
Glu
cose
(mg/
dl)
~60mg/dlincrease
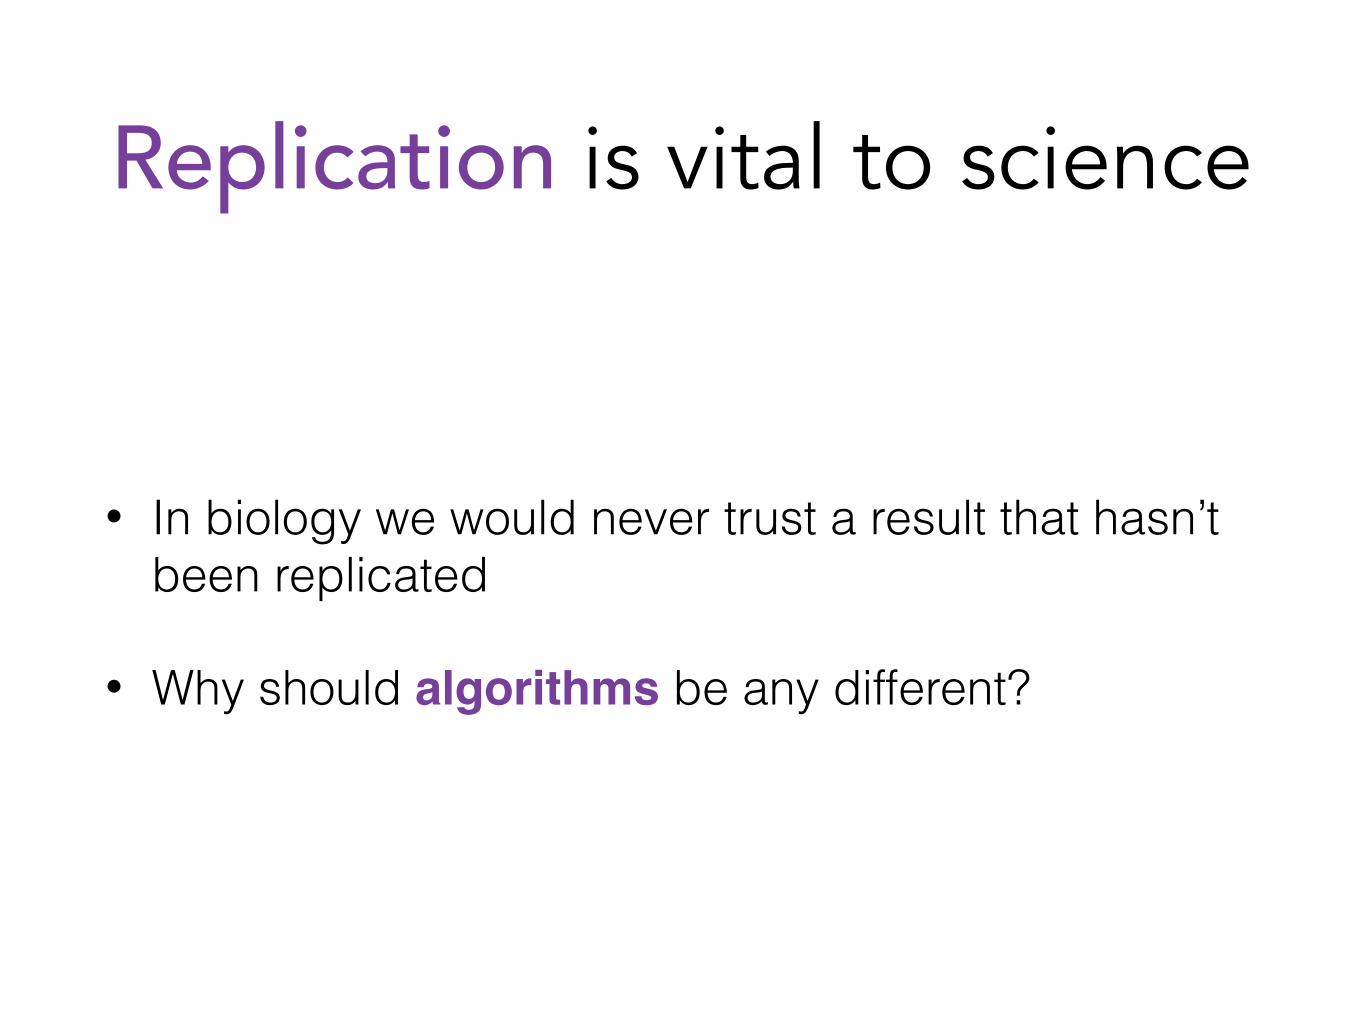
Replication is vital to science
• In biology we would never trust a result that hasn’t been replicated
• Why should algorithms be any different?

AL George, J. Clin. Invest. (2013)
Drug-drug interactions and acquired Long QT Syndrome (LQTS)
• Long QT syndrome (LQTS): congenital or drug-induced change in electrical activity of the heart that can lead to potentially fatal arrhythmia: torsades de pointes (TdP)
• 13 genes associated with congenital LQTS
• Drug-induced LQTS usually caused by blocking the hERG channel (KCNH2)
From Berger et al., Science Signaling (2010)
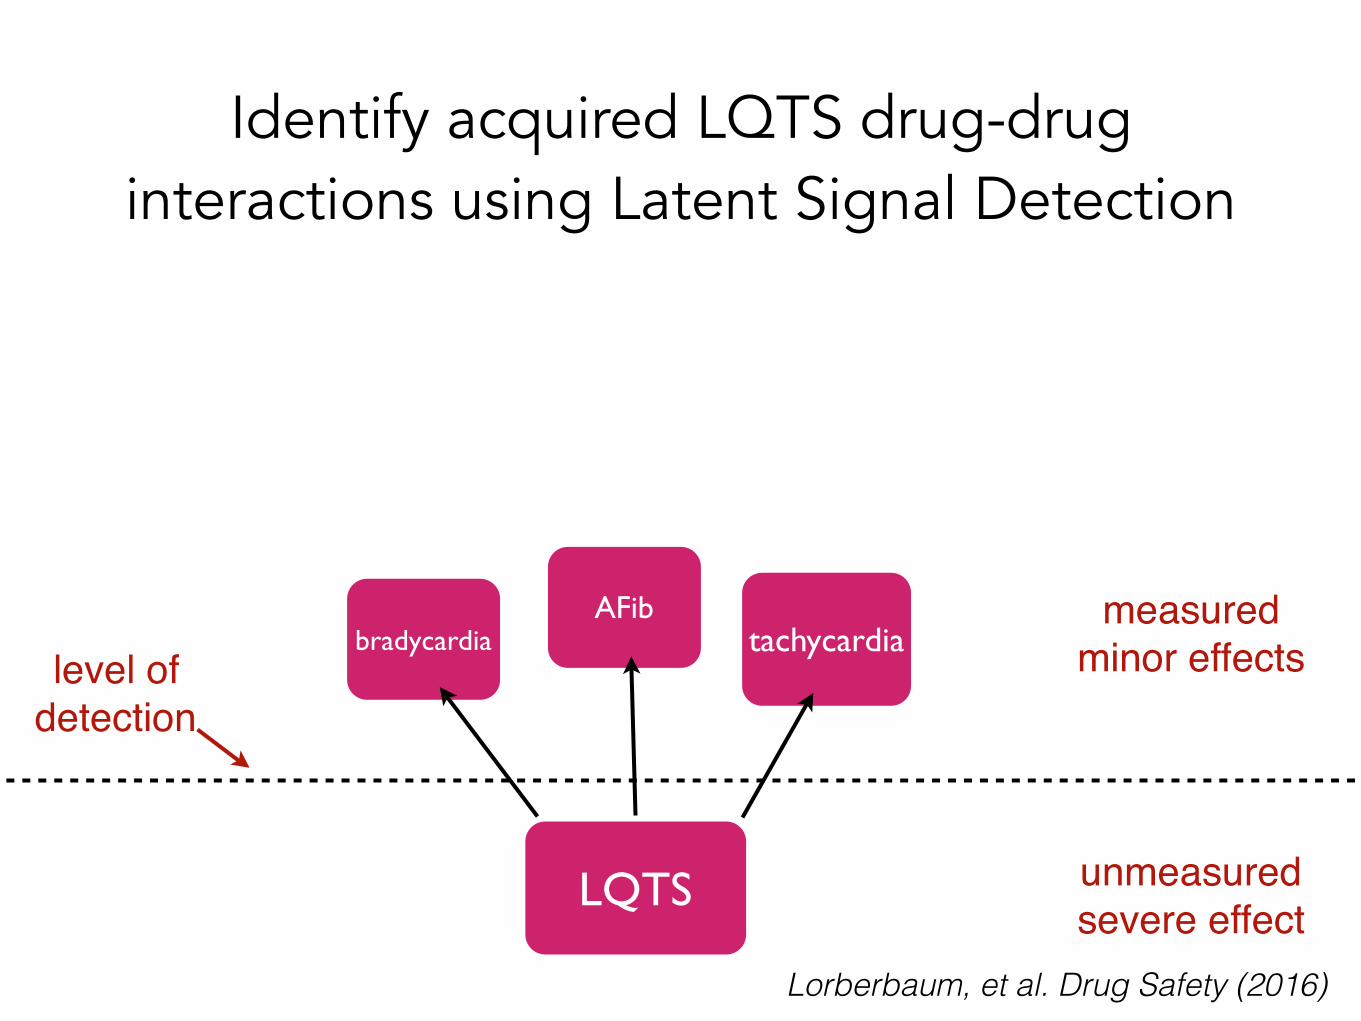
Identify acquired LQTS drug-drug interactions using Latent Signal Detection
LQTS
tachycardiaAFib
bradycardia level of
detection
unmeasuredsevere effect
measuredminor effects
Lorberbaum, et al. Drug Safety (2016)

Latent Signal Detection of acquired LQTS
• Ceftriaxone — common in-patient cephalosporin antibiotic
• Lansoprazole — proton-pump inhibitor used to treat GERD, one of the most commonly taken drugs in the world
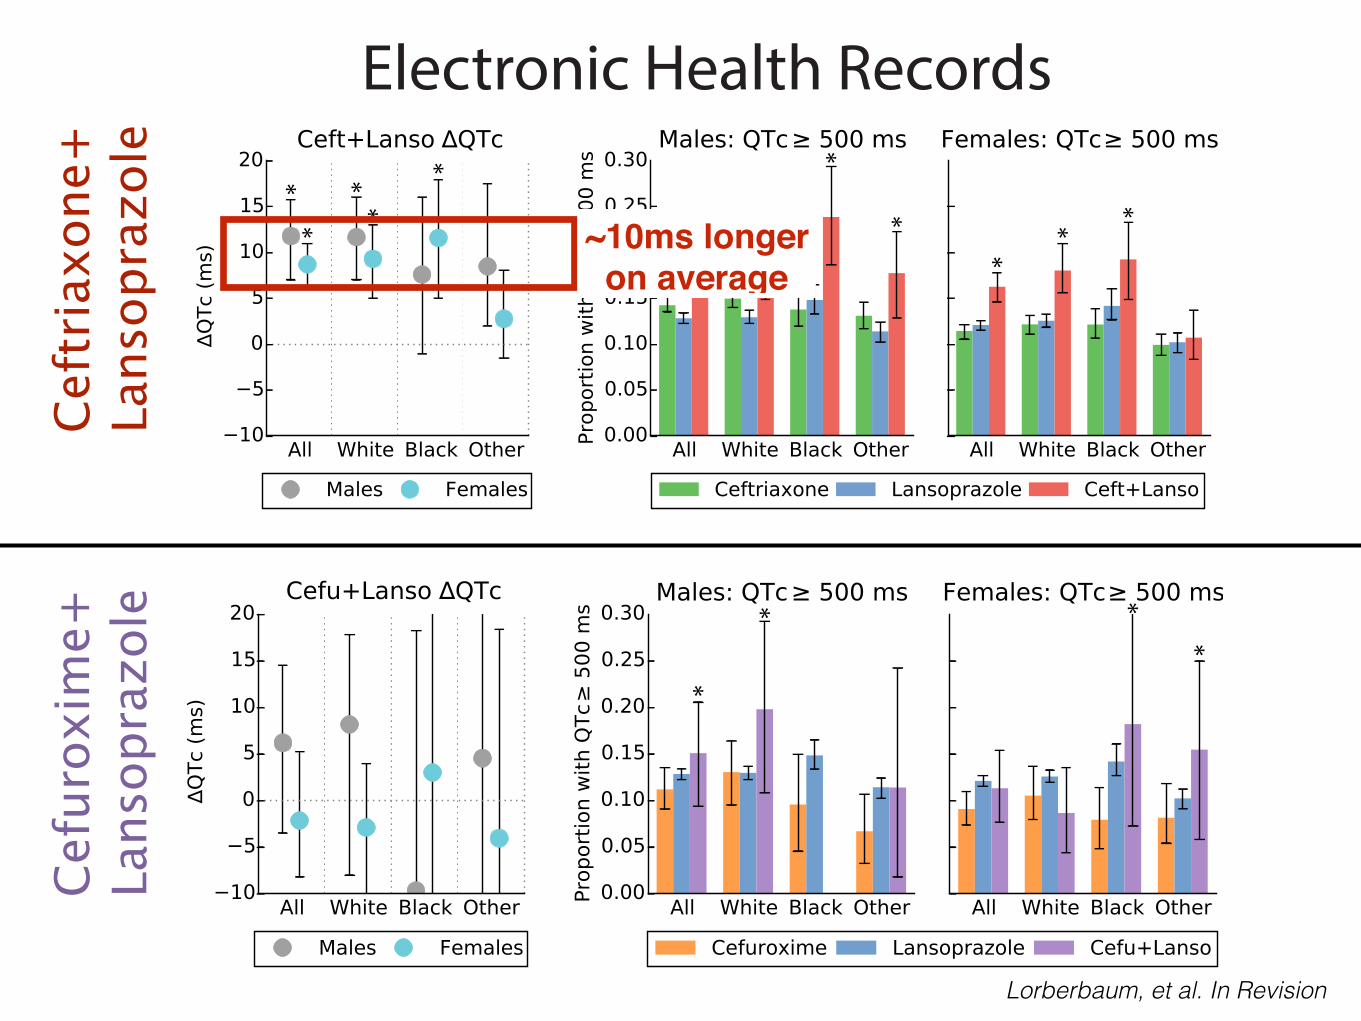
• In the EHR: Patients on the combination have QT intervals 11ms longer, on average and are 1.5X as likely to have a QT interval > 500ms
Top Prediction: Ceftriaxone + Lansoprazole
Lorberbaum, et al. Drug Safety (2016) Lorberbaum, et al. JACC (In press)
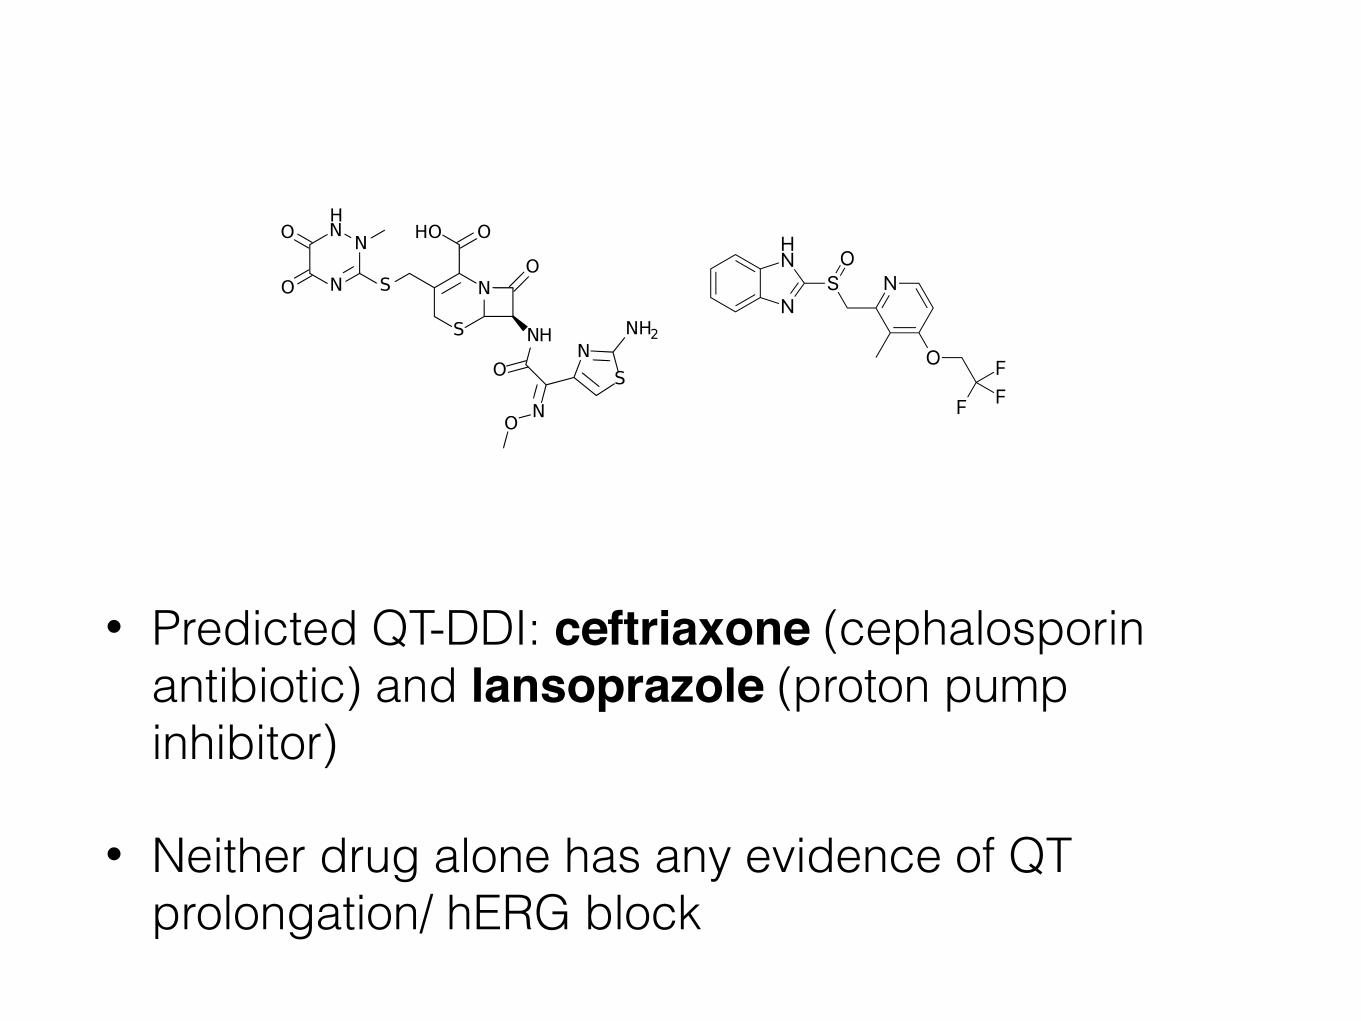
• Predicted QT-DDI: ceftriaxone (cephalosporin antibiotic) and lansoprazole (proton pump inhibitor)
• Neither drug alone has any evidence of QT prolongation/ hERG block
• Negative control: lansoprazole + cefuroxime
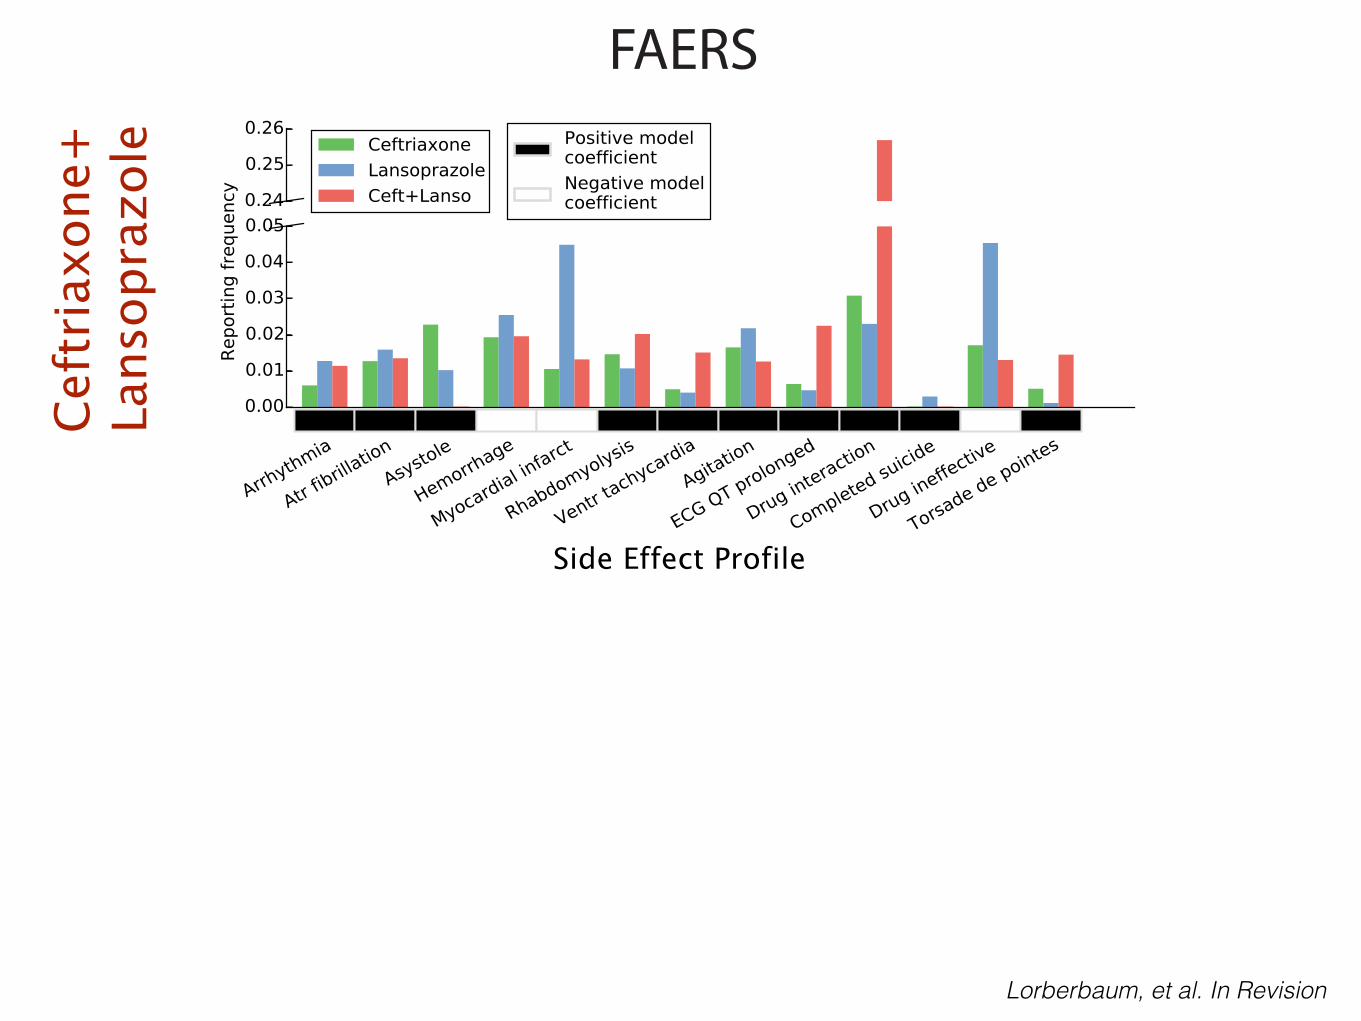
Ceftriaxone + Lansoprazole

• Predicted QT-DDI: ceftriaxone (cephalosporin antibiotic) and lansoprazole (proton pump inhibitor)
• Neither drug alone has any evidence of QT prolongation/ hERG block
• Negative control: lansoprazole + cefuroxime (another cephalosporin) – no evidence in FAERS of an interaction

• Predicted QT-DDI: ceftriaxone (cephalosporin antibiotic) and lansoprazole (proton pump inhibitor)
• Neither drug alone has any evidence of QT prolongation/ hERG block
• Negative control: lansoprazole + cefuroxime (another cephalosporin) – no evidence in FAERS of an interaction
• Negative control: lansoprazole + cefuroxime (another cephalosporin) – no evidence in FAERS of an interaction
Ceftriaxone Cefuroxime
FAERSCe
ftria
xone
+La
nsop
razo
le
Lorberbaum, et al. In Revision
Side Effect Profile

FAERSCe
ftria
xone
+La
nsop
razo
le
Lorberbaum, et al. In Revision
Side Effect Profile

FAERSCe
ftria
xone
+La
nsop
razo
leCe
furo
xim
e+La
nsop
razo
le
Lorberbaum, et al. In Revision

Electronic Health Records
**
**
*
* *
*
**
**
Ceft
riaxo
ne+
Lans
opra
zole
Cefu
roxi
me+
Lans
opra
zole
*
* **
Lorberbaum, et al. In Revision
Electronic Health Records
**
**
*
* *
*
**
**
Ceft
riaxo
ne+
Lans
opra
zole
Cefu
roxi
me+
Lans
opra
zole
*
* **
Lorberbaum, et al. In Revision
~10ms longeron average
What is the mechanism?
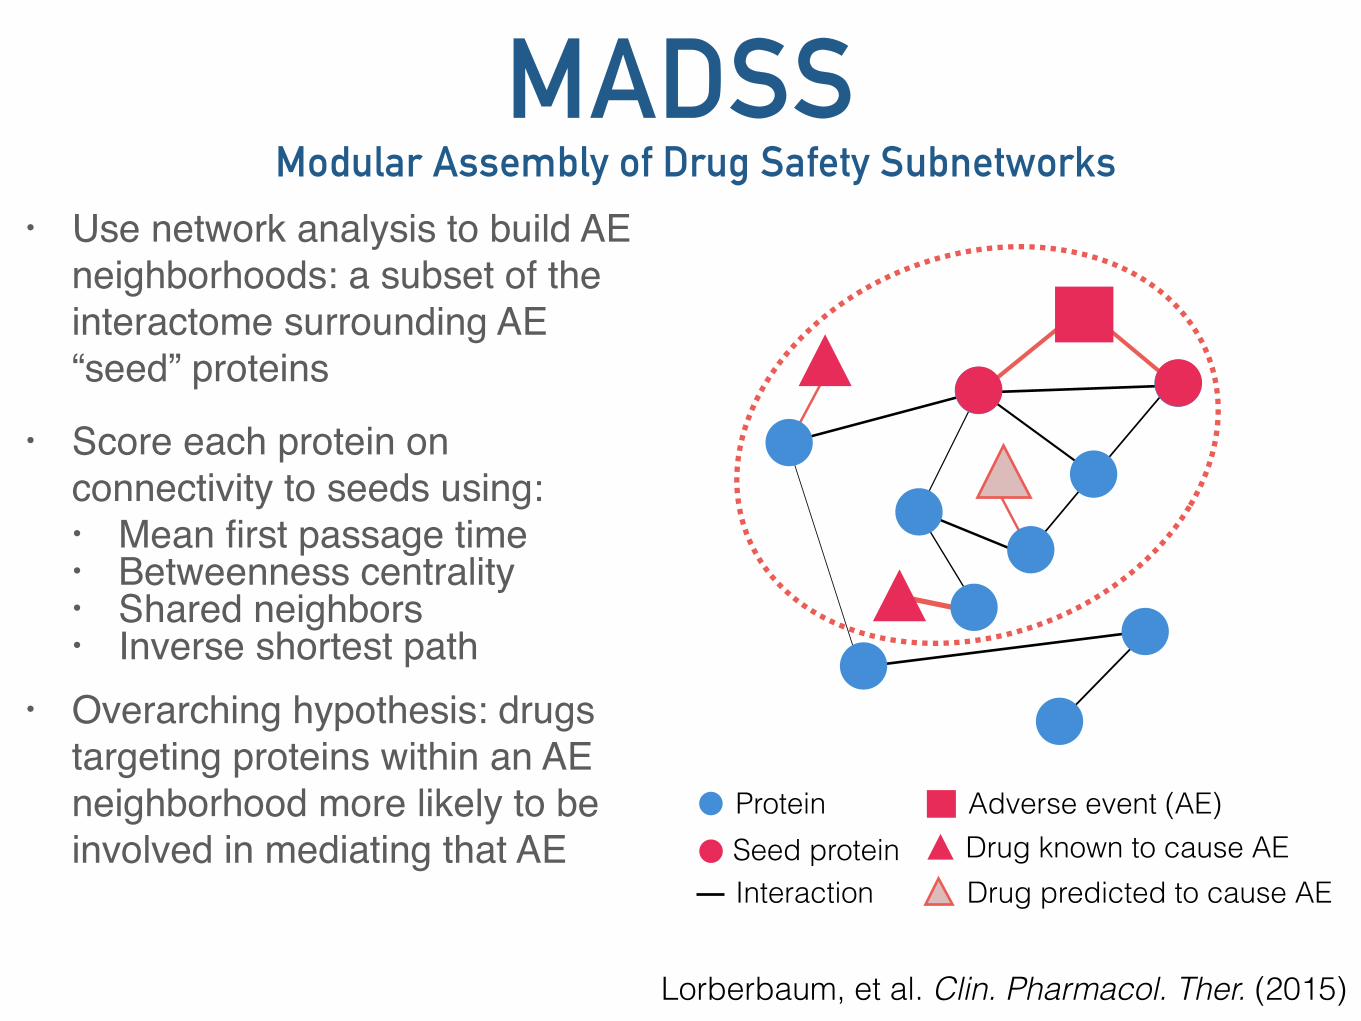
MADSS• Use network analysis to build AE
neighborhoods: a subset of the interactome surrounding AE “seed” proteins
• Score each protein on connectivity to seeds using: • Mean first passage time• Betweenness centrality• Shared neighbors• Inverse shortest path
• Overarching hypothesis: drugs targeting proteins within an AE neighborhood more likely to be involved in mediating that AE
• Ran MADSS using 13 LQTS genes as seeds
Modular Assembly of Drug Safety Subnetworks
Protein
InteractionSeed protein
Adverse event (AE)Drug known to cause AEDrug predicted to cause AE
Lorberbaum, et al. Clin. Pharmacol. Ther. (2015)

MADSS• Use network analysis to build AE
neighborhoods: a subset of the interactome surrounding AE “seed” proteins
• Score each protein on connectivity to seeds using: • Mean first passage time• Betweenness centrality• Shared neighbors• Inverse shortest path
• Overarching hypothesis: drugs targeting proteins within an AE neighborhood more likely to be involved in mediating that AE
• Ran MADSS using 13 LQTS genes as seeds
Modular Assembly of Drug Safety Subnetworks
Protein
InteractionSeed protein
Adverse event (AE)Drug known to cause AEDrug predicted to cause AE
• Ran MADSS using 13 LQTS genes as seeds Lorberbaum, et al. Clin. Pharmacol. Ther. (2015)

Putative mechanisms of QT-DDIs
KCNH2
LQTS
Lansoprazole
SCN5A
CeftriaxoneDiltiazemPhenytoin
Fosphenytoin
Metoprolol
Cluster 7
Cluster 1
Cluster 3
CACNA1C
CACNG1
CAV3
ATP4A
ADRB1
Known drug-target binding (DrugBank)
Predicted drug-hERG binding (Random Forest classifier)

Nanion Patchliner
Lorberbaum, et al. JACC (In press)
Voltage protocol: step to +40mV followed by a return to -40mV
Automated Patch Clamp• Collaboration with Rocky
Kass (CUMC Pharmacology Dept.)
• Take HEK293 cells over-expressing the hERG channel
• Perform a single-cell patch clamp experiment• control• ceftriaxone alone• lansoprazole alone• combination of ceftriaxone
and lansoprazole

Ceftriaxone+Lansoprazole
Lorberbaum, et al. JACC (In press)

Ceftriaxone+Lansoprazole Cefuroxime+Lansoprazole
Lorberbaum, et al. JACC (In press)

Ceftriaxone+Lansoprazole Cefuroxime+Lansoprazole
Cefuroxime + 1μM LansoprazoleCefuroxime alone
0μM 0.1μM 1μM 10μM 50μM 100μMCefuroxime Concentration (μM)
0.0
0.2
0.4
0.6
0.8
1.0
1.2
Cha
nge
from
Con
trol
Cefu+Lanso effect on hERG current
0μM 0.1μM 1μM 10μM 50μM 100μMCeftriaxone Concentration (μM)
0.0
0.2
0.4
0.6
0.8
1.0
1.2
Cha
nge
from
Con
trol
Ceftriaxone + 10μM LansoprazoleCeftriaxone + 1μM LansoprazoleCeftriaxone alone
Ceft+Lanso effect on hERG current
Lorberbaum, et al. JACC (In press)


0mV
50m
V
100ms
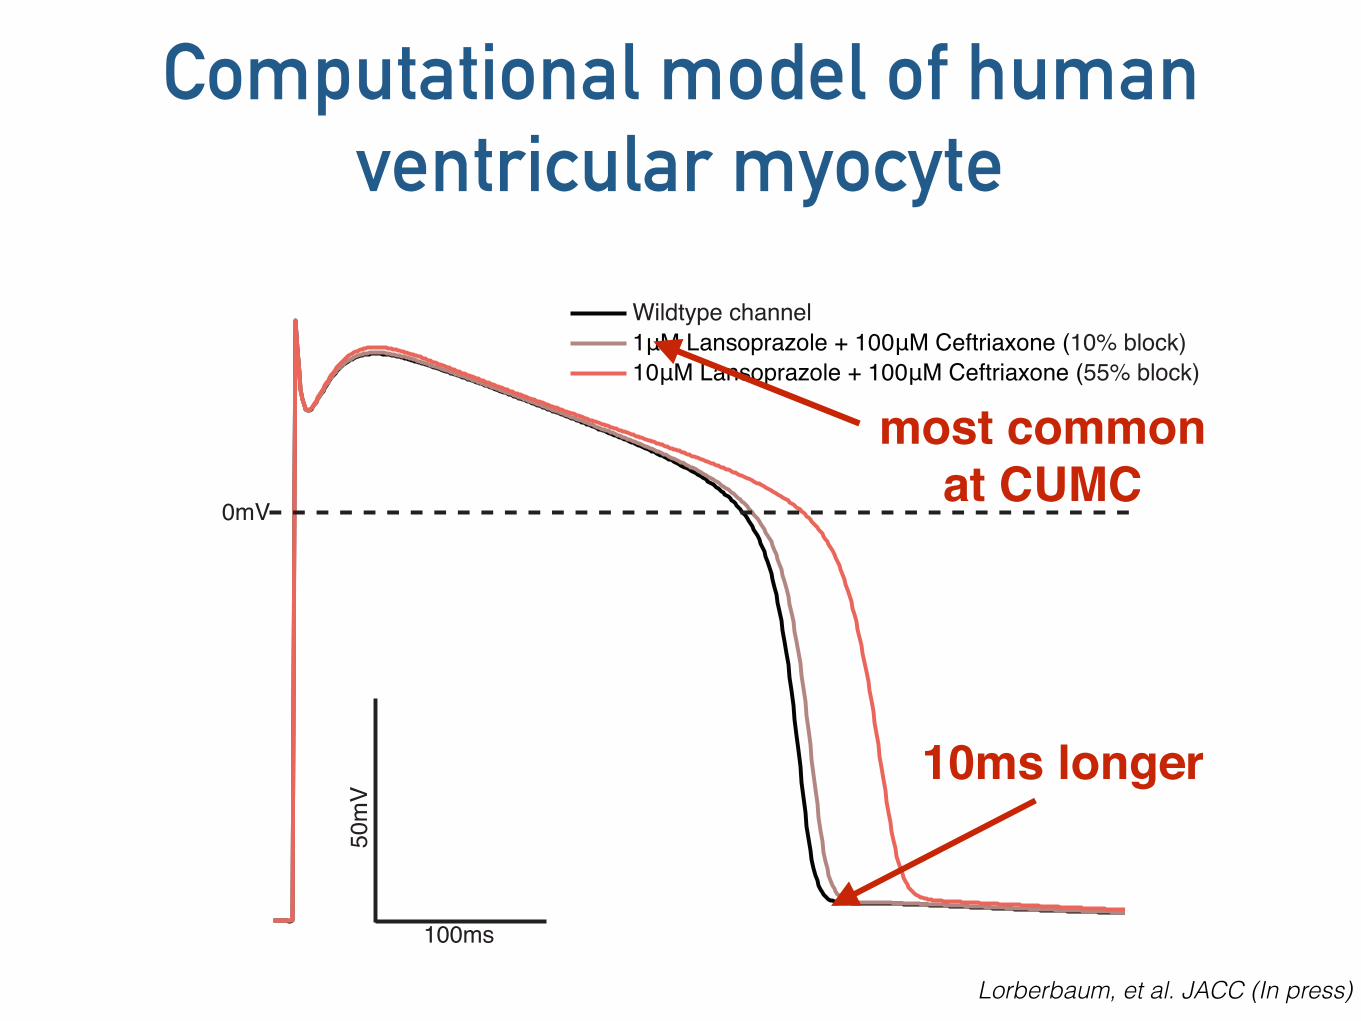
Wildtype channel1μM Lansoprazole + 100μM Ceftriaxone (10% block)10μM Lansoprazole + 100μM Ceftriaxone (55% block)
Lorberbaum, et al. JACC (In press)
Computational model of human ventricular myocyte
0mV
50m
V
100ms
Wildtype channel1μM Lansoprazole + 100μM Ceftriaxone (10% block)10μM Lansoprazole + 100μM Ceftriaxone (55% block)
Lorberbaum, et al. JACC (In press)
Computational model of human ventricular myocyte
10ms longer
most common at CUMC

Data mining clinical information
• Drug-drug interactions can be discovered using observational data
• paroxetine/pravastatin
• ceftriaxone/lansoprazole
• EHR data accurately predict prospective experiments
tatonettilab.org [email protected]
@nicktatonetti
Current Lab MembersRami Vanguri, PhD Kayla Quinnies, PhD Alexandra Jacunski Tal LorberbaumMary Boland Joseph Romano Yun Hao Phyllis Thangaraj Alexandre Yahi Fernanda Polubriaginof, MD
Collaborators FundingNIGMS R01GM107145 Herbert Irving Fellowship PhRMA Research Starter Grant NCI P30CA013696 NIMH R03MH103957
Thank you
David Goldstein, PhD Krzysztof Kiryluk, MD, MS David Vawdrey, PhD Robert Kass, PhD Kevin Sampson, PhD Brent Stockwell, PhD George Hripcsak, MD, MS Ziad Ali, MD, DPhil Ray Woosley, MD, PhD (Credible Meds) Konrad Karczewski, PhD (Broad/MGH) Joel Dudley, PhD (Mount Sinai) Li Li, PhD (Mount Sinai) Patrick Ryan, PhD (OHDSI) Russ Altman (Stanford) Issac Kohane (HMS) Shawn Murphy (HMS)