biomechanics of front and back squat exercises - iopscience
TRANSCRIPT

Journal of Physics Conference Series
OPEN ACCESS
Biomechanics of front and back squat exercisesTo cite this article A A Braidot et al 2007 J Phys Conf Ser 90 012009
View the article online for updates and enhancements
You may also likeWhat recording duration is required toprovide physiologically valid and reliabledynamic cerebral autoregulation transferfunctional analysis estimatesJoel S Burma Lauren N Miutz Kailey TNewel et al
-
Measurement of cardiac output duringexercise in healthy trained humans usinglithium dilution and pulse contour analysisAdrian D Elliott Justin Skowno MaheshPrabhu et al
-
Nucleation of squat cracks in railcalculation of crack initiation angles inthree dimensionsMeysam Naeimi Zili Li and Rolf Dollevoet
-
Recent citationsTitle the relative orientation of the trunkand tibia can be used to estimate thedemands on the hip and knee extensorsduring the barbell back squatAdam J Barrack et al
-
Biomechanical comparisons of back andfront squats with a straight bar and foursquats with a transformer barMaja Gorši et al
-
Load-dependent mechanical demands ofthe lower extremity during the back andfront squatJohn Krzyszkowski and Kristof Kipp
-
This content was downloaded from IP address 22212192218 on 18102021 at 0124
Biomechanics of Front and Back Squat exercises
A A Braidot1 M H Brusa1 F E Lestussi1 and G P Parera2 1Laboratorio de Biomecaacutenica FI-UNER Ruta 11 Km 10 Oro Verde Entre Riacuteos Argentina
2Licenciatura en Kinesiologiacutea y Fisiatriacutea Universidad Abierta Interamericana Sede Regional Rosario
E-mail abraidotbioingenieriaeduar
Abstractmdash --Squat constitutes one of the most popular exercises to strengthen the muscles of the lower limbs It is considered one of the most widely spread exercises for muscle sport training and is part of the competition movements comprised within olympic weight-lifting In physical rehabilitation squats are used for muscular recovery after different injuries of the lower limbs especially the knee In previous anterior cruciate ligament injuries the mini-squats are generally used in a knee flexion motion range from 0ordm to 50ordm because in this range the shear forces the tibiofemoral and patellofemoral compression forces decrease related to greater flexion angles The aim of this work is to make a comparative bidimensional study of the kinematic and dynamic variables of the excecution of the parallel squat exercise with the front and back bar It is observed in the knee a better development of energy with the front bar allowing a better muscular exercise with the same load The mean power absorbed by the hip with the back bar is considerably greater associated to the speed of the gesture
1 Introduction Usually within the popular knowledge it is thought that squat is only synonymous of the
quadriceps muscle work but this is a extremely limited vision In the scope of sport biomechanics exercises are classified into closed kinetic chain (CKC) in
which the distal end remains fixed ndash as in squat ndash and the open kinetic chain exercises (OKC) in which the distal end of the segment that moves is free as the seated knee extensions [1][2] In the CKC in addition to the quadriceps work it is originated a better recruitment and activation of hamstrings gluteus maximus and gastrocnemius muscles as regards to the majority work of the quadriceps such as in OKC exercises [3]
In addition there is an important activ ation of muscles locking of the trunk mainly abdominal and spine muscles this activation becomes better during the unstable execution of squat [4] [5]
It is shown in previous data according to the adopted lumbar position during the execution of the exercise there will be variations in the patterns of rectus abdominis spine and latissimus dorsi muscles [6]
Related to the contribution of the gluteus maximus muscle a better recruitment is observed during deep squat in the concentric phase There are not significant differences between the relative contribution of the biceps femoris and vastus during this phase [7]
16th Argentine Bioengineering Congress and the 5th Conference of Clinical Engineering IOP PublishingJournal of Physics Conference Series 90 (2007) 012009 doi1010881742-6596901012009
ccopy 2007 IOP Publishing Ltd 1
In the last years the reached speed and the peak of power produced in the force exercises have been estimated with enough precision using force platforms and contact carpets [8]
As regards the cruciate ligaments the peak of stress in the posterior cruciate ligament (PCL) is double in exercises in CKC and it is increased mean while the flexion of the knee is also increased However the peak of tension of anterior cruciate ligament (ACL) takes place in the exercise of OKC and near the total extension of the knee [3]
During ACL rehabilitation it is possible to minimize the shear forces by doing mini squat in angles until 50ordm of knee flexion and the compression forces in the tibiofemoral and patelo femoral compared to bigger flexions of this joint [9]
Russell and Phillips [10] show that no significant differences exist at the maximum peak of the knee extensor moments when comparing front and back squad exercises The slight differences exist in favour of front squat exercises
Concerning the maximum extensor moments of the trunk these are slightly higher in front squat compared with back squat [10]
In relation to the maximum compression forces are better in back squat and shear forces are slightly better in front squat at lumbar level The differences in trunk inclination change these forces and also the risk of injuries at the level of the lumbar spine [10] However a quantification of the muscular power has not been made in each joint during the exercise There is no record of an estimation of the energy generated and absorbed by muscles in the different variants of the squat exercise
In the present work we evaluated parallel squat in which starting off from the raised position the knees are flexed until the thighs are parallel approximately to the horizontal plane in both variants Later during the phase of ascent the knees are extended until returning again to the initial position It is compared the kinematics dynamics the power and the energy in the different joints during the complete cycle from the exercise in the different variants of squat
2 Materials and methods The correct way to do parallel back squat is to straight up the segment trunk as well as possible so
as to minimize the forces that the lumbar spine can support The opening of the feet must preferably be comfortable with a similar separation to the wide one of shoulders The bar must be firmly placed on shoulders it is grip near them for exerting more pressure on the bar and preventing that the back is curved generating an undesired effort on the lumbar spine In front squat the bar is hold up on clavicles and the superior part of the chest with the elevated elbows towards the front and with the most erect trunk preventing the risk of fall of the bar towards ahead [11]
We evaluated 10 sportsmen familiarized with the execution of the 2 variants of the exercise which do not present previous injuries of knees or lumbar spine
The load to mobilize in the exercises is calculated on the basis of 50 of a maximum repetition (1 RM) of back squat [12] The same load is used for both variants of the exercise
Markers were placed to delimit the articulate segments which are hemispheric of 10 millimeters of diameter covered by retro reflective material In figure 1 is the location of the markers fifth metatarsal lateral malleolus heel fibula head femoral lateral epicondyle greater trochanter iliaca crest and the rib cage The markers are placed in both sides of the body Another retro reflective marker was placed at the end of the bar
The performers were filmed with a videocamera at 25 framessec (corresponding to 50 fields of imagesec) from the sagittal view with one of their feet on the force platform The exercise was done in the parallel line of the film plane
During each session of exercises the athletes does 4 consecutive repetitions of front squat after that repose 15 minutes before does 4 consecutive repetitions of back squat Every man is instructed about does the exercises at its normal speed of execution This session is repeated with a day of difference alternating the order of execution of the two variants For each subject eight repetitions of each variant of the exercise by session are processed (four of the right lower limb and four of the left
16th Argentine Bioengineering Congress and the 5th Conference of Clinical Engineering IOP PublishingJournal of Physics Conference Series 90 (2007) 012009 doi1010881742-6596901012009
2
one) Mean comparison were made considering the ten sportman two sessions four repetitions for each leg then 160 gestures for each variant of squat
Angles between segments positions and displacements of the centers of mass and speeds of the anatomical segments forces exerted on the force platform and between the segments and muscular net moments in the joints in each variant of the exercise are evaluated Also the net powers and energies in each joint are calculated The movements are considered bilateral and symmetrical and they are only developed in the sagittal plane being considered the fifth metatarsolphalangeal joint of the foot fixed to the floor
In the present work a lot of care was taken for the correct execution of the exercise Consequently the lateral motions in the frontal plane or those of rotation in the transverse plane are not considered because the movement ranks are small and of few relevance in the analysis
The data are digitalized and filtered using a Butterworth filter A link segment model is used to evaluate the dynamic changes in which joints are considered pin joints and the forces are concentrated in a point in each joint
With the resolute model the muscular powers and the energy generated and absorbed are obtained in each joint In order to be able to apply a processing ANOVA (analysis of variance) [13] represent each one of the variables according to the percentage of the cycle of exercise corresponding 0 at the moment at which the athlete leaves the raised position and the end of the cycle (100) corresponds at the moment at which the athletes returns again to the initial position This procedure allows to obtain the averages and the deviations of each variables
Figure 1 Disposition of anatomical markers
3 Results The average angles of the hip knee and ankle and their standard deviations appear in figure 2 The X-axis represents the percentage of squat cycle
16th Argentine Bioengineering Congress and the 5th Conference of Clinical Engineering IOP PublishingJournal of Physics Conference Series 90 (2007) 012009 doi1010881742-6596901012009
3
Figure 2 Joints angles in function of the average of cycle for each repetition
The curves of average obtained in the frontal exercise of squat are red The back squat curves are blue The angle of the hip for back squat is greater than the other variant This indicates a greater compromise at low back due to the possible lumbar shear forces The mean values for the knee and ankle joints are similar for both variants of the exercise The smaller deviation observed in the curves of angles indicates a better stability in the repetitions of the exercise for the backward variant
The average and the deviation (Figure 3) of the net muscular moments of hip knee and ankle are
normalized with the weight of the athlete plus the load used during the exercise A significant difference for both variants is not observed at the hip knee and ankle
16th Argentine Bioengineering Congress and the 5th Conference of Clinical Engineering IOP PublishingJournal of Physics Conference Series 90 (2007) 012009 doi1010881742-6596901012009
4
Figure 3 Normalized net muscular moment of the joints of the lower limb
based on the percentage of the cycle of each repetition
The average and the
deviation (Figure 4) of the net muscular power of hip knee and ankle are normalized with the weight of the athlete plus the load used during the exercise
We observed a maximum difference of 22 in the averages of the net powers for the hip (corresponding to 34 and 58 of the cycle of squat) being greater for the backward variant On the other hand few differences in the curves morphology for net power of the knee and ankle for both variants are observed
4 Discussion In addition to the analysis of the powers throughout the cycle of squat it is inte resting to study of the net joint powers in energy terms First the total energy absorbed or generated in each repetition is evaluated For the absorbed energy
( )int=f
i
t
tjj dttPowerEa (1)
where j is j-nth repetition t is the time and ti and tf are the initial and final times in which the power is negative The average for the N repetitions of both gestures
N
EaN
jj
Easum== 1 (2)
16th Argentine Bioengineering Congress and the 5th Conference of Clinical Engineering IOP PublishingJournal of Physics Conference Series 90 (2007) 012009 doi1010881742-6596901012009
5
Figure 4 Normalized net muscular power of the joints of the lower limb based
on the percentage of the cycle of each repetition
The standard deviation are also obtained Equivalent expressions are used to obtain the generated energy
The energies absorbed and generated in both variants of squat are shown in Tables 1-2 where 1 Front front squat 2 Back back squat 3 Gen Generated energy 4 Abs Absorbed energy
Table 1 Absorbed and generated energies in the hip knee and ankle front exercises
Joint Front-Abs
(mean)
Front-Abs (standard deviation)
Front-Gen (mean)
Front-Gen (standard deviation)
Hip -7750 1740 7997 1795
Knee -6306 1604 6445 1718
Ankle -742 441 931 395
Table 2 Absorbed and generated energies in the hip knee and ankle back exercises
Joint Back-Abs
(mean)
Back-Abs (standard deviation)
Back-Gen (mean)
Back-Gen (standard deviation)
Hip -7969 1262 7862 1181
Knee -5871 1203 5993 1169
Ankle -631 336 843 354 The mean powers absorbed and generated in each variant of squat are reported in Tables 4 - 5 for
each joint For the absorbed power of each repetition in a joint it is obtained
( ) ( )intminus=
f
i
t
tj
ifj dttPower
ttPMa 1
(3) The standard deviation means are obtained too
16th Argentine Bioengineering Congress and the 5th Conference of Clinical Engineering IOP PublishingJournal of Physics Conference Series 90 (2007) 012009 doi1010881742-6596901012009
6
Table 3 Percentage difference between the energies absorbed and generated for both variants
calculated according to the expression
100 lowast
minus= back
backfront
Joint Percentage Abs (mean)
Percentage Gen (mean)
Hip -275 17
Knee 74 75
Ankle 176 1044
Table 4 Absorbed and generated power mean
for front squat
Joint Front-Abs (mean)
Front -Abs
(standard deviation)
Front -Gen
(mean)
Front -Gen
(standard deviation)
Hip -116 020 129 024
Knee -097 029 105 026
Ankle -012 007 015 007 The percentage differences in the absorbed and generated average powers for each joint are shown
in Table 6
Table 5 Absorbed and generated power mean for back squat
Joint Back-Abs (mean)
Back-Abs (standard deviation)
Back-Gen (mean)
Back-Gen (standard deviation)
Hip -134 038 135 028
Knee -099 029 101 022
Ankle -011 006 014 007
Table 6 Percentage difference between the absorbed and generated mean power for both
variants calculated according to the expression
100 lowast
minus= back
backfront
Joint Percentage Abs (mean)
Percentage Gen (mean)
Hip -1343 -444
Knee -202 396
Ankle 909 714 In the knee the total energy in front squat is greater than back squat in a 75 this would allow a
greater muscular exercise for the same load In addition the back squat exercise is performed (in average) in less time so the mean powers in the knee have similar values (Tables 4 5 and 6)
Particularly in back squat the absorbed mean power hip is considerably greater ie an average of 1343 This basically would be associated to fact that the exercise is done faster due to the greater stability obtained in locating the bar backwards
References [1] M J Stuart D A Meglan G E Lutz E S Growney y K N An ldquoComparison of
intersegmental tibiofemoral joint forces and muscle activity during various closed kinetic chains exercisesrdquo American Journal of Sports Medicine vol 24 pp 792-799 1996
[2] H J Yack C E Collins y T J Whieldon ldquoComparison of closed and open kinetic chain exercise in the anterior cruciate ligament- deficient kneerdquo American Journal of Sports Medicine vol 21 pp 49-54 1993
[3] R F Escamilla G S Fleisig N Zheng S W Barrentine K E Wilk y J R Andrews ldquoBiomechanics of the knee during closed kinetic chain and open kinetic chain exercisesrdquo Medicine amp Science in Sports amp Exercise vol 30 pp 556-569 1998
16th Argentine Bioengineering Congress and the 5th Conference of Clinical Engineering IOP PublishingJournal of Physics Conference Series 90 (2007) 012009 doi1010881742-6596901012009
7
[4] K Anderson y D G Behm ldquoTrunk muscle activity increases with unstable squat movementsrdquo Canadian Journal of Applied Physiology vol 30(1) pp 33-45 2005
[5] L I E Oddsson T Persson A G Cresswell y A Thorstensson ldquoInteraction between voluntary and postural motor commands during perturbed liftingrdquo Spine vol 24(6) pp 545-552 1999
[6] J P Vakos A J Nitz A J Threlkeld R Shapiro y T HornldquoElectromyographic activity of selected trunk and hip muscles during a squat lift Effect of varying the lumbar posturerdquo Spine vol 19(6) pp 687-695 1994
[7] A Caterisano R F Moss T K Pellinger K Woodruff V C Lewis W Booth y T Khadra ldquoThe effect of back squat depth on the EMG activity of 4 superficial hip and thigh musclesrdquo Journal of Strength and Conditioning Research vol 16(3) pp 428-432 2002
[8] C Bosco ldquoStrenght assessment with the Boscorsquos testrdquo Roma Italian Society of Sport Science 1999
[9] R F Escamilla ldquoKnee biomechanics of the dynamic squat exerciserdquo Medicine amp Science in Sports amp Exercise vol 33 pp 127-139 2001
[10] P J Russell y S J Phillips ldquoA preliminary comparison of front and back squat exercisesrdquo Research Quarterly for Exercise and Sport vol 60(3) pp 201-208 1989
[11] J de Hegedus ldquoEnciclopedia de la musculacioacuten deportivardquo Buenos Aires Editorial Stadium 1987
[12] A C Fry y W J Kraemer ldquoComment on a preliminary comparison of front and back squat exercisesrdquo Research Quarterly for Exercise and Sport vol 61(2) pp 210-211 1990
[13] Norman GR Streiner DL Bioestadiacutestica MosbyDoyma Madrid 1996
16th Argentine Bioengineering Congress and the 5th Conference of Clinical Engineering IOP PublishingJournal of Physics Conference Series 90 (2007) 012009 doi1010881742-6596901012009
8
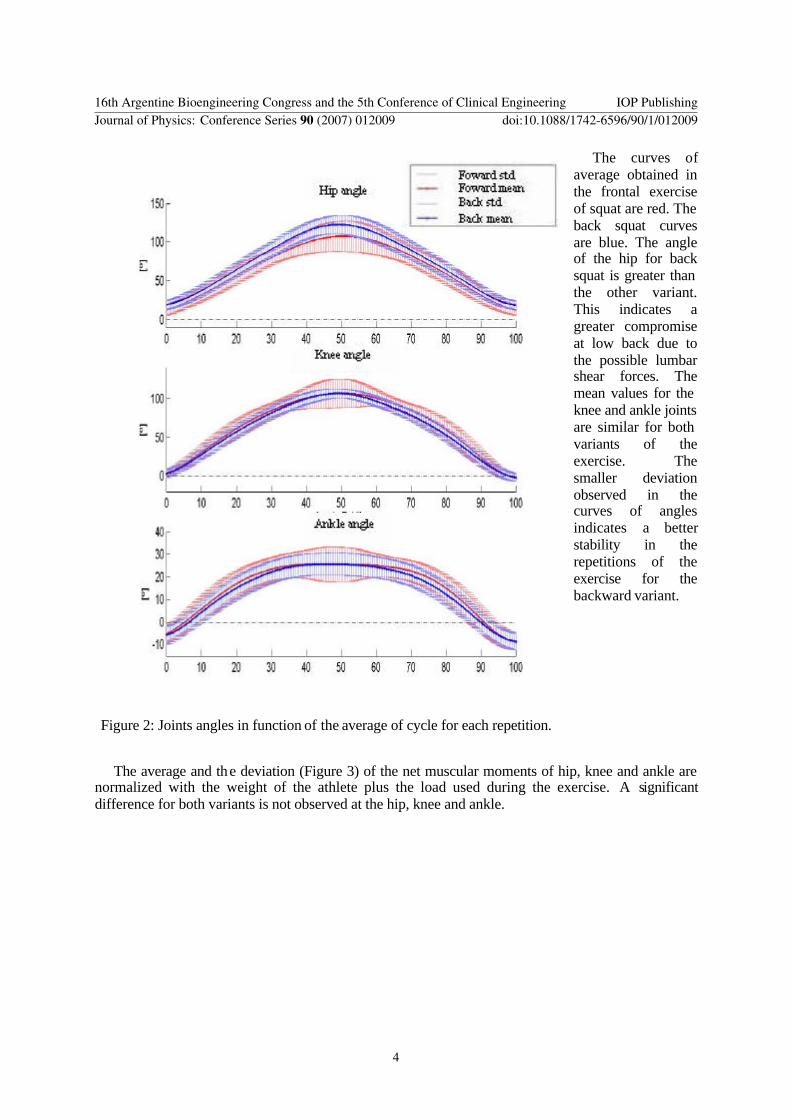
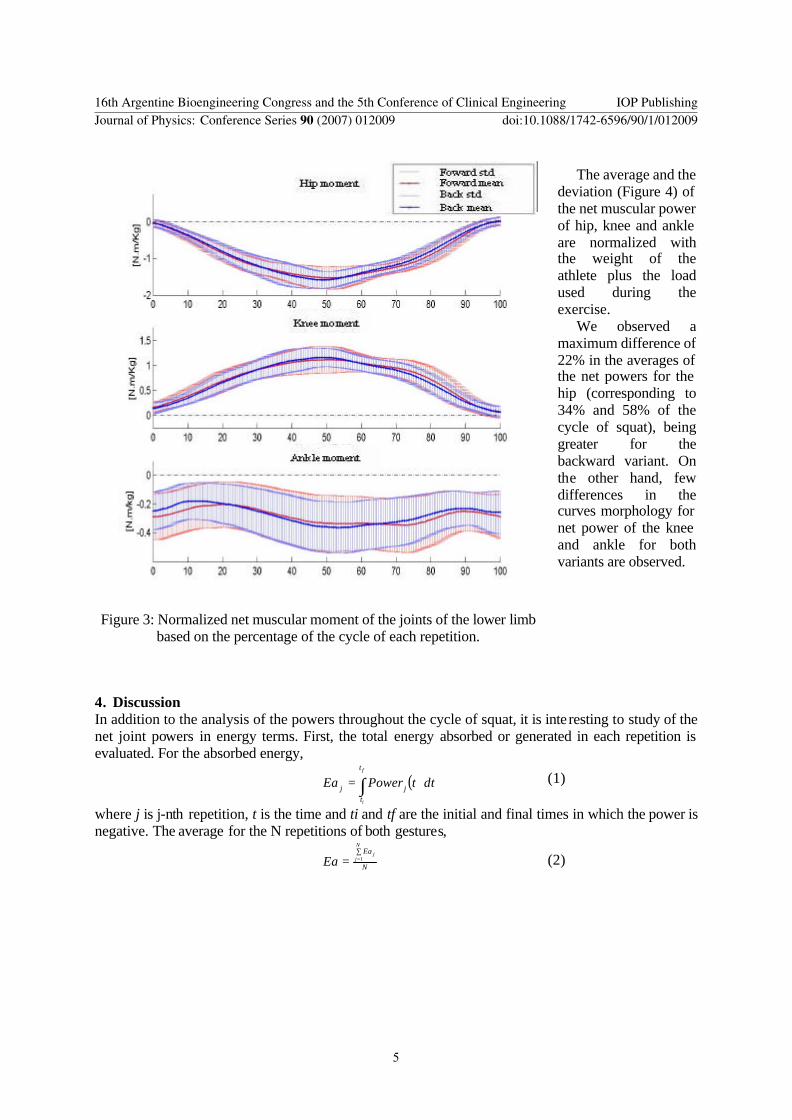
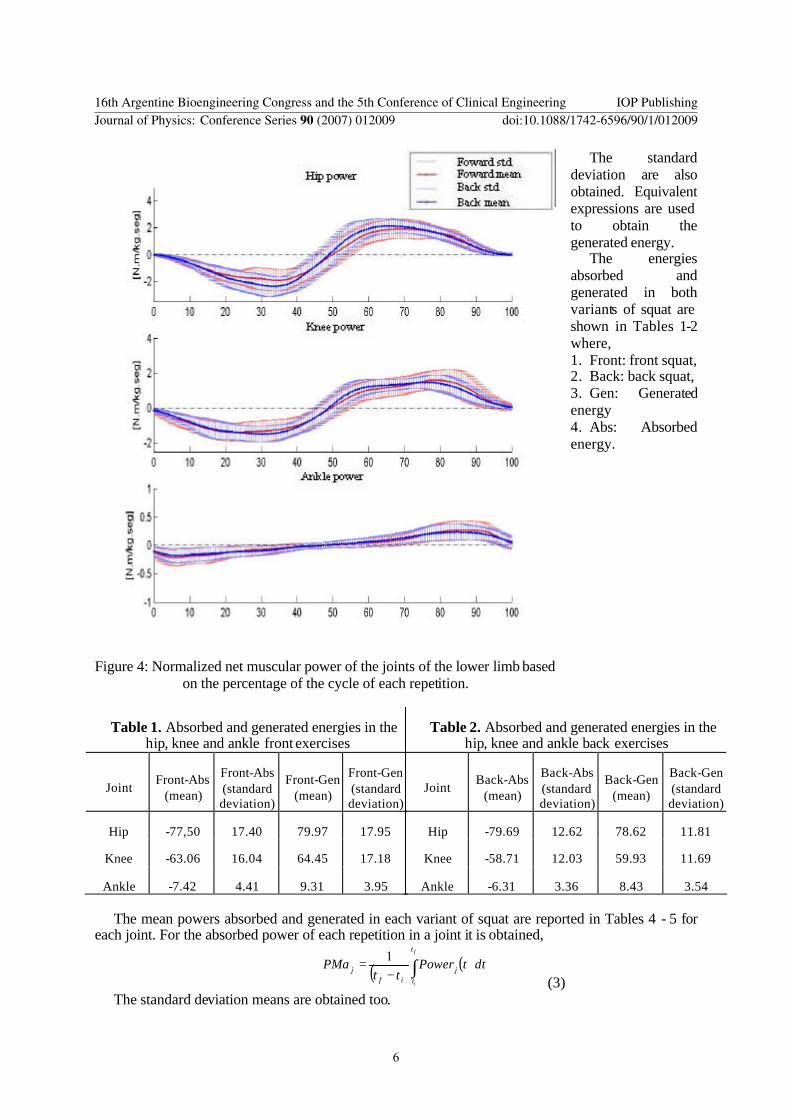