biomechanical analysis of the men’s and women’s long jump
TRANSCRIPT

- 107 -
Biomechanical analysis of the men’s and women’s long jumpat the 11th IAAF World Championships in Athletics, OSAKA 2007: A brief report
Hiroyuki Koyama1), Michiyoshi Ae1), Yuya Muraki2), Aya Yoshihara1), and Kazuhito Shibayama1)
1) Uneversity of Tsukuba, 2) Osaka University of Health and Sports Science
Abstract The men’s and women’s long jumpers at the 11th IAAF World Athletic Championships in Osaka were three-dimensionally analyzed in the preparatory, takeoff, airborne, and landing phases. The purpose of this brief report was to investigate kinematics of the top three long jumpers in Osaka 2007. The results on the preparatory phase indicated that the investigated jumpers increased the run-up speed until the 2nd last stride, and lowered their C.G. in the airborne phase of the 2nd last stride by lengthening the airborne time. An interesting observation was the lateral foot placement in the 2nd last stride and last stride, and an inward-inclined takeoff leg in the takeoff phase in the frontal plane, which induced effective use of the hip abductors of the takeoff leg to enhance the vertical velocity during the takeoff, as similar to the high jump (Okuyama et al., 2003)..
(財)日本陸上競技連盟
陸上競技研究紀要第5巻,107-118,2009
Bulletin of Studiesin Athletics of JAAF
Vol.5,107-118,2009
1. Introduction
The finals of the men’s and women’s long jump at the 11th IAAF World Championships in Athletics Osaka were held in 30th August and 28th August, respectively. The men’s winner, Irvine Saladino (PAN) marked his personal best and new African record of 8.57 m. In the women’s final, only Tatyana Lebedeva (RUS) jumped over 7.0 m, followed by Lyudmila Kolchanova (RUS) and Tatyana Kotova (RUS). The current world record of the men’s long jump was 8.95 m, marked by Mike Powel (USA) at the 3rd World Championships in Athletics Tokyo, 1991. In this game, Carl Lewis (USA) also jumped over 8.90 m, the previous world record by Bob Beamon. These jumps were studied by the biomechanical research project team organized by International Association of Athletics Federations and Japan Association of Athletics Federations. The report of this project provided findings for improving the performance, for example, the run-up speed of Powel and Lewis at the touchdown of the takeoff was over 11.0 m/s, and that of the other finalists was approximately 10.4 m/s; the less knee flexion of the takeoff leg was a very
important factor to gain the vertical velocity during the takeoff (Fukashiro et al., 1994). At the 11th World Athletic Championships in Osaka, the biomechanics research project was also organized by International Association of Athletics Federations and Japan Association of Athletics Federations, and videotaped the qualifications and finals of the men’s and women’s long jump to obtain biomechanical information of the elite athletes and to provide coaches and athletes with findings to improve their performance. The purpose of this brief paper was to report kinematics data of the top three men and women long jumpers in Osaka, 2007.
2. Methods
2.1 Analyzed jumps Tables 1 and 2 show the characteristics of the top three men and women long jumpers, which were analyzed in this report.
2.2 Data collection and reduction The men’s and women’s long jumpers qualified for the

- 108 -
finals of the long jump were videotaped with two high-speed video cameras (250 Hz) and two digital video cameras (60 Hz) placed on the top row of the stadium. The two high-speed video cameras covered the 2nd last stride, last stride and takeoff, and the normal digital video cameras videotaped the airborne and landing motions. A calibration pole with seven control points was set at the fourteen locations over the videotaping area to reconstruct the real coordinates of the jumpers’ segment endpoints. Three-dimensional coordinates of twenty-three segment endpoints were reconstructed by using a three-dimensional direct linear transformation (3D-DLT) method, and were smoothed with a Butterworth low-pass digital filter at optimal cut-off frequencies determined by residual analysis, 4.8 to 8.4 Hz. The official distance was divided into three lesser distances, which were takeoff distance, flight distance and landing distance, as shown in Figure 1. The takeoff distance (L1) is the horizontal distance between the front edge of the takeoff board and the center of gravity (C.G.) of the body at the instant of the toe-off. The flight distance (L2) is the horizontal distance that the C.G. travels while the athlete is in the air. The landing
distance (L3) is the horizontal distance between the C.G. at the instant the heels hit the sand and the ultimate mark in the sand made by the jumper. Toe-to-board distance (L4), which is the horizontal distance between the toe of the takeoff foot and the front edge of the board at the instance of the toe-off of the takeoff, was calculated as an indicator of the accuracy of the takeoff. The C.G., joint angles of the takeoff leg, hip and shoulder rotation angles, and trunk angle were calculated. The leg angle between the line connecting the hip to ankle joint of the takeoff leg and horizontal line was calculated in the sagittal and frontal planes.
3. Results and Discussion
3.1 Men's Final3.1.1 Performance descriptors Table 3 shows the competition result of the men’s long jump. Table 4 shows components of jumping distance of the long jump. The toe-to-board distance of the top three jumpers were ranging from 1.0 to 3.0 cm, which indicated that the run-up accuracy of the best jump was quite good in these jumpers. The takeoff distance (L1) was approximately 0.40 m and the percentage of that to
Figure 1. Definitions of components of jumping distance of the long jump
Table 1. Characteristics of the top three jumpers in the Men's final
Table 2. Characteristics of the top three jumpers in the Women's final

- 109 -
the total distance was about 5.0 %, and the contribution of the flight distance (L2) to the official distance was over 90 % (91.0~91.8 %). These results were similar to the previous report of the elite male long jumpers by Hay (1986). The flight distance of Saladino was 7.80 m (91.0 %) and longer than those of Howe (7.70 m) and Phillips (7.62 m), and the landing distances of the top three finalists were 0.39 m for Saladino, 0.36 m for Howe, and 0.26 m for Phillips, respectively. These distances were smaller than those of the finalist at the World Championship in TOKYO 1991 (0.47±0.09 m). The shorter landing distance in this final seems to result from
their landing motion. The data of this study indicated that the apparent landing distance, the horizontal distance between the C.G. and the heel at the instant of heel landing in the sand, was 0.51 m for Saladino and 0.48 m for Phillips, and these values were similar to that of the previous report of Tokyo. The mark of the heel of Phillips made in the sand was 8.53 m and further than that of Howe (8.51 m), indicating Phillips had a large loss of the distance by poor avoiding motion after landing.
3.1.2 Velocity of the C.G. Table 5 shows the horizontal and vertical velocities
Table 3. Results of the final of the men's long jump
Table 4. Distances within the long jump - Men's final

- 110 -
of the 2nd last stride, last stride and takeoff phases and takeoff angle. The run-up speed of the 2nd last stride was 10.65 m/s for Saladino, 10.99 m/s for Howe, and 11.01 m/s for Phillips, and then the speed decreased toward the takeoff. The data indicated that although Phillips reached the largest run-up speed at the touchdown of the 2nd last stride in the top three, the decrease in the speed from the 2nd last stride to the takeoff was the largest (-0.63 m/s), resulting in the smallest horizontal velocity at the touchdown of the takeoff (Saladino, 10.52 m/s; Howe, 10.87 m/s; Phillips, 10.38 m/s). Contrary, the decrease in the run-up speed for Saladino and Howe were smaller, -0.13 m/s for Saladino and 0.12 m/s for Howe, implying that their preparation for the takeoff were superior to Phillips’s one. The horizontal velocity at the touchdown for the top three was similar to the average of the reports on World Championship in Tokyo and Athens (Fukashiro et al., 1994; Arampatzis et al., 1999), with exception of M. Powel (11.00 m/s) and C. Lewis (11.06 m/s). The data represented that the horizontal velocity at the toe-off for Saladino was the smallest of the three, but his vertical toe-off velocity was the largest and contributed to gain the longest flight distance of the three. It is interesting that although the decreases in the horizontal velocity for Saladino and Howe were approximately same (Saladino,
-1.63 m/s; Howe, -1.61 m/s), the gained vertical velocity was very different (Saladino, 3.75 m/s; Howe, 3.46 m/s), indicating that the velocity conversion technique from the horizontal to the vertical for Saladino was superior to Howe.
3.1.3 Pathway of the C.G. Figure 2 shows pathways of the C.G. from the 2nd last stride to the takeoff for the three jumpers. The long jumpers lower the C.G. in the final stage of the run-up to make the body prepared to obtain the vertical velocity during the takeoff phase (Hay, 1986). The top three jumpers gradually lowered the C.G. from the 2nd last stride to the instant of the takeoff foot touchdown. The largest decrease in the C.G. height was achieved in the airborne phase of the 2nd last stride, which were 6.3 cm for Saladino, 8.6 cm for Howe, and 9.1 cm for Phillips. The phase time analysis indicated that the support time of the 2nd last stride was shorter and airborne time was longer, compared with the 3rd last stride. These data confirmed that the top three finalists changed the running motion and prepared for the takeoff during the support phase of the 2nd last stride. There were remarkable differences in the technique of lowering the C.G. during the last stride among the three athletes. Phillips continued lowering of the C.G. until the
Table 5. Horizontal and vertical velocities of the center of gravity (C.G.) of athletes and takeoff angle - Men's final

- 111 -
toe-off of the last stride. However, Saladino and Howe took off, raising the C.G. slightly during the second half of the support phase. It should be worthy to note that although Phillips’s large decrease in the C.G. height led the low position at the touchdown of the takeoff, his decrease in the horizontal velocity from the 2nd last stride to the takeoff was the largest of the three (Phillips, -0.63 m/s; Saladino, -0.13 m/s; Howe, -0.12 m/s).
3.1.4 Joint and leg angles during the takeoff phase Table 6 shows angles of the takeoff leg joints, trunk, hip and shoulder rotation at the touchdown and toe-off of the takeoff phase. Figure 3 shows the overhead views of the pathways of the C.G. from the 2nd last stride to the takeoff and the footprint of each support phase. The results on the knee joint indicated that the knee flexion and the maximum knee flexion velocity for Saladino were the smallest. Fukashiro et al. (1994) reported that the less knee flexion of the takeoff leg was a crucial factor to enhance the vertical velocity during the takeoff. The result of this final and previous report of Tokyo confirm that the less flexed takeoff leg helps to gain the vertical velocity in the takeoff phase. The hip rotation angles at the touchdown and toe-off of the takeoff phase were 1.1° and 39.1° for Saladino, -12.6° and 21.9° for Howe, and -5.8° and 17.8° fir
Phillips. The range of the hip rotation was 38.0° for Saladiono, 33.5° for Howe, and 23.6° for Phillips. These results indicated that the top three jumper rotated the hip of the lead leg forward in the swing of the lead leg during the takeoff, and the hip forward rotation of Saladino was the largest of the three. The previous report of Tokyo indicated that the range of the twist of the hip and shoulder during the takeoff positively correlated with the jump distance (r=0.86), and that of Powel and Lewis was 74° and 70°, respectively. As shown in table 6, the twist range of Saladino and Howe was 71.1° and 68.0° and similar to that of Powel and Lewis. The results of this study and previous report indicated that the twist of the hip and shoulder was an important motion during the takeoff phase to obtain the jumping distance. The leg angle (hip-ankle) in the frontal plane at the touchdown of the takeoff was -2.6° for Saladino, -4.7° for Howe, and -1.3° for Phillips, respectively., which indicated that the top three jumpers slightly inclined the takeoff leg inward at the touchdown of the takeoff. As shown in Figure 3, although the top three placed their support foot in the lateral position at the 2nd last and last strides, they placed their takeoff foot nearly under the C.G in the takeoff phase. Especially Howe’s takeoff foot was placed in much medial position to the C.G. during the takeoff phase. These results indicated that these jumpers placed
Figure2. Pathway of the center of gravity of the body from the touchdown (TD) of the 2nd last stride to the toe-off (TO) of the takeoff.

- 112 -
their takeoff foot in the medial side, which resulted in a slight inward lean of the takeoff leg during the takeoff phase. Okuyama et al. (2003) suggested that the use of the hip abductors of the inward inclined takeoff leg in the high jump was an important factor to enhance the vertical velocity during the takeoff. The behavior of takeoff leg of the top three jumpers with the previous study (Okuyama et al., 2003) imply that the elite long jumpers may have used their hip abductors of the takeoff leg to gain the vertical velocity during the takeoff phase.
3.2 Women’s final3.2.1 Performance descriptors Table 7 shows the competition result of the women’s long jump. Table 8 shows components of jumping distance of the long jump. Lebedeva marked the longest actual jump distance of the top three (7.08 m). The second longest actual jump was marked by the 3rd jumper, Kotova, and her jump was 10 cm longer than Kolchanova (Kotova, 7.05 m; Kolchanova, 6.95m). The
distance results indicated that Kolchanova’s second position may have attributed to the accuracy of the takeoff foot placement and landing. The landing distance of the top three was longer than that of the men’s finalists.
3.2.2 Velocity of the C.G. Table 9 shows the horizontal and vertical velocities of the C.G of the 2nd last stride, last stride and takeoff phases and takeoff angle. The run-up speed of the 2nd last stride was 9.52 m/s for Lebedeva, 9.23 m/s for Kolchanova, and 9.12 m/s for Kotova, and then slightly decreased until the touchdown of the takeoff, resulting in the 9.37 m/s for Lebedeva, 9.13 m/s for Kolchanova, and 9.08 m/s Kotova at the touchdown of the takeoff. The horizontal velocity at the toe-off for Lebedeva and Kolchanova was same (7.73 m/s). However, there was significant differences in the vertical toe-off velocity between these top two athletes (Lebedeva, 3.50 m/s; Kolchanova, 3.23m/s), indicating that Lebedeva’s
Table 6. Joint angles of the takeoff leg, trunk angle, hip and shoulder rotation angles, and leg angles at the touchdown (TD) and toe-off (TO) of the takeoff

- 113 -
longer jump resulted from larger gain of the vertical velocity during the takeoff. Kotova’s jump was very different from other two. The horizontal velocity at the toe-off was the largest of the three (8.14 m/s) because of the much less decrease in the horizontal velocity during the takeoff (Kotova, -0.94 m/s; Lebedeva, -1.64 m/s; Kolchanova, -1.40 m/s), and her toe-off vertical velocity was the smallest (3.18 m/s). Compared with the previous World Championships of the Tokyo and Athens (Fukashiro et al., 1994; Arampatzis et al., 1999), the run-up speed of the top three in Osaka was small, but there were no differences in the official distance among these competitions, with exception of J.J. Kersee and H. Drechsler. The results on the C.G. velocity indicated that the larger gain of the vertical velocity and the high takeoff angle for Lebedeva and Kolchanova and less decrease in the horizontal velocity for Kotova contributed to obtain their longer jump distance.
The gain of the vertical velocity until the maximum knee flexion of the takeoff leg (MKF) was 60.8 % for Lebedeva, 57.1 % for Kolchanova, and 39.1 % for Kotova, respectively. Previous studies of Lees et al. (1993, 1994) reported that the vertical velocity which long jumpers obtained until the MKF was a crucial factor for successful jump and over 64 % of the final vertical velocity for women and about 70 % for men. These indicated that the vertical velocity obtained until the MKF for the top three was smaller than that of the previous elite athletes. As mentioned above, Kotova obtained only 40 % of the final vertical velocity until the MKF even in the her best jump, however, she finally obtained the vertical velocity of 3.18 m/s, which were within the average of the elite female long jumper. These results indicated that Kotova might use different technique for the velocity conversion from the horizontal to the vertical during the takeoff.
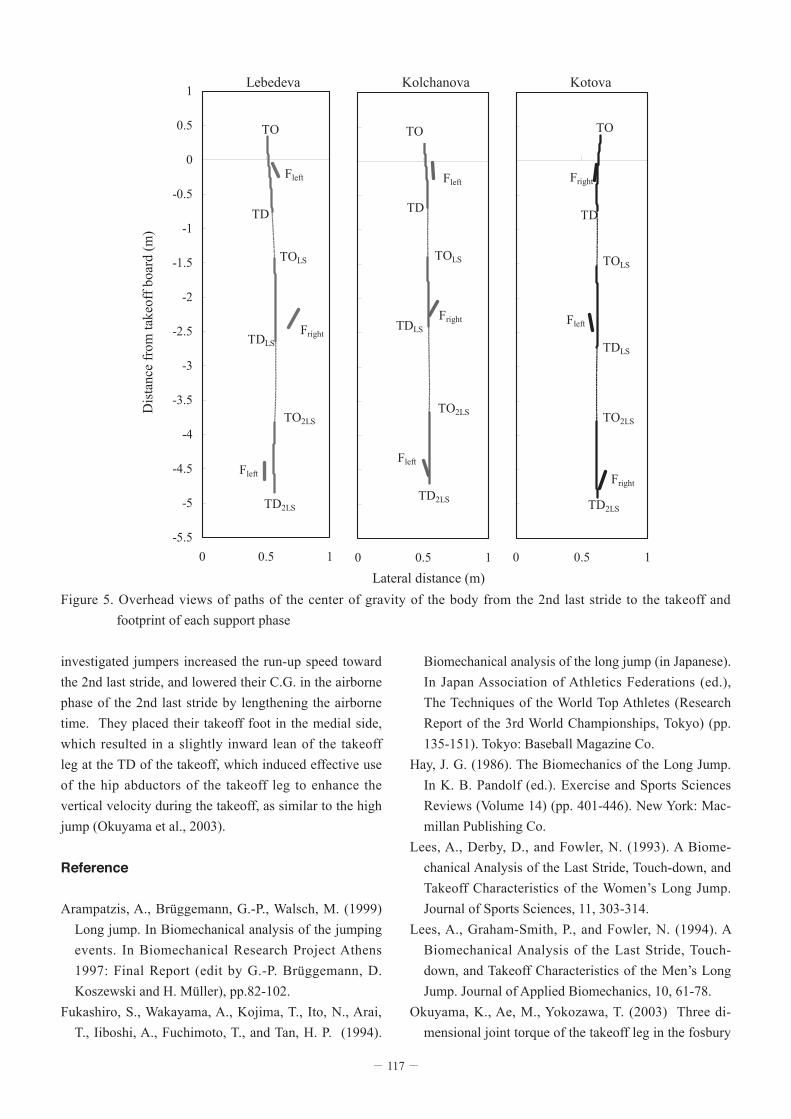
Figure 3. Overhead views of paths of the center of gravity of the body from the 2nd last stride to the takeoff and footprint of each support phase.

- 114 -
Table 7. Results of the final of the woen's long jump
Table 8. Distances within the long jump - Women's final

- 115 -
3.2.3 Pathway of the C.G. Figure 4 shows pathway of the C.G. from the 2nd last stride to the takeoff for women’s final. The lowering the C.G of the women’s top three was similar to the pattern
of the men. However, the absolute value of the decrease in the C.G. height in the 2nd last airborne phase was smaller (Lebedeva, 5.0 cm; Kolchanova, 6.8 cm; Kotova, 3.9 cm).
Table 9. Horizontal and vertical velocities of the center of gravity (C.G.) of athletes and takeoff angle - Women's final
Figure 4. Path of the center of gravity of the body from the touchdown(TD) of the 2nd last stride to the toe-off (TO) of the takeoff

- 116 -
3.2.4 Joint and leg angles during the takeoff Table 10 shows angles of the takeoff leg joints, trunk, hip and shoulder rotation at the touchdown and toe-off of the takeoff phase. Figure 5 shows the overhead views of the paths of the C.G. from the 2nd last stride to the takeoff and the footprint of each support phase. The knee flexion of the takeoff leg during the takeoff phase was 14.5° for Lebedeva, 15.4° for Kolchanova, and 6.5° for Kotova, and the minimum knee angle of the takeoff leg was approximately 143° to 146°. Compared with the top three men’s jumpers, the knee flexion and maximum knee flexional velocity of the women’s were much smaller than those of the men’s jumpers. The report of the Tokyo WC indicated that the knee flexion of the takeoff leg was smaller in women’s jumper than in the men’s jumper (Women, 19.5±3.7°; Men, 21.1±4.3°). The less flexion of the takeoff leg of women may be caused by the small muscular strength of the takeoff leg than men.
The leg angle (hip-ankle) in the frontal plane at the touchdown of the takeoff was -6.1° for Lebedeva, -7.7° for Kolchanova, and -4.3° for Kotova, and those at the toe-off of the takeoff were also the negative values (-8.1° for Lebedeva; -5.2° for Kolchanova; -6.2° for Kotova). These results indicated that the top three of the women inclined the takeoff leg inward over the takeoff phase as the men adapted. Additionally, the inward inclination of the takeoff leg was larger in the women than those of the men’s jumpers. As shown in figure 5, the women’s top three placed their takeoff foot much medially, and these led the inward-inclined takeoff leg during the takeoff. These motions of the takeoff leg imply the use of the hip abductors of the takeoff leg for enhancing the vertical velocity in the takeoff phase, as previously described.
4. Summary
The results on the preparatory phase indicated that the
Table 10. Joint angles of the takeoff leg, trunk angle, hip and shoulder rotation angles, and leg angles at the touchdown (TD) and toe-off (TO) of the takeoff
- 117 -
investigated jumpers increased the run-up speed toward the 2nd last stride, and lowered their C.G. in the airborne phase of the 2nd last stride by lengthening the airborne time. They placed their takeoff foot in the medial side, which resulted in a slightly inward lean of the takeoff leg at the TD of the takeoff, which induced effective use of the hip abductors of the takeoff leg to enhance the vertical velocity during the takeoff, as similar to the high jump (Okuyama et al., 2003).
Reference
Arampatzis, A., Brüggemann, G.-P., Walsch, M. (1999) Long jump. In Biomechanical analysis of the jumping events. In Biomechanical Research Project Athens 1997: Final Report (edit by G.-P. Brüggemann, D. Koszewski and H. Müller), pp.82-102.
Fukashiro, S., Wakayama, A., Kojima, T., Ito, N., Arai, T., Iiboshi, A., Fuchimoto, T., and Tan, H. P. (1994).
Biomechanical analysis of the long jump (in Japanese). In Japan Association of Athletics Federations (ed.), The Techniques of the World Top Athletes (Research Report of the 3rd World Championships, Tokyo) (pp. 135-151). Tokyo: Baseball Magazine Co.
Hay, J. G. (1986). The Biomechanics of the Long Jump. In K. B. Pandolf (ed.). Exercise and Sports Sciences Reviews (Volume 14) (pp. 401-446). New York: Mac-millan Publishing Co.
Lees, A., Derby, D., and Fowler, N. (1993). A Biome-chanical Analysis of the Last Stride, Touch-down, and Takeoff Characteristics of the Women’s Long Jump. Journal of Sports Sciences, 11, 303-314.
Lees, A., Graham-Smith, P., and Fowler, N. (1994). A Biomechanical Analysis of the Last Stride, Touch-down, and Takeoff Characteristics of the Men’s Long Jump. Journal of Applied Biomechanics, 10, 61-78.
Okuyama, K., Ae, M., Yokozawa, T. (2003) Three di-mensional joint torque of the takeoff leg in the fosbury
Figure 5. Overhead views of paths of the center of gravity of the body from the 2nd last stride to the takeoff and footprint of each support phase

- 118 -
flop style. Abstract and Proceedings. International So-ciety of Biomechanics XIXth Congress. (CD-ROM).