biomass for industrial material and energy use in...
TRANSCRIPT

1
Biomass for industrial material and energy use in Germany
Michael Carusnova-Institut GmbH

2
2
3
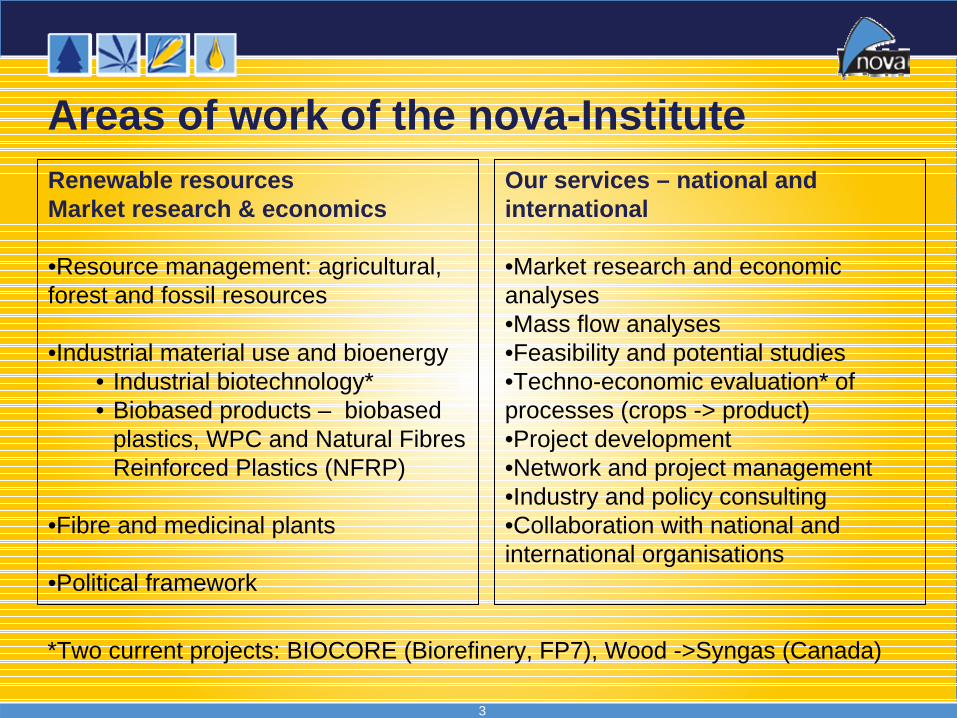
Renewable resources Market research & economics
•Resource management: agricultural,forest and fossil resources
•Industrial material use and bioenergy• Industrial biotechnology*• Biobased products – biobased
plastics, WPC and Natural Fibres Reinforced Plastics (NFRP)
•Fibre and medicinal plants
•Political framework
Areas of work of the nova-InstituteOur services – national and international
•Market research and economic analyses•Mass flow analyses•Feasibility and potential studies•Techno-economic evaluation* of processes (crops -> product)•Project development•Network and project management•Industry and policy consulting•Collaboration with national and international organisations
*Two current projects: BIOCORE (Biorefinery, FP7), Wood ->Syngas (Canada)

4

5

6
Volume, structure and trends in the
industrial material use of renewable
raw materials in Germany
7
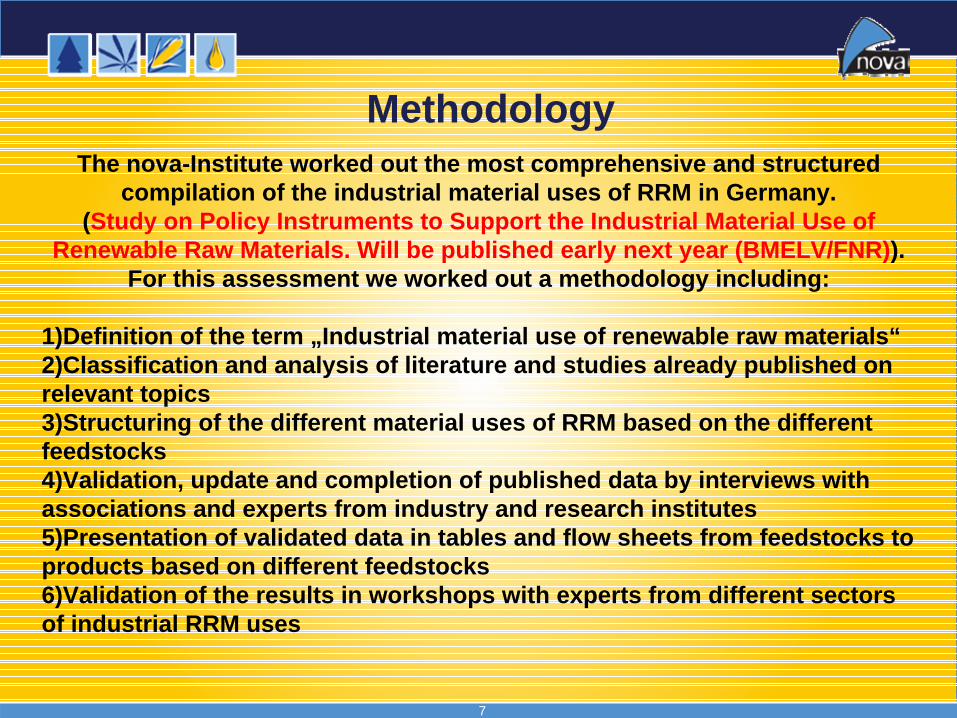
MethodologyThe nova-Institute worked out the most comprehensive and structured
compilation of the industrial material uses of RRM in Germany.(Study on Policy Instruments to Support the Industrial Material Use of
Renewable Raw Materials. Will be published early next year (BMELV/FNR)).For this assessment we worked out a methodology including:
1)Definition of the term „Industrial material use of renewable raw materials“2)Classification and analysis of literature and studies already published on relevant topics3)Structuring of the different material uses of RRM based on the different feedstocks4)Validation, update and completion of published data by interviews with associations and experts from industry and research institutes5)Presentation of validated data in tables and flow sheets from feedstocks to products based on different feedstocks6)Validation of the results in workshops with experts from different sectors of industrial RRM uses

8
The following definition is used by the nova-Institut for renewable raw materials for industrial material use:
„Renewable raw materials are the whole plant, animal and microbial biomass, which are – also through food chains – based on the photosynthetic primary production and to be used by man excluding the food and feed area for industrial material or energy use.
Material use of RRM is the use of biomass as raw material for the (industrial) production of goods of any kind“.
Source: nova-Institut 2009
Apart from self-produced RRM and products, the following data take only imported RRM and related intermediate products into account, which are used by the German processing industry (no imported finished products based on RRM).
9
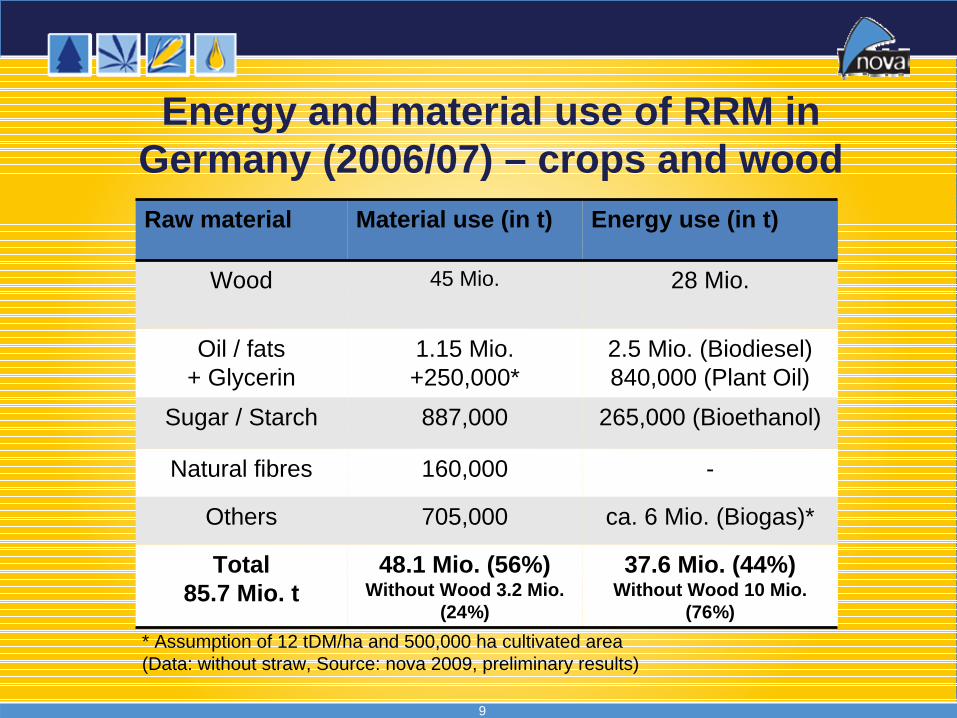
Energy and material use of RRM in Germany (2006/07) – crops and woodRaw material Material use (in t) Energy use (in t)
Wood 45 Mio. 28 Mio.
Oil / fats+ Glycerin
1.15 Mio.+250,000*
2.5 Mio. (Biodiesel)840,000 (Plant Oil)
Sugar / Starch 887,000 265,000 (Bioethanol)
Natural fibres 160,000 -
Others 705,000 ca. 6 Mio. (Biogas)*
Total85.7 Mio. t
48.1 Mio. (56%)Without Wood 3.2 Mio.
(24%)
37.6 Mio. (44%)Without Wood 10 Mio.
(76%)* Assumption of 12 tDM/ha and 500,000 ha cultivated area(Data: without straw, Source: nova 2009, preliminary results)
10
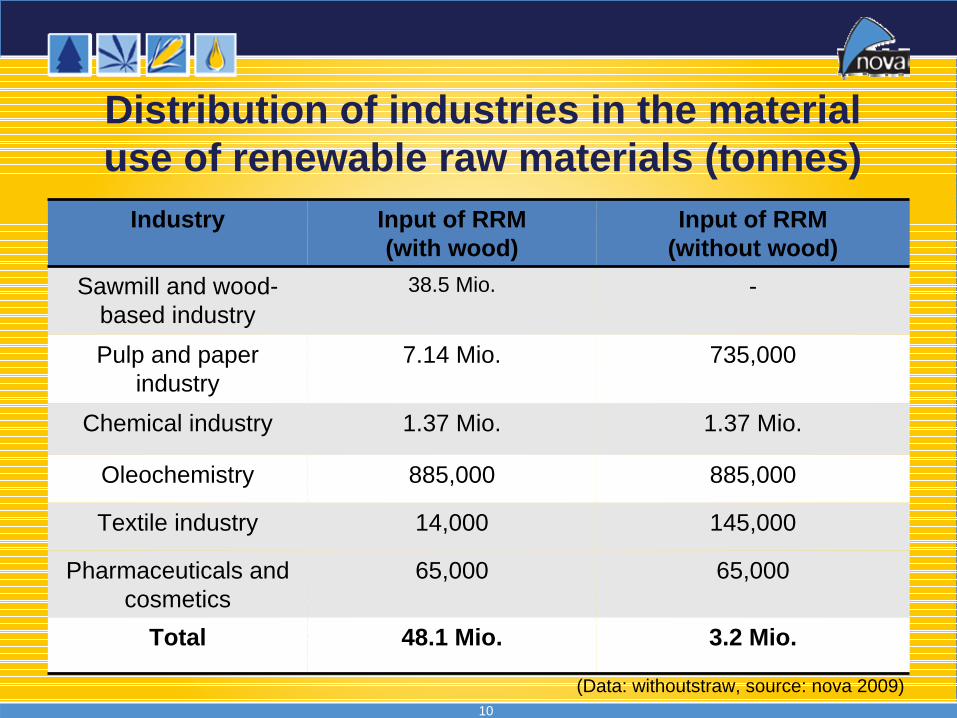
Industry Input of RRM(with wood)
Input of RRM(without wood)
Sawmill and wood-based industry
38.5 Mio. -
Pulp and paper industry
7.14 Mio. 735,000
Chemical industry 1.37 Mio. 1.37 Mio.
Oleochemistry 885,000 885,000
Textile industry 14,000 145,000
Pharmaceuticals and cosmetics
65,000 65,000
Total 48.1 Mio. 3.2 Mio.
(Data: withoutstraw, source: nova 2009)
Distribution of industries in the material use of renewable raw materials (tonnes)
11
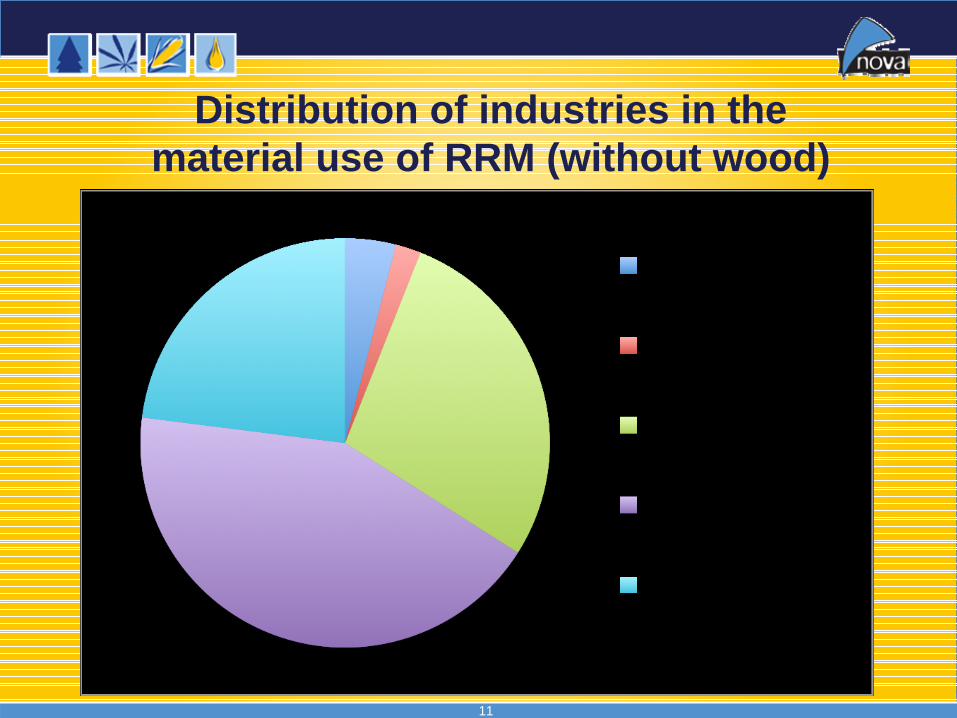
Distribution of industries in the material use of RRM (without wood)

12
Imports of RRM2.1 million tons of the total amount of 3.2 million tons for industrial material uses (without wood) in Germany are imported, that meansthat 65% are imported (mainly plant oils) and 35% are based on own production; Of the demand for wood, only 10% are imported.
This means that in total only 14% of the whole RRM are imported and 86% are based on own production.

13
Industrial material use of sugar and starch in Germany (Harvest 2007)

14
Source: März & nova 2008
Raw material Quantity (in t) Industries ProductsCrystal sugar 56,000 Chemical and
pharmaceutical industryPharmaceuticals,
construction chemistry, fermentation products,
cosmeticsMolasse 9,000 Chemical and
pharmaceutical industryEthanol*
Syrup 20,000 Chemical and pharmaceutical industry
Ethanol*
Starch 802,000 Paper, chemical and pharmaceutical industry
Paper starch, corrugated board, tensides, plastics,
antibiotics, cosmetics
Material use of sugar and starch
* About 10% of total Bioethanol production is used for material uses

15
Sugar
Material use of sugar and starch
Starch
Compared to the previous assessments, only 10% of the Isomaltose production (total production of sugar for Isomaltose: 140,000 t) are regarded as material use.
Source: März & nova 2008
16
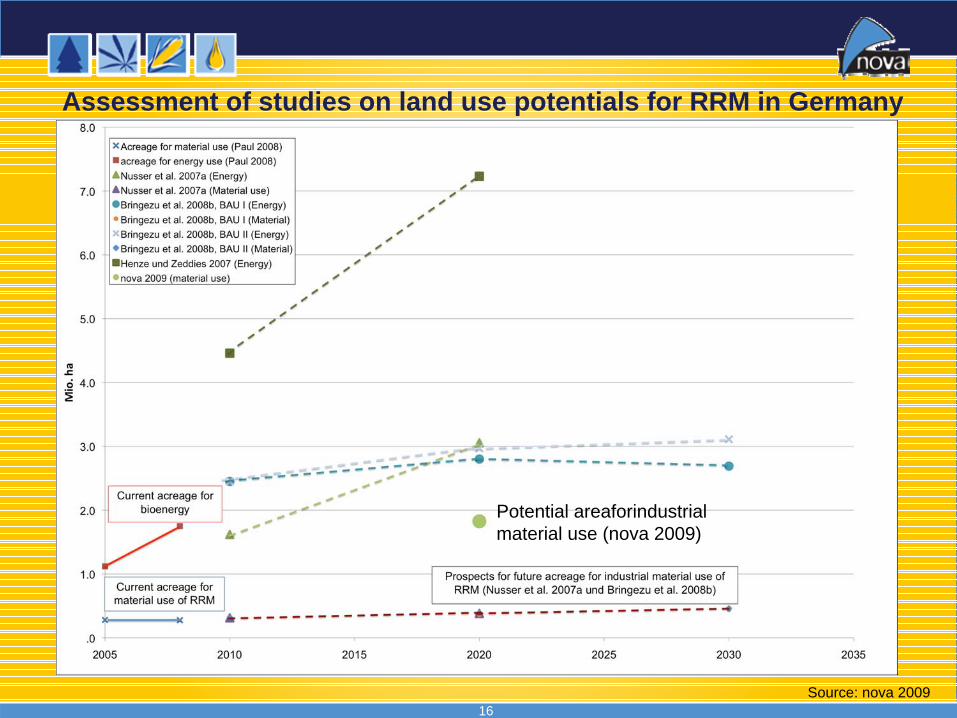
Assessment of studies on land use potentials for RRM in Germany
Source: nova 2009
Potential areaforindustrial material use (nova 2009)

17Source: nova 2009
Potential land availability for RRM in Germany (nova 2009)

18
Example: Current use and outlook for plant oils81 82 84 85 88
94 97 101
103 11
0 115
118 121 12
6 132 14
1 150 15
9 168 17
7 186 19
5 204
4%
1%
3%
2%
3%
6%
3%
4%
2%
7%
4%
3% 3%
4% 5%
7% 6% 6% 6% 5% 5% 5% 5%
0
50
100
150
200
250
1990
1991
1992
1993
1994
1995
1996
1997
1998
1999
2000
2001
2002
2003
2004
2005
2006
2007
e200
8
e200
9
e201
0
e201
1
e201
2
-40%
-35%
-30%
-25%
-20%
-15%
-10%
-5%
0%
5%
10%
Soybean Oil Palm OilRapeseed Oil Sunflower OilLauric Oils Animal FatsOthers TotalGrowth % per Year
mln
mt
Source: Hill 2008

19source: European Bioplastics
Trend: Growth in bio-basedplastic
In 2007 European Bioplastics forecasted that non bio-degradable bioplastics will have the highest growth ratemainly in the bio-based sector.
Forecast by nova-Institute 2009 due to recent investments:
2010: 890.000 t
(2007: 350.000 t)
20
Source: Frost & Sullivan 2009
The world market for chemicals made of RRM will reach a market value of over 5 billion dollars until 2015 and will therefore triple compared to 2008 (1.63 billion dollars).
This is projected by the consulting firm Frost & Sullivan, Frankfurt, in a study in which the applications lactic acid, succinic acid,glycerin, and 1,3-Propandiol in bioplastics, biocomposites and in the fields of „green chemicals” are analyzed.
Chemical based on RRM to triple their market value until 2015

21
RRM Acreage 2020Scenario 1 (“Old Policy”)
Acreage 2020Scenario 2 (“New Policy”)
Starch and sugar (Chemistry/Biotechnolo
gy)
116,000 ha Wheat44,000 ha Sugarbeet
475,000 ha Wheat175,000 ha Sugarbeet
Starch (Pulp and paper industry)
150,000 ha Wheat 180,000 ha Wheat
Plant oils (Oleochemistry,
biobased plastics)
424,000 ha Rapeseed 905,000 ha Rapeseed
Natural fibers (Hemp), Miscanthus, SRC
ca. 16,000 ha 65,000 – 70,000 ha
Medicinal plants 15,000 ha 20,000 ha
Total 765,000 ha 1,825,000 ha
Potential areas for the domestic cultivation of RRM for materials uses in Germany

22
Our aim
To carry out - based on the developed methodology for Germany - a complete assessment of the industrial material use in the European Union
• For this project, we are currently building a team of market researchers from different European countries. If you are interested to join the group, please contact us.
• Parallel, we are looking for different options for funding on national and EU level. Proposals are welcome.

23
Comprehensive comparison
between the use of RRM for energy
and industrial materials

24
Content
Factor of direct gross employment: material use vs. energy use
Factor of added value (i.e. turnover): material use vs. energy use
Case study: Gothe and Hahne 2005 (own revaluation)
Regional value-added of German wood cluster - 4 - 9
Case study: Hemp insulation material vs. rapeseed plant oil fuel (own calculation)
Comparison of 1 ha of hemp for insulation with 1 ha of rapeseed for plant oil fuel
ca. 8 -
I/O-Analysis: Nusser et al. 2007 Macroeconomic effects of culti-vation and use of different RRM (3-5) to 19 -
I/O-Analysis: Pöyry 2006 Value added and employment in P&P-Ind. and energy alternative ca. 10 ca. 6
Cluster study: Forests and wood (Seintsch et al. 2008, own calculation)
Macroeconomic effects of the German cluster forest and wood ca. 7 -
Industry data (own calculations) Employment and turnover in German industries > 6 > 8-9
Result (3) 5 to 10 (19) 4 to 9
Macroeconomic effects: Results per mass flow or hectare
Source: nova 2009

25
Macroeconomic effectsEnergy use vs. material use of RRM
• Despite different approaches and methodologies, the potential ofmaterial uses to raise direct gross employment and turnover liessignificantly above energy uses: Approximately factor 5 - 10 for employment and factor 4 - 9 for turnover (added value) per mass flow or hectare.
• Main reasons are the longer and more complex value chains in material applications.

26
GHG-reductions in to CO2-eq./(ha*year) of selected eco-balance studies comparing use of RRM for energy and industrial materials
(the black arrow indicates the additional GHG-reduction through use cascades)
Source: nova 2009

27
Comprehensive comparison between the use of RRM for energy and industrial materials
Criteria Energy Industrial material use
Employment and added value per mass flow or hectare
Short, simple value chains
Employment by a factor of approx. 5-10 and turnover by a factor 4-9 higher compared to energy use; mostly long and complex value chains
Biodiversity
Only a few cash crops like wheat, rapeseed, corn and sugar beet, highnutrient and plant protection requirements. Risk of monocultures.
On >10% of the cultivated area many different niche crops with low nutrient and low plant protection requirements. No difference for cash crops.
CO2/GHG-reductions Significant reduction compared to fossil energy
Often higher reductions compared to energy use; long-term CO2sequestration
Use cascades No use cascades Multiple material uses and final energy use possible
Importance in the future Low – many alternatives (solar, wind) High– no alternatives!

28
Comprehensive comparison between the use of RRM for energy and industrial materials
Criteria Energy Industrial material use
MarketsHighly regulated, standardized products (except biofuels: local markets)
Diverse products, unregulated markets, global competition
Policy support High policy support Virtually no policy support
Growth in cultivation area in Germany Times 10 in the last ten years No growth during the last ten
years
Unequal support of bioenergy and industrial material use leads to•unfair competition for cultivation areas and RRM•wrong allocation of RRM in terms of efficiency, GHG reduction and employment!

29
Support in ct/l Yield in l/ha Support in
€/ha
Share of support in revenue and price support
Biodiesel (Rapeseed), in ct/l
Pure fuel 28.75 1,450 417 20 - 35%*
Blending/Quota 60 1,450 870 50 - 80%
Plant oil fuel (Rapeseed)
Pure fuel 28.89 1,480 428 ca. 30%*
Bioethanol
Cereals
Pure fuel 65.45 1,660 1,086 ca. 45%
Blending/Quota 90 1,660 1,494 60 - 80%
Sugar beets
Pure fuel 65.45 4,054 2,635 ca. 45%
Blending/Quota 90 4,054 3,649 60 - 80%
BtL 65.45 3,910 ca. 2,540 no data
Policy support for RRM for biofuels (Germany)
Source: nova 2009, *After reduction of tax exemption

30
EEG-payment in ct/kWh
Support in ct/kWh
Yield in kWh/ha
Supportin €/ha
Share of support in revenue
Up to 150 kW 18.67 10 - 16 20,000 2,000-3,200 54 - 86%Up to 500 kW 16.18 7 - 13 20,000 1,400-2,600 43 - 80%Up to 5 MW 12.25 3 - 9 20,000 600-1,800 24 - 73%Up to 20 MW 7.79 0 - 5 20,000 0-1,000 0 - 64%
Policy support for RRM for biogas
Source: nova 2009
Policy support for RRM for industrial material uses:0 €/ha (2009)
• Public support for biomass use for energy can make up 50 % and more of its revenue.
• Only a very few cases in recent years and no systematic support for industrial material use comparable to the support for bioenergy.

31
Source: Adaptedfrom DBFZ 2009

32
Legal basis for support
Support in ct/l or ct/kWh
Yield in l/ha or kWh/ha Support in €/ha CO2-savings
per hectare
Biodiesel (Rapeseed)
Pure fuel EnStG 28.75* 1,450 417 3.0
Blending (Quota) BiokraftQuG 60 1,450 870 3.0
Plant oil fuel (Rapeseed)
Pure fueld EnStG 28.89* 1,480 428 3.0
Bioethanol
from cereals
Purefuel EnStG 65.45 1,660 1,086 3.7
Blending (Quota) BiokraftQuG 90 1,660 1,494 3.7
from sugar beets
Purefuel EnStG 65.45 4,054 2,653 9.4
Blending (Quota) BiokraftQuG 90 4,054 3,649 9.4
BtL EnStG 65.45 3,910 2,560 10.0
Biogas (Maize) EEG 5-16 20,000 1,000-3,200 7.4
Open space photovoltaic plant EEG 23-29 270,000 62,100- 78,300 185.0
Sources: nova 2009, Schmitz et al. 2009, *After reduction of tax exemption
Policy support for bio- and solar energy and CO2-savings per hectare (Germany 2009)

33
Support in € je tonne of saved CO2-equivalents- Deviations due to the assumptions made (yields and degree of support) are indicated by +/- 20%
error bars- Support due to EEG, Quotas and tax reduction (Germany 2009)

34
New Policy
Food
Feed
Industrial Material Use (“fibres”)
Bioenergy (“fuel”)
35
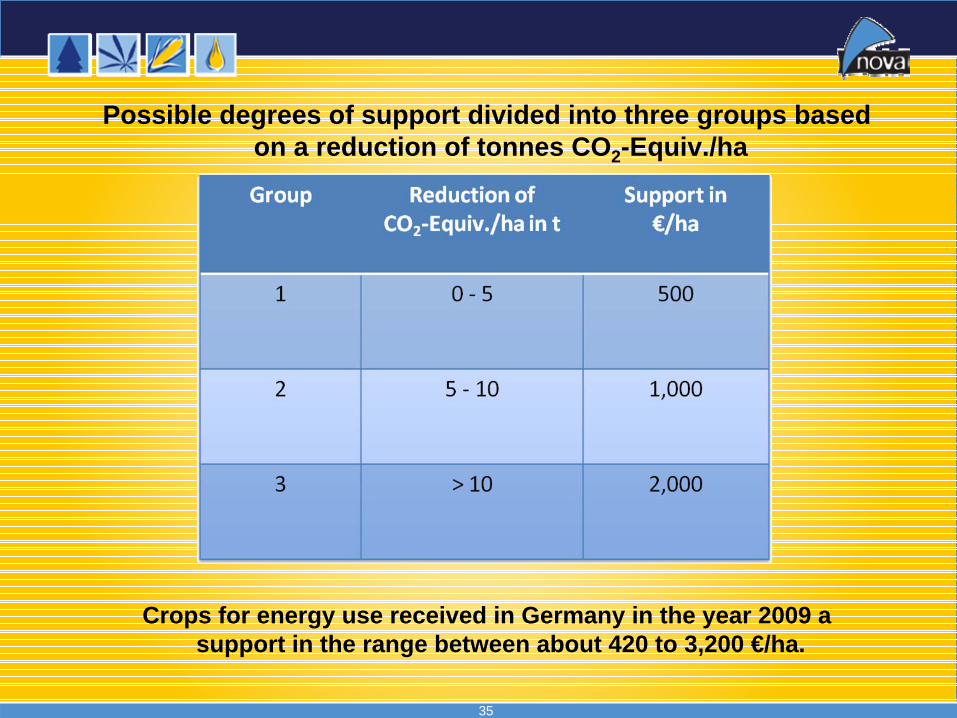
Crops for energy use received in Germany in the year 2009 a support in the range between about 420 to 3,200 €/ha.
Possible degrees of support divided into three groups based on a reduction of tonnes CO2-Equiv./ha

36
Support of the industrial material use
How?
? Reintroduction of the refund system
for all renewable resources
? Increasing taxes on non-renewable
carbon – crude oil, natural gas – also for
the Chemical Industry
37
Feedstock for Industrial Material UseDue to the results of different nova-studies, there will be only enough feedstock for Industrial Material Use/Industrial Biotechnology, if:
•we will be able to activate strongly the potentially free areas (0.5 – 1.6 Billion ha!) for agriculture and to increase the productivity (times 5-10) in developing countries - that means huge investment and reforms (nearly no response in 2008/2009 on higher prices by developing countries)
•we switch from bioenergy to solar and wind energy (50 – 100 times more efficient) and strongly increase the use of solar and wind energy
•we establish a new policy for equal support of bioenergy and industrial material use based on their efficiency, GHG reduction/ha and employment/ha
Otherwise „Food & Feed first“ and increasing population and meat consumption means: No feedstock left for Industrial Material Use!