biomarkers for environmental monitoring · current status in environmental monitoring and...
TRANSCRIPT

Biomarkers for Environmental Monitoring Suggestions for Norwegian monitoring programs
RAPPORT
M-88 2013

Biomarkers for Environmental Monitoring | M-88 2013
1

BIBLIOTEKSKJEMA
Miljødirektoratet Postadr: postboks 5672, Sluppen, 7485 Trondheim | Tel: 03400/73 58 05 00 | Faks: 73 58 05 01 | Org.nr: 999 601 391 E-post: [email protected] | Internett: www.miljødirektoratet.no
Utførende institusjon ISBN-nummer kan tas ut (Frivillig å bruke)
EnviroPlanning AB [ISBN-nummer]
Oppdragstakers prosjektansvarlig Kontaktperson M-nummer
Helena Norin Niklas Hanson M-88
År Sidetall Miljødirektoratets kontraktnummer SPFO-nummer
2013 71 7013536 [SPFO-nummer]
Utgiver Prosjektet er finansiert av
Miljødirektoratet Miljødirektoratet
Forfatter(e)
Niklas Hanson, Maja Halling, Helena Norin
Tittel – norsk og engelsk
Biomarkers for Environmental Monitoring - Suggestions for Norwegian monitoring programmes
Sammendrag – summary
In Norway, monitoring of chemical contamination is performed within four different environmental monitoring programs; monitoring of hazardous substances in Norwegian fjords and coastal waters (MILKYS), monitoring of pollutants in large lakes, monitoring of pollutants in urbanized fjords, and monitoring of pollutants in terrestrial and urbanized environments. Besides chemical concentrations, a number of biological markers (biomarkers) are included in MILKYS. This report evaluates if the used biomarkers are useful in relation to the aim of the program and if biomarkers could be useful within the three other programs. A large number of biomarkers were assessed and ranked according to specificity for chemicals, ecological relevance, ability to provide early warning, ability to detect different types of chemicals and mixtures, current status in environmental monitoring and feasibility of the analysis. The following biomarkers are suggested to be used: Fjords and coastal waters (MILKYS): EROD (or CYP1A), PAH-metabolites in bile, vitellogenin in fish, aromatase in fish and liver somatic index (LSI) in fish Large lakes: EROD (or CYP1A), vitellogenin in fish, aromatase in fish, liver somatic index (LSI) in fish and macroscopic liver neoplasms in fish Urbanized fjords: Micronuclei test in fish, skeletal deformities in fish, antioxidants in fish liver (Cat, GST, GR), macroscopic liver neoplasms in fish and total oxyradical scavenging capacity (TOSC) in blue mussel Terrestrial and urbanized environment: Congenital malformations in birds, egg shell thickness for carnivorous birds, hatching success and brood size for birds, EROD in birds and gonadal aromatase activity in brown rat
4 emneord 4 subject words
Biomarkers, Environmental monitoring, Pollution, Contamination

Biomarkers for Environmental Monitoring | M-88 2013
2
Preface
EnviroPlanning AB has been commissioned by the Norwegian Environment Agency
(Miljødirektoratet) to perform a literature study of biomarkers in order to identify and
suggest biomarkers for Norwegian environmental monitoring of pollutants. The aim of the
study was to find biomarkers that:
are relevant for biological effects relating to changes high in the biological hierarchy
(individual, population, community or ecosystem)
are relevant for the current Norwegian monitoring programs in fjords and coastal
waters, large lakes, urbanized fjords and terrestrial and urbanized environments
include long-term effects
are relevant for mixture toxicity
The report has been written by Ph.D. Niklas Hanson, M.Sc. Maja Halling and M.Sc. Helena
Norin. The report has been reviewed by Professor Åke Larsson and Ph.D. Tim Hipkiss.
The contact person at the Norwegian Environment Agency has been Eivind Farmen.
Göteborg, november 2013
Helena Norin
Technical Supervisor for Sustainable Chemicals Management, EnviroPlanning AB
Biomarkers for Environmental Monitoring | M-88 2013
3
Innhold
Preface .......................................................................................................... 2
Innhold ........................................................................................................... 3
Sammendrag .................................................................................................... 5
Summary......................................................................................................... 6
1. Introduction ................................................................................................. 7
1.1 Ecological risk of chemicals ........................................................................ 7
1.2 Environmental monitoring .......................................................................... 7
1.2.1 Monitoring of chemical concentrations ................................................... 7
1.2.2 Biological monitoring ........................................................................ 9
1.2.3 Biomarkers ................................................................................... 10
2. Environmental monitoring in Norway ................................................................. 11
2.1 Monitoring in fjords and coastal waters (MILKYS) ............................................ 11
2.2 Other Norwegian monitoring programs ......................................................... 12
2.2.1 Monitoring of pollutants in large lakes ................................................. 12
2.2.2 Pollutants in urbanized fjords ............................................................ 12
2.2.3 Pollutants in terrestrial and urbanized environments ............................... 13
3. Environmental monitoring with biomarkers in other countries .................................. 13
3.1 Sweden ............................................................................................... 13
3.2 United Kingdom ..................................................................................... 15
3.3 Canada ............................................................................................... 16
4. “Omics” – biomarkers under development ........................................................... 17
4.1 Transcriptomics ..................................................................................... 17
4.2 Proteomics ........................................................................................... 17
4.3 Metabolomics ....................................................................................... 17
5. Evaluation of biomarkers used in Norway ............................................................ 18
5.1 Imposex in dog whelk .............................................................................. 18
5.2 OH-pyrene in Atlantic cod bile ................................................................... 20
5.3 ALA-D (-aminolevulinic acid dehydratase) in Atlantic cod blood ......................... 21
5.4 CYP1A and ethoxyresorufin O-deethylase (EROD) in Atlantic cod liver ................... 21
6. Ranking of biomarkers ................................................................................... 22
6.1 Properties used for ranking of biomarkers ..................................................... 23
6.1.1 Specificity for chemicals .................................................................. 24
6.1.2 Ecological relevance ....................................................................... 24
6.1.3 Early warning signal ........................................................................ 24
6.1.4 Mixture effects .............................................................................. 24
6.1.5 Current status ............................................................................... 25

Biomarkers for Environmental Monitoring | M-88 2013
4
6.1.6 Analysis ....................................................................................... 25
6.2 Ranking of selected biomarkers ................................................................. 25
6.2.1 Biomarkers with high ecological relevance ............................................ 26
6.2.2 Biomarkers for mixture effects .......................................................... 29
6.2.3 Biomarkers that are good early warning signals ...................................... 30
7. Recommendations for Norwegian monitoring ....................................................... 32
7.1 Monitoring in fjords and coastal waters (MILKYS) ............................................ 32
7.2 Monitoring of pollutants in large lakes ......................................................... 34
7.3 Monitoring of pollutants in urbanized fjords .................................................. 35
7.4 Monitoring of pollutants in terrestrial and urbanized environments ...................... 36
8. References ................................................................................................. 38
Appendix A – List of biomarkers ........................................................................... 46
References – Appendix A ................................................................................... 55
Appendix B – Scores biomarkers ........................................................................... 62
Biomarkers for Environmental Monitoring | M-88 2013
5
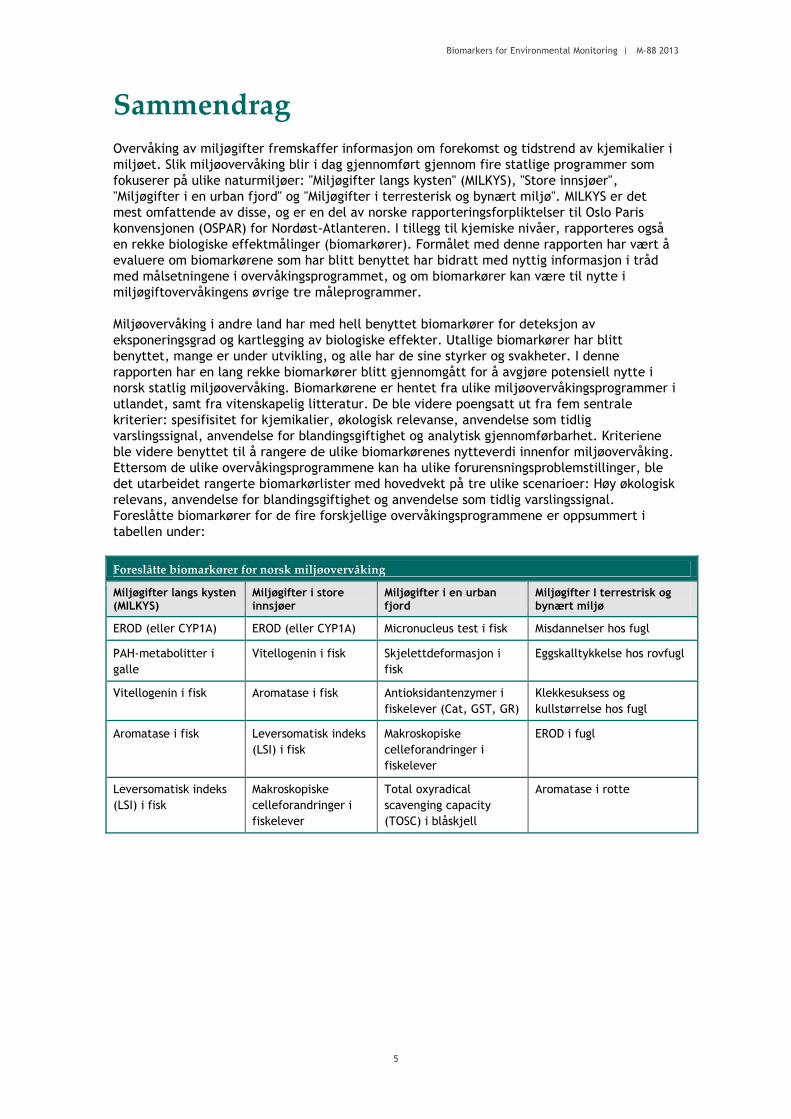
Sammendrag
Overvåking av miljøgifter fremskaffer informasjon om forekomst og tidstrend av kjemikalier i
miljøet. Slik miljøovervåking blir i dag gjennomført gjennom fire statlige programmer som
fokuserer på ulike naturmiljøer: "Miljøgifter langs kysten" (MILKYS), "Store innsjøer",
"Miljøgifter i en urban fjord" og "Miljøgifter i terresterisk og bynært miljø". MILKYS er det
mest omfattende av disse, og er en del av norske rapporteringsforpliktelser til Oslo Paris
konvensjonen (OSPAR) for Nordøst-Atlanteren. I tillegg til kjemiske nivåer, rapporteres også
en rekke biologiske effektmålinger (biomarkører). Formålet med denne rapporten har vært å
evaluere om biomarkørene som har blitt benyttet har bidratt med nyttig informasjon i tråd
med målsetningene i overvåkingsprogrammet, og om biomarkører kan være til nytte i
miljøgiftovervåkingens øvrige tre måleprogrammer.
Miljøovervåking i andre land har med hell benyttet biomarkører for deteksjon av
eksponeringsgrad og kartlegging av biologiske effekter. Utallige biomarkører har blitt
benyttet, mange er under utvikling, og alle har de sine styrker og svakheter. I denne
rapporten har en lang rekke biomarkører blitt gjennomgått for å avgjøre potensiell nytte i
norsk statlig miljøovervåking. Biomarkørene er hentet fra ulike miljøovervåkingsprogrammer i
utlandet, samt fra vitenskapelig litteratur. De ble videre poengsatt ut fra fem sentrale
kriterier: spesifisitet for kjemikalier, økologisk relevanse, anvendelse som tidlig
varslingssignal, anvendelse for blandingsgiftighet og analytisk gjennomførbarhet. Kriteriene
ble videre benyttet til å rangere de ulike biomarkørenes nytteverdi innenfor miljøovervåking.
Ettersom de ulike overvåkingsprogrammene kan ha ulike forurensningsproblemstillinger, ble
det utarbeidet rangerte biomarkørlister med hovedvekt på tre ulike scenarioer: Høy økologisk
relevans, anvendelse for blandingsgiftighet og anvendelse som tidlig varslingssignal.
Foreslåtte biomarkører for de fire forskjellige overvåkingsprogrammene er oppsummert i
tabellen under:
Foreslåtte biomarkører for norsk miljøovervåking
Miljøgifter langs kysten (MILKYS)
Miljøgifter i store innsjøer
Miljøgifter i en urban fjord
Miljøgifter I terrestrisk og bynært miljø
EROD (eller CYP1A) EROD (eller CYP1A) Micronucleus test i fisk Misdannelser hos fugl
PAH-metabolitter i
galle
Vitellogenin i fisk Skjelettdeformasjon i
fisk
Eggskalltykkelse hos rovfugl
Vitellogenin i fisk Aromatase i fisk Antioksidantenzymer i
fiskelever (Cat, GST, GR)
Klekkesuksess og
kullstørrelse hos fugl
Aromatase i fisk Leversomatisk indeks
(LSI) i fisk
Makroskopiske
celleforandringer i
fiskelever
EROD i fugl
Leversomatisk indeks
(LSI) i fisk
Makroskopiske
celleforandringer i
fiskelever
Total oxyradical
scavenging capacity
(TOSC) i blåskjell
Aromatase i rotte

Biomarkers for Environmental Monitoring | M-88 2013
6
Summary
Environmental monitoring of chemicals is performed to provide information about the
distribution of chemicals in the environment and their temporal trends. In Norway,
monitoring of chemical contamination is performed within four different programs, which are
focused on different environments. The programs are monitoring of hazardous substances in
Norwegian fjords and coastal waters (MILKYS), monitoring of pollutants in large lakes,
monitoring of pollutants in urbanized fjords, and monitoring of pollutants in terrestrial and
urbanized environments. MILKYS is the largest of the programs, and the results are reported
to OSPAR. Besides chemical concentrations, a number of biological markers (biomarkers) are
included in MILKYS. In the present report, it is evaluated if the biomarkers that are used
provide useful information in relation to the aim of the program. Furthermore, it is evaluated
if biomarkers could be useful within the three other programs.
Biomarkers have successfully been used in environmental monitoring and assessment around
the world to detect exposure to and effects of chemicals. Many different biomarkers have
been used or are under development, and they all have different strengths and weaknesses.
In the present report, a large number of biomarkers were assessed for their potential use in
Norwegian monitoring programs. The biomarkers were collected from monitoring programs in
various countries and from the scientific literature. The biomarkers were given scores for five
properties that were considered important for environmental monitoring. Those were
specificity for chemicals, ecological relevance, ability to provide early warning, ability to
detect different types of chemicals and mixtures, current status in environmental monitoring,
and feasibility of the analysis. Based on the properties, the biomarkers were then ranked for
usefulness in environmental monitoring. As different properties are valued in different
monitoring scenarios, three different rankings of biomarkers were created. In the different
rankings, higher weight was put on ecological relevance, ability to detect mixture effects, or
ability to act as an early warning signal. Based on the results, biomarkers were suggested for
the four different monitoring programs according to the table below.
Suggested biomarkers for Norwegian environmental monitoring
Fjords and coastal waters (MILKYS)
Large lakes Urbanized fjords Terrestrial and urbanized environment
EROD (or CYP1A) EROD (or CYP1A) Micronuclei test in fish Congenital malformations in
birds
PAH-metabolites in
bile
Vitellogenin in fish Skeletal deformities in
fish
Egg shell thickness for
carnivorous birds
Vitellogenin in fish Aromatase in fish Antioxidants in fish liver
(Cat, GST, GR)
Hatching success and brood
size for birds
Aromatase in fish Liver somatic index
(LSI) in fish
Macroscopic liver
neoplasms in fish
EROD in birds
Liver somatic index
(LSI) in fish
Macroscopic liver
neoplasms in fish
Total oxyradical
scavenging capacity
(TOSC) in blue mussel
Gonadal aromatase activity
in brown rat

Biomarkers for Environmental Monitoring | M-88 2013
7
1. Introduction
1.1 Ecological risk of chemicals
Although most chemicals have contributed positively to human society, e.g., by providing
food and welfare, there are also numerous examples of chemicals that have caused harm to
human health as well as the ecosystem. For ecosystems around the world this has, for
example, resulted in loss of biodiversity (Preston and Shackelford 2002). Ecological risk
assessment (ERA) is performed, to reduce the risk for environmental harm (Suter 1993). ERA
is most often based on simple toxicity tests, such as acute mortality for small crustaceans and
fish, and growth inhibition for algae. From the tests, a presumed safe concentration is
established. If the environmental concentration is not expected to exceed this concentration
following normal use, it is assumed that the chemical can be used without harming the
environment. However, there are substantial difficulties involved in extrapolating results
from short experiments in the laboratory to long term effects in the environment (Cairns and
Mount 1990). To deal with this, safety factors are used. It has been shown that although these
safety factors are usually protective, they can also sometimes be underproductive (Ahlers et
al 2006). It could be argued that if ERA does not fully protect the environment, higher safety
factors should be used. However, this is complicated as it would also mean that more
chemicals that do not pose an environmental risk are unnecessarily restricted or banned
(Hanson and Stark 2012). As a result of current ERA practices, it cannot be expected that the
environment is protected from all potential chemical threats. Furthermore, ERA is performed
for one chemical at a time, while they occur in mixtures in the environment. The total
toxicity of those mixtures is often unknown. There are also many chemicals for which ERA has
never been performed. Environmental monitoring is a necessary tool to detect environmental
threats that, for whatever reason, have not been detected by ERA.
1.2 Environmental monitoring
Environmental monitoring of chemicals is carried out to provide information about the
distribution of chemicals in the environment and their temporal trends. Monitoring can be
performed by measuring concentrations of the actual substances of interest (contamination)
or by using biological endpoints to estimate pollution from chemicals. The different strategies
are described below.
1.2.1 Monitoring of chemical concentrations Monitoring of chemical concentrations is the most frequently used method for environmental
monitoring of chemicals. However, there are limitations with this approach that reduces the
usefulness for environmental management. The most important limitation is that chemical
measurements only provide information about the chemicals that are included in the analysis
(Wernersson 2012). Although it is possible to monitor a large number of substances, the cost
soon becomes unmanageable. Furthermore, the substances that were emitted to the
environment may have been transformed so that they are no longer covered by the analytical
method, and for many substances no analytical method has been developed. This means that
monitoring of chemicals in the environment cannot be expected to provide information about
unexpected or unknown environmental threats. In simpler monitoring situations, such as a
single industrial discharge, this may not be a problem as the most important pollutants are
often known. However, for diffuse pollution or complex mixtures of chemicals, the mentioned
limitations can be considerable.
One example that highlights the limitations with chemical monitoring is the recent interest in
perfluorooctanesulfonic acid (PFOS), which was brought to attention in the early 2000s
(Lehmler 2005). This attention resulted in that PFOS was included in environmental
monitoring programs and that it was regulated to reduce risk. In 2010, a retrospective

Biomarkers for Environmental Monitoring | M-88 2013
8
analysis of PFOS in guillemot (Uria aalge) eggs from Stora Karlsö in the Baltic Proper showed a
dramatic increase in PFOS from 1970 to 2010 (Figure 1). However, the increase occurred
before PFOS was recognized as an environmental risk and included in monitoring programs.
Environmental monitoring did, thus, not provide any valuable information about the
increasing risk posed by PFOS. It is highly likely that other chemicals are increasing in the
environment in a similar way today, but are missed by routine chemical monitoring as they
have not yet been recognized as environmental threats.
Figure 1. The change in concentration of perfluorooctanesulfonic acid (PFOS) over time. The measurements were
performed retrospectively in guillemot eggs from Stora Karlsö in the Baltic Proper. The red dots in the figure are
based on pooled samples or mean values of individual samples. The curves show logarithmic increase and the moving
average. The figure is modified from Bignert et al (2012).
Another limitation with environmental monitoring of chemical concentrations is that the same
concentration in two different areas may have very different effects on the ecosystem. This is
because environmental and ecological factors may affect the uptake and toxicity of chemicals
(Whitfield 2001). Those factors include temperature, salinity, age structure and diversity.
Interactions with environmental factors, or with other chemicals in the environment, may be
both synergistic and antagonistic (Cairns and Mount 1990).
In every monitoring program, it is essential to have pre-defined assessment criteria to which
the results are compared (unless the aim is solely to monitor for trends). For concentrations
of chemicals, it is relatively easy to set such criteria. For many chemicals, toxicity data are
available that can be used to determine safe environmental concentrations. For other
chemicals, where such data are not available, background levels from reference sites can be
used as guidance. If the reference sites retain satisfactory ecological values, it is assumed
that those concentrations are safe. For species that are used for human consumption, safe
concentrations are often based on human exposure through food.
Table 1 lists the most important benefits and drawbacks with environmental monitoring based
on chemical measurements.

Biomarkers for Environmental Monitoring | M-88 2013
9
Table 1 Benefits and drawbacks with environmental monitoring based on chemical measurements
Benefits Drawbacks
Provides detailed information about the
concentrations of specific chemicals
Provides no information about chemicals
other than those included in the analysis,
and often not even about degradation
products of the monitored chemicals
Easily related to legal limit values / Easy to
define limit values
Mixture effects and interactions between
chemicals (synergistic as well as
antagonistic) are not included
Easily standardized methods with high
precision and repeatability
Interactions with the environment
(temperature, pH, turbidity etc) are not
included
1.2.2 Biological monitoring As emphasis is increasingly shifting from known point sources to diffuse pollution (Crathorne
et al 1996) and mixtures of known and unknown pollutants, chemical monitoring may not be
satisfactory in all situations. An alternative to chemical monitoring is biological monitoring, or
biomonitoring. Most commonly, the endpoint of biological monitoring is abundance of a
species or a measure of biodiversity. For example, community structure for benthic
macrofauna has been widely used to determine environmental stress in the aquatic
environment (Ingole et al 2006) and biotic indices based on the presence or absence of
certain indicator species are often used to simplify the interpretation (Bustos-Baez and Frid
2003, Roberts et al 1998).
The major benefit of biological monitoring is that the ecological relevance is high, which also
means that relevance for environmental management is high. Other benefits of biological
monitoring are that bioavailability always is included, and mixture effects of known and
unknown chemicals often are included. Furthermore, interactions with the environment are
automatically included in the biological response, which may be beneficial as it increases the
ecological relevance.
There are also a number of drawbacks with biomonitoring, compared to chemical monitoring.
In most cases, it is difficult to determine the cause of an observed alteration. Thereby, it may
be difficult to determine the most cost effective action to reduce risk. Methods for
biomonitoring are also often difficult to standardize, leaving more room for subjective
interpretations of the results. The establishment of assessment criteria, or critical effect size
(CES), is also more complicated due to the inherent variability in biological systems
(Munkittrick et al 2009). This means that there is a substantial risk of reaching the wrong
conclusion (Hanson 2010). A final drawback with biological monitoring is that effects are not
seen until the populations or communities are significantly affected. It is desirable to have
methods that provide early warning so that effects on higher levels can be avoided.
Table 2 lists the most important benefits and drawbacks with biomonitoring that is based on
abundance and/or diversity.

Biomarkers for Environmental Monitoring | M-88 2013
10
Table 2 Benefits and drawbacks with biomonitoring that is based on abundance and/or diversity
Benefits Drawbacks
High ecological relevance Difficult to link effects to specific chemicals
or sources
Includes mixture effects and interactions
between chemicals (synergistic as well as
antagonistic)
Confounding factors (temperature, pH,
turbidity etc)
Includes bioavailability and interactions with
the environment
Methods may be difficult to standardize
(depending on ecosystem and species).
Precision and repeatability are often low.
Difficult to define critical effect size (CES).
1.2.3 Biomarkers The concept of biological monitoring can be extended to include sub-organismal
measurements. These are often referred to as biomarkers (or biological markers) and include
biochemical responses as well as physiological and histopathological alterations caused by
chemicals (Shugart 1996). The use of biomarkers has its origin in human toxicology where
they have proved to be very useful as measures of exposure to chemicals as well as to provide
early warning signals for specific diseases (Timbrell 1998). Biomarkers can be considered as a
shortcut where the mode of action itself is monitored, rather than monitoring all the
chemicals that have that particular mode of action. Thereby, the number of monitored
parameters can be significantly reduced. For example, the biomarker EROD (ethoxyresorufin
O-deethylase) provides information about the exposure to dioxins, planar PCBs, certain PAHs
and other chemicals with similar structures. Thereby, one single measure can replace many
chemical measurements.
As with other kinds of environmental monitoring, there are both benefits and drawbacks with
the use of biomarkers. Because of the diversity among biomarkers, however, it is not possible
to list benefits and drawbacks as for chemical monitoring based on concentrations (Table 1)
and biomonitoring based on abundance (Table 2). As a general rule, it can be said that
biomarkers that are measured at higher levels of biological organization have higher
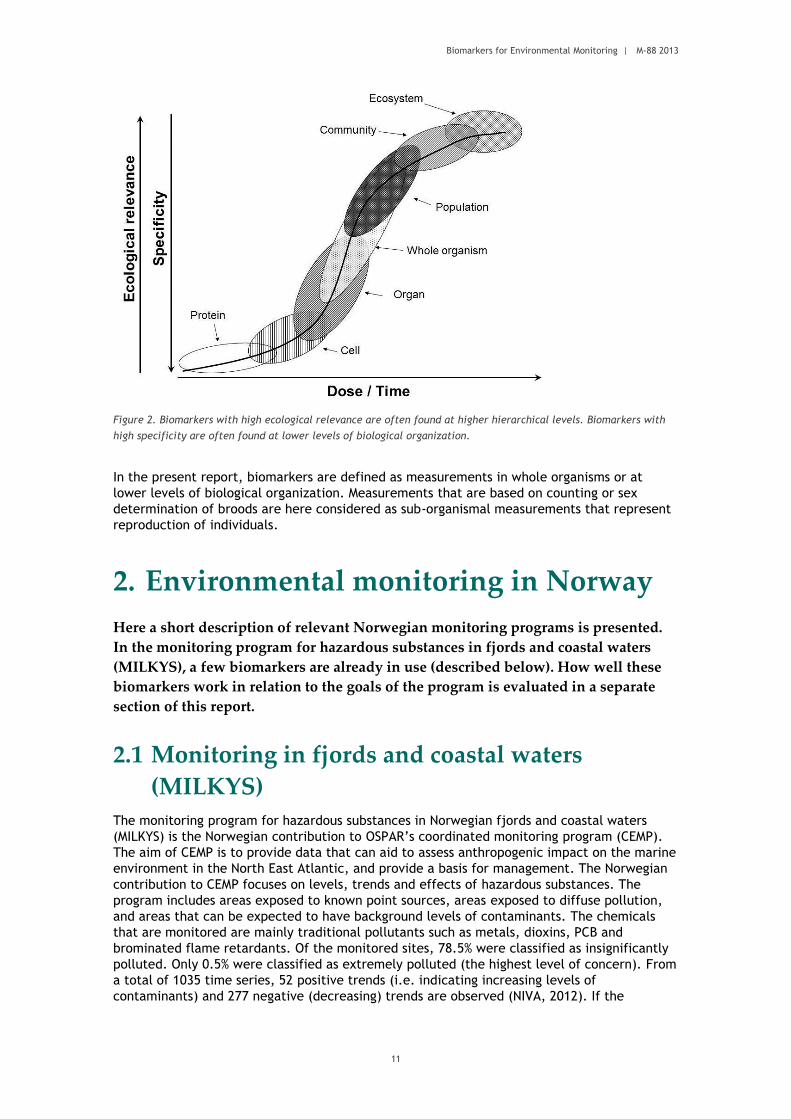
ecological relevance and lower specificity (Figure 2). However, there are exceptions to this.
As chemicals have their primary effect on lower levels of organization, such as the protein
that they interact with in the cell, measurements at lower levels of organization can be
assumed to act as early warning signals for effects at higher levels (Figure 2).
It must be noted that not all biomarkers are good biomarkers and that it is necessary to be
aware of potential confounding factors (Forbes et al 2006). The confounding factors can be
both biological (e.g., species, age, sex, genetic population, feeding status, reproductive
phase) and environmental (e.g., temperature, oxygen concentration, pH, salinity). Because of
these factors, it is necessary to standardize monitoring and only use well studied species in
well studied environments. For example, Traven et al (2013) did not see an induction in
EROD-activity in adult sea bass (Dicentrarchus labrax) at a site that was highly contaminated
with PAHs. Numerous other studies have shown that EROD is very sensitive to PAH
contamination in a number of species (van der Oost et al 2003). It is likely that the different
responses are caused by confounding biological and/or environmental factors. When such
factors are not controlled for (e.g., by standardization), the study cannot be expected to
provide useful information for management (McCarty and Munkittrick 1996).
Biomarkers for Environmental Monitoring | M-88 2013
11
Figure 2. Biomarkers with high ecological relevance are often found at higher hierarchical levels. Biomarkers with
high specificity are often found at lower levels of biological organization.
In the present report, biomarkers are defined as measurements in whole organisms or at
lower levels of biological organization. Measurements that are based on counting or sex
determination of broods are here considered as sub-organismal measurements that represent
reproduction of individuals.
2. Environmental monitoring in Norway
Here a short description of relevant Norwegian monitoring programs is presented.
In the monitoring program for hazardous substances in fjords and coastal waters
(MILKYS), a few biomarkers are already in use (described below). How well these
biomarkers work in relation to the goals of the program is evaluated in a separate
section of this report.
2.1 Monitoring in fjords and coastal waters
(MILKYS)
The monitoring program for hazardous substances in Norwegian fjords and coastal waters
(MILKYS) is the Norwegian contribution to OSPAR’s coordinated monitoring program (CEMP).
The aim of CEMP is to provide data that can aid to assess anthropogenic impact on the marine
environment in the North East Atlantic, and provide a basis for management. The Norwegian
contribution to CEMP focuses on levels, trends and effects of hazardous substances. The
program includes areas exposed to known point sources, areas exposed to diffuse pollution,
and areas that can be expected to have background levels of contaminants. The chemicals
that are monitored are mainly traditional pollutants such as metals, dioxins, PCB and
brominated flame retardants. Of the monitored sites, 78.5% were classified as insignificantly
polluted. Only 0.5% were classified as extremely polluted (the highest level of concern). From
a total of 1035 time series, 52 positive trends (i.e. indicating increasing levels of
contaminants) and 277 negative (decreasing) trends are observed (NIVA, 2012). If the

Biomarkers for Environmental Monitoring | M-88 2013
12
monitored substances are representative for the total environmental load of contaminants,
this could be taken as evidence of decreasing contamination. As discussed above, there is an
obvious bias in environmental monitoring towards chemicals that are confirmed
environmental risks. This means that the monitored chemicals often are already regulated, or
even banned. Therefore, decreasing trends are often expected and may not be representative
of the total environmental exposure. However, they show if environmental management, such
as restrictions of chemicals, provides the expected results.
The monitoring program for hazardous substances in fjords and coastal waters (MILKYS) also
include four biomarkers in fish (Atlantic cod, Gadus morhua). These are OH-pyrene (PAH-
metabolite), activity of the enzyme -aminolevulinic acid dehydratase (ALA-D) in blood,
concentration of the protein CYP1A in liver, and EROD-activity in liver. These biomarkers
were selected for specificity, robustness and because they are recommended by international
organizations (OSPAR, ICES). All of these can be said to be very specific biomarkers of
exposure. OH-pyrene is specific to PAHs, ALA-D is relatively specific to lead, and CYP1A and
EROD are specific to chemicals that bind to the aryl hydrocarbon (Ah) receptor (planar
organic chemicals such as dioxin, PCBs and PAHs). OH-pyrene, CYP1A and EROD all indicates
higher exposure levels in the inner Oslo fjord compared to more pristine areas. OH-pyrene
also indicates higher exposure levels in Sørfjord. ALA-D indicates higher exposure levels in
both inner Oslo fjord and Sørfjord, compared to reference sites (NIVA 2012).
Imposex in dog whelk (Nucella lapillus) is another biomarker that is used in the monitoring
program. This is a measure of the degree of masculinization of female dog whelk. Imposex is
a highly specific biomarker for tributyltin (TBT). However, imposex has also very high
ecological relevance and is, thus, an exception to the general rule presented in Figure 2.
Imposex trends are generally negative, indicating that the ban on TBT is working.
2.2 Other Norwegian monitoring programs
Besides the larger program for monitoring of hazardous substances in Norwegian fjords and
coastal waters (MILKYS), there are three more specific monitoring programs ("Monitoring of
pollutants in large lakes", "Pollutants in urbanized fjords" and "Pollutants in terrestrial and
urbanized environments") where biomarkers may add value. The three programs are described
below. These programs are all newly started and there is, hence, no data available. None of
these programs presently include biomarkers.
2.2.1 Monitoring of pollutants in large lakes The program is intended to investigate the presence of mercury, PCB, perfluorinated
compounds (PFC) and polybrominated diphenyl ethers (PBDE) in four larger lakes in Norway.
Furthermore, siloxanes and chloroparaffins will be monitored in one lake each. In three of
these lakes, at least two trophic levels will be examined to estimate biomagnification and
other food web related effects. These levels include zooplankton, smelts, whitefish and
trout. Stable isotopes will be used to determine trophic levels.
2.2.2 Pollutants in urbanized fjords This monitoring program is intended to detect pollutants that are used in the human society
and, by different processes, reach the environment. The program covers four sites in the Oslo
fjord and will include zooplankton, shrimp, flatfish, blue mussels and polychaetes. As
different trophic levels are monitored, it will be possible to investigate biomagnification and
other food web related effects. The program will also include measurements in stormwater.
The pollutants that will be monitored are metals, DDT, PCB, perfluorinated alkylated
substances (PFAS), hexabromocyclododecane (HBCDD), PBDE, chloroparaffins, siloxanes,
phosphorus flame retardants (PFR), bisphenol A, tetrabromobisphenol A, octyl-/nonylphenol
and antifouling chemicals.
Biomarkers for Environmental Monitoring | M-88 2013
13
2.2.3 Pollutants in terrestrial and urbanized environments This is the only program that does not focus on the aquatic environment. The aim of the
program is to provide information regarding the risks for health and environment in terrestrial
and urbanized areas. Several trophic levels will be used to provide information about
biomagnification of pollutants in the food chain. The data from the program is also intended
to provide information that can be used to estimate the total toxic load and mixture effects
for terrestrial animals. The species to be monitored are earthworms, European pied
flycatcher, red fox, brown rat, golden eagle and herring gull. The analyzes will include
metals, PCB, PBDE, PFC, siloxanes and chloroparaffins. Stable isotopes will be analyzed to
determine trophic levels of the different species.
3. Environmental monitoring with biomarkers in other countries
Besides Norway, biomarkers are used in national and regional monitoring programs
in several countries around the world. Biomarkers have also been used in numerous
research projects where the aim has been to investigate the presence of contaminants
in the environment. Below are examples of environmental monitoring programs that
included biomarkers.
3.1 Sweden
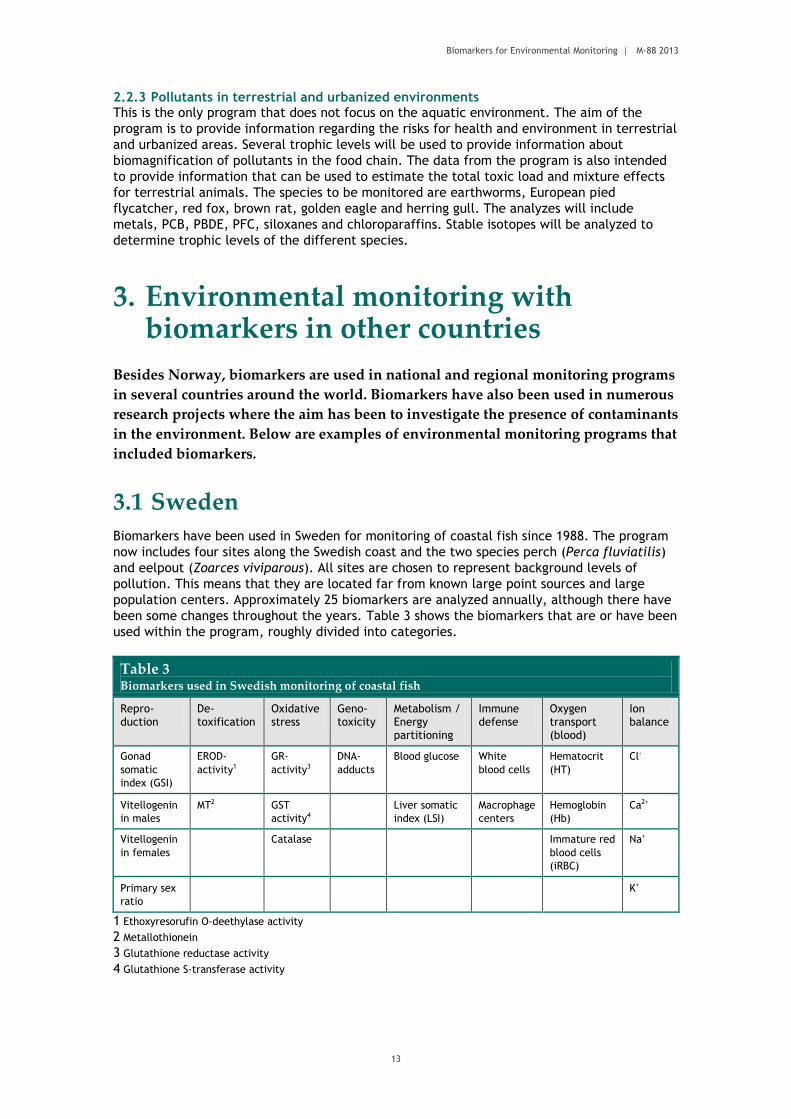
Biomarkers have been used in Sweden for monitoring of coastal fish since 1988. The program
now includes four sites along the Swedish coast and the two species perch (Perca fluviatilis)
and eelpout (Zoarces viviparous). All sites are chosen to represent background levels of
pollution. This means that they are located far from known large point sources and large
population centers. Approximately 25 biomarkers are analyzed annually, although there have
been some changes throughout the years. Table 3 shows the biomarkers that are or have been
used within the program, roughly divided into categories.
Table 3 Biomarkers used in Swedish monitoring of coastal fish
Repro-duction
De-toxification
Oxidative stress
Geno-toxicity
Metabolism / Energy partitioning
Immune defense
Oxygen transport (blood)
Ion balance
Gonad
somatic
index (GSI)
EROD-
activity1
GR-
activity3
DNA-
adducts
Blood glucose White
blood cells
Hematocrit
(HT)
Cl-
Vitellogenin
in males
MT2 GST
activity4
Liver somatic
index (LSI)
Macrophage
centers
Hemoglobin
(Hb)
Ca2+
Vitellogenin
in females
Catalase Immature red
blood cells
(iRBC)
Na+
Primary sex
ratio
K+
1 Ethoxyresorufin O-deethylase activity
2 Metallothionein
3 Glutathione reductase activity
4 Glutathione S-transferase activity

Biomarkers for Environmental Monitoring | M-88 2013
14
About ten of these biomarkers have shown significant temporal trends for at least one site for
each species. One example of such a biomarker is EROD, which has been increasing
significantly in four out of five time series, and the fifth is almost significant (Larsson et al
2012). This indicates an increasing exposure to contaminants that bind to the Ah-receptor. It
is noticeable that this time trend is seen at geographically very distinct monitoring sites.
Follow up studies have shown that EROD-activity correlated with run-off from land (Hanson et
al 2009a) and to the occurrence of PAH-metabolites in bile (Hanson et al 2009b and
unpublished data). However, more recent studies have also shown that recolonization of soft
bottom fauna in the area correlates to the highest peaks in EROD-activity. A plausible
explanation is that “old” contaminants are released due to bioturbation. Among the other
biomarkers in fish that show significant time trends at several sites are GSI (reduced at two
sites), GST (reduced at four sites) and the relative number of white blood cells (reduced at
three sites). The trend in biomarkers cannot be explained by any of the traditional
contaminants that are measured in the areas, for example metals, DDT, PCB and HCH
(hexachlorocyclohexane). EROD and GSI have been considered as the most useful biomarkers
in this program. This is because they, toghether, provide both high precision and high
ecological relevance. DNA-adducts has been omitted from the program as it has not shown
any effects and is relatively expensive. Also MT has been omitted from the program, but due
to analytical difficulties.
Imposex in netted dog whelk (Hinia nitida) is used as a biomarker for exposure to and effects
of TBT in Swedish coastal waters. This monitoring program is focused on areas where the
levels of TBT can be expected to be high, such as marinas. As in Norwegian monitoring, trends
in imposex are generally negative after the ban of TBT in antifouling paints (Magnusson et al
2012). Simultaneous measurements of TBT concentrations show the same time trends as
imposex.
The small amphipods Monoporeia affinis and Pontoporeia femorata are used to monitor
contamination of sediments in the Baltic Sea. The two species are important from an
ecological perspective as they serve as food for many species and thereby can introduce
chemicals into the food chain. Five sites are monitored in the Bothnian Bay and nine in the
Baltic Proper. Besides population density, a number of biomarkers that are related to
reproduction are used, including frequency of malformed embryos, egg production and
frequency of dead broods/dead eggs. The monitoring program has shown differences between
the Bothnian Bay and the Baltic Proper, indicating higher exposure levels in the Baltic Proper
(Sundelin et al 2007). No chemical measurements are performed on the amphipods.
The white tailed sea eagle (Haliaeetus albicilla) is a suitable indicator of bioaccumulating
chemicals as it is found high in the food chain. The brood size of the eagles is used as an
indicator of reduced fertility. Data on brood size for sea eagles have been collected since the
mid-1800s. Although the older data was not intended to detect pollution, it provides a
valuable reference level. The brood size fell dramatically in the 1950s and 1960s as a result of
organic pollution (mostly DDT) (Helander 2000). After the ban on DDT, brood sizes became
larger and are now close to the reference level (pre 1950) at most sites. However, there are
indications that the positive trend has been halted or even reversed during the last few years,
with reduced brood sizes (Helander and Bignert 2012). There is presently no explanation
available for this trend. However, there are a number of hypotheses that are being tested.
One hypothesis is that bioturbation after recolonization of marine sediments has brought old
contaminants back to the surface and into the food web. Another hypothesis is that the
eagles have shifted their food preference to a higher trophic level, leading to higher
contamination though biomagnification.
Seals that are shot or found dead in Sweden are analyzed for a number of health related
parameters that can be used as biomarkers. Examples of parameters that are analyzed are
blubber thickness and the frequency of colonic ulcers. Most of the seals are grey seals
(Halichoerus grypus) from the Baltic Sea. The blubber thickness has shown a decreasing trend
since 1996 (Härkönen et al 2012). The trend may be caused by toxicants, as increased energy

Biomarkers for Environmental Monitoring | M-88 2013
15
costs for detoxification means less energy can be stored in blubber. It is also possible that
chemicals have direct effects on fat metabolism. However, other environmental factors may
contribute, such as changes in food quality or quantity. Colonic ulcers are exclusively
occurring in the Baltic Sea and may be related to the larger pollution load there compared to
other areas. The frequency increased from the 1980s to about 2000, followed by a small
reduction (Härkönen et al 2012). It is likely that the ulcers are caused by a parasite, and that
the increase in frequency is due to a reduced ability to heal the wounds, i.e. impaired
immune defense. This impairment may also be caused by the higher contamination load in the
Baltic Sea.
3.2 United Kingdom
The UK Clean Seas Environment Monitoring Program (CSEMP) uses a network of sites around
the UK coast where different marine agencies analyse a common set of biomarkers using
agreed protocols and standards. Samples of fish and benthos are taken from a total of around
45 fixed stations in intermediate and open sea areas around England and Wales. The program
continuously evolves to incorporate new legislative requirements and improve the ability to
detect trends. As trends are established and risks are confirmed or disproved, effort is
focused on the higher risk areas.
EROD, PAH metabolites in bile, and DNA-adducts are measured in fish to estimate exposure to
and effects of PAHs and other contaminants (CSEMP 2012). These biomarkers are used in an
integrated assessment with chemical concentrations in sediment and biota, and biological
responses at higher levels of organization (e.g. abundance). The induction of EROD activity
has been consistent with the levels of certain chemicals, such as PCBs (CEFAS 2012). Fish
disease and liver pathology are used as indicators of effects caused by organic contaminants
(CEFAS 2012, CSEMP 2012). Table 4 lists the biomarkers in fish that are listed in the CSEMP
green book. However, the monitoring program is revised continually and both biomarkers and
monitored species are added and excluded (CSEMP 2012).
Table 4 Biomarkers used in UK fish monitoring
Reproduction Detoxification Genotoxicity Metabolism
/ Energy partitioning
Liver function Growth Neuro-
toxicity
Gonad somatic
index (GSI)
EROD-activity DNA-adducts Liver
somatic
index (LSI)
Liver Pathology Length Acetylchol
inesterase
(AchE)
Vitellogenin in
males
PAH bile
metabolites
Fish Disease Liver lipid content
weight
Imposex and intersex are used as biomarkers for exposure to and effects of TBT and other
contaminants in UK coastal waters. Imposex are monitored in several species, including dog
whelks. Intersex is monitored in the common periwinkle (Littorina littorea). As in Norway and
Sweden, the incidence and severity of imposex is declining following the ban on TBT.
Metallothionein (MT), the lysosomal neutral red retention (NRR) assay to determine lysosomal
membrane stability, scope for growth, and acetylcholinesterase (AChE) are monitored in blue
mussel (CSEMP 2012). Information concerning clear trends or significant differences between
sites is sparse. However, the generally low contaminant concentrations present in the Celtic
Sea and English Channel are reflected in low biological effects.

Biomarkers for Environmental Monitoring | M-88 2013
16
3.3 Canada
In Canada, pulp and paper and metal mining industries are required to provide data to assess
their impact on the aquatic environment. Environment Canada has developed guidance
documents on how to conduct the monitoring. The monitoring includes survival, growth,
reproduction and condition of fish in the recipient (Table 5). The standard adult fish survey
design recommends the collection of adult males and females of two sentinel species to
determine if there are changes in the effect indicators between the exposure and reference
areas, or along an effluent concentration gradient (Environment Canada 2010).
Table 5 Fish population survey – effect indicators and endpoints.
Effect Indicators Effect Endpoints Critical effect size1
Survival Age ± 25%
Growth (energy use) Size-at-age (body weight relative to age) ± 25%
Reproduction (energy use) Relative gonad size (gonad weight to body weight) ± 25%
Condition (energy storage) Condition (body weight to length) ± 10%
Relative liver size (liver weight to body weight) ± 25%
1 Percent (%) of reference mean.
Pulp and paper mills in Canada have completed five cycles of monitoring since the start in
1992. In the most recent cycle, 24 of the 32 pulp and paper mills that conducted biological
monitoring studies reported an effect in at least one of the effect indicators and 12 reported
at least one effect with a magnitude equal to or greater than the critical effect size (CES)
(Figure 3). The number, magnitude and type of effects observed were similar to those
observed in previous cycles and illustrated the same common patterns of effects, which were
nutrient enrichment and metabolic disruption (gonad reduction) in fish (Environment Canada
2012a).
Figur 3. The number of fish studies in recipients to pulp and paper mill effluent that had effects above or below the
critical effect size (CES). The figure is modified from Environment Canada (2012a).
Metal mining industries have conducted environmental effect monitoring since 2002. Fish
collected in areas exposed to effluent showed significantly reduced condition, liver size, and

Biomarkers for Environmental Monitoring | M-88 2013
17
growth rate, as well as some reductions in gonad size. There were also significant effects on
the population level (changed age structure). These response patterns may reflect direct
effects of the effluent, or indirect effects such as habitat alteration or impact on food
sources (Environment Canada 2012b).
4. “Omics” – biomarkers under development
Omics comprises a range of techniques that have in common that they study how an
individual’s entire genome, proteome or metabolome translates into biological functions.
Omics have great potential for use as biomarkers in environmental monitoring and
assessment. Omic techniques may also be important to elucidate mode of action (MOA) of the
chemicals (or other stressor). The mode of action can be mechanism of toxicity as well as the
biological mechanism of adaptation or response to the environmental changes. Omics will
thereby be central in the validation and development of new biomarkers. However, at
present the available techniques are not themselves suitable for monitoring purposes. For
example, there is a need for standardization and inter-laboratory comparison (ECETOC 2010,
Dowd 2012). Therefore the omics techniques are excluded from the evaluation of biomarkers
for monitoring purposes. Instead, a short description of the different techniques is given
below.
4.1 Transcriptomics
Transcriptomics is the study of the structure and function of the transcriptome, which is the
set of all RNA molecules produced in one cell or a group of cells. By measuring the amount of
RNA from a particular gene or group of genes, it is possible to estimate both exposure and
effect of chemicals. The most common technologies used to investigate gene expression
changes are DNA microarrays and quantitative real time polymerase chain reaction (Bourlat
2013). If the cells have been exposed to pollutants, the expression of a certain gene or genes
may increase. As the sum of all RNA mirrors the genes that are actively expressed in a cell (or
an organism) at a given time, they can provide very specific information about the responses
to different stressors. The sum of all RNA changes can be used as a fingerprint that provides
information about the specific stressor. However, it has not yet been possible to link this to
health related effects (Schirmer et al 2010).
4.2 Proteomics
Environmental proteomics aims to analyse the entire set of proteins (the proteome) in
organisms and to identify variations in the proteins that may be induced by chemicals.
Proteomics has the potential to identify not only single proteins, but also to generate protein
fingerprints that are specific for certain pollutants (Bourlat 2013). Proteomics has great
potential as a technic for identifying modes of action and for developing new biomarkers.
Proteins are predicted to be less transient than gene expression patterns and more stable as
potential biomarkers (Denslow et al 2012). However, proteins are technically more difficult to
identify than, for example, gene expression patterns.
4.3 Metabolomics Metabolomics is the systematic study of metabolites. A fingerprint of metabolites can provide information regarding the specific cellular processes that have occurred. Exposure to

Biomarkers for Environmental Monitoring | M-88 2013
18
chemicals can change those processes, and thereby the fingerprint of metabolites. By using samples from urine, blood and saliva, metabolomics can be conducted without killing the organism. Metabolomics can consequently be evaluated over time in the same individual, and can be correlated to changes in the organism’s physiology. With time-of-flight mass spectrometry (MS-TOF), it has become easier to identify the metabolites, and relate the results to different physiological processes. It is thereby possible to make functional interpretations of the metabolomics results. However, several challenges remain for metabolomics. For example, it is still difficult to extract meaningful data from background changes that are caused by normal metabolism (Denslow et al 2012). Despite the difficulties, Hines and co-workers (2010) managed to identify metabolic signatures that provided information about molecular MOA and predicted scope for growth (SFG) in blue mussels. This indicates that besides providing information about mechanisms, metabolomics can also provide information about health related effects.
5. Evaluation of biomarkers used in Norway
The program for environmental monitoring of hazardous substances in Norwegian
fjords and coastal waters (MILKYS) includes five biological endpoints that all fall
under the definition of biomarkers. Four of the biomarkers are measured in
different tissues in Atlantic cod (Gadhus morhua). These are OH-pyrene (PAH-
metabolite) in bile, activity of the enzyme -aminolevulinic acid dehydratase (ALA-
D) in blood, concentration of the protein CYP1A in liver, and ethoxyresorufin O-
deethylase (EROD) activity in liver. The fifth biomarker is imposex in dog whelk
(Nucella lapillus), measured as the vas deferens sequence index (VDSI). The five
biomarkers were selected for specificity, robustness and because they are
recommended by international organizations (OSPAR, ICES). The biomarkers are
included to evaluate whether organisms are exposed to contaminants in
concentrations that trigger biological effects. Furthermore, the biomarkers may
provide information about exposures to other chemicals than those that are
monitored. The biomarkers are also expected to provide information about
bioaccumulation (NIVA 2012). The five biomarkers, and their benefits and
drawbacks, are discussed below.
5.1 Imposex in dog whelk
Imposex and TBT concentrations are monitored in dog whelk at eight stations. Significant
negative trends in VDSI have been observed at seven stations, and negative trends in TBT
concentrations have been observed at all stations (Figure 4).
The only station without a negative trend in VDSI was also the station with the lowest VDSI
levels and the lowest TBT concentrations throughout the monitoring period. From Figure 4, it
can be seen that after a period of about 3-4 years with TBT concentrations under 0,005
mg/kg, imposex disappears. The delayed effect on imposex can be explained by the fact that
only mature dog whelks can be used to determine VDSI, while the effects may be initiated
earlier during the life cycle. The delay is well in agreement with the 3-5 years generation
time of dog whelk (Feare 1970). This shows that the tissue concentrations of TBT are more
sensitive to changes in exposure than VDSI is. Based on this, it cannot be said that imposex is
a very good early warning signal for population level effects of TBT exposure. Instead, the

Biomarkers for Environmental Monitoring | M-88 2013
19
main strength of imposex as a biomarker is that it provides evidence that links exposure to
biological effects. This may be important in communication with stakeholders as well as the
general public. Although it has been shown that other types of exposure may affect imposex
(e.g., Santos et al 2008), it is clear that exposure to TBT is the main factor in environmentally
realistic scenarios. Therefore, it can also not be expected that imposex is a good measure of
mixture effects that include unknown chemicals. The biomarker can be said to have medium
costs. Although no expensive apparatus is needed, highly skilled personnel is needed to
determine the level of masculinization of the female dog whelk.
Figur 4. TBT concentrations and imposex in dog whelk. Following the ban of TBT in anti-fouling paints, both TBT
concentrations and imposex has decreased dramatically. The figure is modified from NIVA (2012).

Biomarkers for Environmental Monitoring | M-88 2013
20
5.2 OH-pyrene in Atlantic cod bile
Measuring metabolites in bile provides information regarding chemicals that are readily
metabolized and, therefore, do not bioaccumulate in tissue. PAHs are examples of such
chemicals. Prescence of PAH-metabolites in bile is a commonly used biomarker for PAH-
exposure. OH-pyrene is a very specific biomarker as it measures the presence of metabolized
pyrene only. The main confounding factor that may affect the results is the feeding status of
the fish. When the organism feeds, bile is excreted through the digestive tract. During periods
between feeding, bile is accumulated in the bile bladder. When the bladder has reached its
maximum volume, water is excreted from the bladder so that the volume is constant.
However, endogenous or exogenous metabolites are still added to the bile, resulting in
increased concentrations (Hanson and Larsson 2008). This may lead to both over- and
underestimated concentrations at specific sampling occasions. However, due to the
standardized method that is used within the monitoring program (Hylland et al 2009), it is
unlikely that this will affect the results in terms of consistent differences between sites or
temporal trends.
OH-pyrene in Atlantic cod bile is measured at four stations (Inner Oslo fjord, Inner Sørfjord,
Karihavet and Ullerø). No significant temporal trends have been observed at any of the sites.
The concentration of OH-pyrene has been consistently higher in the inner Oslo fjord than in
the other areas where it is measured. Because of the quick metabolism of PAHs in fish, it is
not possible to get reliable data on tissue concentrations of PAHs in Atlantic cod from this
area. However, PAHs have been measured in blue mussel from the inner Oslo fjord during the
same period.
Figure 5 shows correlations between concentrations of carcinogenic PAHs in blue mussel at
two sites in the inner Oslo fjord and OH-pyrene in Atlantic cod bile. In both cases, there was
a positive correlation that explained about 17-19% of the variation. However, the individual
correlations were not significant (p=0.21-0.24). When all data were used in one correlation,
and site was controlled for, the correlation became somewhat stronger but still not
significant (p=0.15).
Figur 5. Correlations between carcinogenic PAHs (KPAH) in blue mussel and OH-pyrene in Atlantic cod bile. None of
the correlations are significant.
The lack of significant correlations should not be taken as evidence that OH-pyrene in
Atlantic cod bile does not reflect relevant PAH exposure. Atlantic cod and mussels live in
different environments and are exposed through different pathways. The measurements also
integrate over different time periods. Bile reflects exposure since the last feeding (days),
while tissue concentrations in blue mussel integrate over a significantly longer time period.
Furthermore, the PAH measurements include other PAHs. Although many PAHs have the same
origin and similar environmental fate, there are also PAHs that behave differently. PAH
measurements in mussels can therefore not be expected to be very good estimates of pyrene
exposure for Atlantic cod, and OH-pyrene in bile cannot be expected to be a very good
estimate of total PAH exposure.
R² = 0,1652
0
5
10
15
20
25
30
35
40
45
50
0,00 10,00 20,00 30,00 40,00 50,00
OH
-Pyr
en
e (
µg/
ml)
, Osl
o C
ity
KPAH (µg/kg), Gressholmen
R² = 0,1871
0
5
10
15
20
25
30
35
40
45
50
0,00 50,00 100,00 150,00 200,00 250,00 300,00 350,00
OH
-Pyr
en
e (
µg/
ml)
, Osl
o C
ity
KPAH (µg/kg), Akershuskaia

Biomarkers for Environmental Monitoring | M-88 2013
21
OH-pyrene in bile is a very sensitive biomarker that has high specificity and can be used as an
early warning signal. Furthermore, it is a readily available method with low costs that is
frequently used in environmental monitoring. However, the ecological relevance is low and it
cannot provide any information about mixtures or unknown chemicals.
5.3 ALA-D (-aminolevulinic acid dehydratase) in
Atlantic cod blood
ALA-D is a biomarker that is very specific to lead, although other contaminants (e.g., zinc)
have also been shown to affect it (Schmitt et al 2002, Finelli et al 1975). In the monitoring
program, ALA-D activities have been shown to be lower in Atlantic cod from the inner Oslo
fjord area and inner Sørfjord compared to Atlantic cod from the more pristine Karihavet area
(Figure 6). Lower ALA-D activity is an indication of lead exposure. Throughout the monitoring
period, lead concentrations have been higher in the Inner Oslo fjord area and inner Sørfjord
compared to the Karihavet area (Figure 6). The ALA-D levels at the different sites are
therefore in line with the lead exposure. Furthermore, there are tendencies toward
increasing ALA-D activities over time at all sites, although these temporal trends are not
significant (NIVA 2012). Also lead concentrations have been decreasing, although slower at
the end of the period.
Figur 6. Lead concentrations in Atlantic cod liver and ALA-D activity in Atlantic cod blood at three monitoring
stations. The figure is modified from NIVA (2012).
ALA-D is a sensitive biomarker with low cost that has high specificity and can be used as an
early warning signal. However, ALA-D cannot be expected to provide valuable information
regarding mixtures of chemicals or unexpected chemicals. Furthermore, the ecological
relevance is intermediate, as impairment in hemoglobin synthesis may lead to health effects,
but there is no obvious link between ALA-D and population level effects.
5.4 CYP1A and ethoxyresorufin O-deethylase
(EROD) in Atlantic cod liver
CYP1A and EROD are both measurements of exposure to chemicals that bind to the aryl
hydrocarbon (Ah) receptor. This includes chemicals such as dioxins, PAHs and planar PCBs.
When a chemical binds to the Ah-receptor, a chain of events is initiated that results in the
production of CYP1A enzyme. CYP1A then catalyzes metabolism of the exogenous substance,
often making it less toxic and more hydrophilic (easier to excrete). Measuring CYP1A is
thereby an indirect measurement of all chemicals that bind to the Ah-receptor. Besides
metabolizing contaminants, CYP1A can transform 7-ethoxyresorufin to resorufin. As resorufin
is fluorescent, the transformation of 7-ethoxyresorufin to resorufin can be used to estimate
the presence of CYP1A enzyme. This is called the ethoxyresorufin O-deethylase activity, or
EROD-activity. The extra step in EROD compared to CYP1A means that there are more
potential confounding factors. At very high exposure levels, for example, most CYP1A enzyme
may interact with contaminant molecules. In such cases, less CYP1A are available for
transformation of 7-ethoxyresorufin to resorufin, and the EROD activity is lower. It has also

Biomarkers for Environmental Monitoring | M-88 2013
22
been shown that certain organic contaminants (Willett et al 2001) as well as metals (Martín-
Díaz et al 2005) may inhibit EROD-activity.
Since the start of the monitoring period, the concentration of CYP1A has been higher in the
inner Oslo fjord area compared to inner Sørfjord and the Karihavet area (Figure 7). There is
an almost significant negative trend in CYP1A concentration in the Inner Oslo fjord area
(p=0.058). In inner Sørfjord and the Karihavet areas, however, there are no indications of
time trends in CYP1A concentration. In seven of the eight last years when all stations have
been analyzed, EROD-activity in the inner Oslo fjord area was higher than at the other sites.
In 2005, EROD was slightly higher in Inner Sørfjord. EROD activities, thus, provide the same
general picture of differences in pollution between the three sites as CYP1A does.
Planar PCBs are known to bind to the Ah-receptor, and have been analyzed in Atlantic cod
liver at the same sites (Figure 7). The PCB concentrations also indicate that the Inner Oslo
fjord area is more polluted than the other two sites, although there was a peak in Inner
Sørfjord area around year 2000 with similar concentrations as in the Inner Oslo fjord area.
There is a tendency towards increasing PCB concentrations in the Inner Oslo fjord area, which
contradicts the tendency towards reduced CYP1A concentration. This indicates that other
contaminants than PCBs are important in the CYP1A induction.
Figur 7. CYP1A concentrations, EROD-activity and PCB concentrations in Atlantic cod liver. Note that the monitoring
periods differ. The figure is modified from NIVA (2012).
Although both CYP1A and EROD essentially monitor the same type of contamination, the data
presented in Figure 7 clearly shows that CYP1A is more sensitive. The differences between
sites are clearer and an almost significant negative trend in CYP1A in the Inner Oslo fjord area
can be seen. Both biomarkers can be considered as early warning signals for contaminants
that bind to the Ah-receptor. As there is no clear link to growth, reproduction or survival, the
ecological relevance must be considered as low. The costs for both methods are relatively
low.
6. Ranking of biomarkers
Within the time frame of the present project, it was not possible to examine all
biomarkers in detail. Instead, prioritizations were made to focus on those
biomarkers that are most likely to add value to environmental management. To
prioritize among biomarkers, they were ranked according to their different
properties. The properties that were used are presented below.
Biomarkers for Environmental Monitoring | M-88 2013
23
6.1 Properties used for ranking of biomarkers
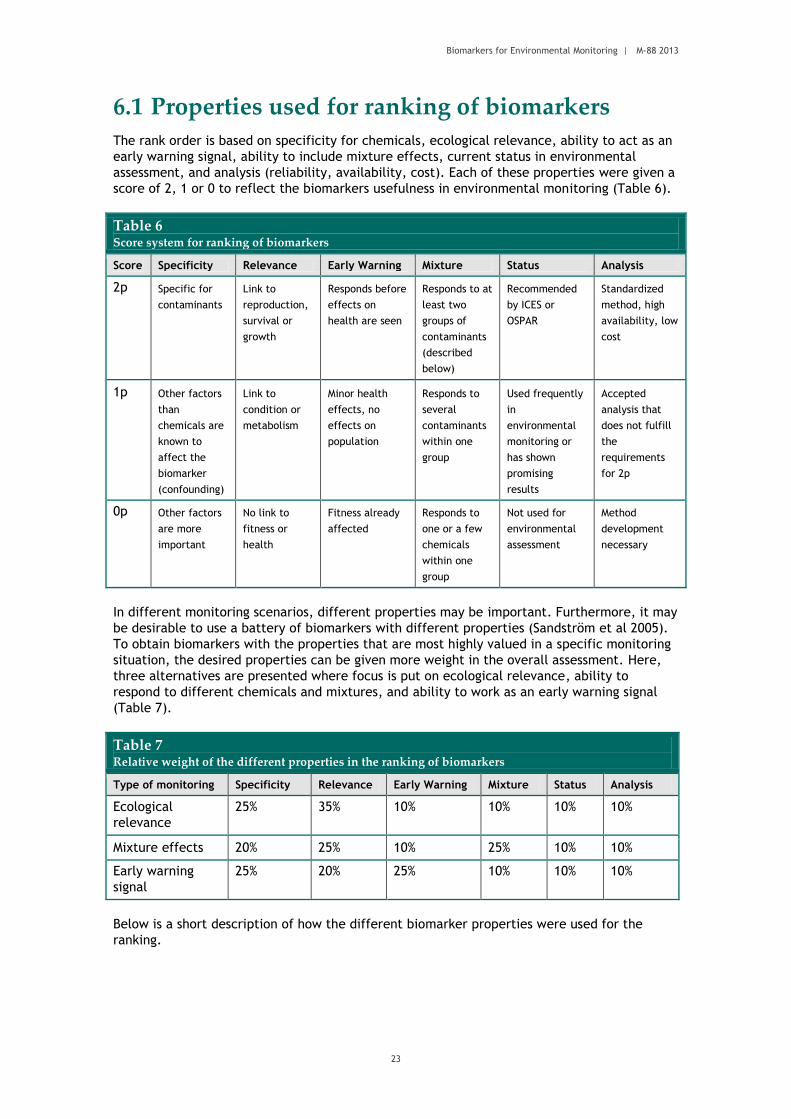
The rank order is based on specificity for chemicals, ecological relevance, ability to act as an
early warning signal, ability to include mixture effects, current status in environmental
assessment, and analysis (reliability, availability, cost). Each of these properties were given a
score of 2, 1 or 0 to reflect the biomarkers usefulness in environmental monitoring (Table 6).
Table 6 Score system for ranking of biomarkers
Score Specificity Relevance Early Warning Mixture Status Analysis
2p Specific for
contaminants
Link to
reproduction,
survival or
growth
Responds before
effects on
health are seen
Responds to at
least two
groups of
contaminants
(described
below)
Recommended
by ICES or
OSPAR
Standardized
method, high
availability, low
cost
1p Other factors
than
chemicals are
known to
affect the
biomarker
(confounding)
Link to
condition or
metabolism
Minor health
effects, no
effects on
population
Responds to
several
contaminants
within one
group
Used frequently
in
environmental
monitoring or
has shown
promising
results
Accepted
analysis that
does not fulfill
the
requirements
for 2p
0p Other factors
are more
important
No link to
fitness or
health
Fitness already
affected
Responds to
one or a few
chemicals
within one
group
Not used for
environmental
assessment
Method
development
necessary
In different monitoring scenarios, different properties may be important. Furthermore, it may
be desirable to use a battery of biomarkers with different properties (Sandström et al 2005).
To obtain biomarkers with the properties that are most highly valued in a specific monitoring
situation, the desired properties can be given more weight in the overall assessment. Here,
three alternatives are presented where focus is put on ecological relevance, ability to
respond to different chemicals and mixtures, and ability to work as an early warning signal
(Table 7).
Table 7 Relative weight of the different properties in the ranking of biomarkers
Type of monitoring Specificity Relevance Early Warning Mixture Status Analysis
Ecological
relevance
25% 35% 10% 10% 10% 10%
Mixture effects 20% 25% 10% 25% 10% 10%
Early warning
signal
25% 20% 25% 10% 10% 10%
Below is a short description of how the different biomarker properties were used for the
ranking.

Biomarkers for Environmental Monitoring | M-88 2013
24
6.1.1 Specificity for chemicals One of the goals with environmental monitoring is to retrieve information that can be useful
for environmental management. In the case of monitoring for environmental pollution, it is
essential that the effects that are seen actually are caused by pollution. Some biomarkers are
very specific to chemicals, or even certain groups of chemicals. These biomarkers are often,
but not always, found at lower levels of biological organizations, such as the protein level. A
response in such a biomarker can often be taken as a strong evidence for exposure to
chemicals. Other biomarkers can be affected by confounding factors such as temperature,
UV-radiance, salinity and food availability. These biomarkers are often found at higher levels
of biological organization.
Because specificity is a desired property among biomarkers that are used in monitoring, the
highest score (2p) was given to biomarkers that are highly specific for contaminants (Table 6).
Biomarkers that are somewhat affected by confounding factors were given 1p. Endpoints that
are mainly driven by non-chemical factors were given zero points.
6.1.2 Ecological relevance Environmental monitoring is carried out with the aim of protecting populations of species,
and thereby also biodiversity and ecological services. This means that it is important to use
measures that provide relevant information about the risk for populations. Some biomarkers
have a strong link to survival rates or reproductive output, and are thereby good indicators of
ecological risk. Such biomarkers are often found at higher level of biological organization. An
example of such a biomarker is imposex in gastropods. Imposex often results in sterility, with
subsequent population crashes.
In the ranking of biomarkers, the highest score (2p) was given to biomarkers that reflect
reproduction, survival and growth (i.e. fitness) (Table 6). A lower score (1p) was given to
biomarkers that reflect general effects on health condition or metabolism. No points were
given to biomarkers of exposure that cannot be linked to health effects.
6.1.3 Early warning signal It is often argued that biomarkers respond before effects are seen at higher levels of
biological organization. This means that biomarkers act as early warning signals for effects at
the population level. Thereby, biomarker responses may help environmental managers to take
action before populations are affected. However, this is not equally true for all biomarkers.
Some biomarkers are, indeed, very sensitive and responses are seen at concentrations that do
not contribute to any population level risk. Other biomarkers do not show any effects until
reproduction, survival or growth already are affected.
Biomarkers that respond before any effects can be expected on the organisms health were
given the highest score (2p) (Table 6). Measurements of physiological effects that are not
directly linked to fitness were given a lower score (1p). Biomarkers that do not react until the
health of the organism is already significantly impaired were given zero points.
6.1.4 Mixture effects Mixture effects, also popularly referred to as cocktail effects, have gained increasing
attention during the past 5-10 years. Mixture effects refer to the total toxicity of all
contaminants in a recipient. Although each chemical may be present in safe concentrations, it
is possible that the sum of all chemicals still cause an unacceptable risk. The toxicity of
mixtures has proven very difficult to predict as chemicals have different modes of action and
may interact both synergistically or antagonistically. Biomarkers may provide a shortcut by
measuring the total effect of all pollutants in an area, without necessarily knowing exactly
which chemicals are included in the mixture or how they interact. However, all biomarkers
are not equally suited for this. Some biomarkers are specific to only one or a few chemicals.
It can be argued that such specificity is an advantage as it is easy to identify the cause and
take action to reduce the risk. However, when the causal link is already established, this
information can also be retrieved from chemical measurements. In many monitoring
Biomarkers for Environmental Monitoring | M-88 2013
25
situations, it is more important to include a broad spectrum of chemicals, including
unexpected or even unknown contaminants.
Here, the higher score (2p) was given to biomarkers that respond to at least two different
groups of chemicals (metals, endocrine disruptors, dioxin-like compounds, pesticides, other
organic contaminants) (Table 6). A lower score (1p) was given to biomarkers that are specific
for a certain groups of chemicals, such as metals. No points were given to biomarkers that are
mainly associated with only one or a few chemicals.
6.1.5 Current status Some biomarkers have been used extensively in monitoring programs or for environmental
assessment around the world. This means that the method is well understood and described in
the literature, that potential confounding factors are likely to have been identified, and that
some sort of consensus is likely to have developed regarding the interpretation of results. For
newer biomarkers, or biomarkers that for some reason have not been adopted in monitoring
programs, new knowledge and experience is generated more slowly, and the risk for
unpleasant surprises is higher.
To take this into account, the biomarkers have been given a score to reflect their current
status in environmental monitoring and assessment. The highest score (2p) was given to
biomarkers that are recommended by ICES or OSPAR (Table 6). Other biomarkers that are
used frequently for environmental monitoring or have shown to be useful in single scientific
studies were given a lower score (1p). No points were given to biomarkers that have not been
used for environmental assessments.
6.1.6 Analysis For biomarkers to be truly useful in environmental monitoring, it is necessary that there is an
agreed method for the analysis so that results are comparable (over time and between labs).
Furthermore, it is beneficial if the method is readily available and that the cost per analysis is
low. For many biomarkers that have been used in environmental monitoring for several
decades, there are international standard protocols to follow (ISO, OECD). Other biomarkers
may only have been used once by a single research group.
The highest score (2p) is given to biomarkers for which international standards exists, the
analysis is easy to perform or possible to buy, and the costs are relatively low. Methods that
are agreed upon within ecotoxicological research, but do not fulfill the requirements for the
highest score are given the intermediate score (1p). This could, for example, be biomarkers
that have been used frequently in ecotoxicological research but no intercalibration has been
performed and the method has not been adopted for environmental management. No points
are given to biomarkers for which methods are not agreed upon, the analysis is difficult to
perform and not available to buy, and the method requires expensive equipment or highly
skilled personnel.
6.2 Ranking of selected biomarkers
Biomarkers that were included in the ranking were collected from national monitoring
programs as well as from the scientific literature. The monitoring programs that were
included were those discussed in chapters 5 and 6 (Norway, UK, Sweden, Canada). The
scientific literature was scanned for biomarkers by searching the keywords “biomarker” and
“environmental monitoring” or “biomonitoring” in the scientific data base Web of Science.
This rendered a list of about 100 biomarkers, which are presented in Appendix A, along with
references where the biomarkers are described in more detail. For some biomarkers,
however, it was not possible to find information about the properties that were used to rank
the biomarkers. Those biomarkers were then omitted from the ranking, leaving approximately
80 biomarkers that could be ranked. The biomarkers that were ranked are presented in
Appendix B, together with their scores for the different properties.

Biomarkers for Environmental Monitoring | M-88 2013
26
Below is a more detailed description of the ten highest ranked biomarkers within each
category.
6.2.1 Biomarkers with high ecological relevance The biomarkers that ranked highest for ecological relevance are presented in Table 8,
including the score for each property. This list is dominated by biomarkers that are linked to
reproduction and respond to endocrine disruptors. This is because relatively high weight was
placed on specificity and ecological relevance. The endocrine system is often quite robust to
other stressors than chemicals that mimic endogenous hormones, and the ecological
relevance of impaired reproduction is obviously high. Biomarkers that affect other traits with
high ecological relevance, such as growth and immune defence, often scored low on
specificity.
For biomarkers with high ecological relevance, imposex in gastropods was the only biomarker
among the ten highest ranked that is presently used in Norwegian environmental monitoring.
Table 8 Highest ranked biomarkers with high ecological relevance
Rank Biomarker Specificity Relevance Early Warning Mixture Status Analysis
1 Vitellogenin (VTG) in
fish
2 2 2 1 2 2
2 Spiggin in three spined
stickleback
2 2 1 1 1 1
2 Intersex in fish and
gastropods
2 2 0 1 2 1
2 Egg shell thickness 2 2 0 0 1 2
5 Zona Radiata protein 2 2 1 1 0 1
5 Imposex in gastropods
(e.g., VDSI)
2 2 0 0 2 1
7 Aromatase 1 2 1 2 1 1
7 Congenital
malformations in birds
1 2 1 2 1 1
7 Macroscopic liver
neoplasms (tumours)
1 2 1 1 2 1
7 Hatching success and
brood size in birds
1 2 0 2 1 2
7 Skeletal deformities 1 2 1 2 1 1
Vitellogenin (VTG) in fish Vitellogenin (VTG) in fish had the highest ranking among biomarkers for ecological relevance.
VTG is an egg yolk precursor protein expressed in the females of nearly all oviparous species.
In environmental monitoring, VTG in fish has been used extensively to monitor for estrogenic
chemicals. The production of VTG is normally initiated by natural estrogen hormones.
Females therefore have different levels of the protein depending on hormonal cycles, while
males and juveniles have very low levels throughout the year. When males and juveniles are
exposed to xenoestrogens, however, they start to produce VTG just like females. This
biomarker has mainly proved useful to detect environmental effects of synthetically produced
hormones (e.g., Larsson et al 1999). High points are given to VTG for most properties. VTG
induction in males and juveniles is very specific to xenoestrogens. VTG inhibition in females

Biomarkers for Environmental Monitoring | M-88 2013
27
can be used to show anti-estrogenic effects. However, this is more complicated as there is a
natural production of estrogens in females. Therefore, an observed effect could be a
secondary response to other types of stress, including non-chemical stressors. The ecological
relevance is high as VTG is linked to reproduction. In a study where a lake was contaminated
by a synthetic estrogen, VTG was measured along with intersex, altered gonadal
development, impact on kidneys, and population decline in four species. Induction of VTG
was seen in all species before effects were seen on the other endpoints (Palace et al 2009).
Therefore, it can be said that VTG is also an early warning signal. VTG reacts to all estrogenic
chemicals, known or unknown, and is frequently used for environmental monitoring. The
analysis is relatively cheap and there are commercial ELISA-kits (Enzyme-Linked
Immunosorbent Assay) available for several fish species.
Spiggin in three spined stickleback Next in the rank order was the production of the glue protein spiggin in three-spined
stickleback. The protein is normally produced in male sticklebacks and used for building a
nest. The production is normally initiated by natural androgens in male stickleback. When
females are exposed to xenoandrogens, they also start to produce spiggin (Katsiadaki et al
2002). Furthermore, reduced spiggin in male sticklebacks can be used as an indicator for
exposure to anti-androgens (Hogan et al 2012). The specificity to endocrine disruptors
(androgens and anti-androgens) is high, as is the ecological relevance. It is likely that effects
on spiggin occur before the fitness of the individual is affected. Spiggin is not used in
monitoring programs as frequently as VTG, but has been used quite often in research
projects. One reason for this may be that exposure to synthetic estrogens has been
considered a larger environmental risk than androgens. Exposure to androgens has mainly
been restricted to effluents from pulp and paper industry (Wartman et al 2009). There is a
commercial ELISA-kit available, which keeps the costs to a relatively low level. The analysis
is, however, limited in that it can only be used in ecosystems that contain the three-spined
stickleback.
Intersex in fish and gastropods Intersex had the same total score as spiggin. Intersex describes a condition where both male
and female tissue occurs in the reproductive organs of one individual of fish or gastropod. As
a biomarker, it has been used to detect estrogenic effects in male fish (Jobling et al 1998)
and androgenic effects in female gastropods (Barroso et al 2000). The specificity of intersex is
high as the effects are very specific to endocrine disruptors and intersex does not occur
within what can be considered as natural variability. Ecological relevance is also high as
intersex is a measure of actual alterations of reproductive organs. However, as effects
already have occurred, it is not a very good early warning signal. For example, when lake
trout were exposed to a synthetic estrogen in an experimental lake, no effects were seen on
intersex until the population started to decline (Palace et al 2009). Intersex in male fish can
be caused by a number of estrogenic chemicals, including synthetic estrogens that reach the
environment through sewage treatment plants. Intersex in gastropods is mainly caused by
TBT, through the same mechanism that causes imposex. Intersex in both fish and gastropods
is used frequently in monitoring programs and is recommended by ICES. The analysis requires
skilled personnel, but no advanced technical equipment.
Egg shell thickness Egg shell thickness has mainly been associated with DDT exposure. Dramatic decreases in egg
shell thickness were observed in the 1950s and 1960s, followed by an increase after the bans
on DDT in the 1970s (Bignert et al 1994). Egg shell thickness scores are high as it is a
biomarker with high specificity and ecological relevance, which has been used in
environmental monitoring and assessment and has low cost. It may act as an early warning
signal if the reduction in egg shell thickness is detected before the thickness is below the
critical level. However, egg shell thickness cannot be expected to provide information about
mixtures of chemicals.

Biomarkers for Environmental Monitoring | M-88 2013
28
Zona radiata protein Zona radiata protein (ZRP) is another biomarker that is sensitive to estrogenic chemicals. ZRP
is an eggshell protein that, just like VTG, is induced by endogenous estrogens (Arukwe 1997).
Dose-response studies have shown that ZRP and VTG are approximately equally sensitive to
estrogenic exposure (Arukwe et al 2000). As ZRP can be linked to reproduction, there are also
reasons to believe that the level of ecological relevance is high. However, ZRP has not been
used frequently in environmental monitoring or environmental assessments. The analysis is
relatively simple, but is not as commercially available as VTG.
Imposex in gastropods Imposex in the gastropod dog whelk is already in use for environmental monitoring of
hazardous substances in Norwegian fjords and coastal waters. Imposex is a measure of the
development of male genetalia in females. Imposex affect reproduction and has been linked
to population decline in gastropods (Oehlmann et al 1996). It is very specific for exposure to
TBT, but not a useful early warning signals as the organisms are already seriously affected
(often to the degree of sterility). Furthermore, it cannot be expected to react to other
chemicals than TBT. Imposex is recommended by ICES and the analysis requires skilled
personnel.
Aromatase Aromatase is an enzyme that is involved in the aromatization of androgens into estrogens.
Aromatase is, thus, important for maintaining the hormonal balance. Tissues with high
concentrations of aromatase include brain and gonads. Several types of contaminants have
been linked to aromatase inhibition (Noaksson et al 2002, Lavado et al 2004). However, due
to the complexity of the hormonal system, including different feedback mechanisms,
interpretation of the results is complicated and other factors cannot be excluded. Aromatase
may act as an early warning signal in some exposure situations, but it cannot always be
expected. Aromatase in fish is used in environmental monitoring and assessments (e.g., in the
UK) but is not recommended by ICES or OSPAR.
Congenital malformations in birds Congenital malformations (birth defects, for example crossed bills) in fish-eating birds and
other birds of prey can be used to detect biologically significant exposure to developmental
toxins in the food chain (Fox et al. 1991). Congenital malformations have, for example, been
used for identifying the presence of embryotoxic contaminants in agricultural drainwater
(Ohlendorf et al 1986) and in the Great Lakes ecosystems (Kubiak et at 1989). The ecological
relevance is obviously very high as such impairment may significantly reduce fitness. As the
phenomenon is rare in pristine areas, it can also be concluded that it is relatively specific to
chemical stress (although other factors cannot be excluded). Congenital malformations have
mostly been associated with severely polluted areas. Therefore, it is likely that other effects
have already been observed, and that it is not a very good early warning signal. The effects
may be caused by a large number of chemicals. Congenital malformations have been used in
different research projects and environmental assessments, but are not frequently used for
environmental monitoring. The analysis is relatively straight forward, but it may be time
consuming to collect the necessary material.
Macroscopic liver neoplasms Macroscopic liver neoplasms (tumours) can be used to investigate exposure to and effects of
chemicals (Koehler 2004). The effects can be caused directly by carcinogenic chemicals, but
can also be an indirect effect of chronic stress caused by chemicals. The ecological relevance
is high, as it can be expected that the fitness of the individual is significantly impaired.
However, it cannot be excluded that other factors contribute to the effect. The method may
provide some value as an early warning signal and the cost is moderate. The method is
recommended by OSPAR.

Biomarkers for Environmental Monitoring | M-88 2013
29
Hatching success and brood size in birds Another reproduction related biomarker is hatching success in birds. Early studies in the great
lakes showed that chemicals could reduce hatching success via intrinsic (embryotoxic) and
extrinsic (adult behavioral) mechanisms (Keith 1966, Gilbertson and Hale 1974). Hatching
success, and subsequent brood size, is used for monitoring as well as research purposes
(Helander and Bignert 2012). The ecological relevance is very high, while the specificity for
chemicals is somewhat lower. The analysis is simple with a low cost.
Skeletal deformities Skeletal deformities have been observed in several fish species that have been exposed to
complex mixtures of chemicals (Lindesjöö 1992, Bengtsson et al 1985, Hanson and Larsson
2011). Such deformities are likely to affect fitness, and thereby have high ecological
relevance. The specificity for chemicals is intermediate as other environmental or biological
factors cannot be excluded. Skeletal deformities are likely to respond to a large variety of
chemicals. The analysis is simple, but has not been used frequently for environmental
monitoring.
6.2.2 Biomarkers for mixture effects The biomarkers for mixture effects that ranked highest are presented in Table 9, including
the score for each property. Among the ten biomarkers that ranked highest, seven were also
ranked high for ecological relevance. These were VTG in fish, aromatase, congenital
malformations in birds, skeletal deformities, hatching success and brood size for birds, spiggin
in three-spined stickleback, and intersex in fish and gastropods. The large overlap can be
explained by the fact that the properties ecological relevance and ability to respond to
different types of chemicals are both associated with endpoints at higher levels of biological
organization. The biomarkers that are presented in the previous section (and Table 8) are not
presented again in this section. Below is a presentation of the remaining three biomarkers.
No biomarkers on this list are presently used in Norwegian environmental monitoring.
Table 9 Highest ranked biomarkers for detecting mixture effects
Rank Biomarker Specificity Relevance Early Warning Mixture Status Analysis
1 Vitellogenin (VTG) in
fish
2 2 2 1 2 2
2 Aromatase 1 2 1 2 1 1
2 Congenital
malformations in birds
1 2 1 2 1 1
2 Skeletal deformities 1 2 1 2 1 1
2 Hatching success and
brood size for birds
1 2 0 2 1 2
6 Spiggin in three spined
stickleback
2 2 1 1 1 1
6 Micronuclei test 1 2 1 1 2 1
6 Intersex in fish and
gastropods
2 2 0 1 2 1
9 Liver somatic index
(LSI)
1 1 1 2 2 2
10 Blubber thickness in
seals
0 2 1 2 1 2

Biomarkers for Environmental Monitoring | M-88 2013
30
Micronuclei test The micronuclei test provides information about the accumulated genetic damage during the
lifespan of the cells. For monitoring purposes, the micronuclei test has mostly been used on
bivalves and fish, although other groups of organisms can also be used. The test has shown to
respond dose dependently to many chemicals, although there are also other biotic and
environmental factors involved (Bolognesi and Hayashi 2011). The ecological relevance must
be considered as high as genetic damage may affect several generations. The micronucleus
test responds before damage to the populations, but effects on the individual’s health cannot
be excluded. Therefore, it gets the intermediate score for early warning. It is recommended
by ICES to use the micronuclei test for environmental monitoring and assessment. The
procedure is technically easier and more rapid than other tests for chromosomal damage, but
still complex compared to many other biomarkers.
Liver somatic index The liver somatic index (LSI) is the weight of the liver in relation to the somatic weight. The
biomarker is mostly used in fish, although other organisms could also be used (e.g., birds). LSI
has been linked to contaminants from a number of sources, for example pulp and paper mill
effluents (Hodson et al 1992, Förlin et al 1995), landfills (Noaksson et al 2001) and
wastewater treatment plants (Kosmala et al 1998). However, there are also confounding
factors that may influence liver size. These include seasonal variations (Förlin and Haux 1990)
as well as feeding status, age, and temperature (George et al 1990). A change in liver size
may reflect somewhat impaired function. The ecological relevance was therefore set to the
intermediate level. Effects on LSI can be expected to be seen before the health is
significantly affected. However, it is not likely to respond as quickly as the protein based
biomarkers. Therefore, also early warning was set to the intermediate score. A biomarker at
the organ level, such as LSI, can be expected to respond to many different chemicals. The
highest score was therefore given for the ability to detect mixture effects. LSI in fish is used
in many monitoring programs (e.g., Sweden, UK and Canada) and is recommended as a
supplemental biomarker (ICES 2012). The analysis is extremely simple.
Blubber thickness in seals A reduced layer of blubber in seals can be an indication of exposure to chemicals. The
reduction may be caused by increased energy costs for detoxification, which means less
energy to be stored in blubber. It is also possible that chemicals can have a direct effect on
the fat metabolism. Taken together, a large number of chemicals may affect blubber
thickness. However, other environmental factors are likely to be even more important for
blubber thickness, e.g., food quality and quantity. The ecological relevance is likely to be
high as the blubber serves as both energy storage and insulation. Small reductions in blubber
thickness are likely to occur before the health of the seal is significantly impaired. Therefore,
it can serve as something of an early warning signal. Blubber thickness is used for
environmental monitoring in the Baltic Sea, where a significant decreasing trend since 1996
has been observed (Härkönen et al 2012). The analysis is simple, but requires that dead seals
are collected.
6.2.3 Biomarkers that are good early warning signals All biomarkers that ranked among the ten best for early warning are presented in Table 10,
including the score for each property. Six of the biomarkers that ranked among the ten best
biomarkers for early warning were also ranked high for ecological relevance or mixture
effects. Those were VTG in fish, spiggin in three spined stickleback, zona radiata protein,
macroscopic liver neoplasms (tumours), intersex in fish and gastropods, and the micronuclei
test. Intersex in fish was omitted from the list as it scored zero in early warning. The reason
that it still made the top-10 was the relatively high scores for all other properties. A more
detailed description of the six biomarkers is given in the previous two sections about
biomarkers with high ecological relevance and biomarkers to detect mixture effects.

Biomarkers for Environmental Monitoring | M-88 2013
31
Among the ten highest ranked biomarkers for early warning were three biomarkers that are
presently used in Norwegian environmental monitoring. Those were the Ah-receptor mediated
responses (CYP1A and EROD) and PAH-metabolites in bile (including OH-pyren).
Table 10 Highest ranked biomarkers that are good early warning signals
Rank Biomarker Specificity Relevance Early Warning Mixture Status Analysis
1 Vitellogenin (VTG) in
fish
2 2 2 1 2 2
2 Increase in CYP1A.
Ethoxyresorufin-O-
deethylase (EROD)
activity
2 0 2 1 2 2
2 PAH-metabolites in
bile
2 0 2 1 2 2
4 Spiggin in three-spined
stickleback
2 2 1 1 1 1
4 Egg shell thickness 2 2 0 0 1 2
6 Micronuclei test 1 2 1 1 2 1
7 Total oxyradical
scavenging capacity
(TOSC)
1 1 2 2 1 1
7 Zona Radiata protein
(protein and mRNA)
2 2 1 1 0 1
7 Macroscopic liver
neoplasms (tumours)
2 1 1 1 2 1
7 Antioxidant enzymes 1 0 2 2 2 2
CYP1A and EROD CYP1A and EROD have similar properties and are therefore analyzed as one biomarker. The
specificity for chemicals is high as the response is induced by binding to the Ah-receptor
(e.g., dioxins, PAHs, PCBs). Although high EROD-levels have been linked to health effects,
statistically detectable CYP1A or EROD-induction is often well within the span that the
organism can cope with, thus not leading to health effects. Therefore, ecological relevance
was considered low. CYP1A and EROD are very good early warning signals for chemicals that
bind to the Ah-receptor. EROD is frequently used for environmental monitoring and is
recommended by both ICES and OSPAR. The analysis has a low cost and is widely available.
PAH-metabolites in bile Equally high scores were given to PAH-metabolites in bile. OH-pyrene, which is included in
the program for monitoring of hazardous substances in Norwegian fjords and coastal waters,
is an example of a PAH-metabolite. There are different methods to measure PAH-metabolites
in bile. A cheap semi-quantitative method is to use fixed wavelength fluorescence. By using
different wavelengths, the PAHs can be roughly divided into 2-, 4-, and 5-ringed (Hanson and
Larsson 2008). The ratio between 2- and 4-ringed PAHs can be used to roughly determine the
dominating source of the PAHs (pyrogenic or petrogenic) (Hanson et al 2009b). However,
specific PAHs cannot be determined. A method with higher precision is to use HPLC. This is
the method that is currently used in the program for monitoring of hazardous substances in
Norwegian fjords and coastal waters. The cost of the higher precision is that other PAHs are
not included in the analysis. Regardless of method used, PAH-metabolites in bile has very high
specificity for chemicals and low ecological relevance.
Biomarkers for Environmental Monitoring | M-88 2013
32
Total oxiradical scavenging capacity (TOSC) Total oxiradical scavenging capacity (TOSC) assay describes the biological resistance to
various kinds of oxyradicals. When the assay is used for monitoring, the capability to
neutralize cellular oxidants is measured on field collected organisms, e.g., mussels (Regoli
2000). Thereby, the assay shows whether the organisms have been exposed to chemicals that
impair the resistance to oxyradicals. At high pollution levels, many species are subjected to
increased intracellular flux of oxyradicals produced by the Fenton reaction in the
presence of transition metals or by the redox cycle of several organic compounds (Winston,
1991). The specificity of the assay is intermediate as both chemicals and other factors may
affect the results (Regoli 2000). The assay is a direct measure of an organisms ability to resist
oxidative stess. However, there is no obvious link to fitness or population level effects. The
assay has shown to be sensitive and is therefore a good early warning signal. The analysis has
been used for different research projects and environmental assessments, but is not
recommended by ICES or OSPAR. The analysis is relatively straight forward, but not widely
available.
Antioxidant enzymes A number of antioxidant enzymes have been used for environmental monitoring and
assessment. Examples of such biomarkers are catalase (CAT), glutathione reductase (GR),
superoxide dismutase (SOD), and glutathione peroxidase (GPOX). The measurements have
mainly been used in fish (e.g., Monteiro et al 2006), but other organisms can also be used.
Although there is clear evidence showing that antioxidant biomarkers respond to chemicals,
there are also other factors that affect the results, e.g., solar radiance (Hanson et al 2006).
Therefore, the results may sometimes be difficult to interpret. The ecological relevance is
low as there is no link to health or fitness. Antioxidant biomarkers are very good early
warning signals as measurable effects occur before health is impaired. They can respond to a
variety of chemicals with antioxidant properties and are therefore suitable for detecting
effects of mixtures that include unknown or unexpected chemicals. CAT and GR are
recommended by ICES and the analyses are relatively cheap.
7. Recommendations for Norwegian monitoring
Based on the findings in this literature study, specific recommendations for the
different Norwegian monitoring programs are presented below. For each program,
five biomarkers are suggested. However, it must be noted that these are just
examples of biomarkers that are likely to add value to the monitoring programs. In
Appendix A and B, there are many other biomarkers that may be just as good, or
better, depending on the specific goals, cost related issues and available species. The
reasoning behind the suggestions is given in the following sections.
7.1 Monitoring in fjords and coastal waters
(MILKYS)
The biomarkers presently used for monitoring in fjords and coastal waters (MILKYS) are all
very or relatively specific to contaminants, or groups of contaminants, that are already quite
well monitored. It is very likely that it would be possible to gain more information about the
exposure to and effect of chemicals by using a broader spectrum of biomarkers.

Biomarkers for Environmental Monitoring | M-88 2013
33
Imposex has very high ecological relevance and was ranked high among biomarkers for
ecological relevance. However, it is very specific for TBT, and it can be questioned if it
provides valuable information for environmental management that is not also retrieved from
chemical measurements of TBT. However, it is possible that other contaminants with similar
properties will appear. Monitoring imposex may therefore be motivated for other reasons
than just following the decrease in TBT.
ALA-D is another biomarker with high specificity (lead). Again, it can be questioned whether
the biomarker provides information for environmental management that is not already
retrieved from chemical measurements. Unlike imposex, ALA-D is not a biomarker with high
ecological relevance. It can therefore be questioned whether ALA-D provides any valuable
information in continuous monitoring. Instead, ALA-D may be most useful in retrospective risk
assessments where lead is suspected of having contributed to a biological effect (e.g. fish
death). This is because the effect on ALA-D remains for a relatively long period, so that it can
be shown that the organisms have been exposed to lead even after the lead has left the
ecosystem.
CYP1A and EROD rank high among biomarkers for exposure and they provide information that
can be considered as very useful for environmental monitoring. However, they both respond
to chemicals that bind to the Ah-receptor. It could, therefore, be argued that it would be
sufficient to only use one of them.
OH-pyrene in bile measures exposure to another chemical that binds to the Ah-recpetor, and
thus induce CYP1A and EROD (Zapata-Pérez et al 2002). For general monitoring of diffuse
pollution or biological effects, it may be satisfactory to monitor CYP1A or EROD. The
drawback is that it is not known if a response is caused by PAHs or other contaminants. If
there is a specific interest in pyrene or other PAHs, it may be motivated to monitor PAH-
metabolites in bile even if CYP1A or EROD are also monitored. PAHs in blue mussel are
already monitored at several sites. However, it cannot be expected that mussels provide a
good estimate of exposure to pelagic fish (see correlations in Figure 5). It is therefore
motivated to measure in both blue mussel and Atlantic cod bile. One way of making the
different measurements in mussel and fish complement each other would be to use the semi-
quantitative method based on fluorescence for bile. This would mean that both specific and
broad PAH-analyses are included.
In Table 11, the biomarkers that are used within the program for monitoring of hazardous
substances in fjords and coastal waters are shown with their scores for the six properties. The
sum of the scores for all biomarkers is shown in the last row of Table 11. As can be seen, it is
ecological relevance and the ability to detect mixture effects that have the lowest scores.
The only score for ecological relevance is for imposex, and that is mainly for one singe
pollutant.
Table 11 Biomarkers used for monitoring in fjords and coastal waters (MILKYS)
Biomarker Specificity Relevance Early Warning Mixture Status Analysis
Imposex in gastropods
(e.g., VDSI)
2 2 0 0 2 1
-aminolevulinic acid
dehydratase inhibition
(ALA-D)
1 0 2 0 1 2
CYP1A levels 2 0 2 1 2 2
EROD 2 0 2 1 2 2
PAH-metabolites in bile 2 0 2 1 2 2
Total: 9 2 8 3 9 9

Biomarkers for Environmental Monitoring | M-88 2013
34
There are several biomarkers in Tables 8 and 9 that could be added to increase the score for
ecological relevance and ability to detect mixtures. As VTG is ranked highest in both
ecological relevance and to detect mixtures, it is a logical choice. Aromatase had maximum
scores in both ecological relevance and ability to detect mixture effects, and would add a
nice complement to the other biomarkers. As the liver of the fish is already dissected, LSI can
be added at a negligible cost. LSI has the highest score in ability to detect mixture effects,
and because of the relatively high scores in other properties, it was also ranked among the
ten best for mixtures.
In Table 12, the scores for the different properties are presented for the suggested
biomarkers, including the total score for each property. By comparing Tables 11 and 12, it
can be seen that ecological relevance and ability to detect mixture effects is higher, while
the scores for the other properties is relatively unchanged.
Table 12 Suggested biomarkers for monitoring in fjords and coastal waters (MILKYS)
Biomarker Specificity Relevance Early Warning Mixture Status Analysis
EROD (or CYP1A) 2 0 2 1 2 2
PAH-metabolites in bile 2 0 2 1 2 2
Vitellogenin in fish 2 2 2 1 2 2
Aromatase in fish 1 2 1 2 1 1
Liver somatic index (LSI)
in fish
1 1 1 2 2 2
Total: 8 5 8 7 9 9
7.2 Monitoring of pollutants in large lakes
The monitoring program for pollutants in large lakes includes chemical measurements in fish
from different trophic levels. The purpose of this approach is to assess biomagnification
through the food web. By adding biomarkers in at least two of the fish species that are
included (smelts, whitefish and trout), it can be seen if food web effects in concentrations
are also followed by biological effects. This is interesting not only from a management
perspective, but also from a scientific perspective. Considering the aim and the approach of
the program, it is advisable to add biomarkers that rank high for ecological relevance and for
detecting mixture effects. This means that the biomarkers that were suggested in the
previous paragraph (for MILKYS) are likely to also add value for monitoring of pollutants in
large lakes. However, in this program it is suggested that macroscopic liver neoplasms is
added and PAH-metabolites is removed. This change is because it is likely that PAHs are
already covered to a large extent by EROD, and it is unlikely that they will accumulate
through the food chain. Liver neoplasms, on the other hand, are more likely to be caused by
chemicals with bioaccumulating properties. The scores on the different properties for the
suggested biomarkers are presented in Table 13, including the total score for each property.
Again, the scores of the different properties are relatively balanced.
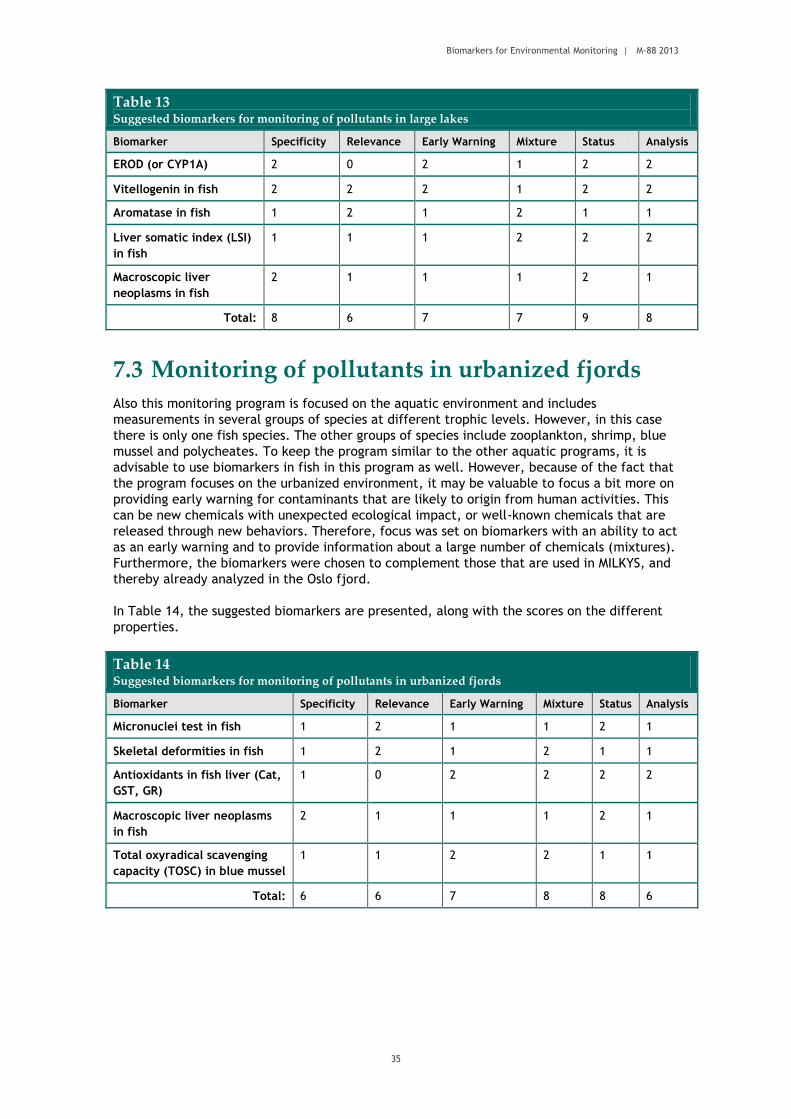
Biomarkers for Environmental Monitoring | M-88 2013
35
Table 13 Suggested biomarkers for monitoring of pollutants in large lakes
Biomarker Specificity Relevance Early Warning Mixture Status Analysis
EROD (or CYP1A) 2 0 2 1 2 2
Vitellogenin in fish 2 2 2 1 2 2
Aromatase in fish 1 2 1 2 1 1
Liver somatic index (LSI)
in fish
1 1 1 2 2 2
Macroscopic liver
neoplasms in fish
2 1 1 1 2 1
Total: 8 6 7 7 9 8
7.3 Monitoring of pollutants in urbanized fjords
Also this monitoring program is focused on the aquatic environment and includes
measurements in several groups of species at different trophic levels. However, in this case
there is only one fish species. The other groups of species include zooplankton, shrimp, blue
mussel and polycheates. To keep the program similar to the other aquatic programs, it is
advisable to use biomarkers in fish in this program as well. However, because of the fact that
the program focuses on the urbanized environment, it may be valuable to focus a bit more on
providing early warning for contaminants that are likely to origin from human activities. This
can be new chemicals with unexpected ecological impact, or well-known chemicals that are
released through new behaviors. Therefore, focus was set on biomarkers with an ability to act
as an early warning and to provide information about a large number of chemicals (mixtures).
Furthermore, the biomarkers were chosen to complement those that are used in MILKYS, and
thereby already analyzed in the Oslo fjord.
In Table 14, the suggested biomarkers are presented, along with the scores on the different
properties.
Table 14 Suggested biomarkers for monitoring of pollutants in urbanized fjords
Biomarker Specificity Relevance Early Warning Mixture Status Analysis
Micronuclei test in fish 1 2 1 1 2 1
Skeletal deformities in fish 1 2 1 2 1 1
Antioxidants in fish liver (Cat,
GST, GR)
1 0 2 2 2 2
Macroscopic liver neoplasms
in fish
2 1 1 1 2 1
Total oxyradical scavenging
capacity (TOSC) in blue mussel
1 1 2 2 1 1
Total: 6 6 7 8 8 6
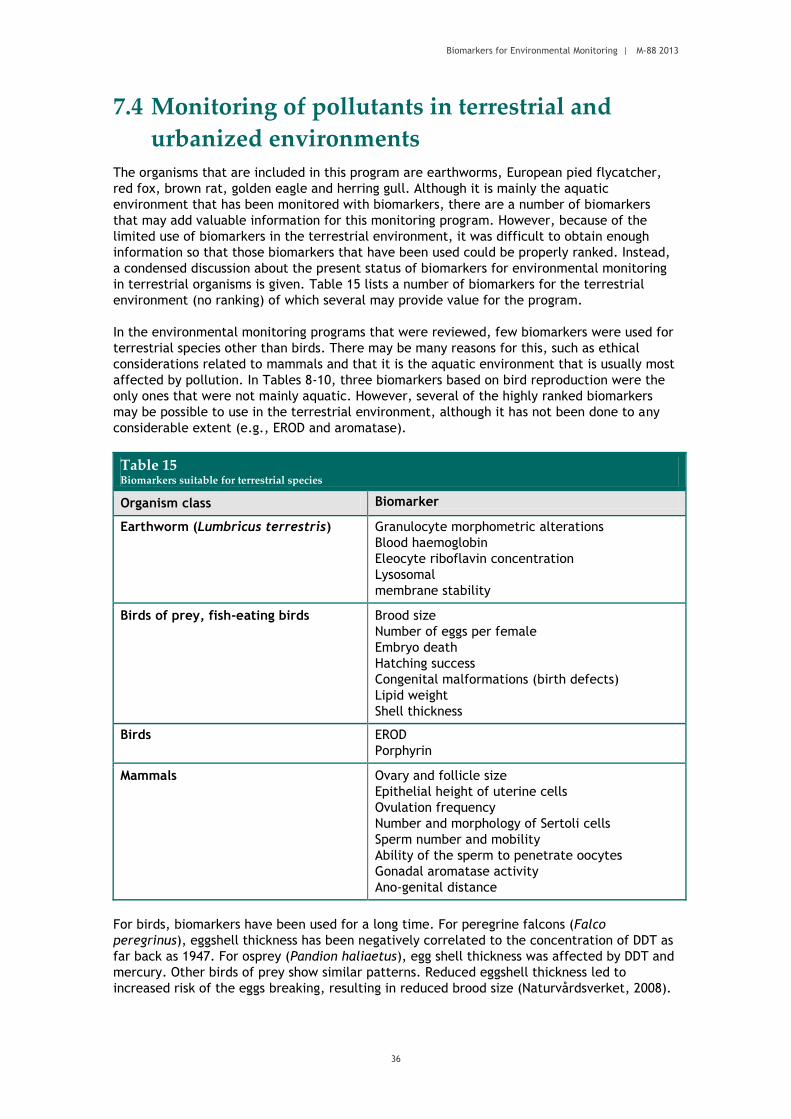
Biomarkers for Environmental Monitoring | M-88 2013
36
7.4 Monitoring of pollutants in terrestrial and
urbanized environments
The organisms that are included in this program are earthworms, European pied flycatcher,
red fox, brown rat, golden eagle and herring gull. Although it is mainly the aquatic
environment that has been monitored with biomarkers, there are a number of biomarkers
that may add valuable information for this monitoring program. However, because of the
limited use of biomarkers in the terrestrial environment, it was difficult to obtain enough
information so that those biomarkers that have been used could be properly ranked. Instead,
a condensed discussion about the present status of biomarkers for environmental monitoring
in terrestrial organisms is given. Table 15 lists a number of biomarkers for the terrestrial
environment (no ranking) of which several may provide value for the program.
In the environmental monitoring programs that were reviewed, few biomarkers were used for
terrestrial species other than birds. There may be many reasons for this, such as ethical
considerations related to mammals and that it is the aquatic environment that is usually most
affected by pollution. In Tables 8-10, three biomarkers based on bird reproduction were the
only ones that were not mainly aquatic. However, several of the highly ranked biomarkers
may be possible to use in the terrestrial environment, although it has not been done to any
considerable extent (e.g., EROD and aromatase).
Table 15 Biomarkers suitable for terrestrial species
Organism class Biomarker
Earthworm (Lumbricus terrestris) Granulocyte morphometric alterations
Blood haemoglobin
Eleocyte riboflavin concentration
Lysosomal
membrane stability
Birds of prey, fish-eating birds Brood size
Number of eggs per female
Embryo death
Hatching success
Congenital malformations (birth defects)
Lipid weight
Shell thickness
Birds EROD
Porphyrin
Mammals Ovary and follicle size
Epithelial height of uterine cells
Ovulation frequency
Number and morphology of Sertoli cells
Sperm number and mobility
Ability of the sperm to penetrate oocytes
Gonadal aromatase activity
Ano-genital distance
For birds, biomarkers have been used for a long time. For peregrine falcons (Falco
peregrinus), eggshell thickness has been negatively correlated to the concentration of DDT as
far back as 1947. For osprey (Pandion haliaetus), egg shell thickness was affected by DDT and
mercury. Other birds of prey show similar patterns. Reduced eggshell thickness led to
increased risk of the eggs breaking, resulting in reduced brood size (Naturvårdsverket, 2008).

Biomarkers for Environmental Monitoring | M-88 2013
37
Eggshell thickness of the Baltic guillemot is included in the Swedish environmental monitoring
program. For pied flycatcher (Ficedula hypoleuca) biomarkers such as EROD, tarsus length and
breeding success were studied in the contamination gradient from a copper smelter and
showed dose-dependent results (Eeva et al. 2000). Other studies have also shown promising
results with EROD in birds (Barton et al 2013) Porphyrin levels have been suggested as a
biomarker for polyhalogenated hydrocarbons and heavy metals in birds by Casini (2003). Celis
et al (2012) showed that lead and mercury also affected the porphyrin levels in penguin
excrements. Martinez-Haro et al (2013) investigated biomarkers for lead exposure in
excrements from greylag geese (Anser anser) and purple gallinule (Porphyrio porphyria) ten
years after a mine spill. Concentrations of faecal porphyrins and biliverdin were determined
as non-invasive biomarkers for studying lead exposure.
Different biomarkers in feathers have been examined. Le Tortorec et al (2012) examined the
influence of habitat fragmentation on feather growth bar length in the free-living Eurasian
treecreeper (Certhia familiaris) but found no correlation. Fairhurst et al (2013) showed that
corticosterone in feathers from tree swallows (Tachycineta bicolor) can reflect plasma
corticosterone, but correlations may not always be expected. Koren et al (2012) measured
testosterone, corticosterone and cortisol in the feathers of house sparrows (Passer
domesticus). They found that concentrations of testosterone, corticosterone and cortisol in
feathers correlated to winter mortality. Feather steroids can hence be possible biomarkers to
predict the future survival of individuals in the wild. However, these studies have not
examined any correlation to pollutants. Many other studies examined the chemical content of
feathers, such as mercury and PBDEs. Bourgeon et al (2012) examined biomarkers in Great
skua (Stercorarius skua). No consistent within-colony relationships between feather
corticosterone, plasma immunoglobulin Y levels and oxidative stress and POPs such as
organochlorines and PBDEs could be shown. The authors suggested that other ecological
factors such as food availability could constrain physiological indicators more than
anthropogenic contaminants.
In mammals, the effects of environmental contaminants have largely focused on disruptions
of the gonad. In females, some of the most common indices of xenoestrogen exposure include
reductions in ovary and follicle size, epithelial height of uterine cells, and ovulation
frequency. Testicular endpoints are most common in males, including number and
morphology of Sertoli cells, sperm number and mobility, and the ability of the sperm to
penetrate oocytes. Gonadal aromatase activity can be used as a marker for both males and
females. Aromatase is an enzyme that converts testosterone to estradiol. This biomarker has
been shown to correlate to exposure for chemicals such as methyl tertiary-butyl ether (MTBE)
(de Peyster et al 2003), bisphenol-A (Akingbemi 2004), and triazine herbicides (Sanderson et
al 2001). The ano-genital distance have also been used to assess exposure to endocrine
disrupting chemicals (Hamlin and Guillette Jr 2010), e.g. phtalates (e.g., Swan 2008).
Impaired tooth development of bank vole (Clethrionomys glareolus) proved to be a sensitive
endpoint of dioxin exposure (Kattainen et al. 2001). Size of molar teeth has been suggested as
a sensitive and robust biomarker for PCDD/Fs exposure (Miettinen 2006).
Fecal porphyrin levels from rabbit have been shown to be a good biomarker for exposure to
the insecticide diazinon (Hernández-Moreno 2012). One advantage of this biomarker is that it
does not require that the animal is killed.
Earthworms are important for soil formation and organic matter breakdown in most
terrestrial environments. Earthworms are significantly affected by pollution from intensive
use of biocides in agriculture, industrial activities, and atmospheric deposition. Hence,
earthworms are valuable bioindicators of soil pollution (Lionetto 2012). Different pollutants,
such as metals and pesticides, have been shown to influence biomarkers in earthworms (e.g.
Lukkari et al. 2004, Laszczyca et al. 2004).

Biomarkers for Environmental Monitoring | M-88 2013
38
It is advisable to include biomarkers in birds of prey or fish eating birds as they are found high
in the food web and are, therefore, extra sensitive due to biomagnification of contaminants.
Congenital malformations, egg shell thickness and hatching success/brood size were all
ranked high, and can therefore be recommended. All three have very high ecological
relevance, and congenital malformations and hatching success/brood size can be expected to
respond to mixtures of different types of chemicals. Although effects on eggshell thickness
have been reduced following the ban on DDT, it is possible that new chemicals will have the
same effect (although the MOA may be different). Furthermore, old releases of DDT may
reach the food chain again due to environmental or biological processes (Helander and
Bignert 2012). EROD has been used to a limited extent in birds, and is ranked high among
biomarkers that are good early warning signals. However, it may be difficult to include EROD
in birds in a monitoring program as it requires that the organism is killed. Already dead
animals cannot be used as the enzymatic activity ceases when oxygen is no longer transported
to the tissue. Aromatase activity in gonads can be used to detect endocrine disruption in
mammals. For aromatase analyses, brown rat is suggested. However, as for birds it may be
difficult to collect the animals (which needs to be alive at sampling).
In Table 16, the suggested biomarkers in terrestrial and urbanized environments are
presented. However, only the first three have been properly assessed in this report. EROD in
birds and aromatase in brown rat are assumed to provide the desired information based on
the experience with these enzyme systems in fish, and the limited use that is reported in
birds and mammals, respectively.
Table 16 Suggested biomarkers for monitoring of pollutants in terrestrial and urbanized environments
Biomarker Specificity Relevance Early Warning Mixture Status Analysis
Congenital malformations
in birds
1 2 1 2 1 1
Egg shell thickness for
carnivorous birds
2 2 1 0 1 2
Hatching success and
brood size for birds
1 2 0 2 1 2
EROD in birds 2 0 2 1 2 2
Gonadal aromatase activity
in brown rat
1 2 1 2 1 1
Total: 7 8 4 8 8 6
8. References
Ahlers J, Riedhammer C, Vogliano M, Ebert RU, Kuhne R, Schuurmann G. 2006. Acute to
chronic ratios in aquatic toxicity - Variation across trophic levels and relationship with
chemical structure. Environmental Toxicology and Chemistry 25(11):2937-2945.
Akingbemi B, Soitas C, Koulova A, Kleinfelter G, Hardy M. 2004. Inhibition of testicular
steroidogenesis by the xenoestrogen bisphenol A is associated with reduced pituitary
luteinizing hormone secretion and decreased steroidogenic enzyme gene expression in rat
Leydig Cells. Endocrinology 145:592-603.
Arukwe A, Celius T, Walther BT, Goksøyr A. 2000. Effects of xenoestrogen treatment on zona
radiata protein and vitellogenin expression in Atlantic salmon (Salmo salar). Aquatic
Toxicology 49:159-170
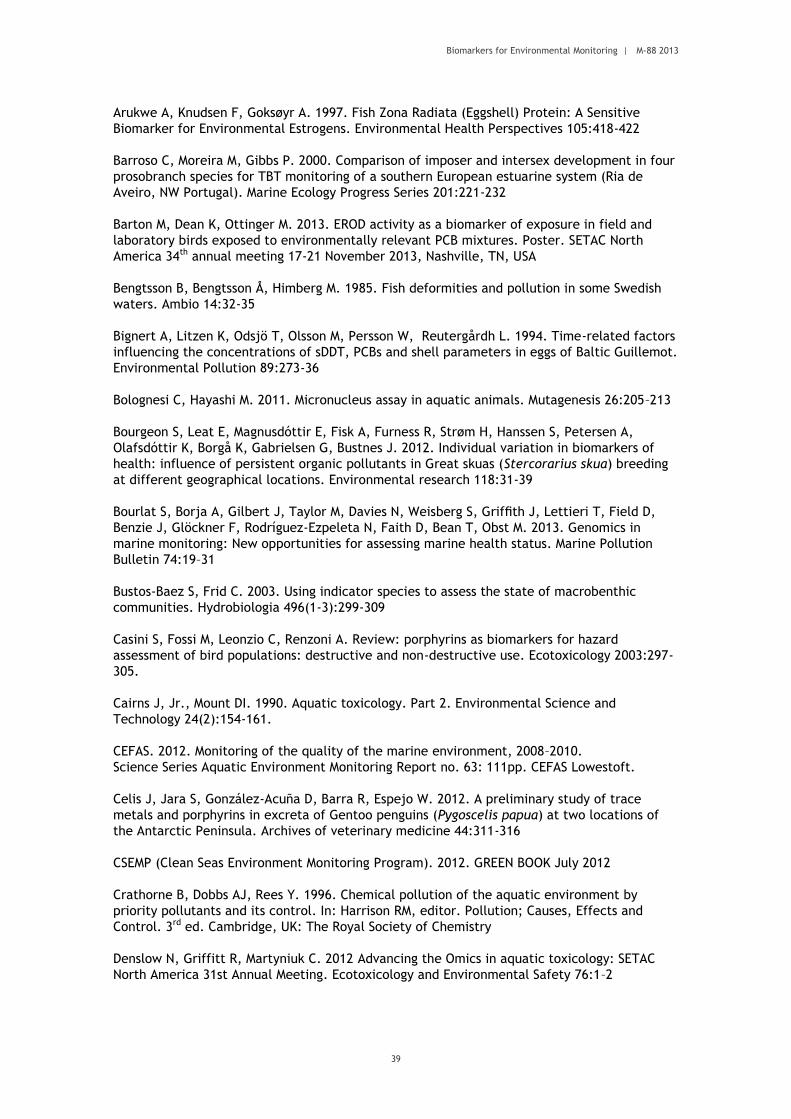
Biomarkers for Environmental Monitoring | M-88 2013
39
Arukwe A, Knudsen F, Goksøyr A. 1997. Fish Zona Radiata (Eggshell) Protein: A Sensitive
Biomarker for Environmental Estrogens. Environmental Health Perspectives 105:418-422
Barroso C, Moreira M, Gibbs P. 2000. Comparison of imposer and intersex development in four
prosobranch species for TBT monitoring of a southern European estuarine system (Ria de
Aveiro, NW Portugal). Marine Ecology Progress Series 201:221-232
Barton M, Dean K, Ottinger M. 2013. EROD activity as a biomarker of exposure in field and
laboratory birds exposed to environmentally relevant PCB mixtures. Poster. SETAC North
America 34th annual meeting 17-21 November 2013, Nashville, TN, USA
Bengtsson B, Bengtsson Å, Himberg M. 1985. Fish deformities and pollution in some Swedish
waters. Ambio 14:32-35
Bignert A, Litzen K, Odsjö T, Olsson M, Persson W, Reutergårdh L. 1994. Time-related factors
influencing the concentrations of sDDT, PCBs and shell parameters in eggs of Baltic Guillemot.
Environmental Pollution 89:273-36
Bolognesi C, Hayashi M. 2011. Micronucleus assay in aquatic animals. Mutagenesis 26:205–213
Bourgeon S, Leat E, Magnusdóttir E, Fisk A, Furness R, Strøm H, Hanssen S, Petersen A,
Olafsdóttir K, Borgå K, Gabrielsen G, Bustnes J. 2012. Individual variation in biomarkers of
health: influence of persistent organic pollutants in Great skuas (Stercorarius skua) breeding
at different geographical locations. Environmental research 118:31-39
Bourlat S, Borja A, Gilbert J, Taylor M, Davies N, Weisberg S, Griffith J, Lettieri T, Field D,
Benzie J, Glöckner F, Rodríguez-Ezpeleta N, Faith D, Bean T, Obst M. 2013. Genomics in
marine monitoring: New opportunities for assessing marine health status. Marine Pollution
Bulletin 74:19–31
Bustos-Baez S, Frid C. 2003. Using indicator species to assess the state of macrobenthic
communities. Hydrobiologia 496(1-3):299-309
Casini S, Fossi M, Leonzio C, Renzoni A. Review: porphyrins as biomarkers for hazard
assessment of bird populations: destructive and non-destructive use. Ecotoxicology 2003:297-
305.
Cairns J, Jr., Mount DI. 1990. Aquatic toxicology. Part 2. Environmental Science and
Technology 24(2):154-161.
CEFAS. 2012. Monitoring of the quality of the marine environment, 2008–2010.
Science Series Aquatic Environment Monitoring Report no. 63: 111pp. CEFAS Lowestoft.
Celis J, Jara S, González-Acuña D, Barra R, Espejo W. 2012. A preliminary study of trace
metals and porphyrins in excreta of Gentoo penguins (Pygoscelis papua) at two locations of
the Antarctic Peninsula. Archives of veterinary medicine 44:311-316
CSEMP (Clean Seas Environment Monitoring Program). 2012. GREEN BOOK July 2012
Crathorne B, Dobbs AJ, Rees Y. 1996. Chemical pollution of the aquatic environment by
priority pollutants and its control. In: Harrison RM, editor. Pollution; Causes, Effects and
Control. 3rd ed. Cambridge, UK: The Royal Society of Chemistry
Denslow N, Griffitt R, Martyniuk C. 2012 Advancing the Omics in aquatic toxicology: SETAC
North America 31st Annual Meeting. Ecotoxicology and Environmental Safety 76:1–2

Biomarkers for Environmental Monitoring | M-88 2013
40
Dowd W. 2012. Challenges for Biological Interpretation of Environmental Proteomics Data in
Non-model Organisms. Integrative and Comparative Biology 52:705–720
Eeva T, Tanhuanpaa S, Rabergh C, Airaksinen S, Nikinmaa M, Lehikoinen E. 2000. Biomarkers
and Fluctuating Asymmetry as Indicators of Pollution-Induced Stress in Two Hole-Nesting
Passerines. Functional Ecology 14:235-243
ECETOC (European Center for Ecotoxicology and Toxicology Of Chemicals). 2010. Workshop
report no. 19. Omics in (eco) toxicology: Case studies and risk assessment.
Environment Canada. 2010. 2010 Pulp and Paper Environmental Effects Monitoring (EEM)
Technical Guidance Document.
Environment Canada. 2012a. Fifth National Assessment of Environmental Effects Monitoring
Data from Pulp and Paper Mills Subject to the Pulp and Paper Effluent Regulations. National
Environmental Effects Monitoring Office, Industrial Sector Directorate, Environment Canada.
Cat. No.: En14-84/2013E-PDF. ISBN 978-1-100-21715-4
Environment Canada. 2012b. Second National Assessment of Environmental Effects Monitoring
Data from Metal Mines Subjected to the Metal Mining Effluent Regulations. National
Environmental Effects Monitoring Office, Forestry, Agriculture and Aquaculture Division,
Environment Canada. Cat. No.: En14-64/2012E-PDF. ISBN: 978-1-100-20588-5
Fairhurst, GD, Marchant, TA, Soos, C, Machin, KL, Clark RG. 2012. Experimental relationships
between levels of corticosterone in plasma and feathers in a free-living bird. Journal of
experimental biology 216:4071-4081
Feare C. 1970. The reproductive cycle of the dog whelk (Nucella lapillus). Proceedings of the
Malacological Society of London 39:125-137
Finelli V, Klauder D, Karaffa M, Petering H. 1975. Interaction of zinc and lead on δ-
aminolevulinate dehydratase. Biochemical and Biophysical Research Communications
65:303–311
Forbes VE, Palmqvist A, Bach L. 2006. The use and misuse of biomarkers in ecotoxicology.
Environmental Toxicology and Chemistry 25(1):272-280
Fox G, Gilbertson M, Gilman A, Kubiak T. 1991. A rationale for the use of colonial fish-eating
birds to monitor the presence of developmental toxicants in Great Lakes fish. Journal of
Great Lakes Research 17:151-152
Förlin L, Andersson T, Balk L, Larsson Å. 1995. Biochemical and physiological effects
in fish exposed to bleached kraft mill effluents. Ecotoxicology and Environmental Safety
30:164–170
Förlin L, Haux C. 1990. Sex differences in hepatic cytochrome P-450 monooxygenase
activities in rainbow trout during an annual reproductive cycle. Journal of Endocrinology
124:207–213
George S, Young P, Leaver M, Clarke D. 1990. Activities of pollutant metabolizing and
detoxification systems in the liver of the plaice, Pleuronectes platessa: sex and seasonal
variations in non-induced fish. Comparative Biochemistry and Physiology 96C:185–192
Gilbertson M, Hale R. 1974. Early embryonic mortality in a herring gull colony in lake Ontario.
Canadian Field-Naturalist 88:354-356

Biomarkers for Environmental Monitoring | M-88 2013
41
Hanson N, Stark JD. 2012. A comparison of population level and individual level endpoints to
evaluate ecological risk of chemicals. Environmental Science and Technology 46:5590–5598
Hanson N, Larsson Å, Förlin L, Parkkonen J, Nyberg E and Bignert A. 2012. Förändringar i
fiskhälsa – orsaker söks på bred front. HAVET – 2012, Om miljötillståndet i Svenska
havsområden. Havs- och Vattenmyndigheten. ISBN:978-91-87025-12-9
Hanson N, Larsson Å. 2011. Biomarker analyses in caged and wild fish suggest exposure to
pollutants in an urban area with a landfill. Environmental Toxicology 26:315-324
Hanson N. 2010. Using biological data from field studies with multiple reference sites as a
basis for environmental management: The risks for false positives and false negatives.
Environmental Management 92:610-619
Hanson N, Förlin L, Larsson Å. 2009a. Evaluation of long term biomarker data from Perch
(Perca fluviatilis) in the Baltic Sea suggest increasing exposure to environmental pollutants.
Environmental Toxicology and Chemistry 28(2):364-373
Hanson N, Persson S, Larsson Å. 2009b. Analyses of perch (Perca fluviatilis) bile suggest
increasing exposure to PAHs and other pollutants in a reference area on the Swedish Baltic
coast. Journal of Environmental Monitoring 11(2):389-393
Hanson N, Larsson Å. 2008. Fixed wavelength fluorescence to detect PAH metabolites in fish
bile: increased statistical power with an alternative dilution method. Environmental
Monitoring and Assessment 144:221-228
Hanson N, Guttman E, Larsson Å. 2006. The effect of different holding conditions for
environmental monitoring with caged rainbow trout (Oncorhynchus mykiss). Journal of
Environmental Monitoring 8:994-999
Hamlin H, Guillette Jr L. 2010. Wildlife as sentinels of environmental impacts on reproductive
health and fertility. In Environmental Impacts on Reproductive Health and Fertility edited by
Woodruff T, Janssen S, Guillette Jr L, Giudice L. ISBN:978051167468
Helander B, Bignert A. 2012. Havsörn. HAVET – 2012, Om miljötillståndet i Svenska
havsområden. Havs- och Vattenmyndigheten. ISBN:978-91-87025-12-9
Helander B. 2000. Havsörn. Bottniska Viken – 2000. Naturvårdsverket.
Hernández-Moreno D, Pérez-López M, Míguez M, Soler F, Jiménez B. 2012. Porphyrin levels in
excreta of rabbit as non-destructive biomarkers of diazinon exposure. Environmental
Toxicology and Pharmacology 34:466-72
Hines A, Staff FJ, Widdows J, Compton RM, Falciani F, Viant MR. 2010. Discovery of Metabolic
Signatures for Predicting Whole Organism Toxicology. Toxicological Sciences 115:369-378
Hodson P, Thivierge D, Levesque M, McWhirter M, Ralph K, Gray B, Whittle D, Carey J, Van
Der Kraak G. 1992. Effects of bleached kraft mill effluent on fish in the St Maurice River,
Quebec. Environmental Toxicology and Chemistry 11:1635–1651
Hogan N, Gallant M, van den Heuvel M. 2012. Exposure to the pesticide linuron affects
androgen-dependent gene expression in the three spines stickleback (Gasterosteus
aculeatus). Environmental Toxicology and Chemistry 31:1391–1395
Hylland K, Ruus A, Grung M, Green N. 2009. Relationships between physiology, tissue
contaminants, and biomarker responses in Atlantic Atlantic cod (Gadhus morhua L.). Journal
of Toxicology and Environmental Health, Part A: Current Issues 72:226-233

Biomarkers for Environmental Monitoring | M-88 2013
42
Härkönen T, Karlsson O, Bäcklin BM. 2012. Sälpopulationer och sälhälsa. HAVET – 2012, Om
miljötillståndet i Svenska havsområden. Havs- och Vattenmyndigheten. ISBN:978-91-87025-12-
9
ICES (International Council for the Exploration of the Sea). 2012. Integrated marine
environmental monitoring of chemicals and their effects. Edited by Davies I and Vethaak D.
ICES cooperative research report #315, November 2012.
Ingole B, Sivadas S, Goltekar R, Clemente S, Nanajkar M, Sawant R, D'Silva C, Sarkar A, Ansari
Z. 2006. Ecotoxicological effect of grounded MV River Princess on the intertidal benthic
organisms off Goa. Environment International 32(2):284-291
Jobling S, Nolan M, Tyler C, Brighty G, Sumpter P. 1998. Widespread Sexual Disruption in
Wild Fish. Environmental Science and Technology 1998:2498-2506
Kattainen H, Tuukkanen J, Simanainen U, Tuomisto J, Kovero O, Lukinmaa P, Alaluusua S,
Tuomisto J, Viluksela M. 2001. In utero/lactational 2,3,7,8-tetrachlorodibenzo-p-dioxin
exposure impairs molar tooth development in rats. Toxicolology and applied pharmacology
174:216-224.
Katsiadakia I, Scotta A, Mayer I. 2002. The potential of the three-spined stickleback
(Gasterosteus aculeatus L.) as a combined biomarker for oestrogens and androgens in
European waters. Marine Environmental Research 54:725–728
Keith J. 1966. Reproduction in a population of herring gulls (Larus argentatus) contaminated
by DDT. Journal of applied ecology (Suppl) 3:57-70
Koehler A. 2004. The gender-specific risk to liver toxicity and cancer of flounder
(Platichthys flesus (L.)) at the German Wadden Sea coast. Aquatic Toxicology 70:257–276
Koren L, Nakagawa S, Burke T, Soma K, Wynne-Edwards K, Geffen E. 2012. Non-breeding
feather concentrations of testosterone, corticosterone and cortisol are associated with
subsequent survival in wild house sparrows. Proceedings of the Royal Society Part B:
Biological Sciences 279:1560-1566
Kosmala A, Migeon B, Flammarion P, Garric J. 1998. Impact assessment of a wastewater
treatment plant effluent using the fish biomarker ethoxyresorufin-O-deethylase: field and on-
site experiments. Ecotoxicology and Environmental Safety 41:19-28
Kubiak T, Harris H, Smith L, Schwartz T, Stalling D, Trick J, Sileo L, Docherty D, Erdman T.
1989. Microcontaminants and reproductive impairment of the Forster's tern on Green Bay, L.
Michigan -1983. Archives of Environmental Contamination and Toxicology 18:706-727
Monteiro D, de Almeida J, Rantin F, Kalinin A. 2006. Oxidative stress biomarkers in the
freshwater characid fish, Brycon cephalus, exposed to organophosphorus insecticide Folisuper
600 (methyl parathion). Comparative Biochemistry and Physiology, Part C 143:141–149
Larsson Å, Förlin L, Hanson N and Parkkonen J. 2012. Kustfisk - Hälsa. HAVET – 2012, Om
miljötillståndet i Svenska havsområden. Havs- och Vattenmyndigheten. ISBN:978-91-87025-12-
9
Larsson D, Adolfsson-Erici M, Parkkonen J, Pettersson M, Berg A, Olsson P, Förlin L. 1999.
Ethinyloestradiol - an undesired fish contraceptive? Aquatic Toxicology 45:91-97
Biomarkers for Environmental Monitoring | M-88 2013
43
Laszczyca P, Augustyniak M., Babczynska K, Kafel A, Migula P, Wilczek G, Witas I. 2004.
Profiles of enzymatic activity in earthworms from zinc, lead and cadmium polluted areas near
Olkusz (Poland). Environment International 30:901-910
Lavado R, Thibaut R, Raldúa D, Martín R, Porte C. 2004. First evidence of endocrine
disruption in feral carp from the Ebro River. Toxicology and Applied Pharmacology 196:247-
257
Lehmler HJ. 2005. Synthesis of environmentally relevant fluorinated surfactants - a review.
Chemosphere 58:1471-1496
Le Tortorec E, Helle S, Suorsa P, Sirkiä P, Huhta E, Nivala V, Hakkarainen H. 2012. Feather
Growth bars as a biomarker of habitat fragmentation in the Eurasian treecreeper. Ecological
Indicators 15:72–75
Lindesjöö E, Thulin J. 1992. A skeletal deformity of northern pike (Esox lucius) related to pulp
mill effluents. Canadian Journal of Fisheries and Aquatic Sciences 1992:166-172
Lionetto M, Calisi A, Schettino T. 2012. Earthworm Biomarkers as Tools for Soil Pollution
Assessment. In Soil Health and Land Use Management edited Hernandez-Soriano M. ISBN 978-
953-307-614-0
Lukkari T, Taavitsainen M, Väisänen A, Haimi J. 2004. Effects of heavy metals on earthworms
along contamination gradients in organic rich soil. Ecotoxicology Environmental Safety 59:
340-348
Martinez-Haro M, Taggart M, Lefranc H, Martin-Doimeadio R, Green A, Mateo R. 2013.
Monitoring of Pb Exposure in Waterfowl Ten Years after a Mine Spill through the Use of
Noninvasive Sampling. PLoS ONE In press doi:10.1371/journal.pone.0057295
Martín-Díaz M, Villena-Lincoln A, Bamber S, Blasco J, DelValls T. 2005. An integrated
approach using bioaccumulation and biomarker measurements in female shore crab, Carcinus
maenas. Chemosphere 58:615–626
Magnusson M, Hilvarsson A, Andersson S, Granmo Å. Biologiska effekter av organiska
tennföreningar. HAVET – 2012, Om miljötillståndet i Svenska havsområden. Havs- och
Vattenmyndigheten. ISBN:978-91-87025-12-9
McCarty LS, Munkittrick KR. 1996. Environmental biomarkers in aquatic toxicology: Fiction,
fantasy, or functional? Human and Ecological Risk Assessment 2(2):268-274
Miettinen, 2006. The effects of TCDD on the development of teeth and cortical bone in rats:
implications for risk assessment Ph.D thesis. Department of Environmental Health, National
Public Health Institute, Kuopio, Finland and Department of Pharmacology and Toxicology,
University of Kuopio, Finland and Institute of Dentistry, University of Helsinki, Finland
Munkittrick K, Arens C, Lowell R, Kaminski G. 2009. A review of potential methods for
determining critical effect size for designing environmental monitoring programs.
Environmental Toxicology and Chemistry 28(7):1361-1371.
Naturvårdsverket, 2008. Effekter av miljögifter på däggdjur, fåglar och fiskar i akvatiska
miljöer. Rapport 5908
NIVA (Norwegian Institute for Water Research). 2012. Hazardous substances in fjords and
coastal waters - 2011. Report to the Climate and Pollution Agency, No. O-12106. ISBN: 978-
82-577-6167-7.

Biomarkers for Environmental Monitoring | M-88 2013
44
Noaksson E, Linderoth M, Bosveld A, Norrgren L, Zebuhr Y, Balk L. 2002. Endocrine disruption
in brook trout (Salvelinus fontinalis) exposed to leachate from a public refuse dump. Science
of the Total Environment 305:87–103
Noaksson E, Tjärnlund U, Bosveld A, Balk L. 2001. Evidence for endocrine disruption in perch
Perca fluviatilis and roach Rutilus rutilus in a remote Swedish lake in the vicinity of a public
refuse dump. Toxicology and Applied Pharmacology 174:160–176
Oehlmann J, Fioronib P, Strobenb E, Markerta B. 1996. Tributyltin (TBT) effects on Ocinebrina
aciculata (Gastropoda: Muricidae): imposex development, sterilization, sex change and
population decline. Science of The Total Environment 188:205–223
Ohlendorf H, Hoffman D, Saiki M, Aldrich T. 1986. Embryonic mortality and abnormalities
of aquatic birds: Apparent impacts of selenium from irrigation drainwater. Science of the
Total Environment 52:49-63
Palace V, Evans R, Wautier K, Mills K, Blanchfield P, Park B, Baron C, Kidd K. 2009.
Interspecies differences in biochemical, histopathological, and population responses in
four wild fish species exposed to ethynylestradiol added to a whole lake. Canadian Journal of
Fisheries and Aquatic Sciences 66:1920–1935
de Peyster A, MacLean K, Stephens B, Ahern L, Westover C, Rozenshteyn D. 2003. Subchronic
Studies in Sprague-Dawley Rats to Investigate Mechanisms of MTBE-Induced Leydig Cell
Cancer. Toxicological Sciences 72:31–42
Preston B, Shackelford J. 2002. Multiple stressor effects on benthic biodiversity of
Chesapeake Bay: Implications for ecological risk assessment. Ecotoxicology 11:85-99
Regoli F. 2000. Total oxyradical scavenging capacity (TOSC) in polluted and translocated
mussels: a predictive biomarker of oxidative stress. Aquatic Toxicology 50:351–361
Roberts R, Gregory M, Foster B. 1998. Developing an efficient macrofauna monitoring index
from an impact study - A dredge spoil example. Marine Pollution Bulletin 36(3):231-235
Sanderson J, Letcher R, Heneweer M, Giesy J, van den Berg M. 2001. Effects of chloro-s-
triazine herbicides and metabolites on aromatase activity in various human cell lines and on
vitellogenin production in male carp hepatocytes. Environmental Health Perspectives.
109:1027–1031.
Sandström O, Larsson Å, Andersson J, Appelberg M, Bignert A, Ek H, Förlin L, Olsson M. 2005.
Three decades Swedish experience stresses the need of integrated long-term monitoring in
marine coastal areas. Water Quality Research Journal of Canada 40:233-250.
Santos M, Reis-Henriques M, Guillot R, Lima D, Franco-Duarte R, Mendes I, Queirós S, Castro
L. 2008. Anti-androgenic effects of sewage treatment plant effluents in the prosobranch
gastropod Nucella lapillus. Comparative Biochemistry and Physiology, Part C 148:87–93
Schirmer K, Fischer B, Madureira D, Pillai S. 2010. Transcriptomics in ecotoxicology.
Analytical and Bioanalytical Chemistry 397:917–923
Schmitt C, Caldwell C, Olsen B, Serdar D, Coffey M. 2002. Inhibition of erythrocyte delta-
aminolevulinic acid dehydratase (ALAD) activity in fish from waters affected by lead smelters.
Environmental Monitoring and Assessment 77:99-119
Shugart LR. 1996. Molecular markers to toxic Agents. In: Newman MC, Jagoe CH, editors.
Ecotoxicology, a hierarchical treatment. Boca Ranton: CRC Press. p 133-161.

Biomarkers for Environmental Monitoring | M-88 2013
45
Sundelin B, Eriksson AK, Löf M, Jacobsson T. 2007. Vitmärlan varnar för föroreningar. Havet
2007 - Om miljötillståndet i våra havsområden, Naturvårdsverket.
Suter G. 1993. Ecological Risk Assessment. Boca Raton, FL (USA): Lewis Publishers.
Swan S. 2008. Environmental phthalate exposure in relation to reproductive outcomes and
other health endpoints in humans. Environmental Research 108:177–184.
Timbrell JA. 1998. Biomarkers in toxicology. Toxicology 129(1):1-12
Traven L, Mićović V, Lušić D, Smital T. 2013. The responses of the hepatosomatic index (HSI),
7-ethoxyresorufin-O-deethylase (EROD) activity and glutathione-S-transferase (GST) activity in
sea bass (Dicentrarchus labrax, Linnaeus 1758) caged at a polluted site: implications for their
use in environmental risk assessment. Environmental Monitoring and Assessment 85:9009–9018
van der Oost R, Beyer J, Vermeulen NPE. 2003. Fish bioaccumulation and biomarkers in
environmental risk assessment: a review. Environmental Toxicology and Pharmacology
13(2):57-149
Wartman C, Hogan N, Hewitt L, McMaster M, Landman M, Taylor S, Kovacs T, van den Heuvel.
2009. Androgenic effects of a Canadian bleached kraft pulp and paper effluent as assessed
using threespine stickleback (Gasterosteus aculeatus). Aquatic Toxicology 92:131–139
Wernersson AS. 2012. Swedish monitoring of hazardous substances in the aquatic environment
‐ current vs required monitoring and potential developments. Rapport 2012:23. Länsstyrelsen
i Västra Götalands län, vattenvårdsenheten. ISSN: 1403‐168X
Willett K, Wassenberg D, Lienesch L, Reichert W, Di Giulio, R. 2001. In vivo and in vitro
inhibition of CYP1A-dependent activity in Fundulus heteroclitus by the polynuclear aromatic
hydrocarbon fluoranthene. Toxicology and Applied Pharmacology 177: 264–271
Winston G, di Giulio R. 1991. Prooxidant and antioxidant mechanisms in aquatic organisms.
Aquatic Toxicology 19:137–161
Whitfield J. 2001. Vital signs. Nature 411(6841):989-990.
Zapata-Pérez O, Gold-Bouchot G, Ortega A, López T, Albores A. 2002. Effect of pyrene on
hepatic cytochrome P450 1A (CYP1A) expression in Nile Tilapia (Oreochromis niloticus).
Archives of Environmental Contamination and Toxicology 42:477-485

Biomarkers for Environmental Monitoring | M-88 2013
46
Appendix A – List of biomarkers
Appendix A
List of biomarkers
Biomarker Biomarker Organism class References
Ache
Inhibition of cholinesterase activity
nmol.min-1 mg prot-1
freshwater, marine, terrestrial vertebrates (Flounder, Dab, Red mullet,
Eelpout) & invertebrates (Mytilus edulis,
Mytilus galloprovincialis, crustaceans)
ICES, 1999; Kirby et al., 2000; BEEP, 2001;
Trudeau & Sans Cartier, 2001; Spurgeon et al.,
2002
Alkylphenol bile metabolites freshwater, marine, terrestrial Vertebrates (fish), invertebrates Beyer, 2013
ALT, alanine transaminase alanine
aminotransferase (serum)
freshwater, marine bivalve, fish, verterbrate van der Oost, 2003; Cajaraville, 2000
Antioxidant enzymes e.g.
Superoxide dismutase (SOD),
catalase CAT, Glutathione
peroxidase (GPOX), Glutathione
reductase (GRED)
freshwater, marine, terrestrial vertebrates (fish), invertebrates & plants Siesko et al., 1997; ICES, 1999; BEEP, 2001;
Hartley-Whitaker & Meharg, 2001; Lindstrom-
Seppa et al., 2001; MacFarlane, 2002; Spurgeon
et al., 2002
Aromatase freshwater, marine fish Lavado, 2004
AST, Aspartate aminotransferase
(serum);
freshwater, marine, terrestrial vertebrate Pérez 2010; van der Oost, 2003
Blood glucose freshwater, marine fish Wernersson AS, 2012
Blood hemoglobin concentration terrester earthworm Lumbricus terrestris Calisi, 2013
Blubber thickness marine Baltic seals Wernersson AS, 2012
Brood size freshwater, marine, terrestrial raptors, viviparous fish Wernersson AS, 2012

Biomarkers for Environmental Monitoring | M-88 2013
47
Appendix A
List of biomarkers
Biomarker Biomarker Organism class References
CEA, Cellular energy allocation freshwater, marine, terrestrial invertebrates and small fish Beyer, 2013
CF, condition factor (wholebody
weight to length)
freshwater, marine fish Environment Canada, 2010
Changes in vitamin levels e.g.
Vitamin A (retinoids), Vitamin C
(ascorbic acid)
freshwater, marine, terrestrial vertebrates, invertebrates & plants Peakall, 1992; Fox, 1993; Lytle & Lytle, 1997;
Brown, 1999; Ryckman et al., 2001
Colonic ulcers marine Baltic seals Wernersson AS, 2012
Congenital malformations (birth
defects) in birds
terrester bird Fox, 1993
Delayed reproduction/gonadal
maturation in fish
freshwater, marine fish CSEMP, 2012
-aminolevulinic acid dehydratase
inhibition (ALAD)
freshwater, marine, terrestrial haemoglobin-carrying organisms, fish Peakall, 1992; Gompertz et al., 1996; ICES,
1999; Spurgeon et al., 2002
Developmental disorders of teeth,
third lower molar
terrester wild vole species bank vole
(Clethrionomys glareolus)
Murtomaa, 2007
DNA adduct
Increase in DNA Adduct formation
freshwater, marine, terrestrial vertebrates, invertebrates & plants
fish: Dab, Flounder, Long Rough Dab,
Halibut, Herring and sprat, Cod, Haddock
Peakall, 1992; Gompertz et al., 1996; ICES,
1999; Spurgeon et al., 2002; Hamers, 2002
DNA repair capacity freshwater, marine, terrestrial fish Kienzler 2013
DNA Strand Breakage (e.g. COMET
assay) and other chromosomal
aberrations
freshwater, marine, terrestrial vertebrates (fish), invertebrates (mussels)
& plants
Peakall, 1992; ICES, 1999; Mitchelmore &
Chipman, 1998; Spurgeon et al., 2002
Egg shell thickness terrester guillemot eggs, white tailed eagle Bignert, 1995
Egg size freshwater, marine fish Environment Canada, 2010,

Biomarkers for Environmental Monitoring | M-88 2013
48
Appendix A
List of biomarkers
Biomarker Biomarker Organism class References
Elevation of Serum Enzyme activity
(e.g. Sorbitol dehydrogenase,
glutamate dehydrogenase, glutamate
pyruvate transaminase, lactate
dehydrogenase)
freshwater, marine, terrestrial vertebrates & invertebrates Peakall, 1992, Peakall & McBee, 2001
Embryo aberrations in field collected
amphipod crustaceans
freshwater, marine amphipods crustaceans HaV, Wernersson, 2012
Hatching success and brood size for
birds
terrester bird Fox, 1993
Embryonal development in
Monoporeia affinis and Pontoporeia
femorata
Frequency of malformed embryos,
egg production and frequency of
dead broods/dead eggs.
marine benthic invertebrate Wernersson AS, 2012
External damage/visible diseases -
Fish disease Index
Ac, Acanthochondria cornuta
Ep, Epidermal hyperplasia/
papilloma
Fi, Acute/healing fin rot/erosion; Hp,
Hyperpigmentation;
Le, Lepeophtheirus sp.;
Ly, Lymphocystis;
St, Stephanostomum baccatum;
Ul, Acute/healing skin ulcerations;
Xc, X-cell gill disease
freshwater, marine dab ICES, 2011
fin erosion freshwater, marine fish ICES, 2011
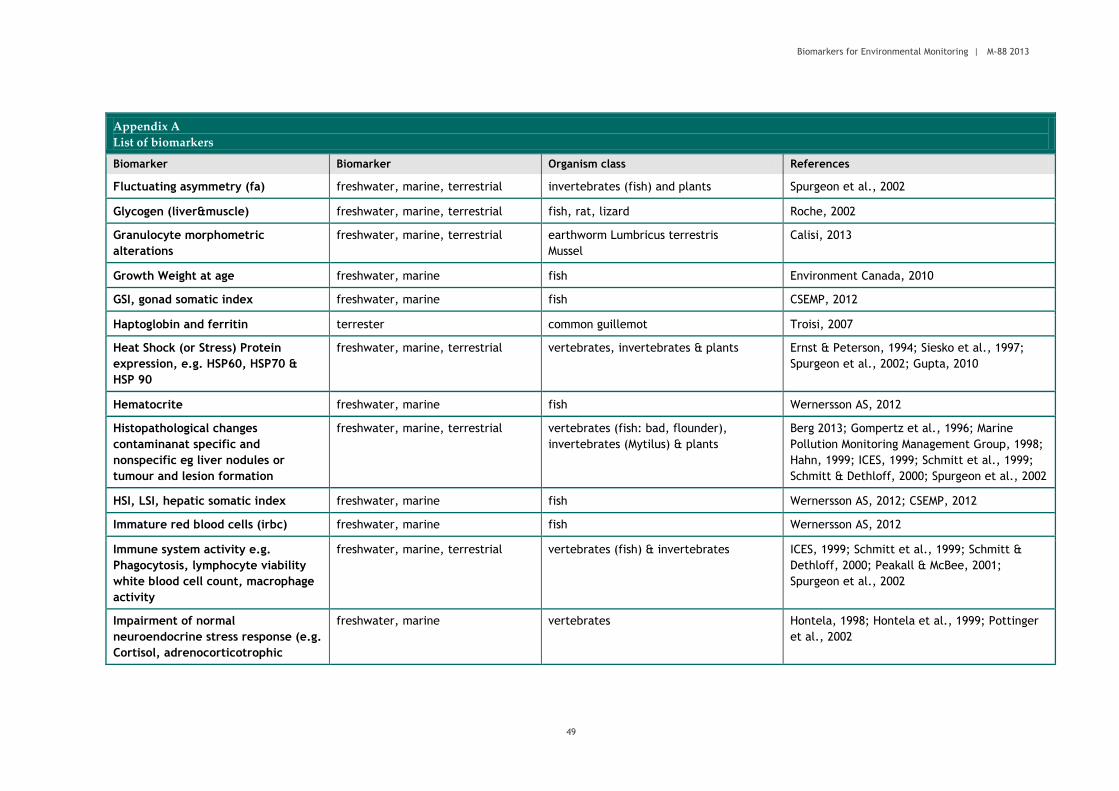
Biomarkers for Environmental Monitoring | M-88 2013
49
Appendix A
List of biomarkers
Biomarker Biomarker Organism class References
Fluctuating asymmetry (fa) freshwater, marine, terrestrial invertebrates (fish) and plants Spurgeon et al., 2002
Glycogen (liver&muscle) freshwater, marine, terrestrial fish, rat, lizard Roche, 2002
Granulocyte morphometric
alterations
freshwater, marine, terrestrial earthworm Lumbricus terrestris
Mussel
Calisi, 2013
Growth Weight at age freshwater, marine fish Environment Canada, 2010
GSI, gonad somatic index freshwater, marine fish CSEMP, 2012
Haptoglobin and ferritin terrester common guillemot Troisi, 2007
Heat Shock (or Stress) Protein
expression, e.g. HSP60, HSP70 &
HSP 90
freshwater, marine, terrestrial vertebrates, invertebrates & plants Ernst & Peterson, 1994; Siesko et al., 1997;
Spurgeon et al., 2002; Gupta, 2010
Hematocrite freshwater, marine fish Wernersson AS, 2012
Histopathological changes
contaminanat specific and
nonspecific eg liver nodules or
tumour and lesion formation
freshwater, marine, terrestrial vertebrates (fish: bad, flounder),
invertebrates (Mytilus) & plants
Berg 2013; Gompertz et al., 1996; Marine
Pollution Monitoring Management Group, 1998;
Hahn, 1999; ICES, 1999; Schmitt et al., 1999;
Schmitt & Dethloff, 2000; Spurgeon et al., 2002
HSI, LSI, hepatic somatic index freshwater, marine fish Wernersson AS, 2012; CSEMP, 2012
Immature red blood cells (irbc) freshwater, marine fish Wernersson AS, 2012
Immune system activity e.g.
Phagocytosis, lymphocyte viability
white blood cell count, macrophage
activity
freshwater, marine, terrestrial vertebrates (fish) & invertebrates ICES, 1999; Schmitt et al., 1999; Schmitt &
Dethloff, 2000; Peakall & McBee, 2001;
Spurgeon et al., 2002
Impairment of normal
neuroendocrine stress response (e.g.
Cortisol, adrenocorticotrophic
freshwater, marine vertebrates Hontela, 1998; Hontela et al., 1999; Pottinger
et al., 2002

Biomarkers for Environmental Monitoring | M-88 2013
50
Appendix A
List of biomarkers
Biomarker Biomarker Organism class References
hormone (ACTH)
Impairment of Reproductive steroids
(e.g. Luteinizing hormone (LH),
follicle stimulating hormone (FSH),
11-ketotestosterone and
progesterone)
freshwater, marine, terrestrial vertebrates Peakall, 1992; Schmitt et al., 1999; Schmitt &
Dethloff, 2000
Imposex development in gastropods
Indices:
VDSI (Vas Deferens Sequence Index)
Changes in gonad
RPLI (based on penis lengths of
females and males respectively)
freshwater, marine invertebrates
netted dogwhelk (Hinia nitida) (Nucella
lapillus), Nassarius reticulata, Buccinum
undatum and Neptunea antiqua
Marine Pollution Monitoring Management
Group, 1998; ICES, 1999; Osborn et al., 2000;
Strand & Jacobsen, 2002
Increase in CYP1A. Ethoxyresorufin-
O-deethylase (EROD) activity
freshwater, marine, terrestrial vertebrates & invertebrates
Dab, Flounder, Plaice, Cod, Plaice, Four
spotted megrim, Dragonet, Red mullet,
Eelpout, Clethrionomys rufocanus
Fossi et al., 1992; Gompertz et al., 1996;
Marine Pollution Monitoring Management
Group, 1998; Marsili et al., 1998; Elliott et al.,
1999; Hahn, 1999; ICES, 1999; Jeffery et al.,
1999; BEEP, 2001; Rattner & Melancon, 2001;
Ryckman et al., 2001; Schmitt et al., 1999;
Schmitt & Dethloff, 2000; Spurgeon et al.,
2002; Fossi et al., 2003
Increase in Glutathione S-transferase
(GST) activity
freshwater, marine, terrestrial vertebrates (fish), invertebrates & plants ICES, 1999; Lindstrom-Seppa et al., 2001;
Spurgeon et al., 2002
Increase in Kidney Epithelial Cell
Height (KEH)
freshwater, marine stickleback (Gasterosteus aculeatus L.) Allen et al., 2002
Increase in Porphyrins freshwater, marine, terrestrial vertebrates, invertebrates & plants Peakall, 1992, Fox, 1993 & Peakall & McBee,
2001
Induction/inhibition of freshwater, marine Mytilys edulis, fish, molluscs Brooks, 2009

Biomarkers for Environmental Monitoring | M-88 2013
51
Appendix A
List of biomarkers
Biomarker Biomarker Organism class References
multidrug/multixenobiotic resistance
(MDR/MXR)
Inhibition of Calcium atpase activity freshwater, marine, terrestrial vertebrates & invertebrates Gastaldi et al., 2002; Viarengo et al., 2002 a&b
Intersex development in fish
% prevalence
freshwater, marine vertebrates
Dab, Flounder, Cod, Red mullet, Eelpout
Marine Pollution Monitoring Management
Group, 1998; ICES, 1999; Schmitt et al., 1999;
Osborn et al., 2000; Strand & Jacobsen, 2002
Intersex development in gastropod marine Littorina littorea Bryan, 1986; ICES Advice 2011
Ions (Na, K and Ca) in blood plasma freshwater, marine fish Wernersson AS, 2012
Kidney alterations (glomeruli
changes, tubular cell proliferations)
marine Seal Wernersson AS, 2012
Lactate in blood plasma freshwater, marine, terrestrial fish Wernersson AS, 2012
Lipid weight of soft tissues
muscle lipid content
storage disorders (lipid
accumulation, NL)
marine Blue mussels Marigomez, 2013
Liver lipid content freshwater, marine fish Berg 2013
LMS Lysosomal membrane stability
minutes
Cytochemical; liver all species
Neutral Red Retention: all species
freshwater, marine, terrestrial vertebrates( fish), invertebrates (Mytilus,
oyster) & plants
ICES, 1999; BEEP, 2001; Capri et al., 2002;
Spurgeon et al., 2002; Viarengo et al., 2002a
LPF Accumulation of lipofuscins marine mussels Marigomez, 2013
Macroscopic liver neoplasms freshwater, marine fish: dab,flounder Koehler 2007
Metabolic profiling using high
resolution nuclear magnetic
freshwater, marine, terrestrial vertebrates & invertebrates Griffin et al., 2000a, b & c; Griffin et al., 2001
a & b; Spurgeon et al., 2002
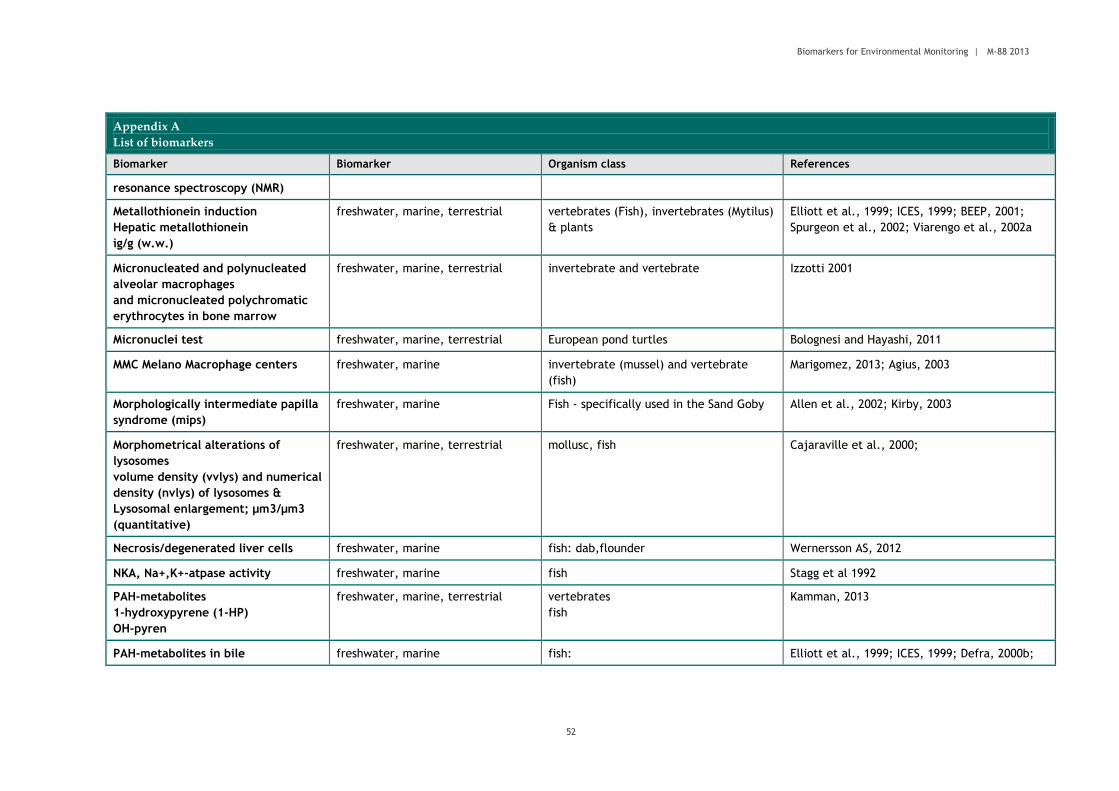
Biomarkers for Environmental Monitoring | M-88 2013
52
Appendix A
List of biomarkers
Biomarker Biomarker Organism class References
resonance spectroscopy (NMR)
Metallothionein induction
Hepatic metallothionein
ìg/g (w.w.)
freshwater, marine, terrestrial vertebrates (Fish), invertebrates (Mytilus)
& plants
Elliott et al., 1999; ICES, 1999; BEEP, 2001;
Spurgeon et al., 2002; Viarengo et al., 2002a
Micronucleated and polynucleated
alveolar macrophages
and micronucleated polychromatic
erythrocytes in bone marrow
freshwater, marine, terrestrial invertebrate and vertebrate Izzotti 2001
Micronuclei test freshwater, marine, terrestrial European pond turtles Bolognesi and Hayashi, 2011
MMC Melano Macrophage centers freshwater, marine invertebrate (mussel) and vertebrate
(fish)
Marigomez, 2013; Agius, 2003
Morphologically intermediate papilla
syndrome (mips)
freshwater, marine Fish - specifically used in the Sand Goby Allen et al., 2002; Kirby, 2003
Morphometrical alterations of
lysosomes
volume density (vvlys) and numerical
density (nvlys) of lysosomes &
Lysosomal enlargement; µm3/µm3
(quantitative)
freshwater, marine, terrestrial mollusc, fish Cajaraville et al., 2000;
Necrosis/degenerated liver cells freshwater, marine fish: dab,flounder Wernersson AS, 2012
NKA, Na+,K+-atpase activity freshwater, marine fish Stagg et al 1992
PAH-metabolites
1-hydroxypyrene (1-HP)
OH-pyren
freshwater, marine, terrestrial vertebrates
fish
Kamman, 2013
PAH-metabolites in bile freshwater, marine fish: Elliott et al., 1999; ICES, 1999; Defra, 2000b;

Biomarkers for Environmental Monitoring | M-88 2013
53
Appendix A
List of biomarkers
Biomarker Biomarker Organism class References
Dab, Cod, Flounder, Haddock, Eelpout ,
Herring
BEEP, 2001
Peroxisomal acyl-coa oxidase (AOX)
activity and peroxisomal volume
freshwater, marine, terrestrial fish, invertebrates Cajaraville, 2000; Marigomez 2013
Phytochelatin concentration,
changes
freshwater, marine, terrestrial plants Ernst & Peterson, 1994; Hartley-Whitaker &
Meharg, 2001
Pre/neoplastic lesions by NADPH
producing enzymes
freshwater, marine fish Fricke et al.;2012
Proteomics
Changes in protein expression
freshwater, marine, terrestrial vertebrates, invertebrates & plants Spurgeon et al., 2002
Reproductive success in Eelpout,
Zoarces viviparous
Malformed fry
Late dead fry
Early dead fry
Total abnormal fry
freshwater, marine Eelpout Wernersson AS, 2012
Sex ratio freshwater, marine gastropod, viviparous fish Wernersson AS, 2012; CSEMP, 2012
SFG Scope for Growth
Joules/hr/g dry wt.
freshwater, marine invertebrates
bivalve mollusc
ICES, 1999; Defra, 2000a
Shell height freshwater, marine gastropod CSEMP, 2012
Skeletal deformities freshwater, marine fish Sassi, 2010
Spiggin in three spined stickleback freshwater, marine female three-spined stickleback
(Gasterosteus aculeatus L.)
Allen et al., 2002; Katsiadaki et al., 2002;
Thomas et al., 2002 ; Hogan , 2012
Structural changes of the digestive
tubule epithelium MLR/MET:ratio of
freshwater, marine mussels, molluscs Marigomez, 2013

Biomarkers for Environmental Monitoring | M-88 2013
54
Appendix A
List of biomarkers
Biomarker Biomarker Organism class References
mean lumen radius to mean
epithelial thickness Digestive tubule
epithelial atrophy and thinning;
µm/µm
(quantitative)
MLR Mean luminal radius
ratio of mean epithelial thickness to
mean diverticula radius (MET/MDR)
Total antioxidant scavenging
capacity (TOSC)
freshwater, marine, terrestrial invertebrate and vertebrate Regoli et al, 2002; Regoli, 2000
Total number of eggs per female terrester, aquatic raptors, fish Environment Canada, 2010,
Transcriptomics - oligonucleotide
and cdna microarrays
freshwater, marine, terrestrial invertebrate and vertebrate ICES, 2002; Spurgeon et al., 2002; Viarengo et
al., 2002b
White blood cell ratios
(lymphocytes, granulocytes,
trombocytes)
freshwater, marine fish Wernersson AS, 2012
Vitellogenin (VTG) protein induction
in fish
freshwater, marine fish and crustaceans (assays are being
developed for birds)
Gompertz et al., 1996; ICES, 1999; Schmitt et
al., 1999; Schmitt & Dethloff, 2000; Defra,
2000b; Pottinger et al., 2002; Palace 2009
VTG mrna expression in male fish freshwater, marine fish - including sand goby, viviparous
blenny, sheepshead minnow & rainbow
trout (assays are being developed for
birds)
Allen et al., 2002
Vvbas: Volume density of basophilic
cells- increase due to exposure
Cell type composition of digestive
gland epithelium; µm3/µm3
freshwater, marine mussel Cajaraville, 1990

Biomarkers for Environmental Monitoring | M-88 2013
55
Appendix A
List of biomarkers
Biomarker Biomarker Organism class References
(quantitative)
Zona Radiata protein (protein and
mrna)
freshwater, marine fish Arukwe, 1997; Allen et al., 2002
References – Appendix A
Agius C and Roberts R J. 2003. Melano-macrophage centres and their role in fish pathology. Journal of Fish Diseases, 26:499–509
Allen Y., and others. 2002. Endocrine Disruption in the Marine Environment (EDMAR). DEFRA.
Arukwe A, Knudsen F, Goksøyr A. 1997. Fish Zona Radiata (Eggshell) Protein: A Sensitive Biomarker for Environmental Estrogens. Environmental Health
Perspectives 105:418-422
BEEP. 2001. Biological Effects of Environmental Pollution in Marine Coastal Ecosystems. Available from: http://beep.iptc.u-bordeaux.fr/
Berg V, Zerihun M, Jørgensen A, Lie E, Dale O, Utne Skaare J,. Lyche J. 2013.High prevalence of infections and pathological changes in burbot (Lota
lota) from a polluted lake (Lake Mjøsa, Norway). Chemosphere 90: 1711–1718
Beyer J, Sundt R, Sanni S, Sydnes M & Jonsson G. 2011. Alkylphenol Metabolites in Fish Bile As Biomarkers of Exposure to Offshore Oil Industry Produced
Water in Feral Fish, Journal of Toxicology and Environmental Health, Part A: Current Issues, 74:7-9, 569-581
Beyer J, Aarab N, Tandberg AH, Ingvarsdottir A, Bamber S, Børseth JF, Camus L, Velvin R. Environmental harm assessment of a wastewater discharge
from Hammerfest LNG: A study with biomarkers in mussels (Mytilus sp.) and Atlantic cod (Gadus morhua ). Mariner Pollution Bullentin. 69:28-37
Bignert A, Litzén K., Odsjö T., Olsson M., Persson W & Reutergårdh L. 1995. Time-Related Factors Influence the Concentrations of sDDT, PCBs and Shell
Parameters in Eggs of Baltic Guillemot (Uria aalge), 1861-1989. Environmental Pollution 89: 27-36

Biomarkers for Environmental Monitoring | M-88 2013
56
Bolognesi C and Hayashi M. 2011. Micronucleus assay in aquatic animals, REVIEW. Mutagenesis 26(1):205–213
Brown, S. 1999. Trace nutrients and critical life-stage transitions in the eproductive effects of contaminants in Great Lakes Salmonids. Wildlife
Toxicology program Science Meeting '99. Canada: Ottawa, Ontario.
Brooks S, Lyons B, Goodsir F, Bignell J & Thain J. 2009. Biomarker Responses in Mussels, an Integrated Approach to Biological Effects Measurements,
Journal of Toxicology and Environmental Health, Part A:Current Issues, 72(3-4): 196-208
Bryan G. W., Gibbs P. E.,. Hummerstone L. G and. Burt G. R. 1986. The Decline of the gastropod nucella lapillus around south-West england: Evidence
for the effect of tributyltin from antifouling paints. J. mar. biol. Ass. U.K. 66: 611-640
Cajaravillea M, Bebiannob M, Blascoc J, Ported C, Sarasquetec C, Viarengo A. 2000. The use of biomarkers to assess the impact of pollution in coastal
environments of the Iberian Peninsula: a practical approach. The Science of the Total Environment 247: 295-311
Calisi A., Zaccarelli N.,. Lionetto M.G , Schettino T. 2013. Integrated biomarker analysis in the earthworm Lumbricus terrestris : Application to the
monitoring of soil heavy metal pollution. Chemosphere 90:2637–2644
Capri, F. and others. 2002. ERA in freshwater ecosystems. Ecological Risk Assessment of Contaminated Sites: A European approach. 4-11 December
2002, University of Eastern Piemonte, Alessandria (Northern Italy).
CSEMP (Clean Seas Environment Monitoring Programme). 2012. GREEN BOOK July 2012
DEFRA. 2000a. Measurement of stress effects (Scope for Growth) and contaminant levels in mussels collected from the Irish Sea. Executive Summary.
Available from: http://www.defra.gov.uk/environment/marine/mlis/summaries/10.htm
DEFRA. 2000b. The effects of Polyaromatic Hydrocarbons on marine ecosystems. Executive Summary. Available from:
http://www.defra.gov.uk/environment/marine/mlis/summaries/20.htm
Elliott, J.L., and others. 1999. Contaminants in surf scoters wintering in the Strait of Georgia. Wildlife Toxicology Program Science Meeting 1999.
Canada: Ottawa, Ontario.
Environment Canada. 2010. 2010 Pulp and Paper Environmental Effects Monitoring (EEM) Technical Guidance Document.
Ernst, W.H.O., & Peterson, P.J. 1994. The role of biomarkers in environmental assessment (4). Terrestrial plants. Ecotoxicology, 3, 180-192.
Biomarkers for Environmental Monitoring | M-88 2013
57
Fossi, M.C.L., and others. 1992. The use of non-destructive biomarker in Mediterranean cetaceans: preliminary data on MFO activity in skin biopsy.
Marine Pollution Bulletin, 24(9), 459-461.
Fossi, M.C.L., and others. 2003. The use of a non-lethal tool for evaluating toxicological hazard of organochlorine contaminants in Mediterranean
cetaceans: new data 10 years after the first paper published in MPB. Marine Pollution Bulletin, 46, 972-982.
Fox, G.A. 1993. What Have biomarkers told us about the effects of contaminants on the health of fish-eating birds in the Great Lakes? The Theory and a
Literature Review. Journal of Great Lakes Research, 19(4), 722-736.
Fricke N, Stentiford G, Feist S, Lang T. 2012. Liver histopathology in Baltic eelpout (Zoarces viviparus) A baseline study for use in marine environmental
monitoring. Marine Environmental Research 82: 1-14
Gastaldi, L.E., and others. 2002. Use of bioindicators/biomarkers and bioassays in soil ERA. Ecological risk assessment of contaminated sites: A European
Approach. 4th-11th December 2002, University of Eastern Piemonte, Alessandria (Northern Italy).
Gompertz, D.D., and others. 1996. IEH report on the use of biomarkers in environmental exposure assessment. Leicester: Institute for Environment and
Health.
Griffin, J.L., and others. 2000a. The biochemical profile of rat testicular tissue as measured by magic angle spinning 1H NMR spectroscopy. FEBS
Letters, 486, 225-229.
Griffin, J.L., and others. 2000b. NMR spectroscopy based metabonomic studies on the comparative biochemistry of the kidney and urine of the bank
vole (Clethrionomys glareolus), wood mouse (Apodemus sylvaticus), white toothed shrew (Crocidura suaveolens) and the laboratory rat. Comparative
Biochemistry and Physiology Part B, 127, 357-367.
Griffin, J.L., and others. 2000c. The initial pathogenesis of cadmium induced renal toxicity. FEBS Letters, 478, 147-150.
Griffin, J.L., and others. 2001a. High-resolution magic angle spinning 1H-NMR spectroscopy studies on the renal biochemistry in the bank vole
(Clethrionomys glareolus) and the effects of arsenic (As3+) toxicity. Xenobiotica, 31(6), 377-385.
Griffin, J. L., and others. 2001b. Metabolic profiling of chronic cadmium exposure in the rat. Chemical Research in Toxicology, 14, 1428-1434.
Gupta S, Sharma A, Mishra M, Mishra R, Chowdhuri D.2010. Heat shock proteins in toxicology: How close and how far? Life Sciences 86 (2010) 377–384

Biomarkers for Environmental Monitoring | M-88 2013
58
Hahn, M.E. 1999. Northeast Sea Grant - Archives using biomarkers to detect contamination of the marine environment. Available from:
http://web.mit.edu/seagrant/northeast/text/archives/tech/4whoibiomarker.html
Hartley-Whitaker, J. & Meharg, A.A. 2001. Plant biomarkers to study the limitations of plant colonisation of contaminated sites. Centre for Ecology and
Hydrology.
Hontela, A. 1998. Interrenal dysfunction in fish from contaminated sites: in vivo and in vitro assessment. Environmental Toxicology and Chemistry,
17(1), 44-48.
Hontela, A., and others. 1999. Biochemical and physiological markers of toxic stress in amphibians. Wildlife Toxicology Program Science Meeting '99.
Canada: Ottawa, Ontario.
ICES. 1999. ACME Report 1999. Available from: http://www.ices.dk/committee/acme/1999/99report/toc99.htm
ICES. 2002. Report of the Advisory Committee on the Marine Environment, 2002. Copenhagen: International Council for the Exploration of the Sea.
ICES. 2011. Report of the ICES Advisory Committee, 2011. ICES Advice, 2011. Books 1 - 11
Izzotti A, Balansky R, D'Agostini F. 2001. Modulation of Biomarkers by Chemopreventive Agents in Smoke-exposed Rats. Cancer Res 61:2472-2479
Jeffery, R.W., Kennedy, S.W. & Fox, G.A. 1999. Cytochrome P4501A Induction in Avian Hepatocyte cultures by PAHs: Might Greater Scup be at Risk from
Embryotoxic Effects of PAHs? Wildlife Toxicology Program Science Meeting '99. Canada: Ottawa, Ontario.
Kammann et al. 2013. Interlaboratory Proficiency Testing for Measurement of the Polycyclic Aromatic Hydrocarbon Metabolite 1-Hydroxypyrene in Fish
Bile for Marine Environmental Monitoring Journal of aoaC InternatIonal Vol. 96, no. 3, 2013
Katsiadaki, I., and others. 2002. Detection of environmental androgens: A novel method based on enzyme-linked immunosorbent assay of spiggin, the
stickleback (Gasterosteus aculeatus) glue protein. Environmental Toxicology and Chemistry, 21, 1946-1954.
Kienzler A, Bony S, Devaux A. 2013. DNA repair activity in fish and interest in ecotoxicology: A review. Aquatic Toxicology 134– 135: 47-56
Kirby, M.F., and others. 2000. The Use of Cholinesterase Activity in Flounder (Platychthys flesus) Muscle Tissue as a Biomarker of Neurotoxic
Contamination in UK Estuaries. Marine Pollution Bulletin, 40(9), 780-791.

Biomarkers for Environmental Monitoring | M-88 2013
59
Kirby, M.F., and others. 2003. The presence of morphologically intermediate papilla syndrome in the United Kingdom populations of sand goby
(Pomatoschistus spp.): Endocrine Disruption? Environmental Toxicology and Chemistry, 22(2), 239-251.
Köhler A, Ellesat K. 2007. Nuclear changes in blood, early liver anomalies and hepatocellular cancers in flounder (Platichthys flesus L.) as prognostic
indicator for a higher cancer risk? Marine Environmental Research 66: 149–150
Lavado R, Thibaut R, Raldu´a D, Martı´n R, and Porte C. 2004. First evidence of endocrine disruption in feral carp from the Ebro River. Toxicology and
Applied Pharmacology 196:247–257
Lindstrom-Seppa, P.K., and others. 2001. Biochemical responses in aquatic plants as markers of environmental contamination. Alternatives to
Laboratory Animals, 29, 277-282.
Lytle, T.F., & LYTLE, J.S. 1997. Acsorbate: A biomarker of herbicide stress in wetland plants. Phytoremediation of Soil and Water Contaminants ACS
Aymposium Series, 664, 106113.
Macfarlane, G.R. 2002. Leaf biochemical parameters in Avicennia marine (Forsk.) Vierh as potential biomarkers of heavy metal stress in estuarine
ecosystems. Marine Pollution Bulletin, 44(3), 244-256.
Marigomez I, Garmendia L, Soto M, Orbea A, Izagirre U, Cajaraville M. 2013. Marine ecosystem health status assessment through integrative biomarker
indices: a comparative study after the Prestige oil spill ‘‘Mussel Watch’’. Ecotoxicology 22:486–505
Marine Pollution Monitoring Management Group. 1998. National Monitoring Programme. Survey of the quality of UK coastal waters. Aberdeen.
Marsili, L., and others. 1998. Relationship between organochlorine contaminants and mixed function oxidase activity in skin biopsy specimens of
Mediterranean fin whales (Balaenoptera physalus). Chemosphere, 37(8), 1501-1510.
Mitchelmore, C.L., &. Chipman, J.K. 1998. DNA strand breakage in aquatic organisms and the potential value of the comet assay in environmental
monitoring. Mutation Research, 399, 135-147.
Murtomaa M, Tervaniemi OM, Parviainen J, Ruokojärvi P, Tuukkanen J, Viluksela M. 2007. Dioxin exposure in contaminated sawmill area: The use of
molar teeth and bone of bank vole (Clethrionomys glareolus) and field vole (Microtus agrestis) as biomarkers. Chemosphere 68: 951–957
Osborn, D., and others. 2000. Potential Uses of biomonitoring in pollution control – An Introductory Guide. Environment Agency.
Peakall, D.B. 1992. Animal biomarkers as pollution indicators. London: Chapman & Hall.
Biomarkers for Environmental Monitoring | M-88 2013
60
Peakall, D.B., & Mcbee, K. 2001. Biomarkers for contaminants exposure and effects in mammals. In: SHORE, R.F. &. RATTNER, B.A. Ecotoxicology of
Wild Mammals. Chichester: John Wiley & Sons Ltd., 551-576.
Pe´rez C, Munilla I, Lo´pez-Alonso M and Velando A. 2010. Sublethal effects on seabirds after the Prestige oil-spill are mirrored in sexual signals. Biol.
Lett. 6: 33–35
Pottinger, T.G., Carrick, T.R., & Yeomans, W.E. 2002. The three-spined stickleback as an environmental sentinel: effects of stressors on whole-body
physiological indices. Journal of Fish Biology, 61, 207-229.
Rattner, B.A., & Melancon, M. 2001. Effects of PCBs on reproduction and biomarker responses in Tree Swallows at contaminated sites in the Eastern
Region. Available from: http://www.ecrc.usgs.gov/endocrine/04rattner.htm
Regoli F. 2000. Total oxyradical scavenging capacity (TOSC) in polluted and translocated mussels: a predictive biomarker of oxidative stress. Aquatic
Toxicology 50: 351–361
Regoli F, Gorbi S, Frenzilli G, Nigro M, Corsi I, Focardic S, Winston G.W. 2002. Oxidative stress in ecotoxicology: from the analysis of individual
antioxidants to a more integrated approach. Marine Environmental Research 54: 419–423
Roche H, Buet A, Ramade F. 2002. Relationships between persistent organic chemicals residues and biochemical constituents in fish from a protected
area: the French National Nature Reserve of Camargue. Comparative Biochemistry and Physiology Part C 133: 393–410
Ryckman, D.P., Weseloh D. V.C., & Bishop, C.A. 2001. Contaminants in herring gull eggs from the Great Lakes: 25 Years of Monitoring Levels and
Effects. Available from: http://www.on.ec.gc.ca/wildlife/factsheets/fs_herring_gulls-e.html
Sassi A,. Annabi A, Kessabi K., Kerkeni A.,. Said K, Messaoudi I. 2010. Influence of high temperature on cadmium-induced skeletal deformities in juvenile mosquitofish (Gambusia affinis). Fish Physiol Biochem, 36 (3): 403–409
Schmitt, C.T. and others. 1999. Biomonitoring of environmental status and trends (BEST) program: Contaminants and related effects in fish from the
Mississippi, Columbia, and Rio Grande Basins. US Geological Survey Toxic Substances Hydrology Program. Proceedings of the Technical Meeting,
Charleston, South Carolina.
Schmitt, C.T., & Dethloff, G.M. 2000. Biomonitoring of environmental status and trends (BEST) program: selected methods for monitoring chemical
contaminants and their effects in aquatic ecosystems. US Geological Survey, Biological Resources Division, Columbia (MO).
Siesko, M.M., Fleming, W.J., & Grossfeld, R.M. 1997. Stress protein synthesis and peroxidase activity in a submersed aquatic macrophyte exposed to
cadmium. Environmental Toxicology and Chemistry , 16(8), 1755-1760.

Biomarkers for Environmental Monitoring | M-88 2013
61
Spurgeon, D. and others. 2002. Review of sublethal ecotoxicological tests for measuring harm in terrestrial ecosystems. Environment Agency.
Stagg R, Rusin J & BrownF. 1992. Na+,K+-ATPase Activity in the Gills of the Flounder (Platichthys flesus) in Relation to Mercury Contamination in the
Firth of Forth. Marine Environmental Research 33:255-266
Strand, J., & Jacobsen, J.A. 2002. Imposex in two sublittoral neogastropods from the Kattegat and Skagerrak: the common whelk Buccinum undatum
and the red whelk Neptunea antiqua. Marine Ecology Progress Series, 244, 171-177.
Thomas, K.V., & others. 2002. An assessment of in vitro androgenic activity and the identification of environmental androgens in United Kingdom
estuaries. Environmental Toxicology and Chemistry, 21, 1456-1461.
Troisi G, Borjesson L, Bexton S, Robinson I. 2007. Biomarkers of polycyclic aromatic hydrocarbon (PAH)-associated hemolytic anemia in oiled wildlife.
Environmental Research 105: 324-329
Trudeau, S., & Sans Cartier, G. 2001. Biochemical methods to determine Cholinesterase activity in wildlife exposed to pesticides. Available from
http://www.cws-scf.ec.gc.ca/publications/tech/tech338/index_e.cfm
van der Oost, R., Beyer, J., and Vermeulen, N. P. E. 2003. Fish bioaccumulation and biomarkers in environmental risk assessment: A review. Environ.
Toxicol. Pharmacol.13:57–149.
Viarengo, A. 2002a. Use of Chamelea gallina as sentinel organism of marine superficial sediments. Ecological risk assessment of contaminated sites: A
European approach. 4th11th December 2002, University of Eastern Piemonte, Alessandria (Northern Italy).
Viarengo, A., & others. 2002b. Monitoring program to assess the residual biological effects of the pollution due to Haven oilship sinking. Ecological risk
assessment of contaminated sites: A European approach. 4th-11th December 2002, University of Eastern Piemonte, Alessandria (Northern Italy).
Wernersson AS. 2012. Swedish monitoring of hazardous substances in the aquatic environment - current vs required monitoring and potential
developments. Rapport 2012:23. Länsstyrelsen i Västra Götalands län, vattenvårdsenheten. ISSN: 1403- 168X
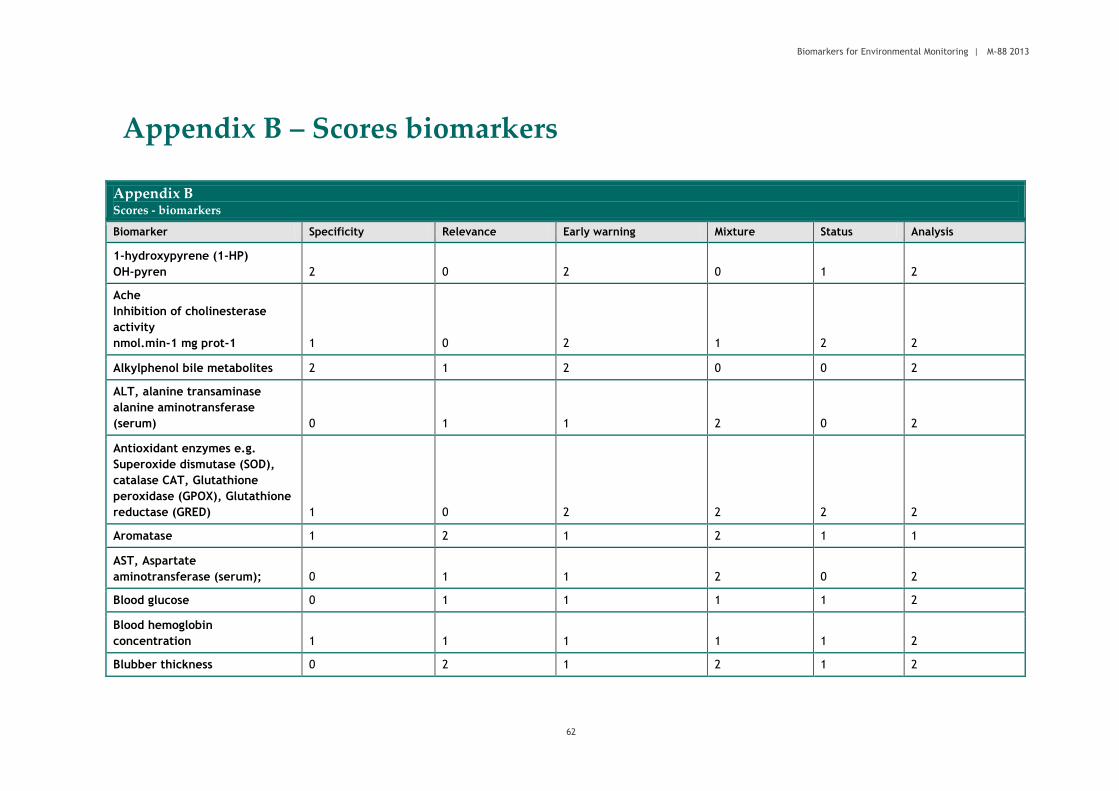
Biomarkers for Environmental Monitoring | M-88 2013
62
Appendix B – Scores biomarkers
Appendix B Scores - biomarkers
Biomarker Specificity Relevance Early warning Mixture Status Analysis
1-hydroxypyrene (1-HP)
OH-pyren 2 0 2 0 1 2
Ache
Inhibition of cholinesterase
activity
nmol.min-1 mg prot-1 1 0 2 1 2 2
Alkylphenol bile metabolites 2 1 2 0 0 2
ALT, alanine transaminase
alanine aminotransferase
(serum) 0 1 1 2 0 2
Antioxidant enzymes e.g.
Superoxide dismutase (SOD),
catalase CAT, Glutathione
peroxidase (GPOX), Glutathione
reductase (GRED) 1 0 2 2 2 2
Aromatase 1 2 1 2 1 1
AST, Aspartate
aminotransferase (serum); 0 1 1 2 0 2
Blood glucose 0 1 1 1 1 2
Blood hemoglobin
concentration 1 1 1 1 1 2
Blubber thickness 0 2 1 2 1 2

Biomarkers for Environmental Monitoring | M-88 2013
63
Appendix B Scores - biomarkers
Biomarker Specificity Relevance Early warning Mixture Status Analysis
Brood size viviparous fish 0 2 0 2 1 2
CEA, Cellular energy allocation 1 1 1 2 0 1
CF, condition factor (whole
body weight to length) 0 2 0 2 1 2
Changes in Immune system
activity e.g. Phagocytosis,
lymphocyte viability white
blood cell count, macrophage
activity 0 1 1 2 1 2
Changes in Phytochelatin
concentration 1 0 1 1 0 2
Changes in vitamin levels e.g.
Vitamin A (retinoids), Vitamin C
(ascorbic acid) 0 2 1 2 1 1
Colonic ulcers 1 1 1 1 1 1
Congenital malformations (birth
defects) in birds 1 2 1 2 1 1
Delayed reproduction/gonadal
maturation in fish 0 2 0 2 1 2
-aminolevulinic acid
dehydratase inhibition (ALAD) 1 0 2 0 1 2
DNA repair capacity 1 1 1 2 0 1
Egg shell thickness 2 2 1 0 1 2
Egg size 0 2 1 2 1 1

Biomarkers for Environmental Monitoring | M-88 2013
64
Appendix B Scores - biomarkers
Biomarker Specificity Relevance Early warning Mixture Status Analysis
Elevation of Serum Enzyme
activity (e.g. Sorbitol
dehydrogenase, glutamate
dehydrogenase, glutamate
pyruvate transaminase, lactate
dehydrogenase) 0 0 1 2 1 2
Embryo aberrations in field
collected amphipod crustaceans 0 2 1 2 0 2
Embryonal development in
Monoporeia affinis and
Pontoporeia femorata
Frequency of malformed
embryos, egg production and
frequency of dead broods/dead
eggs. 0 2 0 2 1 1
External damage/visible
diseases - Fish disease Index
Ac, Acanthochondria cornuta
Ep, Epidermal hyperplasia/
papilloma
Fi, Acute/healing fin
rot/erosion; Hp,
Hyperpigmentation;
Le, Lepeophtheirus sp.;
Ly, Lymphocystis;
St, Stephanostomum baccatum;
Ul, Acute/healing skin
ulcerations;
Xc, X-cell gill disease 0 1 1 2 2 1

Biomarkers for Environmental Monitoring | M-88 2013
65
Appendix B Scores - biomarkers
Biomarker Specificity Relevance Early warning Mixture Status Analysis
fin erosion 1 1 1 1 2 2
Fluctuating asymmetry (fa) 0 1 1 2 0 0
Glycogen (liver&muscle) 1 1 1 2 1 1
Granulocyte morphometric
alterations 1 1 1 2 0 1
Growth Weight at age 0 2 0 2 1 2
GSI, gonad somatic index 0 2 0 2 1 2
Hatching success and brood size
for birds 1 2 0 2 1 2
Heat Shock (or Stress) Protein
expression, e.g. HSP60, HSP70
& HSP 90 0 0 2 2 0 2
Hematocrite 1 1 1 1 1 2
Histopathological changes
contaminant specific and
nonspecific
eg liver nodules or tumour and
lesion formation 1 1 1 2 2 1
Immature red blood cells (irbc) 0 1 1 1 1 1
Impairment of normal
neuroendocrine stress response
(e.g. Cortisol,
adrenocorticotrophic hormone
(ACTH) 0 1 1 2 1 1

Biomarkers for Environmental Monitoring | M-88 2013
66
Appendix B Scores - biomarkers
Biomarker Specificity Relevance Early warning Mixture Status Analysis
Impairment of Reproductive
steroids (e.g. Luteinizing
hormone (LH), follicle
stimulating hormone (FSH), 11-
ketotestosterone and
progesterone) 0 2 1 2 1 1
Imposex development in
gastropods
Indices:
VDSI (Vas Deferens Sequence
Index) Changes in gonad
RPLI (based on penis lengths of
females and males respectively) 2 2 0 0 2 1
Increase in CYP1A.
Ethoxyresorufin-O-deethylase
(EROD) activity 2 0 2 1 2 2
Increase in DNA Adduct
formation
nm adducts mol DNA 1 1 1 1 2 1
Increase in DNA Strand
Breakage (e.g. COMET assay)
and other chromosomal
aberrations 0 1 1 1 1 2
Increase in Glutathione S-
transferase (GST) activity 1 0 1 1 1 2
Increase in Kidney Epithelial
Cell Height (KEH) 0 1 1 1 0 1
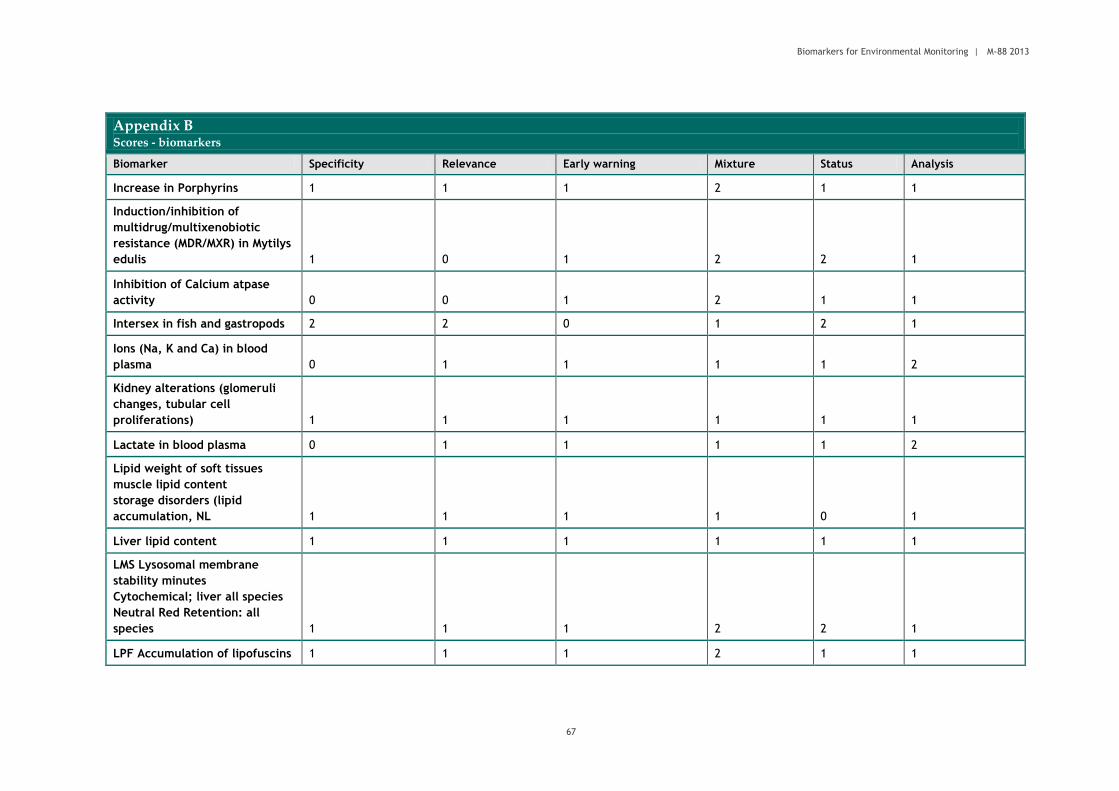
Biomarkers for Environmental Monitoring | M-88 2013
67
Appendix B Scores - biomarkers
Biomarker Specificity Relevance Early warning Mixture Status Analysis
Increase in Porphyrins 1 1 1 2 1 1
Induction/inhibition of
multidrug/multixenobiotic
resistance (MDR/MXR) in Mytilys
edulis 1 0 1 2 2 1
Inhibition of Calcium atpase
activity 0 0 1 2 1 1
Intersex in fish and gastropods 2 2 0 1 2 1
Ions (Na, K and Ca) in blood
plasma 0 1 1 1 1 2
Kidney alterations (glomeruli
changes, tubular cell
proliferations) 1 1 1 1 1 1
Lactate in blood plasma 0 1 1 1 1 2
Lipid weight of soft tissues
muscle lipid content
storage disorders (lipid
accumulation, NL 1 1 1 1 0 1
Liver lipid content 1 1 1 1 1 1
LMS Lysosomal membrane
stability minutes
Cytochemical; liver all species
Neutral Red Retention: all
species 1 1 1 2 2 1
LPF Accumulation of lipofuscins 1 1 1 2 1 1
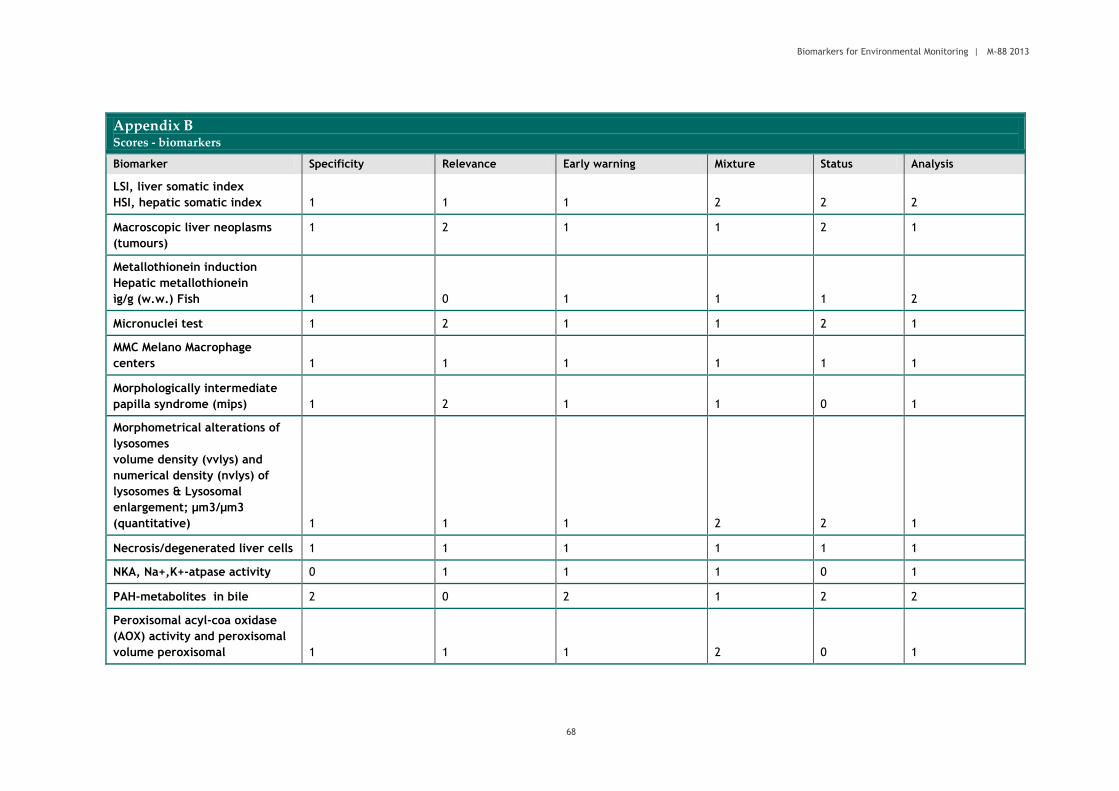
Biomarkers for Environmental Monitoring | M-88 2013
68
Appendix B Scores - biomarkers
Biomarker Specificity Relevance Early warning Mixture Status Analysis
LSI, liver somatic index
HSI, hepatic somatic index 1 1 1 2 2 2
Macroscopic liver neoplasms
(tumours)
1 2 1 1 2 1
Metallothionein induction
Hepatic metallothionein
ìg/g (w.w.) Fish 1 0 1 1 1 2
Micronuclei test 1 2 1 1 2 1
MMC Melano Macrophage
centers 1 1 1 1 1 1
Morphologically intermediate
papilla syndrome (mips) 1 2 1 1 0 1
Morphometrical alterations of
lysosomes
volume density (vvlys) and
numerical density (nvlys) of
lysosomes & Lysosomal
enlargement; µm3/µm3
(quantitative) 1 1 1 2 2 1
Necrosis/degenerated liver cells 1 1 1 1 1 1
NKA, Na+,K+-atpase activity 0 1 1 1 0 1
PAH-metabolites in bile 2 0 2 1 2 2
Peroxisomal acyl-coa oxidase
(AOX) activity and peroxisomal
volume peroxisomal 1 1 1 2 0 1
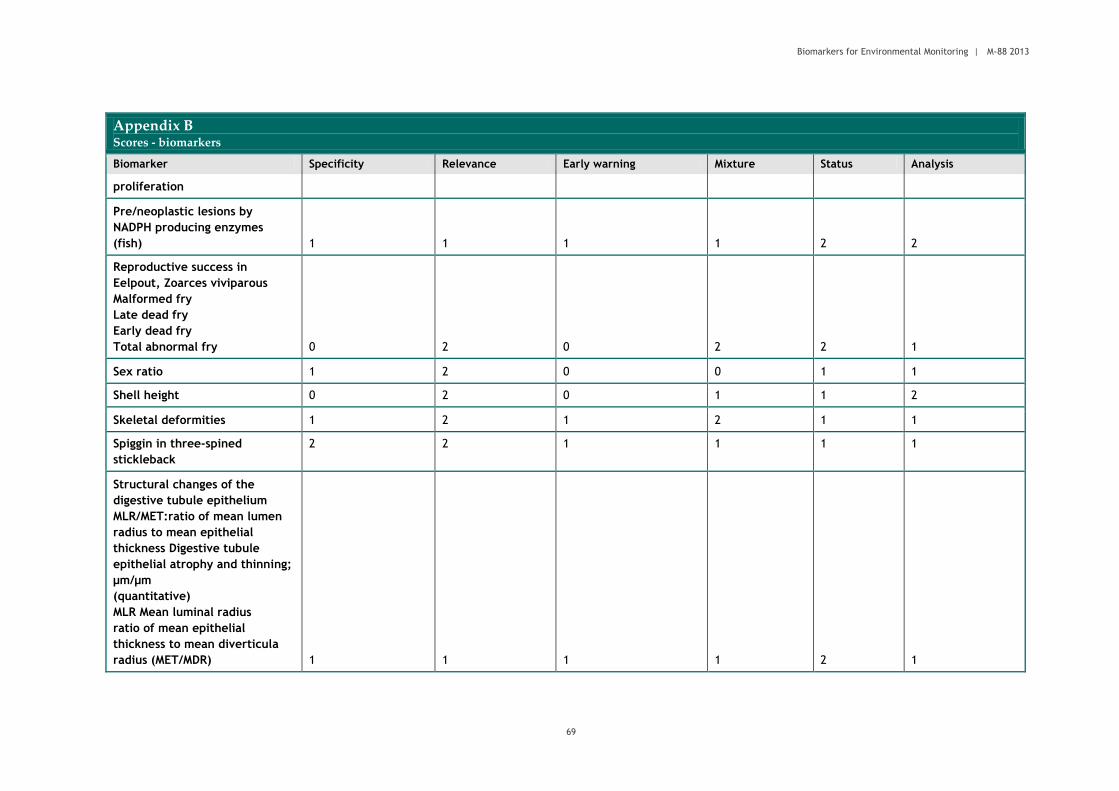
Biomarkers for Environmental Monitoring | M-88 2013
69
Appendix B Scores - biomarkers
Biomarker Specificity Relevance Early warning Mixture Status Analysis
proliferation
Pre/neoplastic lesions by
NADPH producing enzymes
(fish) 1 1 1 1 2 2
Reproductive success in
Eelpout, Zoarces viviparous
Malformed fry
Late dead fry
Early dead fry
Total abnormal fry 0 2 0 2 2 1
Sex ratio 1 2 0 0 1 1
Shell height 0 2 0 1 1 2
Skeletal deformities 1 2 1 2 1 1
Spiggin in three-spined
stickleback
2 2 1 1 1 1
Structural changes of the
digestive tubule epithelium
MLR/MET:ratio of mean lumen
radius to mean epithelial
thickness Digestive tubule
epithelial atrophy and thinning;
µm/µm
(quantitative)
MLR Mean luminal radius
ratio of mean epithelial
thickness to mean diverticula
radius (MET/MDR) 1 1 1 1 2 1

Biomarkers for Environmental Monitoring | M-88 2013
70
Appendix B Scores - biomarkers
Biomarker Specificity Relevance Early warning Mixture Status Analysis
Total antioxidant scavenging
capacity (TOSC)
1 1 2 2 1 1
Total number of eggs per
female 0 2 0 2 1 2
White blood cell ratios
(lymphocytes, granulocytes,
trombocytes) 1 1 1 1 1 1
Vitellogenin (VTG) in fish 2 2 2 1 2 2
Vvbas: Volume density of
basophilic cells- increase due to
exposure
Cell type composition of
digestive gland epithelium;
µm3/µm3
(quantitative) 1 1 1 2 2 1
Zona Radiata protein (protein
and mrna) 2 2 1 1 0 1

Miljødirektoratet ble opprettet 1. juli 2013 og er
en sammenslåing av Direktoratet for
naturforvaltning og Klima- og
forurensningsdirektoratet (Klif).
Vi er et direktorat under Miljøverndepartementet
med 700 ansatte i Trondheim og Oslo. Statens
naturoppsyn er en del av direktoratet med over
60 lokalkontor.
Miljødirektoratet har sentrale oppgaver og ansvar
i arbeidet med å redusere klimagassutslipp,
forvalte norsk natur og hindre forurensning.
Våre viktigste funksjoner er å overvåke
miljøtilstanden og formidle informasjon, være
myndighetsutøver, styre og veilede regionalt og
kommunalt nivå, samarbeide med berørte
sektormyndigheter, være faglig rådgiver og bidra
i internasjonalt miljøarbeid.
Miljødirektoratet
Telefon: 03400/73 58 05 00 | Faks: 73 58 05 01
E-post: [email protected]
Nett: www.miljødirektoratet.no
Post: Postboks 5672 Sluppen, 7485 Trondheim
Besøksadresse Trondheim: Brattørkaia 15, 7010
Trondheim
Besøksadresse Oslo: Strømsveien 96, 0602 Oslo