biological monitoring and data collection for tmdl studies
TRANSCRIPT

Minnesota Pollution Control Agency
Setting the Course for Improved Water Quality –Biological Monitoring and Data Collection for TMDL Studies
A TMDL training program for local government leaders and other water managers – Session 10a
wq-iw3-60a

Min
neso
ta P
ollu
tion
Con
trol A
genc
y
In this presentation
Define biological integrityDiscuss basic monitoring and assessment techniquesDescribe analytical tools and techniques used to determine existence of biological impairmentIdentify uses for biological monitoring data in TMDL studies

Min
neso
ta P
ollu
tion
Con
trol A
genc
y
What is biological integrity?
Biological integrity (aka biotic integrity)
defines health of a waterbodydescribes how it is functioning relative to its original state (before human impact)
assumes there is a correlation between human activity and biological health

Min
neso
ta P
ollu
tion
Con
trol A
genc
y
Biological Monitoring and Assessment

Min
neso
ta P
ollu
tion
Con
trol A
genc
y
Water chemistry
Habitat structure
Energy sources
Flow regime
Biotic interactions
Biotic integrity
D.O.pH
TurbidityHardness
TemperatureMetals
NutrientsOrganics
SubstrateChannel
MorphologyRiparian
vegetationGradient
Instream coverSinuosity
Bank StabilityCanopy
Channel width/ depth
Nutrient availabilitySunlight
Organic Matter inputs
Primary productionSeasonal Patterns
VelocityRunoffVolume
Ground waterPrecipitationWatershed
characteristics
DiseaseReproduction
FeedingCompetitionPredationParasitism
Exotics
Multiple factors affect biological integrity

Min
neso
ta P
ollu
tion
Con
trol A
genc
yWhy is it important to assess biological integrity?
In the past, only water chemistry monitoring was used to assess surface waters
Chemical monitoring provides a snapshot of conditionsBiological assessment integrates water quality conditions
Water chemistry alone cannot measure effects of humans on complex ecosystems
Min
neso
ta P
ollu
tion
Con
trol A
genc
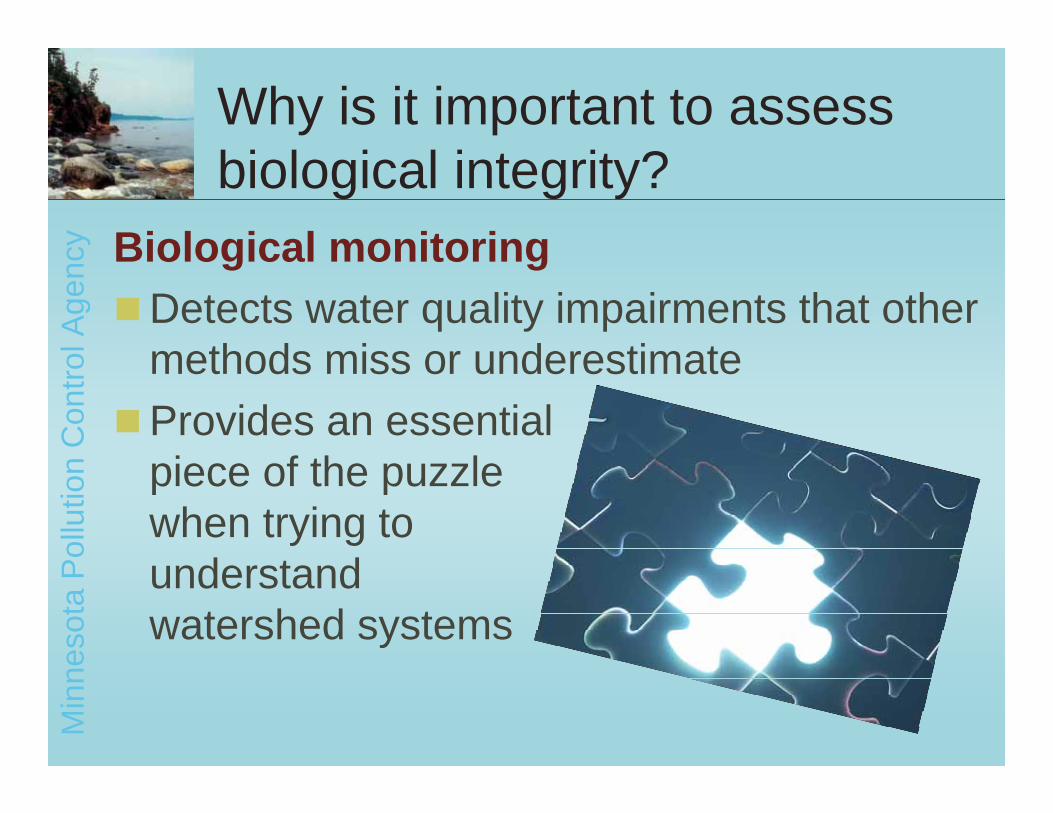
yWhy is it important to assess biological integrity?
Biological monitoring Detects water quality impairments that other methods miss or underestimateProvides an essentialpiece of the puzzle when trying to understand watershed systems

Min
neso
ta P
ollu
tion
Con
trol A
genc
yWhat does biological monitoring measure?
How well a waterbodyis supporting and maintaining
a balanced and adaptive community of aquatic organisms

Min
neso
ta P
ollu
tion
Con
trol A
genc
yWhat does biological monitoring measure?
Biological monitoring determines the health of biological systems by
Describing the consequences of human activities on the systems
Distinguishing between naturally occurring variations and human-induced changes

Min
neso
ta P
ollu
tion
Con
trol A
genc
yEPA regulations and Minnesota Water Quality Rules (Chapter 7050) Require that healthy, diverse, and successfully reproducing populations of aquatic organisms (including fish and invertebrates) be maintained
(for most Minnesota waters)
MPCA and DNR charged with studying and maintaining biodiversity
©ExploreMNTourism

Min
neso
ta P
ollu
tion
Con
trol A
genc
yMinn. water quality standards protect biological integrity
Water quality standards consist of: Beneficial use classifications for waterbodiesNumeric and narrative criteria that protect those beneficial usesNondegradation requirements to provide extra protection to high quality waters

Min
neso
ta P
ollu
tion
Con
trol A
genc
y
Beneficial use classifications
Beneficial uses describe the ways in which we want to use a waterbody
Min
neso
ta P
ollu
tion
Con
trol A
genc
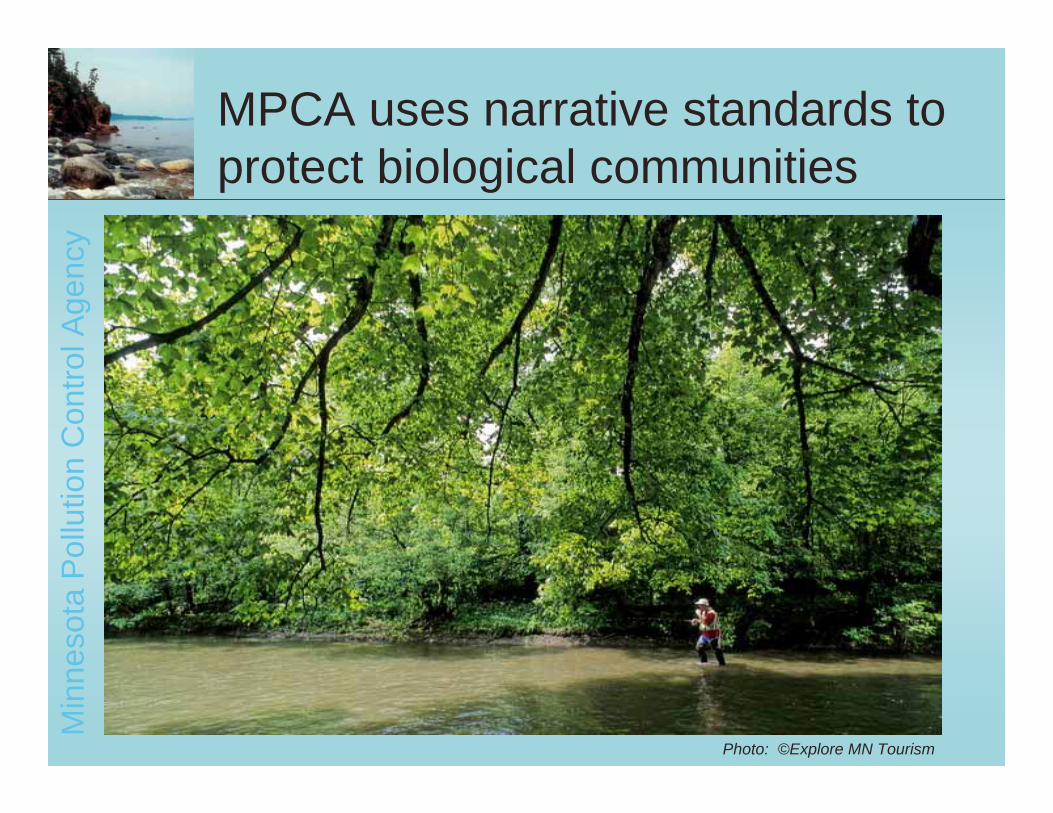
yMPCA uses narrative standards to protect biological communities
Photo: ©Explore MN Tourism
Min
neso
ta P
ollu
tion
Con
trol A
genc
y Narrative standardsDo not rely on quantitative criteriaRely on weight of evidence approach to data analysis to show pattern of violationsRequire professional judgment to determine impairment
Narrative standards

Min
neso
ta P
ollu
tion
Con
trol A
genc
y
Narrative criteria
MPCA has developed qualitative(narrative) biocriteria to determine whether narrative standards are being metMPCA is in the process of developing quantitative (numeric) biocriteria for
biological communities across MN (by 2012)
wetlands (by 2015)
Min
neso
ta P
ollu
tion
Con
trol A
genc
y
Index of Biotic Integrity
Index of Biotic Integrity (IBI) main tool MPCA uses in developing biocriteriaa numeric translator for narrative standarda scientifically validated tool typically looks at 8-12 attributes of a biological community to determine its health

Min
neso
ta P
ollu
tion
Con
trol A
genc
y
Measuring biological integrity
MPCA and DNR examine fish macroinvertebrates plant communities
and habitat to assess the overall health of a waterbody
For streams –invertebrates, fish
For streams –invertebrates, fish
For wetlands –invertebrates, plants
For wetlands –invertebrates, plants

Min
neso
ta P
ollu
tion
Con
trol A
genc
y 1. Collect data1. Collect data
2. Analyze biological attributes (examples)2. Analyze biological attributes (examples)
Determining an IBI Score
TrophicfunctionTrophicfunction
• Number of insectivore species
• Number of omnivore species
Abundance/condition
Abundance/condition
• Number per meter• DELT (Deformities,
Eroded fins, Lesions, Tumors
Species richnessSpecies richness
• Taxa richness• Number of
darter species

Min
neso
ta P
ollu
tion
Con
trol A
genc
y
0102030405060708090
100
0 20 40 60 80 100
%Watershed Disturbance
IBI S
core
Poor
Fair
Good
Excellent
1000
1
2
3
4
5
6
0 20 40 60 80
% Watershed Disturbance
Num
ber o
f D
arte
r Spe
cies
025
7
10
Determining an IBI Score
3. Select, verify and score metrics3. Select, verify and score metrics 4. Sum metric scores = IBI4. Sum metric scores = IBI
5. Interpret overall IBI score5. Interpret overall IBI score
Metric
scoresMetric
scores

Min
neso
ta P
ollu
tion
Con
trol A
genc
yCompare IBI scores to reference waterbodies
Compare IBI score for a specific waterbodyto biological conditions of reference waterbodies within the river basinSelect reference waterbody that best represents the most natural condition for a specific geographic area (river basin & watershed)
CompareCompareWaterbodyIBI
WaterbodyIBI
Reference IBI
Reference IBI

Min
neso
ta P
ollu
tion
Con
trol A
genc
yExamples of IBI scores (from Lyons 1992)IBI score Rating Attributes
100-65 Excellent Comparable to the best situations with minimal human disturbance; all regionally expected species are present.
64-50 Good Species richness somewhat below expectations. Loss of intolerant species. Trophic structure shows signs of imbalance.
49-30 Fair Signs of additional deterioration including decreased species richness, loss of intolerant forms, increased abundance of tolerant species, increased numbers of omnivore species and less specialized feeding species.
29-20 Poor Relatively few species; dominated by tolerant forms, habitatgeneralists, and omnivores; few or no top carnivores, growth rates and condition factors sometimes depressed; hybrids sometimes common.
19-0 Very poor Very few species present, mostly tolerant forms, hybrids, orexotics; few large or older fish; DELT fish (fish with deformities, eroded fins, lesions, or tumors) sometimes common.
No score Thorough sampling finds few or no fish; impossible to calculate IBI.

Min
neso
ta P
ollu
tion
Con
trol A
genc
y
Determine impairment
For a waterbody to be listed as impaired MPCA must have supporting IBI data for at least one of the three communities:
1. Fish2. Invertebrate3. Plant

Min
neso
ta P
ollu
tion
Con
trol A
genc
y
Planning and Conducting Biomonitoring Field Work

Min
neso
ta P
ollu
tion
Con
trol A
genc
yBiological monitoring requires expertise
specialized equipment
and training
specialized equipment
and training aquatic species
identificationetc.
aquatic species
identificationetc. stream
ecologystream ecology

Min
neso
ta P
ollu
tion
Con
trol A
genc
yWho conducts biomonitoringactivities?
Typically MPCA and DNR staff or consultantsCitizens/locals can also play a role
All Project Managers should work closely with MPCA to ensure adequate design and execution
of your monitoring plan

Min
neso
ta P
ollu
tion
Con
trol A
genc
y
Work closely with MPCA
Contact MPCA biomonitoring staff to determine monitoring plans for the coming yearsCoordinate sampling wherever possible

Min
neso
ta P
ollu
tion
Con
trol A
genc
y 1. Fish and macroinvertebratemonitoring 2. Qualitative habitat
assessment
3. Water chemistry
Integrated assessment of stream condition requires 3 tools

Min
neso
ta P
ollu
tion
Con
trol A
genc
y
1. Monitoring fish community

Min
neso
ta P
ollu
tion
Con
trol A
genc
yIdentifying fish species and measuring length

Min
neso
ta P
ollu
tion
Con
trol A
genc
y
Photos courtesy of MDNR
1. Monitoring macroinvertebrate community

Min
neso
ta P
ollu
tion
Con
trol A
genc
yEquipment used to sample macroinvertebrates
D-frame netsSieve buckets
Sample bottles, alcohol (preservative)

Min
neso
ta P
ollu
tion
Con
trol A
genc
y
Photo: Scott Niemela
2. Habitat assessment

Min
neso
ta P
ollu
tion
Con
trol A
genc
y
Habitat assessment
Quantitative variables assessedStream widthDepthSubstrate typesSubstrate embeddednessDepth of fine materialCover for fish
Percent macrophytesand algaeBank erosion Riparian land use CanopyStream featuresStream flow
In the future , MPCA will do qualitative habitat assessments instead

Min
neso
ta P
ollu
tion
Con
trol A
genc
y
Measuring stream width
measuring tape

Min
neso
ta P
ollu
tion
Con
trol A
genc
yNumeric water quality standards
Set maximum allowable concentrations for pollutants (known as numeric criteria) to protect beneficial uses of waters of the stateMPCA does not currently have numeric biological criteria that protect biota
Min
neso
ta P
ollu
tion
Con
trol A
genc
y
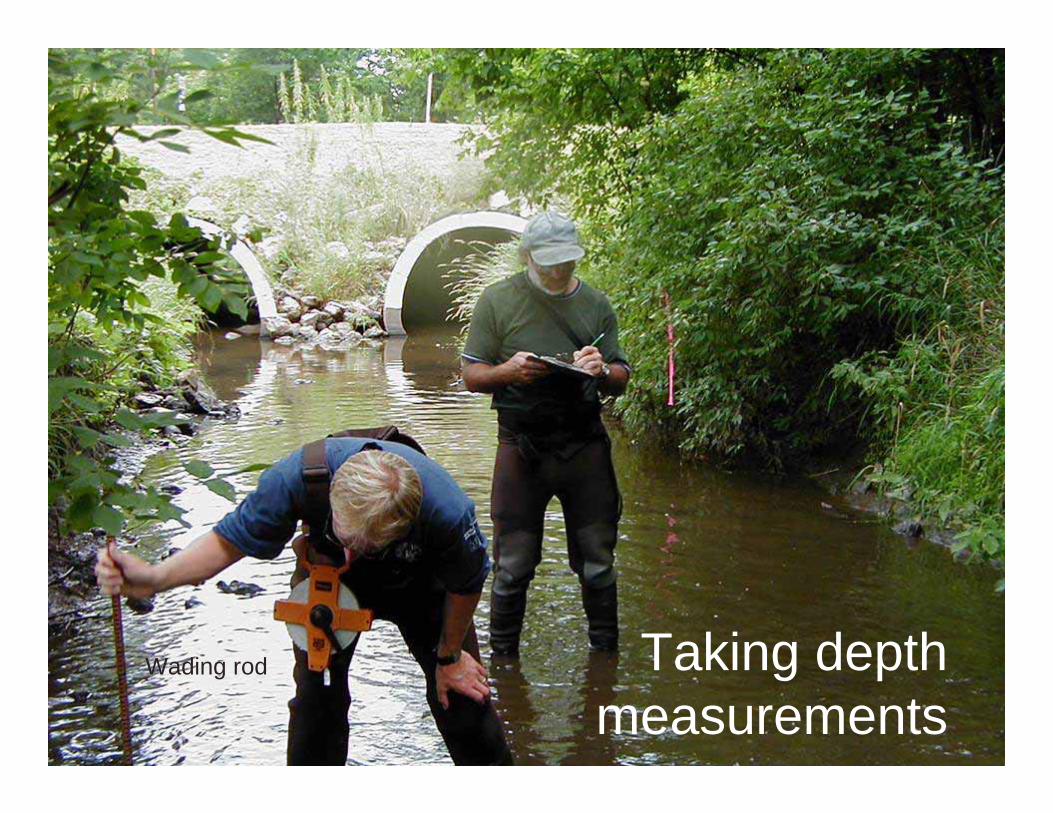
Wading rod Taking depth measurements
Min
neso
ta P
ollu
tion
Con
trol A
genc
y
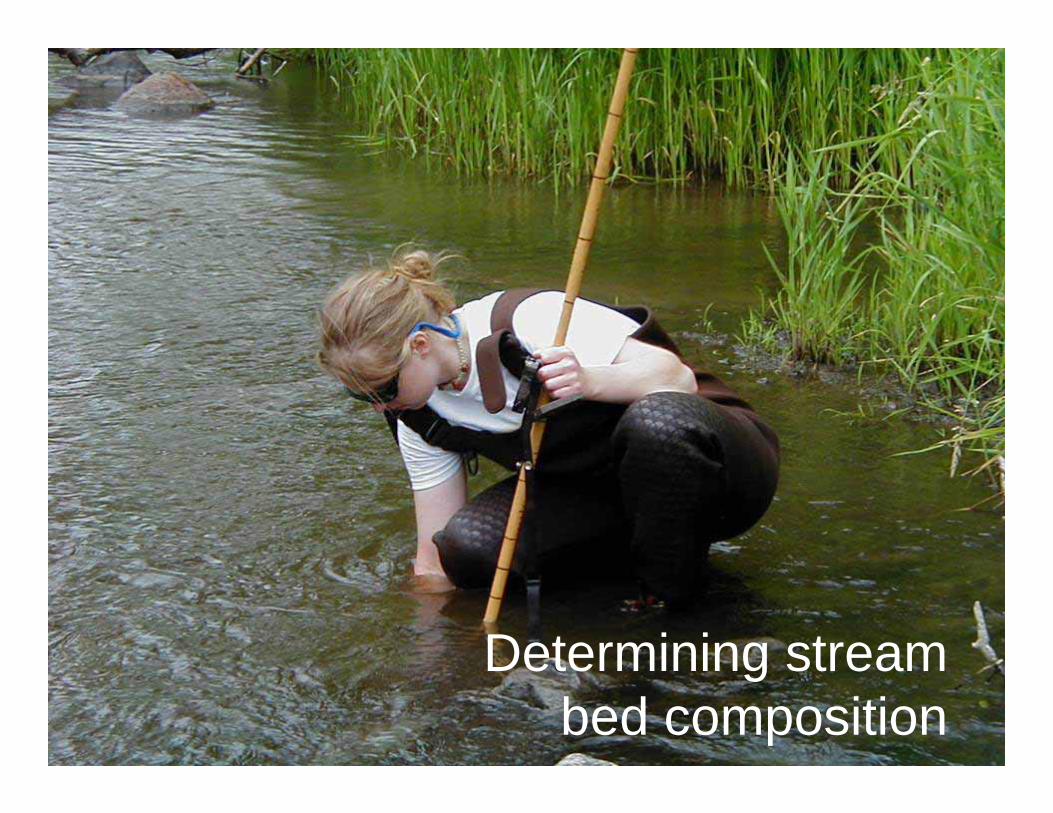
Determining stream bed composition

Min
neso
ta P
ollu
tion
Con
trol A
genc
yAssessing fish cover

Min
neso
ta P
ollu
tion
Con
trol A
genc
yStudying stream
morphology

Min
neso
ta P
ollu
tion
Con
trol A
genc
y
Assessing canopy cover
Densiometer

Min
neso
ta P
ollu
tion
Con
trol A
genc
y3. Water chemistry
monitoring

Min
neso
ta P
ollu
tion
Con
trol A
genc
y
Putting it all together
provide an integrated perspective on the health of stream ecosystems
Fish and invertebrate community assessmentsFish and invertebrate community assessments
Habitat assessmentsHabitat assessments
Water chemistry data Water chemistry data

Min
neso
ta P
ollu
tion
Con
trol A
genc
y
Biological Monitoring in TMDL Studies

Min
neso
ta P
ollu
tion
Con
trol A
genc
ySome TMDL studies will require new biological monitoring data
While some studies may use existing data to determine impairment, others may require a significant data gathering effort
Contact MPCA to determine their monitoring plans for the coming years

Min
neso
ta P
ollu
tion
Con
trol A
genc
yWhen should biomonitoring take place within a TMDL study?
Scope the
project
Conduct data
inventory----------Identify water
quality data gaps
----------
Identify watershed data gaps
---------
Determine whether
new data is needed
Develop data collection
plans ----------
Collect new water quality
data
----------
Collect new
biological data
Analyze WQ data
----------
Define water quality
problem
------
Collect new land use data
Modeling
----------
Develop allocation formula
Min
neso
ta P
ollu
tion
Con
trol A
genc
y
Putting it all together
All data can be used to conduct a Stressor
Identification Process for TMDL studies
High quality data, collected and analyzed,
can help identify the causes of an impairment
in waterbodies
See Module 116 for more information

Min
neso
ta P
ollu
tion
Con
trol A
genc
y
Summary
Biological integrity measures how a waterbody is functioning relative to its original state before human impacts were imposedBiological monitoring
measures the ability of a waterbody to support and maintain a balanced and adaptive community of aquatic organismsdetects water quality impairments that other methods miss or underestimate
Min
neso
ta P
ollu
tion
Con
trol A
genc
y
Summary
Minnesota Water Quality Rules require healthy, diverse and successfully reproducing populations of aquatic organisms be maintained MPCA has developed biocriteria (qualitative) that help to determine whether narrative standards are being metThe Index of Biotic Integrity (IBI) is the main tool MPCA uses in conducting assessmentsCoordinate with MPCA and MnDNR before beginning any monitoring effort

Min
neso
ta P
ollu
tion
Con
trol A
genc
y
We must begin thinking like a river if we are to leave a legacy of beauty and
life for future generations.
– David Browerquoted by E-Wire, 7 Apr 2000

Min
neso
ta P
ollu
tion
Con
trol A
genc
y
MPCA contacts