biogenic silica in freshwater marsh sediments and vegetation
TRANSCRIPT
Chapter 2
BBiiooggeenniicc ssiilliiccaa iinn ffrreesshhwwaatteerr
mmaarrsshh sseeddiimmeennttss aanndd vveeggeettaattiioonn
((SScchheellddtt eessttuuaarryy,, BBeellggiiuumm))
EErriicc SSttrruuyyff,, SStteeffaann VVaann DDaammmmee,, BBrriittttaa GGrriibbsshhoolltt,,
JJaacckk MMiiddddeellbbuurrgg && PPaattrriicckk MMeeiirree
((MMaarriinnee EEccoollooggyy PPrrooggrreessss SSeerriieess,, iinn pprreessss))

Chapter 2
34

Biogenic silica in freshwater marsh sediments and vegetation
2.1 Abstract Up to this date, silicon cycling in freshwater intertidal marshes has mostly been neglected in estuarine ecosystem research. However, tidal marshes can store large amounts of biogenic silica (BSi) in vegetation and sediment. BSi content of the typical freshwater marsh plants Phragmites australis, Impatiens glandulifera, Urtica dioica, Epilobium hirsutum and Salix sp. was analysed year round. All herbaceous species accumulated silica in their tissue during their life cycle. P. australis contained most BSi (accumulation from 6 to 55 mg g-1). Dead standing P. australis shoots had the largest BSi content (up to 72.2 mg g-1). U. dioica (< 11.1 mg g-1), I. glandulifera (< 1.1 mg g-1), E. hirsutum (< 1.2 mg g-1) and Salix sp. (< 1.9 mg g-1) had much lower BSi content. Underground biomass (< 6 mg g-1), except for P. australis rhizomes (< 15 mg g-1) contained low amounts of BSi. Sediment BSi decreased from the surface (9-10 mg g-1) towards deeper layers (5-7 mg g-1). There was no seasonal variation in sediment BSi. Porewater dissolved Si was highest in summer (ca. 600 µM) and lowest in winter (ca. 400 µM). P. australis vegetation (aboveground and roots) contained up to 140 g m-2 BSi, while the sediment upper 30 cm accumulated up to 1500 g m-2 BSi, making sediment the largest BSi reservoir in the marsh. We can conclude that P. australis wetlands could be an essential, yet overlooked sink for BSi in the biogeochemical cycling of Si.
35
Chapter 2
2.2 Introduction Coastal zones and shallow marine areas are among the most productive systems in the world (Mann 1988; Glantz 1992) and represent the main fishery grounds on Earth (Postma & Zijlstra 1988; Sherman et al. 1991). The amount of dissolved silica (DSi) that is transported to coastal waters through estuaries is essential for the occurrence of eutrophication events in the coastal zone. In contrast to N and P, with large human inputs through river basins, anthropogenic input of Si to estuarine systems is negligible. In summer and spring, DSi in estuarine and coastal waters is taken up by diatom communities, for which DSi is an essential nutrient. High anthropogenic inputs of N and P can induce DSi limitation of diatom communities and subsequent succession to a non-diatom phytoplankton community (Schelske et al. 1983; Lancelot 1995; Smayda 1997; Billen et al. 2001). This can negatively influence the structure of coastal foodwebs, as diatoms are the most important energetic source in estuarine food chains (Peterson & Howarth 1987; Sullivan & Moncreiff 1990). Recently, intertidal habitats have been indicated as important Si stocks and processors in the estuarine ecosystem. In North Carolina, a study of silica in mesohaline marsh sediments, vegetation and porewater clearly revealed these intertidal habitats as huge reservoirs of silica (Norris & Hackney 1999). Moreover, it was shown how a freshwater marsh (Scheldt estuary, Belgium) acted as an important DSi recycler in the estuarine environment (Chapter 3 and 4). Marshes have a high DSi recycling capacity because they act as efficient biogenic silica traps, concentrating Si at levels above those found in nearby estuarine waters (Hackney et al. 2000). BSi in marsh ecosystems is mainly stored in plants and sediments. DSi taken up by marsh plants from the porewater is stored as amorphous silicon dioxide in plant phytoliths. It is accumulated during the plant life cycle and only released to the environment after the plant decays. Silicon uptake can positively influence plant growth and development, providing rigidity to plant structures and enhancing resistance to abiotic and biotic stresses, such as toxic metal accumulation and herbivory (Epstein 1994). The role of Si in cell walls is similar to that of lignin, but it is energetically cheaper to incorporate Si (Raven 1983).
36
Biogenic silica in freshwater marsh sediments and vegetation
BSi in sediments is mainly attributable to plant phytoliths and diatom shells, deposited on the sediment at flood tide along with suspended matter. BSi dissolution occurs when porewater comes into contact with the sediment BSi in between tidal flooding events, resulting in high porewater DSi concentrations in marshes. Despite the importance of Si processing in tidal marshes, very few studies have focused on tidal marsh Si cycling and storage. The silica content of sediment, porewater and vegetation in freshwater marshes has never been studied in detail. Recent estimates of the terrestrial BSi cycle have shown that BSi in vegetation plays an essential role in global Si mass balances. Further quantification of Si in complete ecosystems is needed, especially from grassland ecosystems, to quantify the role of the terrestrial cycle in the global biogeochemical cycle of Si and in the transport of Si to the ocean through rivers (Conley 2002; Meunier 2003). The aim of this study was to determine the BSi and DSi content of vegetation, sediment and porewater in a Phragmites australis dominated freshwater marsh. Most studies on the ecology of Phragmites australis dominated freshwater marsh systems have focused on C- or N-cycling (Meyerson et al. 2000, Soetaert et al. 2004). P. australis has a big potential as a nutrient sink, because of its high productivity and dense clonal growth, and because dead culms can remain standing for two or more years before collapsing. We performed a year long, two-monthly study of silica content in porewater, sediment and vegetation, in order to gain a complete image of the amounts of Si stored in the freshwater marsh ecosystem and to explore the seasonal variability in Si storage.
37
Chapter 2
2.3 Materials and methods
Sampling
All sampling was done in the Tielrode freshwater marsh (site description in 1.6) Vegetation
Aboveground vegetation samples were taken two-monthly from June 2002 until May 2003 for 4 target herbaceous species (Epilobium hirsutum, Phragmites australis, Urtica dioica and Impatiens glandulifera) and for Salix sp. shrubs. All sampled vegetation was dead in January and March. I. glandulifera, E. hirsutum and U. dioica (January only) were sampled as decomposing litter during these months. P. australis was sampled as both dead standing reed and decomposing litter during winter. Salix sp. leafs were sampled when available (June, September and November). Salix sp. twigs were sampled in September, November, January and March. All individual plant samples were transported to the laboratory immediately after sampling. Half of the sampled individuals for the most abundant species in the marsh (P. australis, U. dioica and I. glandulifera) were separated in leafs and shoots directly upon arrival in the laboratory. Underground biomass was sampled in January, March, May, July and October 2003 in the upper 30 cm of the marsh sediment from 8 sediment cores (diameter 5 cm), 2 in each vegetation type (chapter 1, Figure 1.10), to ensure analysis of roots of all plant species present. The underground biomass from the 2 cores collected within the same vegetation type was treated as a single mixed sample. Underground biomass was separated in dead and living biomass. P. australis rhizomes were analysed separately. In January 2003, no rhizomes were found in the cores. In other months, rhizomes were always found in at least 2 cores. In September 2004, vegetation coverage (individuals per squared meter) was studied in 48 vegetation plots of 1 m2, 12 in each vegetation type (Table 2.1). Combined with individual plant weights, these data were used for marsh biomass estimates.
38
Biogenic silica in freshwater marsh sediments and vegetation
Sediments and porewater
In each of the 4 different vegetation types 5 sediment cores were taken at random in September 2002, November 2002, January 2003, March 2003 and May 2003. The sediment cores were sub sampled at four different depths (0-1cm, 1-10 cm, 10-20 cm and 20-30 cm) and pooled per depth per vegetation type. Roots and litter were removed manually from the sediment. Porewater was sampled in January, March, May, July and October 2003. Porewater samples were taken at 12 different sampling points, 3 in each vegetation type (not in tall-herb in July) using Eijkelkamp polymerous rhizons (diameter 2.5 x 1.4 mm). Subsamples were taken at 0-10 cm depth, 10-20 cm and 20-30 cm. Samples were pooled per depth per vegetation type.
Imp gla Epi Hir Phr aus Urt dio Phr aus dead Imp gla Epi Hir Phr aus Urt dio Phr aus dead
ppl
lot 1 17 0 0 6 0 plot 1 4 0 50 0 6ot 2 6 0 0 11 0 plot 2 3 0 49 0 9
plot 3 23 0 0 8 0 plot 3 0 0 42 0 3ot 4 0 0 0 28 0 plot 4 0 0 70 0 3ot 5 5 0 0 11 0 plot 5 6 0 34 0 18
plot 6 0 0 5 0 0 plot 6 1 0 41 0 12ot 7 0 0 0 22 0 plot 7 25 0 57 0 9
lot 8 0 0 12 14 0 plot 8 9 0 29 11 2plot 9 4 0 8 2 7 plot 9 1 0 56 0 13
ot 10 0 0 30 15 0 plot 10 7 0 37 0 9plot 11 0 20 0 3 0 plot 11 19 0 26 1 19
ot 12 1 10 5 0 0 plot 12 0 6 40 0 3
Imp gla Epi Hir Phr aus Urt dio Phr aus dead Imp gla Epi Hi
plpl
plp
pl
pl
r Phr aus Urt dio Phr aus deadplot 1 14 0 15 4 0 plot 1 0 0 74 0 15
ot 2 0 25 14 15 6 plot 2 0 0 81 0 9ot 3 0 10 60 0 0 plot 3 0 0 75 0 8
plot 4 0 30 30 3 0 plot 4 0 0 78 0 32lot 5 60 0 0 11 0 plot 5 0 0 111 0 20ot 6 71 0 0 11 0 plot 6 0 0 76 0 17
plot 7 64 0 0 10 0 plot 7 0 0 117 0 18ot 8 9 0 3 17 5 plot 8 0 0 81 0 32
plot 9 32 0 0 6 0 plot 9 0 0 104 0 15plot 10 20 2 13 0 0 plot 10 0 0 63 0 25
ot 11 3 13 39 0 0 plot 11 0 0 71 0 6
plpl
ppl
pl
plplot 12 0 6 36 0 0 plot 12 0 0 86 0 21
Number of individuals
P. australis with tall-herbs
Pure P. australis vegetationNumber of individuals
Tall-herbs vegetation
Number of individualsNumber of individualsSalix vegetation
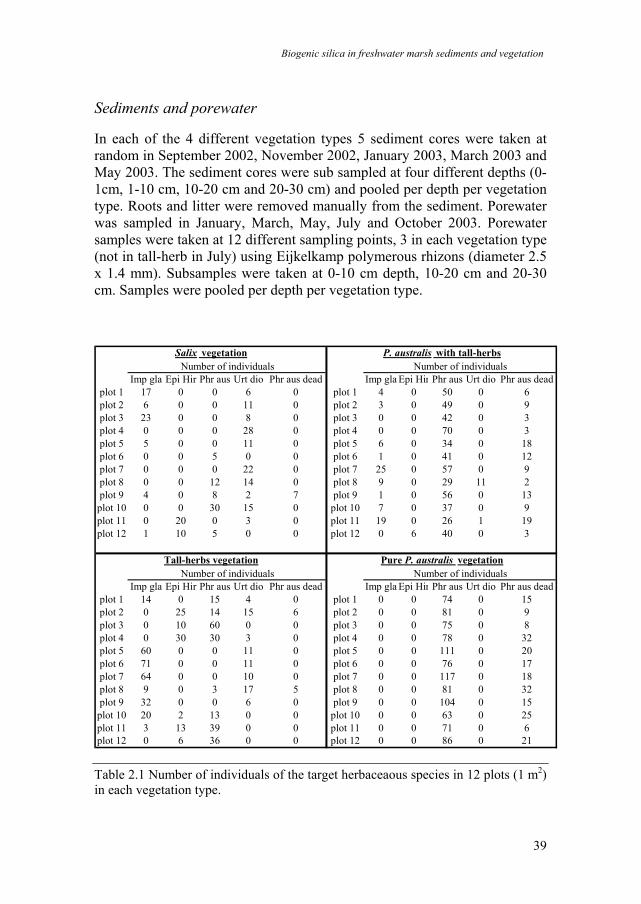
Table 2.1 Number of individuals of the target herbaceaous species in 12 plots (1 m2) in each vegetation type.
39
Chapter 2
Analysis
After sampling, plant samples were oven-dried for 3 days at 75°C, after which dry weight of individual plants was determined. Subsequently, samples were grinded and sieved over a 300 µm mesh size. To extract biogenic silica, 25 mg of sieved plant material was incubated for 4 hours in 0.1 M Na2CO3 (De Master 1981). Sediment was oven-dried for 3 days at 75°C, always within 24 hours after sampling. BSi was extracted from the sediment (25 mg) in a 0.1 M Na2CO3 solution at 80°C. Subsamples were taken after 150, 210 and 270 minutes. BSi was calculated by extrapolating the linear line through the three extraction points in a time-extracted silica plot (DeMaster 1981). Dissolved silica was analysed spectrophotometrically on an IRIS ICP (Inductively Coupled Plasmaspectrophotometer).
40
Biogenic silica in freshwater marsh sediments and vegetation
2.4 Results
Vegetation
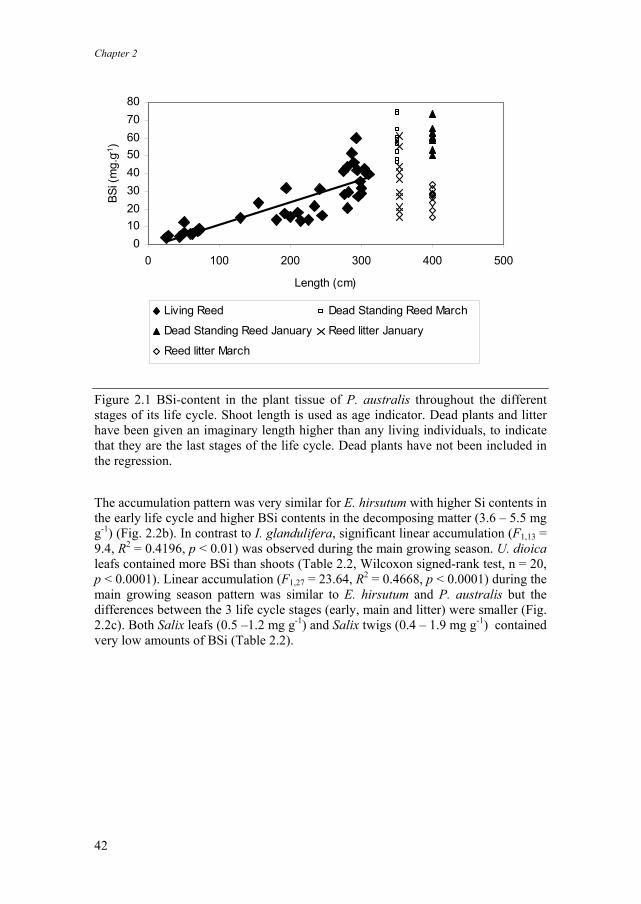
Phragmites australis was the biggest plant BSi accumulator (Table 2.2). During the whole growing season silica was accumulated in the plant tissue in a linear way from 6.6 mg g-1 in May to 55.0 mg g-1 in November (F1,37 = 87,89, R2 = 0.7037, p < 0.00001) (Fig. 2.1). Shoot length was used as age indicator. In January and March, the shoot length for standing dead shoots and decomposing reed litter on the marsh surface was considered constant at a high level. This level was higher than was observed in any living reed plants. This way, dead plants in Fig. 2.1 are always correctly indicated as being “older” than living plants. Accumulation patterns were similar in leafs and shoots. Shoots contained more BSi than leafs (Wilcoxon signed-rank test, n = 20, p<0.0001). Standing dead reed shoots contained most BSi (Table 2.2, Fig. 2.2). They were present during the whole year, and silica content was at similar high levels throughout the year (from 51.1 mg g-1 in June 2002 to 72.2 mg g-1 in September 2002). The decomposing litter contained about half of the BSi present in the standing dead shoots (Table 2.2, Fig. 2.1). BSi content of the reed litter decreased between January and March (34.7 mg g-1 and 25.5 mg g-1 respectively). Impatiens glandulifera (monthly average 0.4 – 2.5 mg g-1), Urtica dioica (monthly average 4.2 – 8.6 mg g-1) and Epilobium hirsutum (monthly average 0.5 – 2.6 mg g-1) contained less silica than Phragmites australis (Table 2.2). During the early growing season, biogenic silica content of I. glandulifera was slightly higher than later in the life cycle (Fig. 2.2a). Accumulation of silica in the tissue during the main growing season was less apparent in I. glandulifera than in P. australis, although highest BSi contents were mostly found in the oldest plants. No significant linear accumulation pattern was found. I. glandulifera litter content of BSi (6.8 – 8.0 mg g-1) was one order of magnitude higher than silica content of the living individuals (Fig. 2.2a).
41
Chapter 2
01020304050607080
0 100 200 300 400 500
Length (cm)
BSi (
mg.
g-1)
Living Reed Dead Standing Reed March
Dead Standing Reed January Reed litter January
Reed litter March
Figure 2.1 BSi-content in the plant tissue of P. australis throughout the different stages of its life cycle. Shoot length is used as age indicator. Dead plants and litter have been given an imaginary length higher than any living individuals, to indicate that they are the last stages of the life cycle. Dead plants have not been included in the regression.
The accumulation pattern was very similar for E. hirsutum with higher Si contents in the early life cycle and higher BSi contents in the decomposing matter (3.6 – 5.5 mg g-1) (Fig. 2.2b). In contrast to I. glandulifera, significant linear accumulation (F1,13 = 9.4, R2 = 0.4196, p < 0.01) was observed during the main growing season. U. dioica leafs contained more BSi than shoots (Table 2.2, Wilcoxon signed-rank test, n = 20, p < 0.0001). Linear accumulation (F1,27 = 23.64, R2 = 0.4668, p < 0.0001) during the main growing season pattern was similar to E. hirsutum and P. australis but the differences between the 3 life cycle stages (early, main and litter) were smaller (Fig. 2.2c). Both Salix leafs (0.5 –1.2 mg g-1) and Salix twigs (0.4 – 1.9 mg g-1) contained very low amounts of BSi (Table 2.2).
42

Biogenic silica in freshwater marsh sediments and vegetation
Plant BSi content BSi SD NOI (n) BSi SD NOI (n) BSi SD NOI (n)mg.g-1 mg.g-1 mg.g-1 mg.g-1 mg.g-1 mg.g-1
P. australis (entire plant) 16.6 3.4 10 40.6 6.3 10 55.0 14.8 10P. australis (shoot) 25.4 6.8 5 42.1 6.7 5 49.3 2.9 5P. australis (leafs) 9.4 2.6 5 26.6 4.5 5 32.1 6.3 5
P. australis (dead standing) 51.1 26.5 10 72.2 14.4 10 51.3 18.9 5P. australis (litter) * * * * * * * * *
E. hirsutum (entire plant) 0.5 0.2 5 1.5 0.6 5 1.2 0.1 5I.glandulifera (entire plant) 0.4 0.2 10 2.5 2.0 10 1.1 0.5 10
I. glandulifera (shoot) 0.2 0.1 5 1.1 0.1 5 1.1 0.5 10I. glandulifera (leafs) 0.3 0.1 5 0.6 0.1 5 * * *
U. dioica (entire plant) 4.2 1.5 10 7.7 1.2 10 8.6 1.8 10U. dioica (shoots) 1.1 0.4 5 4.9 1.4 5 4.8 1.0 5U. dioica (leafs) 5.4 1.4 5 9.2 1.6 5 11.1 2.8 5Salix sp. (leafs) 0.5 0.3 5 1.2 0.1 5 1.1 0.4 5Salix sp. (twigs) * * * 1.9 1.0 5 0.5 0.2 5
BSi SD NOI (n) BSi SD NOI (n) BSi SD NOI (n)mg.g-1 mg.g-1 mg.g-1 mg.g-1 mg.g-1 mg.g-1
P. australis (entire plant) 59.2 9.7 10 60.5 6.3 10 6.7 2.6 10P. australis (shoot) 59.2 9.7 10 60.5 6.3 10 7.6 2.2 5P. australis (leafs) * * * * * * 5.0 1.0 5
P. australis (dead standing) 59.2 9.7 10 60.5 6.3 10 * * *P. australis (litter) 34.7 15.4 10 25.5 5.5 10 * * *
E. hirsutum (entire plant) 5.5 1.0 5 3.6 1.9 5 2.6 0.5 5I.glandulifera (entire plant) 6.8 2.8 10 8.0 1.4 10 2.3 1.0 10
I. glandulifera (shoot) 6.8 2.8 10 8.0 1.4 10 2.6 1.6 5I. glandulifera (leafs) * * * * * * 1.0 0.3 5
U. dioica (entire plant) 8.5 2.3 10 * * * 5.2 1.1 10U. dioica (shoots) 8.5 2.3 10 * * * 2.3 0.9 5U. dioica (leafs) * * * * * * 6.3 0.7 5Salix sp. (leafs) * * * * * * * * *Salix sp. (twigs) 0.6 0.1 5 0.4 0.1 5 * * *
January 2003 March 2003 May 2003
June 2002 September 2002 November 2002
Table 2.2 BSi content of different plant species in the Tielrode marsh observed throughout the different seasons. NOI = Number of individuals, SD = standard deviation, * = no data.
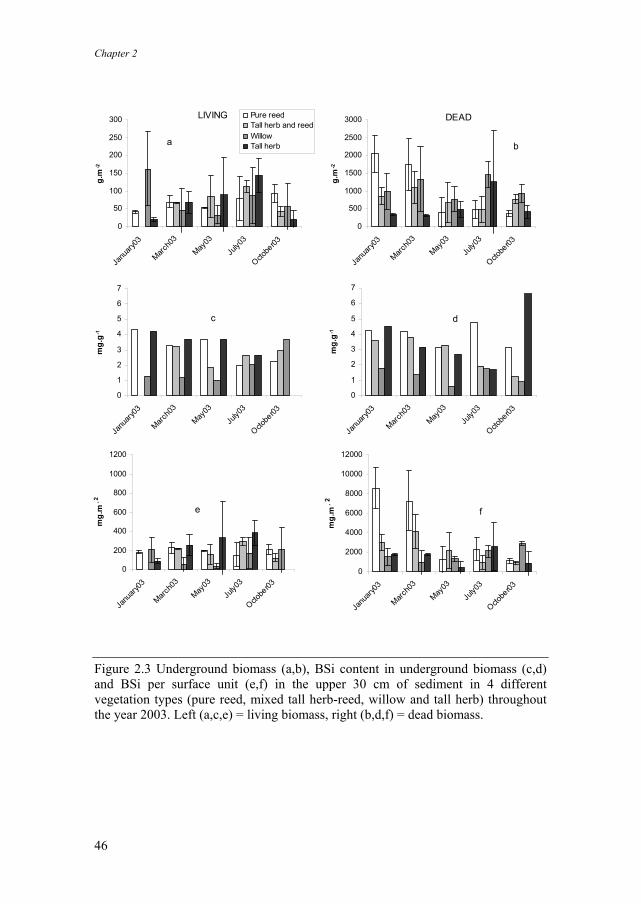
Dead underground biomass was generally highest in winter (Fig. 2.3b). Living non-rhizome root biomass was mostly highest in summer (Fig. 2.3a). Dead underground biomass was much higher (about ten-fold) than living (non-rhizome) biomass. BSi content of both dead and living (non-rhizome) underground biomass (Fig. 2.3c,d) was between 1 and 5 mg g-1. Generally, lowest values were found in the Salix vegetation, and highest values in the P. australis vegetation.
43

Chapter 2
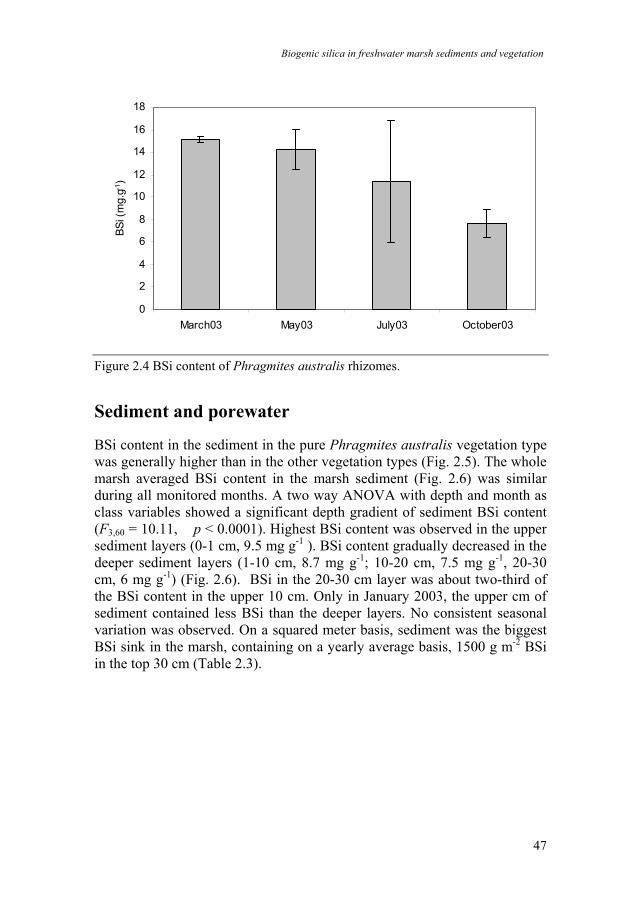
The total amount of Si stored in the dead underground biomass was much higher (one order of magnitude) than in the non-rhizomeous living roots. It was highest in winter (Fig. 2.3e,f). Rhizomes contained more BSi than the other underground biomass (Fig. 2.4). BSi content observed in rhizomes was highest in winter (15 mg g-1) and lowest in late summer and early autumn (8 mg g-1). On a squared meter basis, P. australis was the biggest BSi sink in the marsh in all four vegetation types, containing up to 85 g BSi per meter squared in aboveground vegetation (Table 2.3). The other plant species and underground non-rhizomeous biomass were far minor sinks compared to P. australis (Table 2.3). Based on a biomass estimate of 2500 g m-2 (Schierup 1978; Asaeda & Karunaratne 2000), rhizomes could accumulate on average 30 g m-2 BSi. vegetation type A Phr aus Phr aus/Tall herb Salix Tall-herb
Phr aus 85 +/- 39 45 +/- 22 5 +/- 9 18 +/- 21Phr aus ds 11 +/- 7 5 +/- 4 0 0,5 +/- 1,4Imp gl 0 0,5 +/- 0,7 0,6 +/- 0,8 1,7 +/- 2,5Urt dio 0 0,1 +/- 0,3 0,9 +/- 0,8 0,6 +/- 0,6Epi hir 0 0,1 +/- 0,1 0,2 +/- 0,5 0,5 +/- 0,8living roots 0,03 +/- 0,02 0,04 +/- 0,02 0,06 +/- 0,07 0,04 +/- 0,02dead roots 0,7 +/- 0,5 0,5 +/- 0,2 0,7 +/- 0,3 0,3 +/- 0,3rhizoms 30*
B sediment porewater0-1 cm 64 +/- 231-10 cm 533 +/- 22010-20 cm 511 +/- 183 0,9 +/- 0,120-30 cm 429 +/- 146 0,9 +/- 0,1
0,8 +/- 0,1
s
ecie
sp
dept
h
Table 2.3 BSi content of the different marsh sinks: (A) BSi content (g m-2) of the target plant species and underground biomass in the different vegetation types, (B) BSi-content (g m-2) of sediment and porewater averaged over the vegetation types. For sediments, calculation was based on a sediment bulk density of 0.74 g cm-3 (Van de Moortel & Deckers 1998). ds = dead shoots.
44

Biogenic silica in freshwater marsh sediments and vegetation
0.1
1
10
100
0 100 200 300 400 500
Length (cm)
BSi (
mg.
g-1)
Main growing season Litter Jan Litter Mar Early growth
a Impatiens glandulifera
0
2
4
6
8
10
12
14
0 50 100 150 200 250 300 350 400
Length (cm)
BSi (
mg.
g-1)
c Urtica dioica
0
1
2
3
4
5
6
7
0 100 200 300 400
Length (cm)
BSI (
mg.
g-1)
b Epilobium hirsutum
Figure 2.2 BSi content throughout the life cycle in a: Impatiens glandulifera, b: Epilobium hirsutum and c: Urtica dioica. Shoot length is used as age indicator. Litter has been given an imaginary length higher than any living individuals, to indicate that litter is formed in the last life cycle stage. Litter has not been included in the regressions.
45
Chapter 2
0
500
1000
1500
2000
2500
3000
Janu
ary03
March0
3
May03
July0
3
Octobe
r03
g.m
-2
DEAD
0
50
100
150
200
250
300
Janu
ary03
March0
3
May03
July0
3
Octobe
r03
g.m
-2
Pure reedTall herb and reedWillowTall herb
0
1
2
3
4
5
6
7
Janu
ary03
March0
3
May03
July0
3
Octobe
r03
mg.
g-1
0
1
2
3
4
5
6
7
Janu
ary03
March0
3
May03
July0
3
Octobe
r03
mg.
g-1
0
200
400
600
800
1000
1200
Janu
ary03
March0
3
May03
July0
3
Octobe
r03
mg.
m-
0
2000
4000
6000
8000
10000
12000
Janu
ary03
March0
3
May03
July0
3
Octobe
r03
mg.
m- 2
a b
c d
e f
LIVING
2
Figure 2.3 Underground biomass (a,b), BSi content in underground biomass (c,d) and BSi per surface unit (e,f) in the upper 30 cm of sediment in 4 different vegetation types (pure reed, mixed tall herb-reed, willow and tall herb) throughout the year 2003. Left (a,c,e) = living biomass, right (b,d,f) = dead biomass.
46
Biogenic silica in freshwater marsh sediments and vegetation
0
2
4
6
8
10
12
14
16
18
March03 May03 July03 October03
BSi (
mg.
g-1)
Figure 2.4 BSi content of Phragmites australis rhizomes.
Sediment and porewater
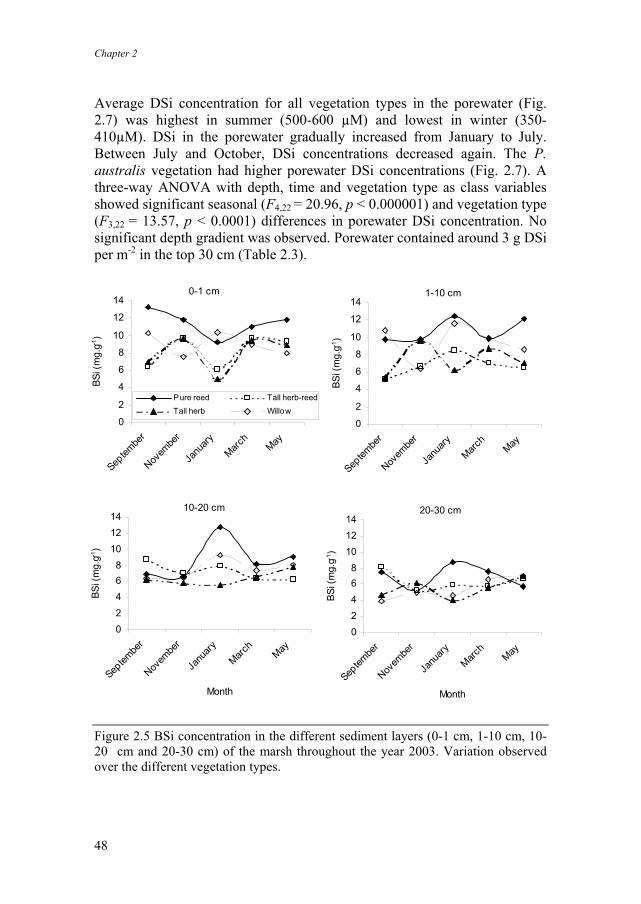
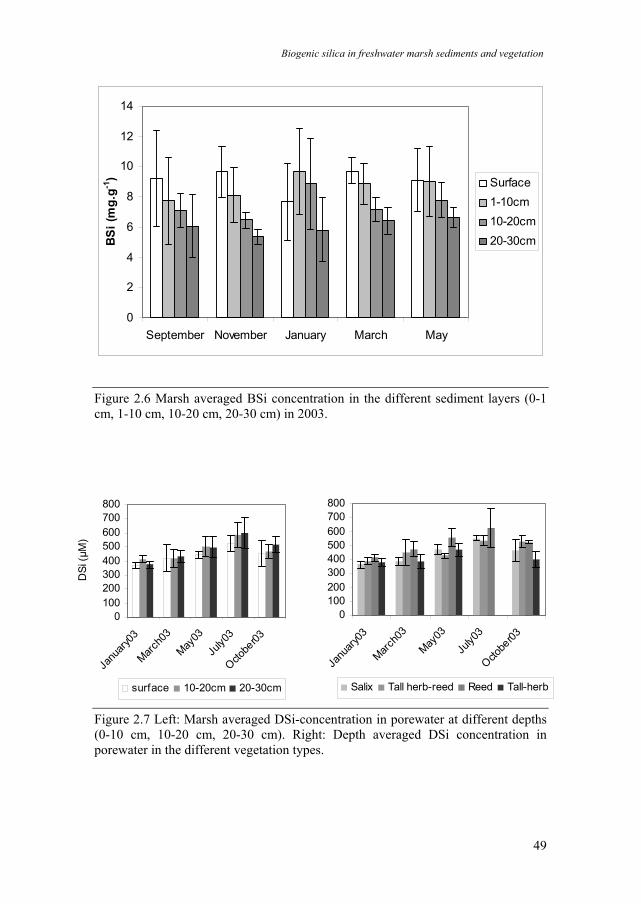
BSi content in the sediment in the pure Phragmites australis vegetation type was generally higher than in the other vegetation types (Fig. 2.5). The whole marsh averaged BSi content in the marsh sediment (Fig. 2.6) was similar during all monitored months. A two way ANOVA with depth and month as class variables showed a significant depth gradient of sediment BSi content (F3,60 = 10.11, p < 0.0001). Highest BSi content was observed in the upper sediment layers (0-1 cm, 9.5 mg g-1 ). BSi content gradually decreased in the deeper sediment layers (1-10 cm, 8.7 mg g-1; 10-20 cm, 7.5 mg g-1, 20-30 cm, 6 mg g-1) (Fig. 2.6). BSi in the 20-30 cm layer was about two-third of the BSi content in the upper 10 cm. Only in January 2003, the upper cm of sediment contained less BSi than the deeper layers. No consistent seasonal variation was observed. On a squared meter basis, sediment was the biggest BSi sink in the marsh, containing on a yearly average basis, 1500 g m-2 BSi in the top 30 cm (Table 2.3).
47
Chapter 2
Average DSi concentration for all vegetation types in the porewater (Fig. 2.7) was highest in summer (500-600 µM) and lowest in winter (350-410µM). DSi in the porewater gradually increased from January to July. Between July and October, DSi concentrations decreased again. The P. australis vegetation had higher porewater DSi concentrations (Fig. 2.7). A three-way ANOVA with depth, time and vegetation type as class variables showed significant seasonal (F4,22 = 20.96, p < 0.000001) and vegetation type (F3,22 = 13.57, p < 0.0001) differences in porewater DSi concentration. No significant depth gradient was observed. Porewater contained around 3 g DSi per m-2 in the top 30 cm (Table 2.3).
0-1 cm
0
2
4
6
8
10
12
14
Septem
ber
Novem
ber
Janu
aryMarc
hMay
BSi (
mg.
g-1)
Pure reed Tall herb-reedTall herb Willow
1-10 cm
0
2
4
6
8
10
12
14
Septem
ber
Novem
ber
Janu
aryMarc
hMay
BSi (
mg.
g-1)
10-20 cm
02468
101214
Septem
ber
Novem
ber
Janu
aryMarc
hMay
Month
BSi (
mg.
g-1)
20-30 cm
02468
101214
Septem
ber
Novem
ber
Janu
aryMarc
hMay
Month
BSi (
mg.
g-1)
Figure 2.5 BSi concentration in the different sediment layers (0-1 cm, 1-10 cm, 10-20 cm and 20-30 cm) of the marsh throughout the year 2003. Variation observed over the different vegetation types.
48
Biogenic silica in freshwater marsh sediments and vegetation
0
2
4
6
8
10
12
14
September November January March May
BSi
(mg.
g-1
Figure 2.6 Marsh averaged BSi concentration in the different sediment layers (0-1 cm, 1-10 cm, 10-20 cm, 20-30 cm) in 2003.
) Surface1-10cm10-20cm20-30cm
0100200300400500600700800
anua
ry03
March0
3
May03
July0
3
Octobe
r03
DSi
(µM
)
surface 10-20cm 20-30cm
0100200300400500600700800
Janu
ary03
March0
3
May03
July0
3
Octobe
r03
Salix Tall herb-reed Reed Tall-herb
J
Figure 2.7 Left: Marsh averaged DSi-concentration in porewater at different depths (0-10 cm, 10-20 cm, 20-30 cm). Right: Depth averaged DSi concentration in porewater in the different vegetation types.
49
Chapter 2
2.5 Discussion Of the plant species studied, Phragmites australis accumulated most BSi. Wetland grasses in general are known as silicon accumulators, taking up DSi faster than would be expected from a non-selective entry of DSi with water (Raven 2003). Silicon accumulators contain large amounts of Si relative to dry weight (> 10 mg g-1, Ma et al. 2001). Generally, monocotyledons (e.g. P. australis) contain more BSi in their tissues compared to dicotyledons. Indeed, Impatiens glandulifera, Salix sp. and Epilobium hirsutum, all dicotyledons, contained much less BSi than P. australis. I. glandulifera, Salix sp. and E. hirsutum could be identified as non-accumulators, which actively exclude DSi from the plant (BSi content < 5 mg g-1, Ma et al. 2001). Urticales are an intermediate category between accumulators and non-accumulators (Ma et al. 2001). The relatively high BSi content observed in Urtica dioica (between 5 and 10 mg g-1) was also in accordance to this observation. Different strategies concerning DSi uptake, may explain why in U. dioica leafs contained more BSi than shoots, while in P. australis it was opposite and shoots contained more BSi than leafs. BSi in plant tissue is mainly deposited at sites with highest transpiration (e.g. leafs), where transported water is saturated for DSi, resulting in deposition. P. australis, in contrast to U. dioica, actively enhances DSi concentration in water taken up by the roots. Saturation and deposition of Si can therefore already occur in the shoots. Deposition of BSi in the shoots enhances P. australis’ capacity to withstand tidal and wind sheer stress in the marsh, and could partially explain its dominance in the system. Phragmites australis accumulated BSi in its tissue in a linear way during the entire growing season. Linear accumulation of BSi was also observed in Epilobium hirsutum and Urtica dioica, but in contrast to P. australis, it only started from a certain shoot length. Impatiens glandulifera, E. hirsutum and U. dioica all contained relatively high BSi in young plants (shoot length < 50 cm). Accumulation patterns reflect the ability of marsh vegetation to act as a silica sink in tidal wetlands, immobilising Si until decomposition occurs.
50

Biogenic silica in freshwater marsh sediments and vegetation
Delayed accumulation in I. glandulifera and E. hirsutum could result from these species actively excluding Si from their tissue. Silica is deposited at sites of major transpirational water losses, and the amount of BSi deposited per unit dry weight depends on the quantity of water transpired per unit dry matter gain and the quantity of DSi taken up per unit water transpired (Raven 2003). Relative biomass gain per unit time was highest in the young plants. Fast accumulation of biomass combined with low amounts of DSi taken up by the non-accumulators could result in an initial decrease in BSi content. In Urtica dioica, delayed accumulation may also result from retranslocation of biomass from rhizomes to aboveground biomass in the early growing season. Roots in general contain low amounts of BSi, because absorbed Si is transferred from roots to shoots and deposition occurs at sites of biggest water loss (Epstein 1994). All non-rhizome root biomass sampled in the Tielrode marsh accordingly contained low amounts of BSi. Dead Phragmites australis shoots contained high BSi contents compared to living shoots. Nitrogen and organic carbon are more labile plant elements than BSi (Eleuterius & Lanning 1987). As these more labile components leached from the plant tissue, the BSi content of the dead shoots increased. Leaching of labile components could also explain the high BSi content observed in decomposing Epilobium hirsutum, Urtica dioica and Impatiens glandulifera shoots. However, litter of fallen P. australis shoots, covering the surficial marsh sediments, contained only about one half to one third of BSi observed in dead standing shoots, indicating fast dissolution of BSi once a shoot has collapsed. In contrast to non-rhizomeous roots, considerable BSi content was observed in P. australis rhizomes. This is in contrast to results obtained in Ontario (Canada), where no or very little BSi was detected in P. australis rhizomes, except for some leaf like outer bracts (Sangster 1982). Si accumulation in rhizomes could however be age and environmentally related. Very few studies have focused on this issue yet. In the same study (Sangster 1982), Si deposits were found in the rhizomes of P. australis clones which differed from the Ontario clones as to age, size, soil type and origin. These deposits were detected in epidermal cells and around the outer side of air canals in the outer cortex.
51
Chapter 2
The variability in BSi content, both between rhizomes of different age and size and between rhizomes of different clones, could explain the variation observed in BSi content of rhizomes at our study site. Seasonal variability due to retranslocation of BSi is most unlikely, as Si is immobilized after deposition in the aboveground biomass. BSi in marsh sediments is mostly attributable to diatom BSi imported during flood, BSi produced by benthic autochthonous marsh diatoms and plant phytoliths buried after a plant decays. BSi concentrations measured in the upper 10 cm of the freshwater marsh sediments were comparable to BSi measured at a mesohaline tidal marsh in North Carolina (USA) (Norris & Hackney 1999). However, total amounts of BSi stored in the freshwater marsh sediments were much higher compared to the mesohaline tidal marsh (597 g m-2 vs. 82 g m-2 in the upper 10 cm), because of higher bulk density of the sediment at our study site. A clear depth gradient was apparent, with BSi content highest in the upper layers. This depth gradient shows the capacity of freshwater marsh sediments to act as an important DSi source to the estuarine ecosystem in periods of DSi depletion. This recycling capacity was shown during the whole tidal ecosystem exchange studies (chapter 3 and 4). The older sediment, which is buried deeper in the marsh, has lost a substantial part of about one-third of its amorphous silica through dissolution of DSi to the porewater. The porewater is drained from the tidal marsh at flood tides and recycled DSi is resupplied to the estuarine system. No clear seasonal variation of BSi content in the marsh sediments was observed. This is probably because of the large capacity of marsh systems to trap BSi. The upper 30 cm of sediments in our study area (3500 m2) would, according to the measured BSi concentrations, contain around 5,3 tons (+/- 2,0 tons) of BSi. The export of DSi from the same marsh system to the main channel is reported to be around 100-200 kg each year (chapter 3 and 4). Considering the large amount of BSi measured in the sediments, it would be impossible to distinguish any interannual variation in BSi content resulting from this DSi export from the marsh. The sediments underneath the P. australis vegetation generally contained more BSi than sediments in other vegetation types. This could show that along with BSi import to the marsh from the main river channel at high tide, burial of P. australis phytoliths could also attribute to BSi accumulation in the marsh sediments (although in chapter 6, it is shown that P. australis BSi recycling is very efficient).
52
Biogenic silica in freshwater marsh sediments and vegetation
DSi concentrations in porewater in natural tidal marshes range between 130 and 650 µM. The Tielrode marsh ecosystem is situated at the high end of this range. The DSi concentration in the freshwater marsh porewater was highest in summer and lowest in winter. A similar trend was reported in North Carolina in a mesohaline tidal marsh (Norris & Hackney 1999). Dissolution of BSi into the porewater is enhanced by higher temperature and bacterial activity. High porewater DSi concentrations in summer further add to marsh DSi recycling capacity, as recyling is highest in periods of low DSi concentrations in the main river channel. Based on a porewater volume of 67 % (Van De Moortel & Deckers 1998), the total amount of DSi stored in the studied freshwater marsh is around 10 kg. Compared to the yearly DSi export of around 100-200 kg, it is clear that porewater drainage is well capable of being the driving force for DSi export to the main river channel. Using aboveground Phragmites australis and tall herb biomass production data in different vegetation types, it was possible to estimate total BSi stored in aboveground vegetation in freshwater marshes. The total area of freshwater marshes along the Scheldt is about 450 ha, although this area could increase in the future through environmental restoration projects. About 200 ha are covered with Salix sp., while the tall herb vegetation and P.australis dominated vegetation each cover about 50 ha. The other 150 ha is mainly covered with individual trees and poplar woods, which were not present in the study area, and these vegetation types were left out of extrapolation. At peak biomass in September, aboveground herbaceous vegetation contained about 75-130 tons of BSi, 70-125 tons of which were stored in P. australis. In our extrapolations, aboveground tree nd shrub biomass (Salix sp.) was not incorporated, due to lack of data about biomass production of Salix sp. along the Scheldt. However, Salix sp. contained very low amounts of BSi compared to Phragmites. Low observed BSi contents in roots were reflected in only 5-10 tons of BSi stored in non-rhizomeous roots in the upper 30 cm. BSi in P. australis rhizomes would account for about 10-20 tons of BSi, if we estimate rhizome biomass production at 2500 g.m-2 (Schierup 1978; Asaeda & Karunaratne 2000). In total, root and aboveground biomass along the freshwater Scheldt contained 90-160 tons of BSi.
53
Chapter 2
The upper 30 cm of sediment along the freshwater Scheldt estuary was estimated to contain 4000-9000 tons of BSi over 450 ha. The amount of BSi stored in the sediment is by far the largest stock of BSi in the freshwater tidal zone of the estuary. Still, the export of DSi from freshwater tidal marshes to the adjacent estuarine waters was estimated to be around 100-200 tons yearly in the Scheldt freshwater (chapter 3 and 4), with this export contributing significantly to DSi availability in nearby coastal waters in summer and spring months. Given the high turnover of the reed and tall-herb vegetations in the studied freshwater marsh (and freshwater marshes in general), recycling of DSi from litter could still contribute significantly to estuarine Si cycling, despite relatively low amounts of BSi stored in vegetation compared to sediment. For another freshwater marsh along the Scheldt estuary, we have modelled the sequestration of BSi in the sediment, through the combination of short-term year round sediment trap data with a long-term sedimentation model (chapter 5). 40 % of the BSi imported with tidal floodwater was found to be ultimately buried in the marsh sediments, with the other 60 % being recycled as DSi. About 7 % of the yearly discharge of BSi through the freshwater estuary was estimated to be deposited on freshwater marshes (40 g m-2 y-1). This clearly shows that the marsh sediments not only present a very large BSi stock along estuarine waters; the stock is also subject to significant exchange processes with the nearby coastal waters. Freshwater tidal marshes are huge reservoirs of BSi, available for recycling of DSi when concentrations in the nearby coastal waters become depleted. The only comparable tidal marsh study was conducted in a mesohaline tidal marsh in North Carolina (Norris & Hackney 1999). The amount of BSi stored in the upper 10 cm in our study was high compared to the mesohaline marsh study (597 g m-2 vs. 82 g m-2), and in the Phragmites australis vegetation, the BSi content was about tenfold the content in the mesohaline Juncus roemerianus and Spartina alterniflora vegetation (85 g m-2 vs. 7.1 g m-2). The stocks in the aboveground Phragmites australis vegetation were comparable to those found in an Amazon rain forest (83.4 g BSi m-2) (Lucas et al. 1993), while BSi in the upper 30 cm of sediment was comparable to phytolith content in the soil of an equatorial rain forest in Congo (1124 g BSi m-2) (Alexandre et al. 1997). BSi in aboveground biomass was much higher compared to a deciduous forest (~18 g BSi m-2) (Bartoli 1983) and a coniferous forest (~9 g BSi m-2) (Bartoli 1983).
54
Biogenic silica in freshwater marsh sediments and vegetation
Around 80 % of the reed is yearly deposited as litter on the marsh floor. The yearly litterfall deposition of BSi in the reed wetland is much higher compared to forest ecosystems (Phragmites australis: 68 g BSi m-2 y-1; forest systems 0.5 – 4.1 g BSi m-2 y-1), and we observed that surface litter contained only half of the BSi found in standing dead shoots, indicating fast recycling. As Phragmites australis is one of the most widely distributed plant species on Earth (Soetaert et al. 2004), reed may not only be an overlooked highly recyclable sink of BSi in estuarine systems, but also in the global biogeochemical cycle of Si, in which the important role of terrestrial fixation of BSi in plants has only recently been recognized (Conley 2002).
55
Chapter 2
2.6 References - Alexandre A, Meunier JD, Colin F, Koud J-M (1997) Plant impact on the biogeochemical cycle of silicon and related weathering processes. Geochimica et Cosmochimica Acta 61:677-682 - Asaeda T, Karunaratne S (2000) Dynamic modeling of the growth of Phragmites australis: model description. Aquatic Botany 67: 301-318 - Baeyens W (1998) Evolution of trace metal concentrations in the Scheldt estuary (1978-1995). A comparison with estuarine and ocean levels. Hydrobiologia 366: 157-167 - Bartoli F (1983) The biogeochemical cycle of silicon in two temperate forest ecosystems. Ecological Bulletin 35:469-476 - Billen G, Garnier J, Ficht A, Cun C (2001) Modeling the response of water quality in the Seine river estuary to human activity in its watershed over the last 50 years. Estuaries 24: 977-993 - Boderie PMA, Zwolsman JJG, Van Eck GTM, Van Der Weijden CH (1993) Nutrient biogeochemistry in the water column (N, P, Si) and porewater (N) of sandy sediment of the Scheldt estuary (SW-Netherlands). Netherlands Journal of Aquatic Ecology 27: 309-318 - Conley DJ (2002) Terrestrial ecosystems and the global biogeochemical silica cycle. Global Biogeochemical Cycles 16: 1121, doi:10.1029/2002GB001894 - DeMaster DJ (1981) The supply and accumulation of silica in the marine environment. Geochimica et Cosmochimica Acta 45: 1715-1732 - Eleuterius LN, Lanning FC (1987) Silica in relation to plant decomposition of Juncus roemerianus. Journal of Coastal Research 3: 531-534 - Epstein E (1994) The anomaly of silicon in plant biology. Proceedings of the National Academy of Sciences U.S.A. 91: 11-17 - Glantz MH (1992) Climate variability, climate change, and fisheries. Cambridge University Press, New York, 450 pp - Hackney CT, Cahoon LB, Prestos C & Norris A (2000) Silicon is the link between tidal marshes and estuarine fisheries: a new paradigm. In: Weinstein MP & Kreeger DA (eds) Concepts and controversies in tidal marsh ecology, pp 543-552, Kluwer Academic Publishers, London - Heip C (1988) Biota and abiotic environments in the Westerschelde estuary. Hydrobiological Bulletin 22: 31-34 - Lancelot C (1995) The mucilage phenomenon in the continental coastal waters of the North-Sea. Science of the Total Environmont 165 : 83-102 - Lucas Y, Luizao A, Chauvel A, Rouiller J, Nahon D (1993) The relation between biological activity of the rain forest and mineral composition of soils. Science 260, 521-523
56
Biogenic silica in freshwater marsh sediments and vegetation
- Ma JF, Miyake Y, Takahashi E (2001) Silicon as a beneficial element for crop plants. In: Datnoff LE, Snyder GH, Korndörfer GH (eds) Silicon in agriculture. Studies in plant science, 8, pp. 17-39, Elsevier, Amsterdam, The Netherlands - Mann KH (1988) Production and use of detritus in various freshwater, estuarine and coastal marine ecosystems. Limnology & Oceanography 33: 910-930 - Meunier JD (2003) Le rôle des plantes dans le transfert du silicium à la surface des continents. Comptes Rendus Geoscience 335 : 1199-1206 - Meyerson LA, Saltonstall K, Windham L, Kiviat E, Findlay S (2000). A comparison of Phragmites australis in freshwater and brackish marsh environments in North America. Wetlands Ecology and Management 8: 89-103 - Norris AR, Hackney CT (1999) Silica content of a mesohaline tidal marsh in North Carolina. Estuarine Coastal & Shelf Science 49: 597-605 - Peterson BJ, Howarth RW (1987) Sulfur, carbon and nitrogen isotopes used to trace organic matter flow in the salt-marsh estuaries of Sapelo Island, Georgia. Limnology & Oceanography 32: 1195-1213 - Postma H, Zijlsta JJ (1988) Continental shelves. Ecosystems of the world, 27. Elsevier, Amsterdam, 421 pp - Raven JA (1983) The transport and function of silicon in plants. Biological Revues of the Cambridge Philosophical Society 58: 179-207 - Raven JA (2003) Cycling silicon – the role of accumulation in plants. New Phytologist 158: 419-421 - Sangster AG (1982) Anatomical features and silica depositional patterns in the rhizomes of the grasses Sorghastrum natans and Phragmites australis. Canadian Journal of Botany 61: 752-761 - Schelske CL, Stoermer EF, Conley DJ, Robbins JA, Glover RM 1983. Early eutrophication in the lower Great Lakes: new evidence from biogenic silica in sediments. Science 222: 320-322 - Schierup HH (1978). Biomass and primary production in a Phragmites communis swamp in North Jutland, Denmark. Proceedings of the International Association of Theoretical and Applied Limnology 20: 94-99 - Sherman K, Alexander LM, Gold BD (1991) Food chains, yields, models and management of large marine ecosystems. Westview Press, Boulder, 320 pp. - Smayda TJ (1997) Bloom dynamics: physiology, behavior, tropic effects. Limnology & Oceanography 42: 1132-1136 - Soetaert K, Hoffmann M, Meire P, Starink M, Van Oevelen D, Van Regenmortel S, Cox T (2004) Modeling growth and carbon allocation in two reed beds (Phragmites australis) in the Scheldt. Aquatic Botany 79: 211-234
57
Chapter 2
- Sullivan MJ, Moncreiff CA (1990) Edaphic algae are an important component of salt marsh food webs: evidence from multiple stable isotope analyses. Marine Ecology Progress Series 62: 149-159 - Van de Moortel R, Deckers J (1998). Bodemkundige karakterisatie van gecontroleerde overstromingsgebieden en schorren. Katholieke Universiteit Leuven, Interne publikatie nr. 51
58