biogas from livestock manure - core.ac.uk · sintef lab, and helping me ... stortingsmelding nr. 39...
TRANSCRIPT
Biogas from Livestock ManureMicrobial Community Analysis of Biogas
Reactors
Ida Renèe Jacobsen Forsberg
Chemical Engineering and Biotechnology
Supervisor: Kjetill Østgaard, IBTCo-supervisor: Anna Synnøve Røstad Nordgård, IBT
Department of Biotechnology
Submission date: July 2012
Norwegian University of Science and Technology


Declaration
I
Declaration
This master thesis is executed independently, and in accordance with the
examination regulations at Norwegian University of Science and Technology (NTNU).
Trondheim 16.07.2012
_________________________
Ida-Renée Jacobsen Forsberg

II

Preface
III
Preface
This master thesis was created to support the research of PhD candidate Anna
Synnøve Røstad Nordgård. It was announced by the Institute of Biotechnology,
Norwegian University of Science and Technology, during the fall of 2011, and
assigned to the master student in October. It was executed during the spring of 2012
at the Institute of Biotechnology.
I would like to thank everyone who has helped me:
First, and mainly, I would thank PhD candidate and advisor Anna Synnøve Røstad
Nordgård for her exceptional support and help. Without her patience and guidance, I
would have been lost.
Professor and supervisor Kjetill Østgaard, thank you for the opportunity to work with
this thesis. I have learned a lot, and received many helpful advices from you.
Researcher Ingrid Bakke, for practical help and valuable advises on PCR and DGGE.
Researcher Kjell Domaas Josefsen, for letting me use the anaerobe equipment at the
SINTEF lab, and helping me change nitrogen tanks when necessary.
I would also thank PhD candidate Wenche Bergland at Telemark University College
and farmer Knut Vasdal at Foss farm, for sampling and safe transportation of the
samples to Trondheim. Your job has been indispensable, and the extra effort you put
in packing the samples made my job much more pleasant.
Trondheim, 16.07.2012
_________________________
Ida-Renée Jacobsen Forsberg

Abstract
IV
Abstract
V
Abstract
The aim of this experiment was to monitor the microbial communities in two biogas
reactors and evaluate the efficiency of denaturing gradient gel electrophoresis
(DGGE) as a technique for visualizing shifts in the microbial compositions. The
reactors were followed from September 2011 to May 2012. The first reactor is a pilot
scale upflow anaerobic sludge blanket (UASB) reactor situated at Foss farm outside
of Porsgrunn, running on cow manure. The second reactor is lab scale and situated
at Telemark University College, running on pig manure. Samples were taken from the
reactors at regular intervals.
DNA was extracted from the samples and amplified by polymerase chain reaction
(PCR). The primers were 338f and 518r, targeting the 16S rDNA sequence. Changes
in the microbial diversity were detected by DGGE in both reactors. Some bands
appeared and other disappeared during the period. These changes could not be
correlated to changes in operating conditions. This was probably because DGGE
reflects cell amounts and not microbe activity levels.
DGGE is a highly reproducible and consistently performing fingerprinting technique. It
is capable of reflecting long term shifts in the microbial communities and several
samples can be compared in one gel. This makes DGGE an effective method for
monitoring reactors over time.
Several DGGE bands were excised and sequenced, but the results were either
negative, or of too poor quality, for further analysis. The probable cause was
insufficient separation of bands leading to multiple sequences in the extracted DNA.
This may be overcome by using a more specific primer set to reduce the amount of
bands.

Abstract
VI
Abstract
VII
Sammendrag
Målet med dette forsøket var å overvåke det mikrobielle samfunnet i to
biogassreaktorer og evaluere effektiviteten av «denaturing gradient gel
electrophoresis» (DGGE) som metode for å visualisere endringer i den mikrobielle
sammensetningen. Reaktorene ble fulgt fra september 2011 til may 1012. Den ene
reaktoren var en «upflow anaerobic sludge blanket» (UASB) reaktor i pilotskala på
Foss gård utenfor Porsgrunn, basert på kugjødsel. Den andre var en labskala
reaktoren på Høyskolen i Telemark, basert på grisegjødsel. Prøver ble tatt fra
reaktorene jevnlig.
DNA ble ekstrahert fra prøvene og amplifisert med «polymerase chain reaction»
(PCR). Primerne som ble brukt var 338f og 518r, med 16S rRNA som målsekvens .
Ved DGGE analyse ble endringer i begge reaktorene påvist. Flere bånd oppsto eller
ble borte i løpet av perioden. Disse forandringene kunne ikke knyttes direkte til
endringer i driftsbetingelser. Dette var antakelig fordi DGGE reflekterer mengden
celler tilstede, og ikke det mikrobielle aktivitetsnivået.
DGGE er en meget reproduserbar metode med gjennomgående gode resultater. Den
er i stand til å gjengi langtidsendringer i det mikrobielle samfunnene og flere prøver
kan sammenliknes på en gel. Dette gjør DGGE til en effektiv måte å overvåke
reaktorer over tid.
Flere DGGE bånd ble klippet ut og sekvensiert, men resultatene var enten misslykket
eller av så dårlig kvalitet at videre analyser var umulig. Dette skyldes antaklig for
dårlig separering av båndene, noe som førte til flere sekvenser i det ekstraherte
DNA. Dette kan løses ved å bruke en mer spesifik primer for å redusere antallet
bånd.

Abstract
VIII
Abbrivations
IX
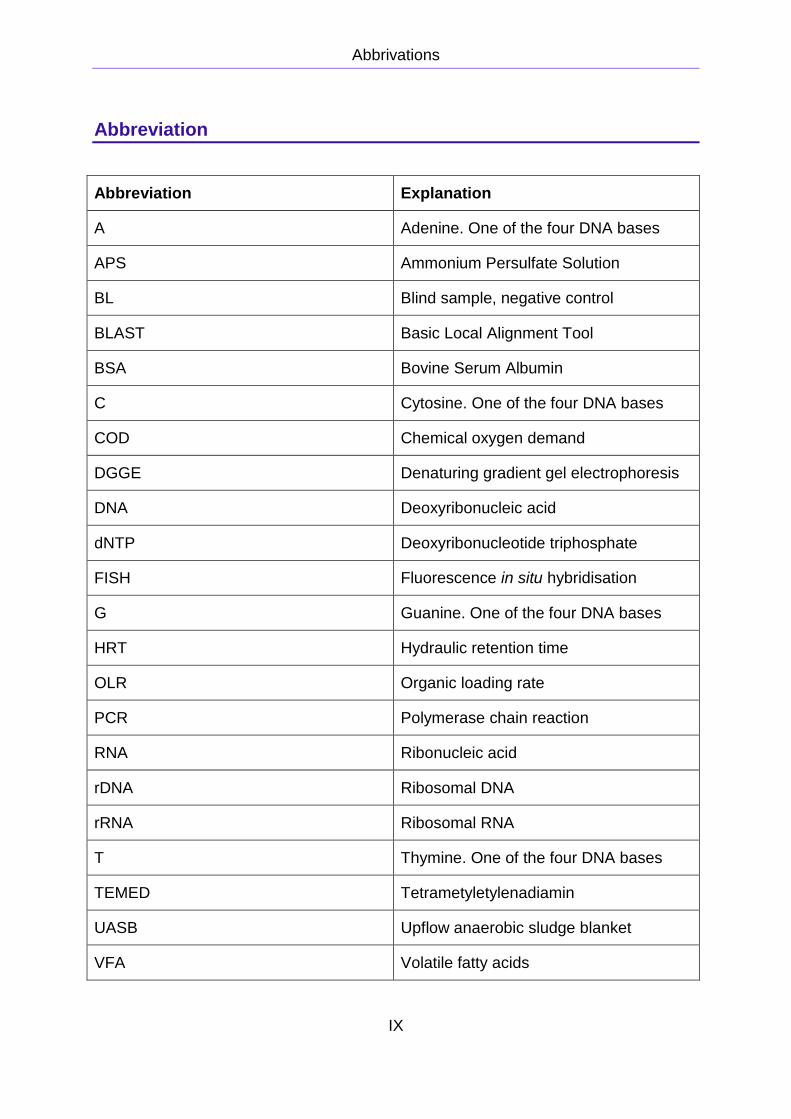
Abbreviation
Abbreviation Explanation
A Adenine. One of the four DNA bases
APS Ammonium Persulfate Solution
BL Blind sample, negative control
BLAST Basic Local Alignment Tool
BSA Bovine Serum Albumin
C Cytosine. One of the four DNA bases
COD Chemical oxygen demand
DGGE Denaturing gradient gel electrophoresis
DNA Deoxyribonucleic acid
dNTP Deoxyribonucleotide triphosphate
FISH Fluorescence in situ hybridisation
G Guanine. One of the four DNA bases
HRT Hydraulic retention time
OLR Organic loading rate
PCR Polymerase chain reaction
RNA Ribonucleic acid
rDNA Ribosomal DNA
rRNA Ribosomal RNA
T Thymine. One of the four DNA bases
TEMED Tetrametyletylenadiamin
UASB Upflow anaerobic sludge blanket
VFA Volatile fatty acids

Abbrivations
X
Table of contents
XI
Table of contents
DECLARATION I
PREFACE III
ABSTRACT V
SAMMENDRAG VII
ABBREVIATION IX
TABLE OF CONTENTS XI
1 INTRODUCTION 1
1.1 THE CLIMATE CHALLENGE ............................................................................................... 1
1.2 ANAEROBIC FERMENTATION OF ORGANIC MATERIAL TO BIOGAS ........................................ 2
1.2.1 THE SUBSTRATES ......................................................................................................... 2
1.2.2 BIOGAS FORMATION...................................................................................................... 3
1.2.3 THE MICROBIAL COMMUNITY .......................................................................................... 6
1.3 MOLECULAR BIOLOGICAL METHODS FOR MICROBIAL ANALYSIS ......................................... 7
1.3.1 PRINCIPLE OF DENATURING GRADIENT GEL ELECTROPHORESIS (DGGE) ........................ 8
1.4 THE PROJECT OBJECTIVES .............................................................................................. 9
2 METHODS AND EXPERIMENTAL DESIGN 11
2.1 THE BIOGAS REACTORS .................................................................................................11
2.1.1 THE PILOT SCALE BIOGAS REACTOR ON FOSS FARM, BASED ON COW MANURE .................11
2.1.2 THE LAB SCALE REACTOR AT TELEMARK UNIVERSITY COLLEGE, BASED ON PIG MANURE ..14
2.2 SAMPLES: EXTRACTION AND STORAGE ...........................................................................18
2.3 EXTRACTION OF DNA BY POWERSOIL DNA ISOLATION KIT .............................................22
2.4 AMPLIFICATION OF DNA BY PCR ...................................................................................23
2.4.1 THE AMPLIFICATION PRIMERS .......................................................................................23
2.4.2 PCR PROTOCOL FOR AMPLIFICATION OF DNA ...............................................................24
2.5 FINGERPRINTING BY DGGE ............................................................................................26
Table of contents
XII
3 RESULTS 29
3.1 DGGE ANALYSIS OF THE COW MANURE REACTOR ...........................................................29
3.2 DGGE ANALYSIS OF THE PIG MANURE REACTOR .............................................................31
3.3 SEQUENCING OF EXCISED DGGE BANDS ........................................................................33
4 DISCUSSION 41
4.1 DGGE GEL ANALYSIS ....................................................................................................41
4.1.1 REACTOR BASED ON COW MANURE ...............................................................................41
4.1.2 REACTOR BASED ON PIG MANURE .................................................................................43
4.1.3 COMPARISON OF THE DGGE GELS FROM THE TWO REACTORS .......................................45
4.2 POSSIBLE WEAKNESSES WITH THE PCR-DGGE TECHNIQUE ............................................46
4.2.1 PCR-DGGE ANALYSIS ................................................................................................46
4.2.2 SOURCES OF ERROR WHEN SEQUENCING DNA EXCISED FROM DGGE ...........................48
4.3 DGGE AS A METHOD FOR SUPERVISING ANAEROBIC FERMENTERS ...................................49
4.4 FURTHER WORK .............................................................................................................50
4.4.1 PRIMERS .....................................................................................................................51
4.4.2 SEQUENCING METHODS ...............................................................................................53
4.4.3 FISH ..........................................................................................................................54
5 CONCLUSION 55
REFERENCES 57
APPENDICES
APPENDIX A: PRIMARY DATA FOR THE COW MANURE REACTOR
APPENDIX B: PRIMARY DATA FOR THE PIG MANURE REACTOR
APPENDIX C: PROTOCOL FOR POWERSOIL®DNA ISOLATION KIT
APPENDIX D: PROTOCOL FOR QIAQUICK PCR PURIFICATION KIT
APPENDIX E: PROTOCOL FOR INGENY DGGE SYSTEM

1. Introduction
1
1 Introduction
1.1 The climate challenge
Norway wants to be climate neutral by 2030 (Klima- og forurensningsdirektoratet,
2011), and this will only be possible through reduced emissions. Every part of the
society and industry must contribute to reach this objective.
Only 3 % of the area of Norway is used for agriculture, and it is mainly reserved for
food production. The potential to reduce total emissions and become more climate
neutral is still high in this field. Agriculture can produce, and use, climate neutral
energy in the form of biogas from manure. This gas can be used to produce
electricity, heat, and fuel. Biogas production from manure is fast growing in e.g.
Germany, Sweden, and Denmark, but not yet in Norway. (Det Kongelige Landbruks-
og Matdepartementet, 2008 - 2009)
Only a small amount of the manure is used in biogas production I Norway today.
Increasing the amount of manure utilized will give a double effect; the emission of
methane produced by manure degradation is reduced, and climate neutral energy is
produced. The manure can still be used as fertilizer after the production of biogas, so
no resources are lost during the process. (Det Kongelige Landbruks- og
Matdepartementet, 2008 - 2009)
Stortingsmelding nr. 39 (Det Kongelige Landbruks- og Matdepartementet, 2008 -
2009) states that biogas production is a priority area to be focused on in the following
years. The aim is for 30 % of the manure to be used in biogas production by 2030.
The technology of small-scale biogas reactors in Norway is still new, and not yet
optimized. The high initial investment costs, combined with low electricity prices,
makes cost effective production challenging. Some countries have governmental
subsidies of biogas reactors, but there is no such initiative in Norway to day.
Based on the requirement for more knowledge in the field, a project named “Biogas
Reactor Technology for Norwegian Agriculture” (BIONA) was started in 2011. It is
financed by The Research Counsel of Norway and coordinated by Bioforsk. The
primary objective is “to make biogas reactor technology cost effective, robust and
1. Introduction
2
well adapted for use in Norwegian agriculture” (Norges Forskningsråd). Analyses of
the microbial communities in such reactors are one part of the research needed to
achieve the goal of an optimized process.
1.2 Anaerobic fermentation of organic material to biogas
1.2.1 The substrates
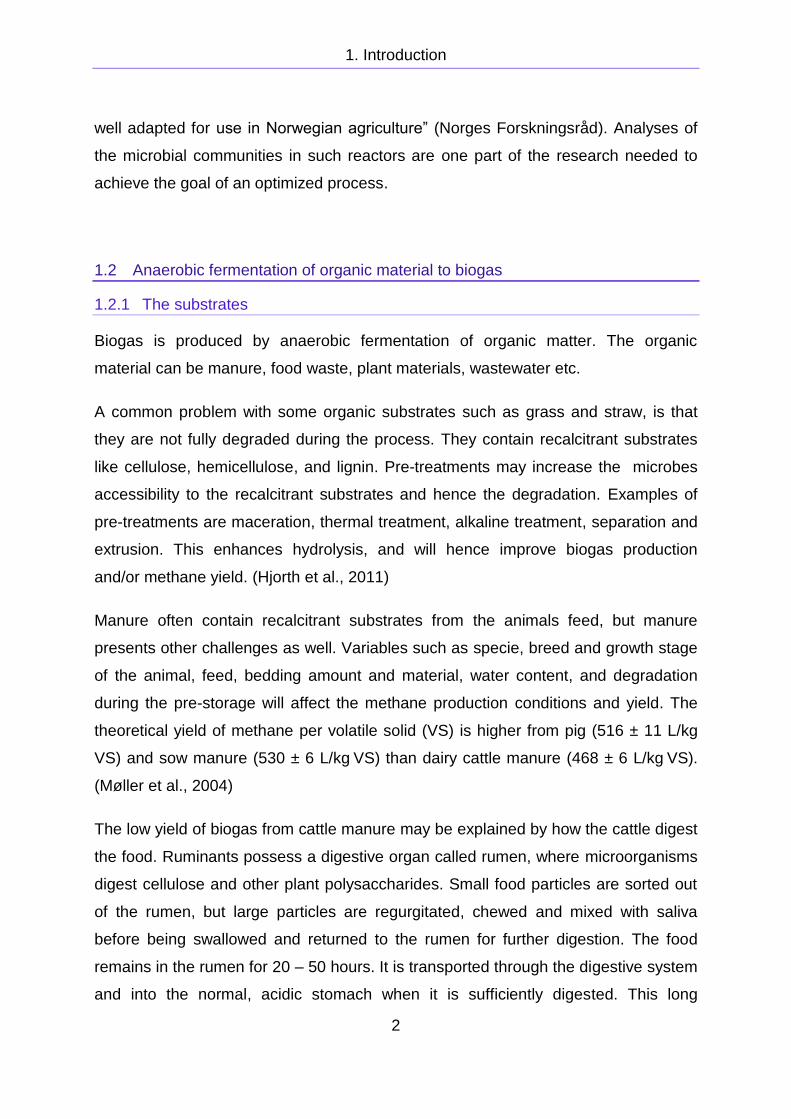
Biogas is produced by anaerobic fermentation of organic matter. The organic
material can be manure, food waste, plant materials, wastewater etc.
A common problem with some organic substrates such as grass and straw, is that
they are not fully degraded during the process. They contain recalcitrant substrates
like cellulose, hemicellulose, and lignin. Pre-treatments may increase the microbes
accessibility to the recalcitrant substrates and hence the degradation. Examples of
pre-treatments are maceration, thermal treatment, alkaline treatment, separation and
extrusion. This enhances hydrolysis, and will hence improve biogas production
and/or methane yield. (Hjorth et al., 2011)
Manure often contain recalcitrant substrates from the animals feed, but manure
presents other challenges as well. Variables such as specie, breed and growth stage
of the animal, feed, bedding amount and material, water content, and degradation
during the pre-storage will affect the methane production conditions and yield. The
theoretical yield of methane per volatile solid (VS) is higher from pig (516 ± 11 L/kg
VS) and sow manure (530 ± 6 L/kg VS) than dairy cattle manure (468 ± 6 L/kg VS).
(Møller et al., 2004)
The low yield of biogas from cattle manure may be explained by how the cattle digest
the food. Ruminants possess a digestive organ called rumen, where microorganisms
digest cellulose and other plant polysaccharides. Small food particles are sorted out
of the rumen, but large particles are regurgitated, chewed and mixed with saliva
before being swallowed and returned to the rumen for further digestion. The food
remains in the rumen for 20 – 50 hours. It is transported through the digestive system
and into the normal, acidic stomach when it is sufficiently digested. This long
1. Introduction
3
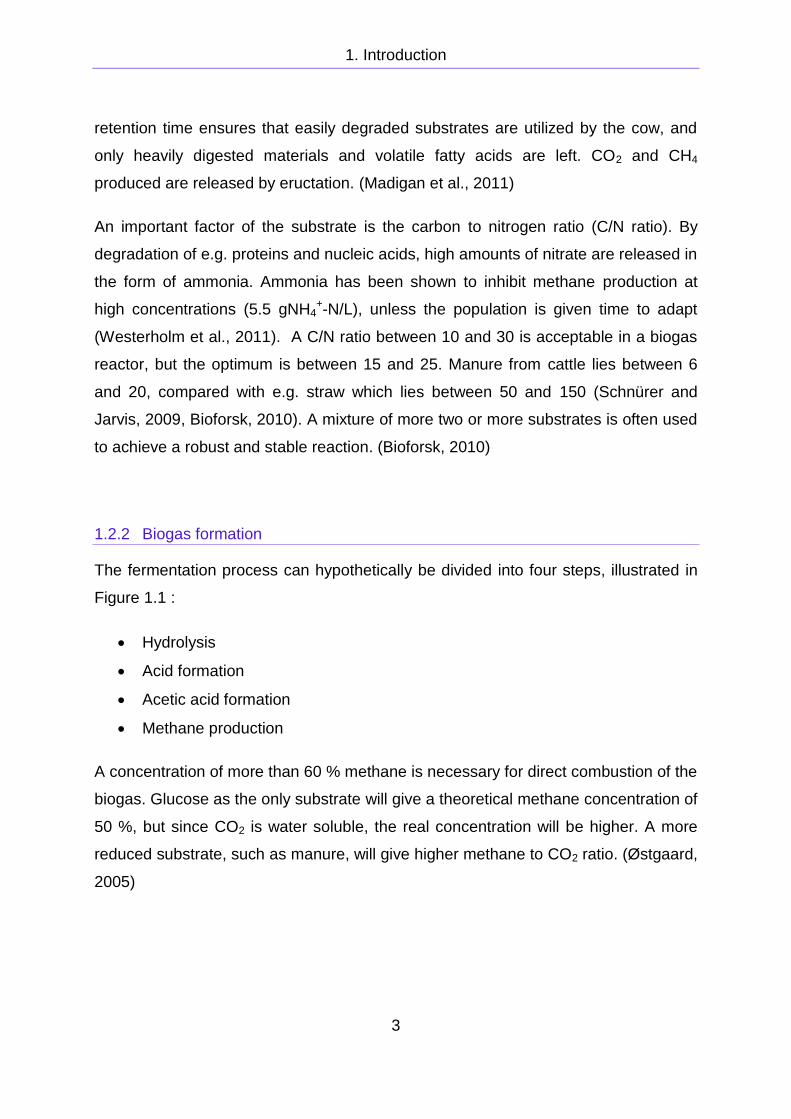
retention time ensures that easily degraded substrates are utilized by the cow, and
only heavily digested materials and volatile fatty acids are left. CO2 and CH4
produced are released by eructation. (Madigan et al., 2011)
An important factor of the substrate is the carbon to nitrogen ratio (C/N ratio). By
degradation of e.g. proteins and nucleic acids, high amounts of nitrate are released in
the form of ammonia. Ammonia has been shown to inhibit methane production at
high concentrations (5.5 gNH4+-N/L), unless the population is given time to adapt
(Westerholm et al., 2011). A C/N ratio between 10 and 30 is acceptable in a biogas
reactor, but the optimum is between 15 and 25. Manure from cattle lies between 6
and 20, compared with e.g. straw which lies between 50 and 150 (Schnürer and
Jarvis, 2009, Bioforsk, 2010). A mixture of more two or more substrates is often used
to achieve a robust and stable reaction. (Bioforsk, 2010)
1.2.2 Biogas formation
The fermentation process can hypothetically be divided into four steps, illustrated in
Figure 1.1 :
Hydrolysis
Acid formation
Acetic acid formation
Methane production
A concentration of more than 60 % methane is necessary for direct combustion of the
biogas. Glucose as the only substrate will give a theoretical methane concentration of
50 %, but since CO2 is water soluble, the real concentration will be higher. A more
reduced substrate, such as manure, will give higher methane to CO2 ratio. (Østgaard,
2005)

1. Introduction
4
Figure 1.1: Anaerobic fermentation of organic matter to methane and CO2
(Østgaard, 2005).
The first step is hydrolysis, were organic components such as fat, proteins and
carbohydrates decompose to more accessible substrates such as lipids, fatty acids,
polypeptides, amino acids and sugars in addition to hydrogen and CO2. Hydrolysis is
a slow process, and normally the rate limiting step.
Hydrolysis does not produce energy for the microbes in itself, and will therefore be
coupled with acidogenesis. The main product is volatile fatty acids (VFA) such as
acetic acid, propionate and butyrate. CO2 and H2 are also potential products. The

1. Introduction
5
formation of acids from e.g. glucose is energetically favourable, since the change in
Gibbs energy (∆G°’) is negative.
All VFAs, such as propionate, can be converted to acetic acid before methane
formation. This process has a theoretical positive ∆G°’ and is therefore not
spontaneous.
Methanogenic archaea will remove the hydrogen and use it for methane production.
This removal of hydrogen alters the Gibbs energy in acetate formation to a negative
level, making it spontaneous. It is called “interspecies hydrogen transfer” and is a
vital element in the methane production. (Østgaard, 2005)
Hydrolysis coupled with acid formation and methane production can be separated
into different physical compartments. Fast growing acid producing bacteria will lower
pH drastically, unless the acids are used quickly in methane production. Methane
producing organisms are slow growing, with an optimum of pH 6.5 – 8.0. It is
important to regulate pH, especially in the initiation period of a reactor until the
methanogenic archaea population is sufficient. Lowered pH caused by quick acid
formation will inhibit and kill the methane producing archaea, eventually stopping all
biogas production. A two compartment reactor can prevent this by separating
hydrolysis and acid formation into one low pH (≤ 5.5) compartment and the methane
production into a higher pH (pH 6.6 - 8.0) compartment. (Østgaard, 2005)
C6H12O6 + H2 2 CH2COOH + 4 H2 ∆G°’ = - 218 kJ
CH3CH2COOH + H2O 2 CH3COOH + 2 CO2 + 3 H2 ∆G°’ = + 76 kJ
4 H2 + CO2 CH4 + 2 H2O ∆G°’ = - 134 kJ

1. Introduction
6
1.2.3 The microbial community
Hydrolysis and acid formation is carried out by a large consortium of bacteria, called
acidogenic bacteria (Østgaard, 2005). Some of the genera involved are Bacteroids,
Bifidobacteria, Clostridium, Escherichia, Lactobacillus, and Proteus (Gerardi, 2006).
Examples of bacteria hydrolyzing cellulose in particular, are Clostridium
thermocellum, Acetivibrio cellulolyticus, Bacteroides succinogenes, and
Ruminococcus flavefaciens (Volfova et al., 1982) .
The acetic acid is formed by acetogenic bacteria such as Syntrophobacter wolinii (C3,
propionate), Syntrophomonas wolfei (C4-C8 fatty acids), Syntrophus gentianae
(aromatic compounds) Clostridium bryantii (alkonic acids < C11), Desulfovibrio, and
Acidaminobacter hydrogenoformans (Lee and Zinder, 1988, Madigan et al., 2011).
Methane is formed by the obligate anaerobic methanogenic archaea in the phylum
Euryarchaeota. They are generally divided into three groups based on the substrate,
see Table 1.1.
Table 1.1: Overview of methanogenic achaea (Madigan et al., 2011).
Group Substrates Example orders
CO2- type, hydrogenotrophic
CO2 and H2 Methanobacteriales, Methancoccales and Methanomicrobiales
Methyl-type Methyl groups, e.g. methanol
Methanosarcinales
Acetoclastic Acetic acid Methanosaeta and Methanosarcina of the
order Methanosarcinales

1. Introduction
7
High amount of ammonia has been shown to shift the methane production
mechanism from acetoclastic methanogenesis to hydrogenotrophic methanogeneisis
and syntrophic acetate oxidation. This is explained by ammonia inhibition of the
acetoclastic families Methanosaetaceae and Methanosacinaceae. Syntrophic acetate
oxidizing bacteria (SAOB) increases in activity when the ammonia levels are
increased. Few SAOBs are known today, but some examples are
Thermacetogenium phaeum (Hattaori et al., 2000), Tepidanaerobacter
acetatoxydans (Westerholm et al., 2011), Syntrophaceticus schinkii (Westerholm et
al., 2010), Clostridium ultenense (Schnürer et al., 1996), and Termotoga lettingae
(Balk et al., 2002).
Estimates based on 16S rDNA analysis made of the microbial community in the
rumen, calculates 300 – 400 bacterial species. Many of these may still be present in
the manure and hence in the biogas reactor. Firmicutes and Bacteroidetes dominate
the Bacteria, while methanogenic organisms dominate Archaea. Fibrobacter
succinogenes and Ruminococcus albus are the main cellulytic rumen anaerobes,
and Rubinobacter amylophilus and Succinomonas amylolytica dominates when the
substrate is starch based. Lactinospira multipara digests legume hay which is high in
pectin. Secondary fermenters such as Schwartzia, Selenomonas, and Megaspaera
are also present. (Madigan et al., 2011)
1.3 Molecular biological methods for microbial analysis
Most organisms cannot be cultivated in a lab, and direct analysis without cultivation is
necessary to get a full picture of the community (Amann et al., 1995). This can be
done by analysing the DNA from the environmental sample with molecular biological
methods instead of using traditional microbiological methods. Examples of such
methods are 16S rDNA sequence analysis by polymerase chain reaction (PCR),
denaturing gradient gel electrophoresis (DGGE) (Muyzer et al., 1993) and
fluorescence in situ hybridization (FISH) (Amann et al., 1995).
The 16S rDNA sequence is commonly used in sequence-based phylogenetic studies
because they are universally distributed and has conserved regions useable for

1. Introduction
8
specie comparison. It is large enough to contain sufficient differences in the
sequence to separate species, but still small enough to be effective (Amann et al.,
1995). By assuming nucleotide changes in DNA accumulate proportional to time, the
information from the 16S rDNA sequence can be used to create phylogenetic threes.
The Ribosomal Database Project II (Cole et al., 2011) contains a collection of 16S
sequences and the database is searchable based on your sequence for comparison
(Madigan et al., 2011).
1.3.1 Principle of Denaturing Gradient Gel Electrophoresis (DGGE)
Denaturing gradient gel electrophoresis (DGGE) is a method used for direct
visualization of microbial diversity (Muyzer et al., 1993). Some of the different
applications of DGGE are to study community complexity, monitor population shifts,
and compare DNA extraction methods.
DGGE separates DNA fragments of the same length based on the GC-content of the
sequence. DNA is extracted from the samples and amplified by PCR with a primer
containing a GC-clamp. All the fragments will be of the same size. A polyacrylamide
gel with a gradient of denaturants (e.g. formamide and urea) is used, starting with a
low concentration on the top, near the wells.
Denaturing agents in the gel will separate the double stranded DNA into single
strands at a given concentration of denaturing agents. This is called the melting point
of the DNA. Melted DNA will be immobilized, and the GC-clamp will prevent a full
denaturation.
Samples with a high GC content will denaturize later in the gel at higher
concentrations of denaturing agents than fragments with lower GC-content. After
staining the gel, bands of DNA with different GC-content can be visualized (Muyzer
and Smalla, 1998, Madigan et al., 2011).
1. Introduction
9
1.4 The project objectives
Each anaerobic fermenter is a unique system defined by the substrate material and
reactor conditions. The microbial community is correspondingly diverse, and the role
of many microorganism involved is still unknown or poorly investigated. This
knowledge is important for better understanding the fermentation process and to be
able to counteract unfavourable changes in the reactor. (Malin and Illmer, 2008)
The purpose of this master thesis was to further develop molecular biological
methods to monitor anaerobic fermentation of manure for biogas production. It was a
continuation of the master thesis by Røstad Nordgård (2010) where methanogenic
archaea was in focus, and the preliminary investigations made by Forsberg (2011).
The aim was to test primers for PCR and DGGE, and to see if changes in the
microbial community were visible through DGGE fingerprinting. The band patterns
were compared between the gels, and analysed with respect to operating conditions
and gas production results. Different bands from the gels was excised and
sequenced. The methods were then evaluated for its use to monitor reactor
efficiency.
The fermenters were a reactor running on cow manure situated at Foss Farm outside
Porsgrunn, and a lab scale reactor running on pig manure at Telemark University
College (TUC) in Porsgrunn. The reactors were sampled about once a month from
September 2011 to April 2012.

1. Introduction
10
2. Methods and experimental design
11
2 Methods and experimental design
2.1 The biogas reactors
2.1.1 The pilot scale biogas reactor on Foss farm, based on cow manure
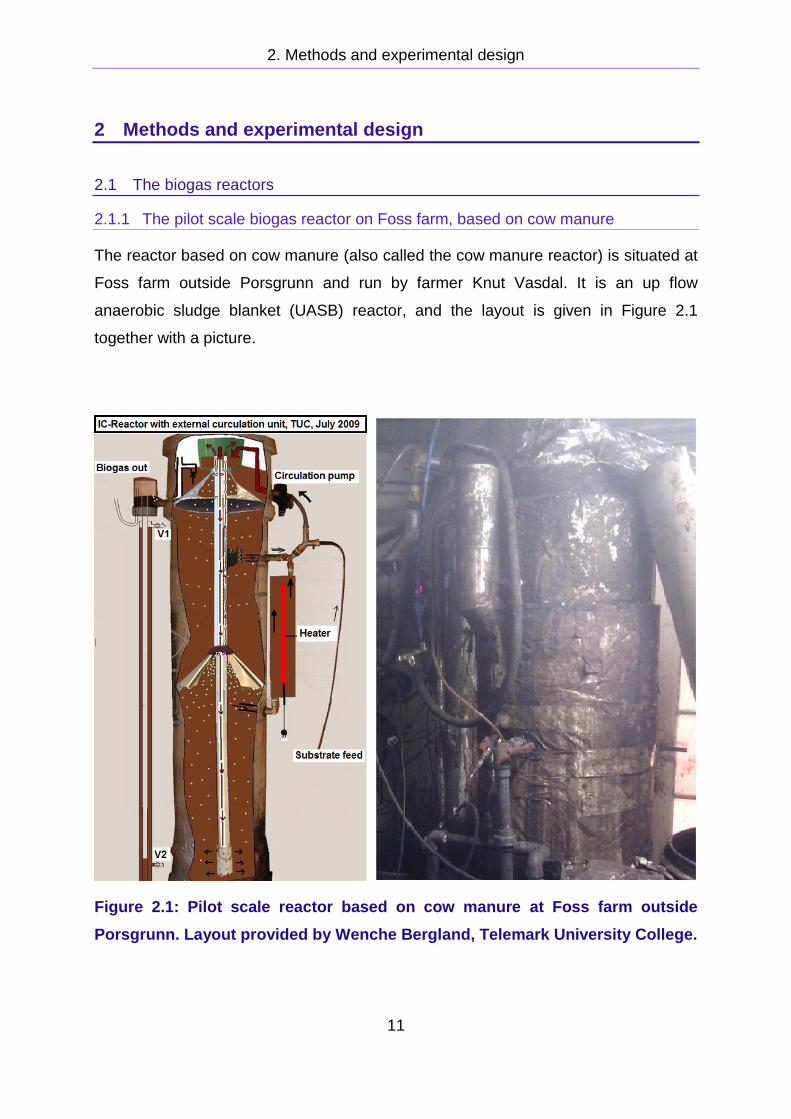
The reactor based on cow manure (also called the cow manure reactor) is situated at
Foss farm outside Porsgrunn and run by farmer Knut Vasdal. It is an up flow
anaerobic sludge blanket (UASB) reactor, and the layout is given in Figure 2.1
together with a picture.
Figure 2.1: Pilot scale reactor based on cow manure at Foss farm outside
Porsgrunn. Layout provided by Wenche Bergland, Telemark University College.

2. Methods and experimental design
12
The reactor contains 220 L, and the feed rate is between 10 and 50 L/day. The
temperature varies between 24 and 35 °C. This is presented in Figure 2.2. The feed
is from manure batches changed on September 12th, November 7th, January 30th and
March 29th. The organic loading rate, given as gram COD (chemical oxygen demand)
per litre feed, is presented in Figure 2.3, and the batch changes are represented by
blue, vertical lines. Figure 2.4 presents the biogas production (L/day), which varied
from 50 L/day to almost 320 L/day. The primary data is presented in Appendix A. The
reactor was exchanged for a new reactor with similar design on April 19th. The
content of the old reactor was transferred to the new reactor.
There were problems with the feed rate during a period from November 7th to the
16th. The feed rate fluctuated between 0 and 142 L/day (not visible on Figure 2.2),
and this may have caused a washout of biomass. The biogas production decreased
rapidly from November 5th, and the feed rate was adjusted from 50 L/day to 10 L/day
on November 18th. The lowered production may have been caused by the possible
washout, but the steep feed rate adjustment from 25 L/day to 50 L/day on October
28th combined with the earlier temperature increase is the most likely reason since
the biogas production rates declined even before the feed rate problems started.
Figure 2.2: The feed rate and temperature for the reactor running on cow
manure in the period from August 14th to May 10th.
0
10
20
30
40
50
60
Fe
er
rate
[L
/da
y]
an
d
tem
pe
ratu
re [
°C ]
Date
Reactor conditions
Feed [L/day]
Temperature [C]

2. Methods and experimental design
13
Figure 2.3: The organic loading rate in the reactor running on cow manure, in
the period from August 14th to May 10th. The verical blue lines represents the
changes in feed batch.
Figure 2.4: Production of biogas in the reactor running on cow manure in the
period from August 14th to May 10th.
32,0
36,0
40,0
44,0
48,0
52,0
Org
an
ic lo
ad
ing
ra
te [
gC
OD
/L]
Date
Organic loading rate (OLR)
OLR [gCOD/L]
0
50
100
150
200
250
300
350
Bio
gas
pro
du
cti
on
[L
/da
y]
Date
Biogas production
Biogas [L/day]
2. Methods and experimental design
14
The manure is first collected in the basement of the barn, flushed down with water.
The basement is emptied every 16th – 17th day, and the manure moved to the main
storage tank. Approximately every second month, another tank (3 500 L) is filled with
manure from the basement and diluted with water. This manure is stored without any
heating or isolation, and the decomposition and fermentation will begin. Because of
the temperature, the reaction will be less effective during the winter. Batches are
taken from this tank and temporarily stored in a small tank (400 L). The liquid phase
is fed to the reactor after the solid phase is filtrated out.
The liquid phase is the influent fed to the reactor from the top. Continuous circulation
and stirring prevents some of the sedimentation, but most of the granules can be
found low in the reactor. The biogas is collected at the top of the reactor, and has a
methane concentration between 64 and 78 %
The effluent of the reactor enters a nitrification tank after the AD reactor. The
objective of this reactor is to convert ammonia, NH3, to nitrite, NO2-, and nitrate, NO3
-.
Ammonia is for uncertain reasons toxic to most crops and should be removed before
the manure is used as fertilizer (Britto and Kronzucker, 2002). All information about
the AD reactor is from personal communications with PhD candidate Wenche
Bergland, Telemark University College, and the farmer Knut Vasdal.
2.1.2 The lab scale reactor at Telemark University College, based on pig manure
The reactor based on pig manure (also called the pig manure reactor) is a lab scale
anaerobic baffled reactor at Telemark University College, operated by master student
Fan Yun. A schematic drawing of the reactor setup from September 2011 (Yun,
2011) is presented in Figure 2.5 and a picture taken in October 2011 is shown in
Figure 2.6. The reactor was started with continuous operation November 5th 2011,
but the experiment started in September with initial operation in 100 mL syringes with
30 mL granules in each. The granules were transferred to the reactor chambers
November 5th, a total of 100 mL to each chamber.

2. Methods and experimental design
15
Figure 2.5: Schematic overview of the anaerobic baffle reactor based of pig
manure, fall 2011 (Yun, 2011).
Figure 2.6: A picture of the lab scale reactor based on pig manure, October
2011. It was rebuild in January 2012.

2. Methods and experimental design
16
The reactor has two chambers, each with an inner diameter of 5.1 cm and a height of
24 cm. This gives a volume of 350 mL in each. The hydraulic retention time, HRT,
and the feed given as organic loading rate, OLR, are respectively decreased and
increased, during the operating period from November to April, see Figure 2.7. HRT
starts high at 35 days at November 7th to give stable growth conditions for the
granules before decreasing rapidly during November to approximately 6 days. It
reaches below 1 day around February 25th and ends at approximately 0.5 day at April
15th. OLR increases slowly from 0.6 gram COD/L-day at startup November 7th, to
approximately 10 gram COD/L-day on February 7th. The feed is increased more
rapidly from February 7th to April 15th up to a level of 52 gram COD/L-day. The
reactor operates at 35 °C. The influent is the liquid fraction of stored pig manure,
collected from a pig farm outside Porsgrunn.
Figure 2.7: Hydraulic retention time (HRT) and organic loading rate (OLR) for
the pig manure reactor from November 2011 to April 2012.
0,0
10,0
20,0
30,0
40,0
50,0
60,0
HR
T [
day]
an
d
OL
R [
gC
OD
/L-d
ay]
Date
Hydraulic retention time (HRT) and organic loading rate (OLR)
HRT [day]
OLR [g COD/L-day]
2. Methods and experimental design
17
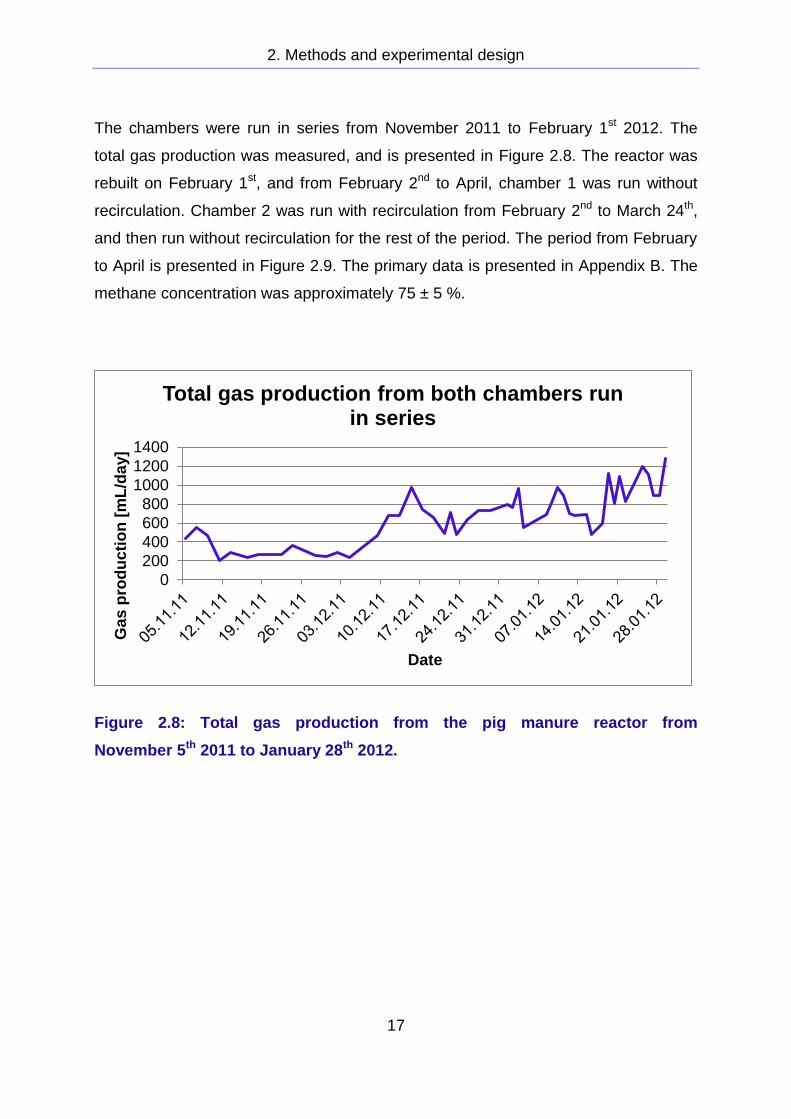
The chambers were run in series from November 2011 to February 1st 2012. The
total gas production was measured, and is presented in Figure 2.8. The reactor was
rebuilt on February 1st, and from February 2nd to April, chamber 1 was run without
recirculation. Chamber 2 was run with recirculation from February 2nd to March 24th,
and then run without recirculation for the rest of the period. The period from February
to April is presented in Figure 2.9. The primary data is presented in Appendix B. The
methane concentration was approximately 75 ± 5 %.
Figure 2.8: Total gas production from the pig manure reactor from
November 5th 2011 to January 28th 2012.
0
200
400
600
800
1000
1200
1400
Ga
s p
rod
uc
tio
n [
mL
/da
y]
Date
Total gas production from both chambers run in series

2. Methods and experimental design
18
Figure 2.9: Gas production from each pig manure reactor chamber in parallel
from February 2nd to April 19th. Chamber 2 was run with recirculation until the
24th of March, and then run without recirculation as chamber 1 for the rest of
the period. There was no measurement for chamber 1 on March 10th.
2.2 Samples: Extraction and storage
The samples from the reactor running on cow manure were taken by farmer Knut
Vasdal, and the samples from the reactor running on pig manure were taken by
master student Fan Yun. The samples were transported by PhD candidate Wenche
Bergland to Trondheim by plane, one or two days later, or by mail. The samples and
sampling dates are given in Table 2.1
The transportation time from Porsgrunn to Trondheim was about 24 – 48 hours.
Upon arrival the samples were transferred to anaerobic bottles and flushed with
nitrogen to remove oxygen from the headspace. DNA was extracted as described in
section 2.3 for further analysis. The manure samples were stored anaerobically at
4 °C in a refrigerated room.
0
500
1000
1500
2000
2500
3000
3500
4000
Bio
gas
pro
du
cti
on
[m
L/d
ay]
Date
Gas production from each chamber in parallel
Chamber 1
Chamber 2
2. Methods and experimental design
19
The main samples received were:
Raw cow manure before filtration
Solid cow manure after filtration
Liquid cow manure after filtration (influent)
Cow manure samples from the middle of the reactor
Cow manure samples from the bottom of the reactor
Cow manure reactor effluent
Pig manure samples from the pig reactor, effluent and chambers
Raw cow manure before filtration
The diluted manure is stored in an open tank (400 L) right before it is fed to the
reactor. The sample is taken from this tank. The consistency is mud-like liquid, with
high amounts of dry substance such as grass, hair and other fibres. The sample was
called “Cow manure, Raw” (CR).
Solid cow manure after filtration
The manure is filtrated with a vacuum filter, and this sample is taken from the filter
cake. It is solid, and looks like fresh manure. The sample was called “Cow manure,
Dry” (CD).
Liquid cow manure after filtration, influent
The influent was highly liquid, with only small particles of solid matter. It was called
“Cow manure, Influent” (CI).
Samples taken from inside the reactor
The first sample was taken from the middle of the reactor, “Cow manure reactor,
Middle” (CM). The sample were liquid, but had more solid matter than the influent. It
was suggested that samples taken from the bottom of the reactor might have more
microbial activity. Hence the next samples were taken from the bottom and called
2. Methods and experimental design
20
“Cow manure reactor, Bottom” (CB). One sample was taken from the reactor top, and
named “Cow manure reactor, Top” (CT).
Reactor effluent
The samples taken from the reactor effluent were the most liquid, with very little solid
matter, and no large fibres. They were called “Cow manure reactor, Effluent” (CE).
Samples from the pig manure reactor
The first two samples were taken from the syringes used before the reactor was
started. They were named “Pig Syringes” (PS). The first sample from the pig manure
reactor was taken from the effluent as to not affect the reaction too much. It was
called “Pig manure reactor, Effluent” (PE). Later samples were taken from the reactor
chambers and named “Pig manure reactor, Granules” (PG) 1 and 2 after the
respective reactor chambers. The first PG samples from 27.11 did however contain
very little granules to affect the newly started reactor as little as possible.
An overview of the samples are given in Table 2.1.

2. Methods and experimental design
21
Table 2.1: Overview of the samples; the dates they were collected and what
they contained. The abbreviations are explained in the text.
# Date CR CD CI CT CM CB CE PS PE PG1 PG2
1 26.09.11 X X X X
2 16.10.11 X X X X X X
3 06.11.11 X X X X X X
4 18.11.11
21.11.11
X
X
5 27.11.11 X X X X X X X
6 02.02.12 X X X X X
7 26.02.12 X X X X X X X
8 22.03.12 X X X X X X X
9 17.04.12
19.04.12
X X X X X
X
X
10 15.05.12 X X X X X X X
2. Methods and experimental design
22
2.3 Extraction of DNA by PowerSoil DNA Isolation Kit
DNA was extracted using a commercial kit; PowerSoil®DNA Isolation Kit (MO BIO
Laboratories, Inc.). The kit consisted of all solutions and tubes necessary. A himac
CT15E centrifuge (HITACHI, Japan) was used during extraction.
PowerSoil®DNA Isolation Kit is made for environmental samples containing a high
humic acid concentration including difficult soil types such as compost, sediment, and
manure.
The manure sample (0.25 g) was added to a bead beating tube that contained a
buffer. The buffer helped disperse the manure particles, dissolve humic acids, and
protect nucleic acids from degradation. A lysis solution (C1, 60 µL) was added and
the sample was homogenized by a Vortex Genie 2 with a MO BIO Vortex Adapter
(max speed, 10 minutes). Hence the cell lysis occurred by both mechanical and
chemical methods. The sample was centrifuged (10 000 x g, 30 seconds) and the
pellet discarded. Solution C2 (250 µL) was added and the sample incubated (4 °C,
5 minutes) before centrifugation (10 000 x g, 1 minute). The pellet was discarded.
The last step was repeated with solution C3 (200 µL). Solutions C2 and C3 were
inhibitor removal solutions that precipitated humic substances, cell debris and
proteins.
A high concentration salt solution (C4, 1200 µL) was added the supernatant to
capture the DNA in a silica membrane spin column (spin filter). The sample was
filtrated using a centrifuge (10 000 x g, 1 minute). The DNA captured in the filter was
washed with an ethanol based solution (C5, 500 µL) and then released from the
membrane by a Tris elution buffer (C6, 100 µL). The complete protocol can be found
in Appendix C. (MO-BIO)
Every time DNA was extracted from manure samples, a MilliQ-water sample was
added as negative control. This was called a blind sample (BL).

2. Methods and experimental design
23
2.4 Amplification of DNA by PCR
The extracted DNA was amplified using polymerase chain reaction (PCR). The
primers used are described in section 2.4.1. A thermal cycler from VWR was used. In
addition to the DNA samples and the blind sample (BL), there was added a negative,
non-template control of MilliQ-water for each round of amplification.
The PCR products were tested by agarose gel electrophoresis (1 % wt/vol, with
GelRed by Biotium). PCR product (5 µL) were mixed with 6x “loading dye” (1 µL,
Fermentas) and loaded onto the gel. GeneRuler 1 kb DNA Ladder (0.5 µg/µL,
Fermentas) was used for size comparison. The gel was run with 100 V for
approximately 1 hour. The gel was analysed in a G:BOX (SynGene) with the program
GeneSnap (SynGene).
2.4.1 The amplification primers
As the result of testing made by Forsberg (2011) the primer set 338f/518r (215bp,
Eurofins MWG Operon, Germany) was used. They are unspecific bacteria primers
targeting the 16S rDNA sequence and they have been proven effective for use in
DGGE. The forward primer was used with a GC-clamp (338f-GC) designed to stop
total denaturation of DNA during DGGE. A version of the primer named 338f-GC-
M13 was used when the DNA was to be sequenced. It consists of the M13 sequence
followed by the GC-clamp and the standard 338f sequence. The primers and GC-
clamp sequences are given in Table 2.2.
2. Methods and experimental design
24
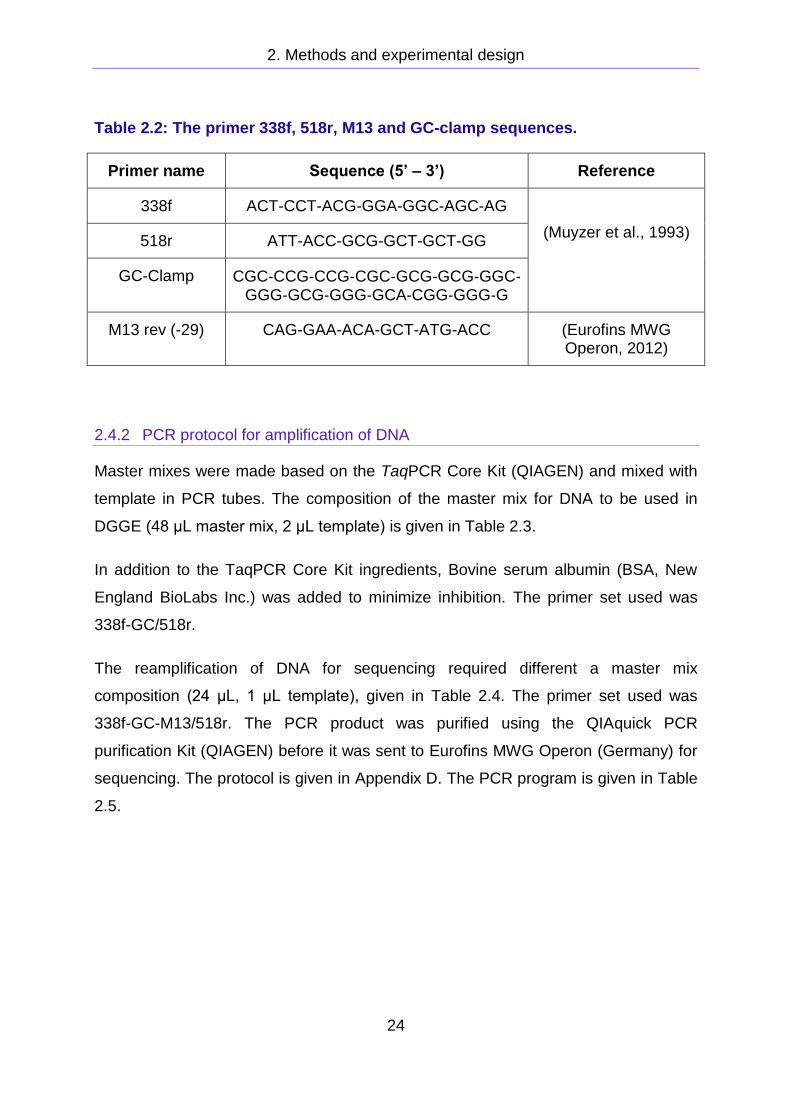
Table 2.2: The primer 338f, 518r, M13 and GC-clamp sequences.
Primer name Sequence (5’ – 3’) Reference
338f ACT-CCT-ACG-GGA-GGC-AGC-AG
(Muyzer et al., 1993) 518r ATT-ACC-GCG-GCT-GCT-GG
GC-Clamp CGC‐CCG‐CCG‐CGC‐GCG‐GCG‐GGC‐GGG‐GCG‐GGG‐GCA‐CGG‐GGG‐G
M13 rev (-29) CAG-GAA-ACA-GCT-ATG-ACC (Eurofins MWG Operon, 2012)
2.4.2 PCR protocol for amplification of DNA
Master mixes were made based on the TaqPCR Core Kit (QIAGEN) and mixed with
template in PCR tubes. The composition of the master mix for DNA to be used in
DGGE (48 μL master mix, 2 μL template) is given in Table 2.3.
In addition to the TaqPCR Core Kit ingredients, Bovine serum albumin (BSA, New
England BioLabs Inc.) was added to minimize inhibition. The primer set used was
338f-GC/518r.
The reamplification of DNA for sequencing required different a master mix
composition (24 μL, 1 μL template), given in Table 2.4. The primer set used was
338f-GC-M13/518r. The PCR product was purified using the QIAquick PCR
purification Kit (QIAGEN) before it was sent to Eurofins MWG Operon (Germany) for
sequencing. The protocol is given in Appendix D. The PCR program is given in Table
2.5.

2. Methods and experimental design
25
Table 2.3: Composition of the master mix (50 μL per reaction) used in
amplification of DNA for DGGE. The table shows the volumes needed per
reaction.
Master mix (48 μL/reaction) µL per reaction
10 x buffer with 15 mM MgCl2 5
dNTP (10 mM) 1
BSA (10 mg/mL) 2
Forward primer (10 µM) 1,5
Reverse primer (10 µM) 1,5
Taq polymerase 0,25
Sterile water 37
Table 2.4: Master mix (25 μL per reaction) composition used for PCR when DNA
was reamplified for sequencing. The table shows the volume needed per
reaction.
Master mix µL per reaction
10 x buffer with 15 mM MgCl2 2,5
dNTP (10 mM) 0,5
MgCl2 (25 mM) 0,5
Forward primer (10 µM) 0,75
Reverse primer (10 µM) 0,75
Taq polymerase 0,125
Sterile water 20
2. Methods and experimental design
26
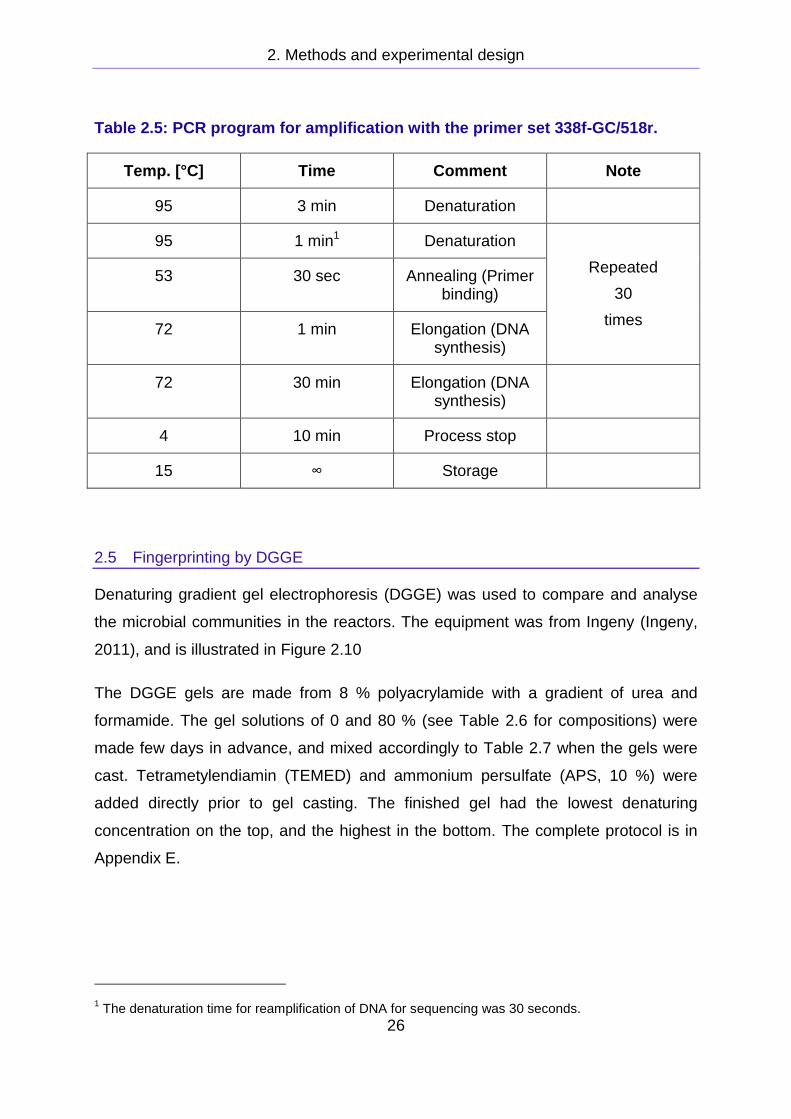
Table 2.5: PCR program for amplification with the primer set 338f-GC/518r.
Temp. [°C] Time Comment Note
95 3 min Denaturation
95 1 min1 Denaturation
Repeated
30
times
53 30 sec Annealing (Primer binding)
72 1 min Elongation (DNA synthesis)
72 30 min Elongation (DNA synthesis)
4 10 min Process stop
15 ∞ Storage
2.5 Fingerprinting by DGGE
Denaturing gradient gel electrophoresis (DGGE) was used to compare and analyse
the microbial communities in the reactors. The equipment was from Ingeny (Ingeny,
2011), and is illustrated in Figure 2.10
The DGGE gels are made from 8 % polyacrylamide with a gradient of urea and
formamide. The gel solutions of 0 and 80 % (see Table 2.6 for compositions) were
made few days in advance, and mixed accordingly to Table 2.7 when the gels were
cast. Tetrametylendiamin (TEMED) and ammonium persulfate (APS, 10 %) were
added directly prior to gel casting. The finished gel had the lowest denaturing
concentration on the top, and the highest in the bottom. The complete protocol is in
Appendix E.
1 The denaturation time for reamplification of DNA for sequencing was 30 seconds.

2. Methods and experimental design
27
Table 2.6: Composition of the 0 and 80 % denaturing polyacrylamide solutions
made prior to the experiment.
Composition 0 % 80 %
40 % Acrylamide (BioRadLab)
50 mL 50 mL
50 x TAE buffer 2,5 mL 2,5 mL
Urea 84 g
Deionized formamide 80 mL
Distilled water Up to 250 mL Up to 250 mL
Table 2.7: Composition of the denaturing gel solutions used to cast the gel.
0 % (mL) 80 % (mL) TEMED (µL) APS (µL)
0 % 8 10 40
25 % 16,5 7,5
16
87
30 % 15 9
40 % 12 12
45 % 10,5 13,5
50 % 9 15
55 % 7,5 16,5
60 % 6 18
PCR product (5 - 15 µL) was loaded together with 6x “loading dye” (2 - 4 µL). The gel
was run in 1 x TAE with 100 V for 17 – 18 hours at 60 °C. The gels were stained with

2. Methods and experimental design
28
SYBR Gold (3 µL SYBR Gold, 30 mL MilliQ water, 600 µL 50 x TAE) for 1 – 2 hours
before pictures were taken in a G:BOX and analysed.
If the bands were to be sequenced, they were excised using sterile pipette tips and
transferred to MilliQ water (30 µL). They were then frozen overnight, reamplified by
PCR and purified by QIAquick PCR purification Kit (QIAGEN), as described in
section 2.4.2. The purified DNA was sent for sequencing at Eurofins MWG Operon
(Germany).
Full protocol for DGGE can be found in Appendix E.
Figure 2.10: DGGE equipment from Ingeny (Ingeny, 2011).

3. Results
29
3 Results
3.1 DGGE analysis of the cow manure reactor
DNA samples obtained from the inside of the reactor running on cow manure were
used to visualize changes in the microbial community on a DGGE gel. The samples
used were from the start up in September until May, and taken from the top (CT),
middle (CM), and bottom (CB) of the reactor. The total DNA extracted from the
reactor samples was amplified using the primer set 338f-GC/518r and the protocol
described in section 2.4.2 before use in DGGE. The DGGE gel was cast as
described in section 2.5 with a 25 - 60 % denaturing gradient, see Figure 3.1.
The CM sample from November 26th was loaded into the well in insufficient amounts
due to an error and was therefore significantly weaker than the other bands. When
the gel was overexposed to UV light (not shown here), it was clear that the main
bands of the November 26th sample are similar to the main bands of the October 16th
CB sample. The October CB sample had slightly less PCR product than the other fall
samples when tested on an agarose gel, and was therefore loaded in higher amounts
(15 μL) than the other fall samples (10 μL) to compensate.
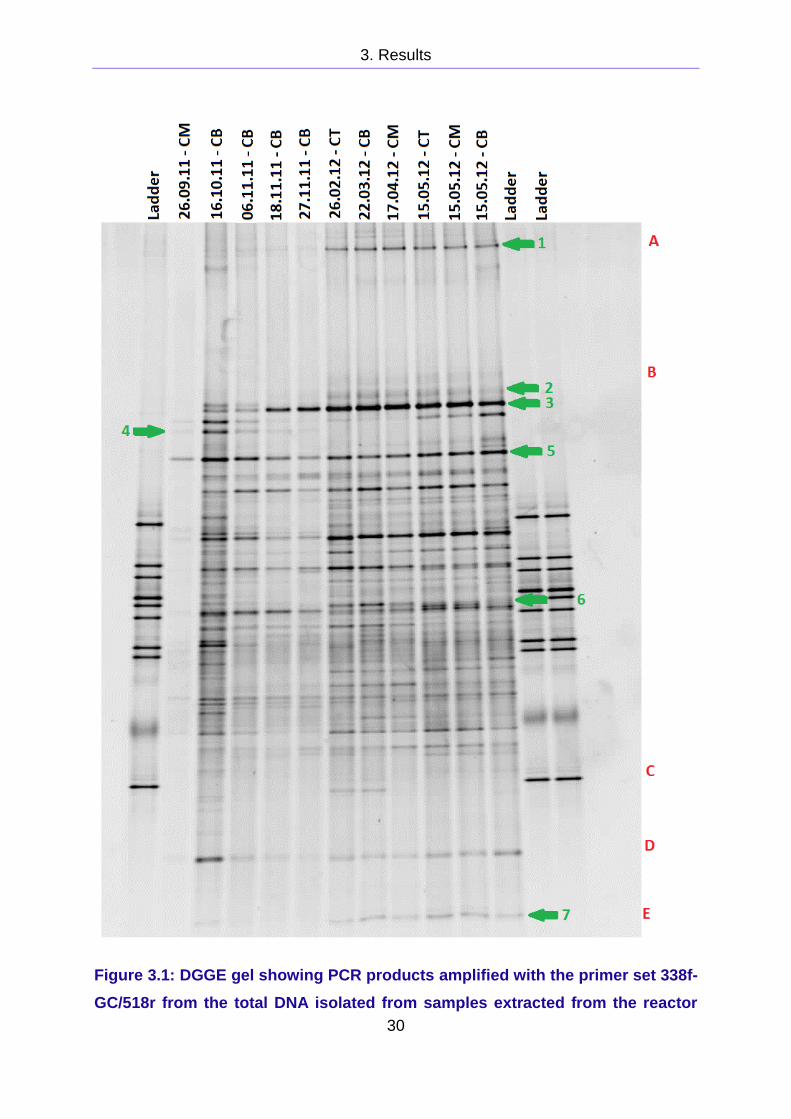
The band patterns on the gel in Figure 3.1 change between November 27th and
February 26th. The samples from September to November have weaker bands than
the samples from February to May. They also have fewer clear bands.
The band no. 1, 2, 6, and 7, marked in green in Figure 3.1, appear or become
stronger after February 27th. The strengthening of these bands is significant even if
the general increase in PCR product quality is adjusted for. The strength of band no.
5 is relatively stable through all the samples and can be used as comparison.
Band no. 4 grows weaker with each sample from October 16th to November 27th and
it is not present from February to May. Band no. 3 may seem to increase in strength
through the whole period from October 16th to May 15th and the change is especially
clear from November 6th to November 18th.
3. Results
30
Figure 3.1: DGGE gel showing PCR products amplified with the primer set 338f-
GC/518r from the total DNA isolated from samples extracted from the reactor
3. Results
31
running on cow manure from September to May. The bands were seperated on
a 8 % polyacrylamide gel with a denaturing gradient of 25 - 60 %. The sample
are abbreviated Cow manure reactor Top (CT), Middle (CM) and Bottom (CB).
Bands and areas of interest are marked with green and red labels.
3.2 DGGE analysis of the pig manure reactor
A DGGE gel was made presenting the changes in the bacterial community from
September 2011 to April 2012 in the pig manure reactor. Samples from both
chambers were used when available. The total DNA extracted from the samples were
amplified using the primer set 338f-GC/518r and protocol described in section 2.4.2,
and the DGGE gel was cast as described in section 2.5 with a 25 - 60 % gradient.
The gel is presented in Figure 3.2, and is curved due to an irregularity during casting.
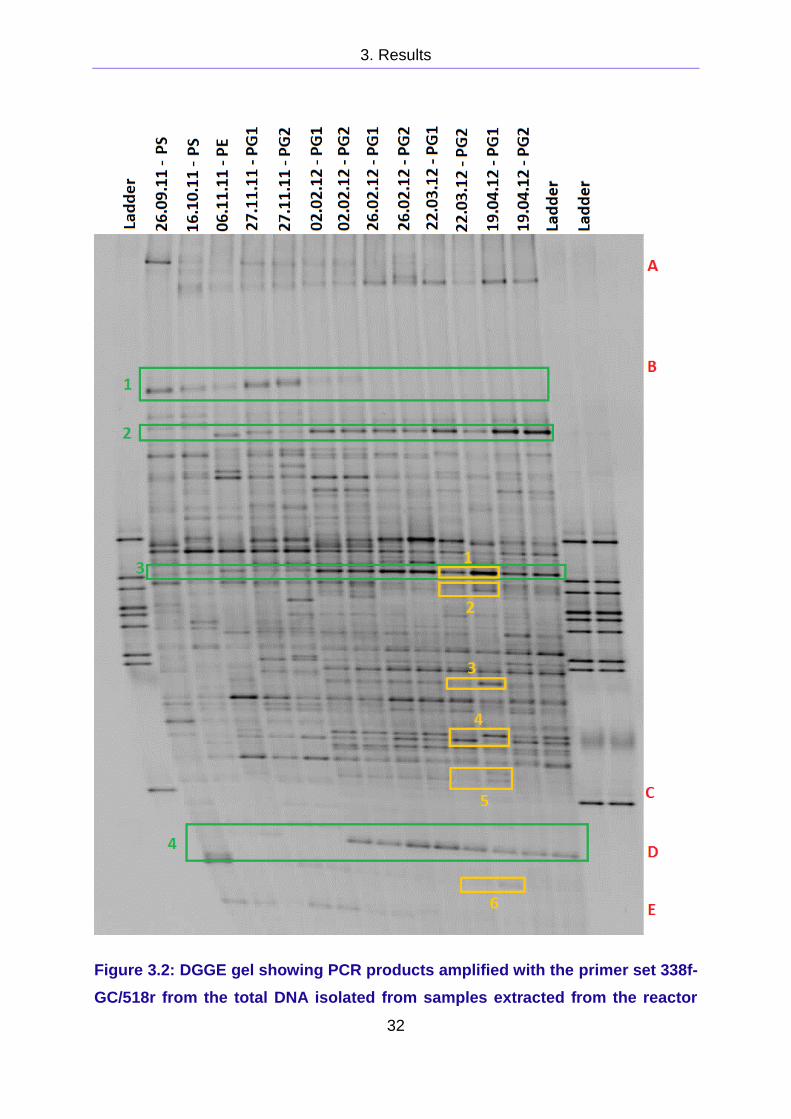
The most prominent change in band pattern is the turning point between November
27th and February 2nd. Several bands visible in the samples from fall 2011 disappear
and new bands appear. Four examples are marked with green boxes in Figure 3.2.
The DNA samples extracted from chamber 1 run without recirculation, can be
compared with the DNA samples from chamber 2 run with recirculation. There is no
significant difference, or change, except in the samples from March 22nd. The bands
in the sample from chamber 1 are generally equal or stronger than the bands in the
sample from chamber 2. The exceptions are the 6 bands marked in yellow in Figure
3.2. These bands are stronger in the sample from chamber 2 than chamber 1, and
they are also generally stronger than the other corresponding spring sample bonds.
In the yellow box no. 4, underneath the strong bond in the DNA sample from
chamber 2, there is also a bond that is very weak compared to the strong bond in
chamber 1 and the other spring samples.
3. Results
32
Figure 3.2: DGGE gel showing PCR products amplified with the primer set 338f-
GC/518r from the total DNA isolated from samples extracted from the reactor
3. Results
33
running on pig manure in the period September to April. The bands were
seperated on a 8 % polyacrylamide gel with a denaturing gradient of 25 - 60 %.
The sample types are pig manure reactor effluent (PE) and pig manure reactor
granules, chamber 1 and 2 (PG1 and PG2). The green boxes show four
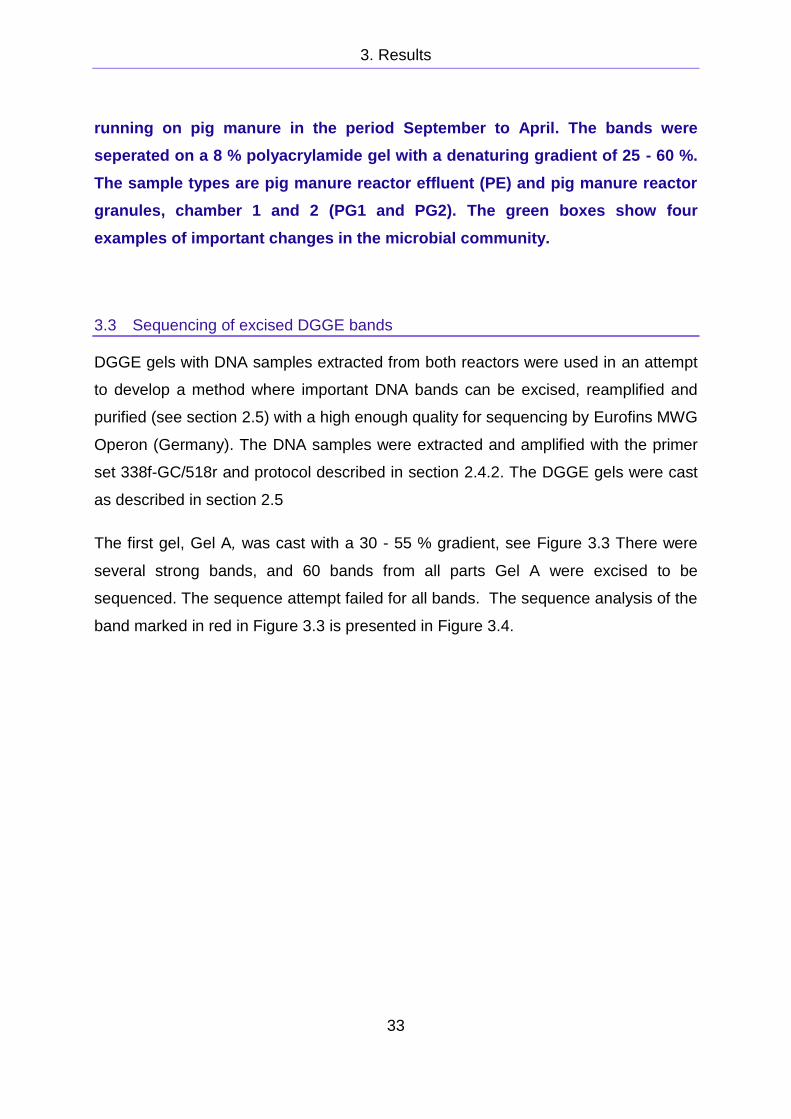
examples of important changes in the microbial community.
3.3 Sequencing of excised DGGE bands
DGGE gels with DNA samples extracted from both reactors were used in an attempt
to develop a method where important DNA bands can be excised, reamplified and
purified (see section 2.5) with a high enough quality for sequencing by Eurofins MWG
Operon (Germany). The DNA samples were extracted and amplified with the primer
set 338f-GC/518r and protocol described in section 2.4.2. The DGGE gels were cast
as described in section 2.5
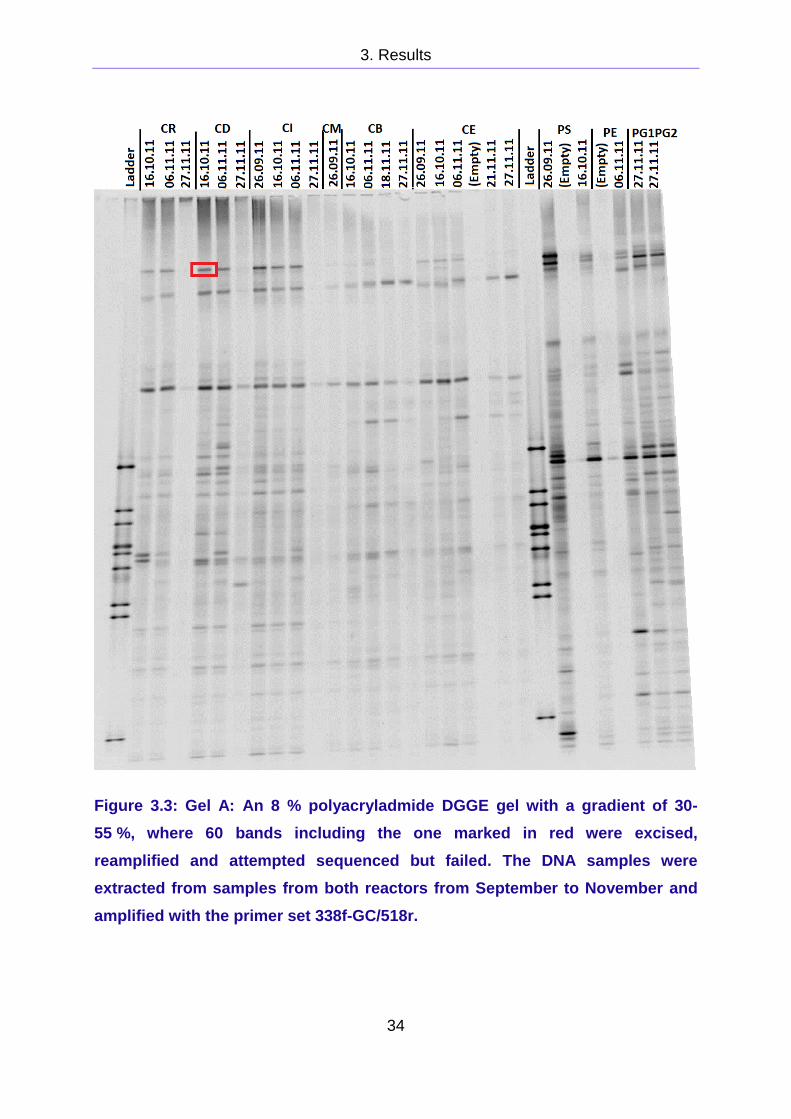
The first gel, Gel A, was cast with a 30 - 55 % gradient, see Figure 3.3 There were
several strong bands, and 60 bands from all parts Gel A were excised to be
sequenced. The sequence attempt failed for all bands. The sequence analysis of the
band marked in red in Figure 3.3 is presented in Figure 3.4.
3. Results
34
Figure 3.3: Gel A: An 8 % polyacryladmide DGGE gel with a gradient of 30-
55 %, where 60 bands including the one marked in red were excised,
reamplified and attempted sequenced but failed. The DNA samples were
extracted from samples from both reactors from September to November and
amplified with the primer set 338f-GC/518r.
3. Results
35
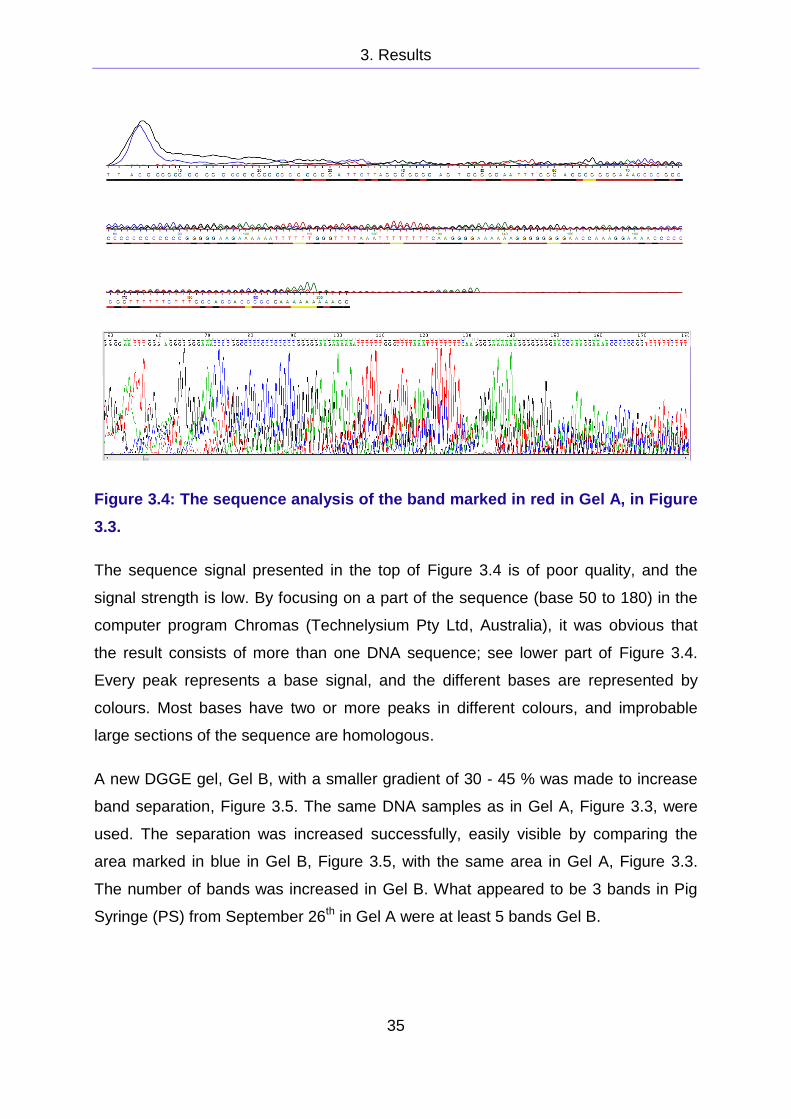
Figure 3.4: The sequence analysis of the band marked in red in Gel A, in Figure
3.3.
The sequence signal presented in the top of Figure 3.4 is of poor quality, and the
signal strength is low. By focusing on a part of the sequence (base 50 to 180) in the
computer program Chromas (Technelysium Pty Ltd, Australia), it was obvious that
the result consists of more than one DNA sequence; see lower part of Figure 3.4.
Every peak represents a base signal, and the different bases are represented by
colours. Most bases have two or more peaks in different colours, and improbable
large sections of the sequence are homologous.
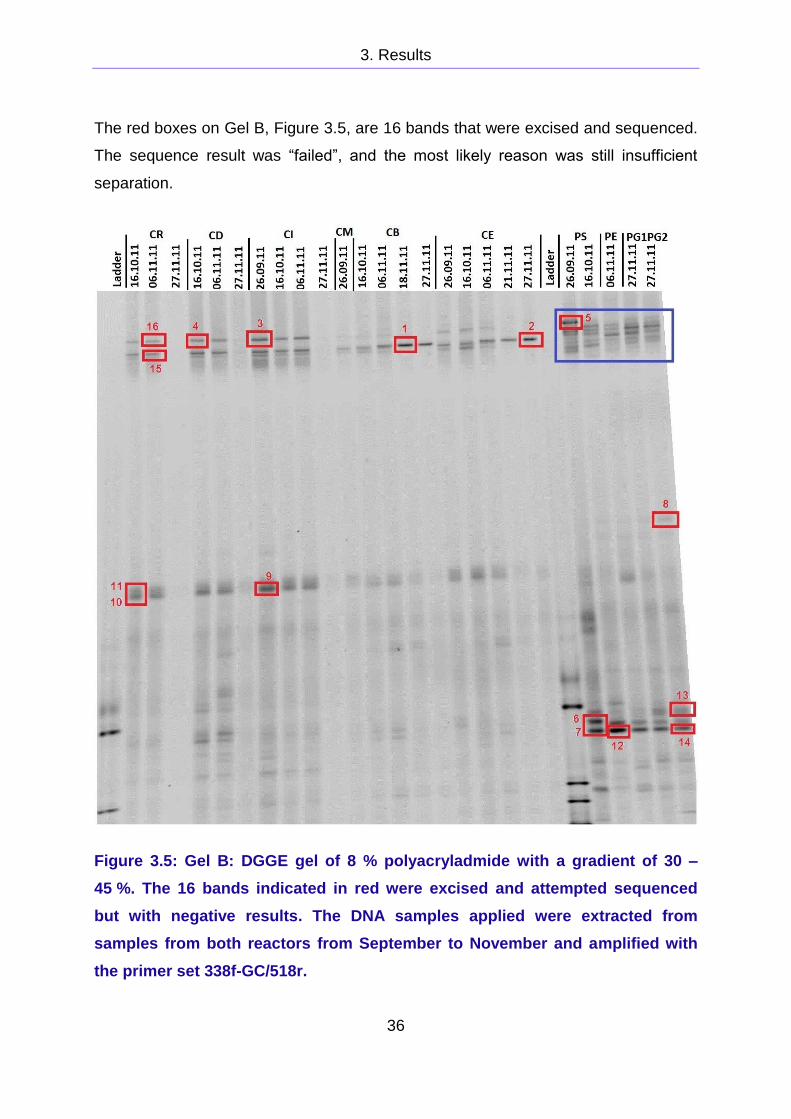
A new DGGE gel, Gel B, with a smaller gradient of 30 - 45 % was made to increase
band separation, Figure 3.5. The same DNA samples as in Gel A, Figure 3.3, were
used. The separation was increased successfully, easily visible by comparing the
area marked in blue in Gel B, Figure 3.5, with the same area in Gel A, Figure 3.3.
The number of bands was increased in Gel B. What appeared to be 3 bands in Pig
Syringe (PS) from September 26th in Gel A were at least 5 bands Gel B.
3. Results
36
The red boxes on Gel B, Figure 3.5, are 16 bands that were excised and sequenced.
The sequence result was “failed”, and the most likely reason was still insufficient
separation.
Figure 3.5: Gel B: DGGE gel of 8 % polyacryladmide with a gradient of 30 –
45 %. The 16 bands indicated in red were excised and attempted sequenced
but with negative results. The DNA samples applied were extracted from
samples from both reactors from September to November and amplified with
the primer set 338f-GC/518r.

3. Results
37
The 16 excised gel samples from Gel B in Figure 3.5 were frozen in 30 μL MQ-water
over night, as described in section 2.5. The eluted DNA was reamplified and applied
on a 30 - 40 % gradient DGGE gel, Gel C, shown in Figure 3.6. Each band from Gel
B, Figure 3.5, must have contained several different DNA sequences since several
additional bands appeared in Gel C, Figure 3.6.
Eighteen bands were excised from Gel C, Figure 3.6. The DNA was reamplified and
applied to a 33 - 40 % gel, Gel D, presented in Figure 3.7.
Figure 3.6: Gel C: DGGE gel of 8 % acrylamide with a 30 – 40 % gradient
applied with the reamplified DNA products from the 16 bands originating from

3. Results
38
Gel B in Figure 3.5. 18 new bands marked in red were excised. The “L” stands
for ladder.
Figure 3.7: Gel D: DGGE gel presenting the 18 excised bands originating from
Gel C in Figure 3.6, reamplified and reapplied to an 8 % polyacrylamide DGGE
gel with a 33 - 40 % gradient. The new set of 17 bands marked in red was

3. Results
39
sequenced successfully but with too poor result for further use. The “L” stands
for ladder.
The sequencing of the final 17 bands from Gel D in Figure 3.7 was successful, but
the results were of too poor quality for any specie determination or other phylogenetic
analysis. Only short sections were of high quality, and they are mostly homologous.
Band no. 7 was the longest with 20 accepted base pairs from base pair 81-101. This
is the area shaded in white in the top part of Figure 3.8. The chromatogram
visualized by the software Chromas (Technelysium Pty Ltd, Australia) is presented in
the lower part of Figure 3.8.
Figure 3.8: The sequencing result of band no. 7 from Figure 3.7. The result was
of too poor quality for any further analysis.

3. Results
40

4. Discussion
41
4 Discussion
Two anaerobic biogas reactors were followed from September 2011 to May 2012; a
pilot scale reactor situated at Foss farm, outside of Porsgrunn, running on cow
manure, and a lab scale reactor situated at Telemark University College, running on
pig manure. Samples from both reactors were extracted approximately once a month.
The total DNA was extracted from the manure samples, amplified by PCR and
analysed by DGGE. An assortment of DGGE bands were excised and sequenced.
4.1 DGGE gel analysis
4.1.1 Reactor based on cow manure
The DNA samples extracted from the reactor running on cow manure from
September to May were used to analyse changes in the microbial community
composition of the reactor and compare them with operating conditions and gas
production. The samples were extracted from the reactor top (CT), middle (CM) and
bottom (CB). The DNA was extracted as described in section 2.3 and amplified using
the primer set 338f-GC/518r and protocol described in section 2.4.2. The amplified
DNA samples were applied to an 8 % polyacrylamide DGGE gel with a gradient of
25 – 60 %, see section 2.5. The gel is presented in Figure 3.1.
Changes in the microbial community from September to April
The bands representing the DNA samples from February to May 2012 is generally
stronger than the DNA samples from September to November 2011. This may be
explained by degeneration in the DNA sample during storage and analysis. The 2011
samples have been frozen and thawed significantly more than the 2012 samples.
This may have deteriorated their quality and hence their PCR product and band
strength are poorer. Some other changes are visible, and these might be explained
by changes in operating conditions.

4. Discussion
42
Changes in the microbial community with respect to operating conditions and
biogas production
The feed batches were changed on September 12th, November 7th, January 30th, and
March 29th. This gives only 2 – 3 samples per batch, and therefore it is almost
impossible to indicate any connection between changes in manure composition
following a batch change and the microbial community. Individual differences
between samples may just as likely be caused by other operating conditions like feed
rate and temperature which varies in the same period, than changes in feed batch.
The most significant example of change in operating conditions occurred between
the samples from the 6th and 18th of November. From the 7th to the 16th of November
there was a probable washout of biomass caused a problem with the feed rates. The
feed rate was lowered to 10 L/day as a response, and in the same time period the
biogas production decreased from over 250 L/day to 50 L/day. This is an important
and dramatic event, but the samples extracted before and after the event show only
minor differences in band strength. These differences are around the band marked
as no. 3 in Figure 3.1, and the band patterns are otherwise similar. Band no. 3
increased in strength, but the bands right above and below decreased in strength.
Band no. 3 can be a slow growing bacteria either just increasing in amount, or
responding to the temperature increase from 24 °C to 35 °C in the middle of October.
The general band strength in the DNA sample from November 18th was not weaker
than normal, and there were therefore probably no significant consequence of the
possible washout.
There is a clear correlation between feed rates, presented in Figure 2.2, and biogas
production, presented in Figure 2.4. An increase in feed rate caused an increase in
gas production rates. This correlation cannot be found directly reflected by any band
in the DGGE gel in Figure 3.1.
The reactor was changed on April 19th. The reactor contents were transferred and the
reactor design was not altered. There is no evident difference between the DNA
sample from April 17th and May 15th, and the change of reactor did therefore probably
not affect the microbial composition for more than a short period of time.
4. Discussion
43
The DNA from the three samples extracted from different parts of the reactor on May
15th appears similar on the DGGE gel presented in Figure 3.1 and the location of the
extraction may hence be without importance. This conclusion is supported by Malin
(Malin and Illmer, 2008) in a similar experiment, where no visible pattern difference
was found between the inlet and outlet samples of an anaerobic biowaste fermenter.
The DGGE gel in Figure 3.1 does not reflect any of the changes in operating
conditions mentioned above. This may indicate that only large and long-term
adjustments in the reactor are visible by DGGE analysis with this sampling frequency
and conditions.
4.1.2 Reactor based on pig manure
The DNA samples extracted from the reactor running on pig manure from September
to April were used to analyse changes in the reactor’s microbial community and
compare them with operating conditions and gas production. The samples from
September and October were taken from the initial syringes and the later samples
from the reactor effluent (PE) and chambers (PG). The DNA was amplified using the
primer set 338f-GC/518r and protocol described in section 2.4.2. The DNA samples
were applied to an 8 % polyacrylamide DGGE gel with a gradient of 25 – 60 % cast
as described in section 2.5. The gel is presented in Figure 3.2.
Changes in the microbial community from September to April
The DGGE presenting the samples from September to April clearly shows a general
increase in both band strength and number through the period. There is also a
distinct change between November 27th and February 2nd. Several bands appear or
disappear as illustrated by the green boxes in Figure 3.2. The sample extraction
method is the main change possibly explaining this. The granules were not present in
the manure samples in significant amounts before the February 2nd samples, see
section 2.2. Granules permit a more complex microbial composition with a stable
surface, variation in living conditions and long retention time compared to pure liquid.
4. Discussion
44
The liquid effluent will hence reflect mainly microbes in the transitory liquid and not
the microbes on the retained granules. This will again be reflected in the total DNA
extracted and used in analysis. The bands appearing or increasing in strength after
February 1st are hence most likely bacteria growing on the granules. Some changes
between the effluent sample from November 6th and the chamber samples from
November 27th are also likely due to the small granule amounts present in the
chamber samples.
Changes in the microbial community with respect to operating conditions and
biogas production
The hydraulic retention time, HRT, and the organic loading rate, OLR, are
respectively decreased and increased during the operating period from November to
April, see Figure 2.7. The difference in the November samples with respect to
granule content makes it impossible to examine the possible effect of rapidly
decreasing HRT on the microbe community.
The rapidly increased OLR from February 7th to April 15th corresponds with the
increase in total gas production in the reactor. The total gas production from both
chambers operated in series starts at 300 mL/day on December 9th and increase to
1200 mL/day on January 30th, according to Figure 2.8. There are unfortunately no
samples from this period to compare with. The total gas production from both
chambers is approximately 1200 mL/day February 7th and 7000 mL/day April 15th.
There is no corresponding change in the DGGE gel result in Figure 3.2, except from
a possible increase in band strength in the green box no. 2. There is no general
change in band number or strength, but microbial activity does not necessary
correspond with changes in biomass visible by DGGE.
From February 2nd to March 24th chamber 2 was run with recirculation while chamber
1 was run without. The only significant difference in the chamber profiles was in the
DNA samples from March 22nd. Chamber 1 has generally equal or stronger bands
than chamber 2, except for the 6 bands marked in yellow in Figure 3.2. These bands
may be bacteria utilizing more recalcitrant substrates which will be in relatively higher
4. Discussion
45
amounts in a system with recirculation than without. In the yellow box no. 4 there is
also a weaker band compared to both the sample from chamber 1 and the other
spring samples. This may be a bacterium utilizing easily available substrates like
volatile fatty acids (VFA) which will be in relatively low amounts in a system with
recirculation.
4.1.3 Comparison of the DGGE gels from the two reactors
The DGGE gel in Figure 3.1 presents the microbial community in the reactor based
on cow manure from September 2011 to May 2012. The gel in Figure 3.2 presents
the reactor running on pig manure from September 2011 to April 2012.
Both reactors have the same approximate number of 22 – 28 distinct bands per DNA
sample. They also have a similar profile of band clusters with respect to the gradient.
A few bands lie in the area on the top of the gels marked with a red A on both figures.
The main clusters are between the red B and C marks in the middle of the gels. A
few bands are located lower on the gels, below the lowest ladder marker, marked
with the red letters D and E. There are areas without band on both gels between the
red letters A and B. These similarities in profiles may indicate similarities in the
microbial communities. Especially the bands around the red letters A, D, and E are
potentially the same bacteria.
It should be noted that the bands marked with the red E in both figures are shoving
different development in strength. The band seems to increase in strength in the
samples from the reactor based on cow manure, while it is decreasing the samples
from the pig manure reactor. This is both interesting and remarkable if the bands are
based on the same bacteria.

4. Discussion
46
4.2 Possible weaknesses with the PCR-DGGE technique
4.2.1 PCR-DGGE analysis
Every step in the process of PCR-DGGE analysis has possible weaknesses that may
affect the DGGE analysis result. The sample handling procedures must be consistent
and adapted to avoid loss or change of microbial diversity, and the DNA extraction
must equally favor all organisms to avoid insufficient and preferential disruption of
cells. These parameters are believed to be of an acceptable standard after the
testing made by Forsberg (2011). The manure samples have been tested and found
stable through two months of anaerobic storage at 4 °C, and the PowerSoil®DNA
Isolation Kit (MO BIO Laboratories, Inc.) is the best of three kits tested.
DNA amplification by PCR may have several weaknesses when applied to
environmental samples. Co-extracted contaminants, like humic acids and other
humic substances, inhibit DNA modifying enzymes including Taq polymerase
(Wintzingerode et al., 1997). The contamination is reduced to by the cleaning
procedures during DNA extraction and the inhibiting effect is further reduced by
adding BSA to the PCR master mix, see section 2.3 and 2.4.2.
Differential amplification can be caused by a variety of factors and should be
considered a possible source of error when comparing DNA quantities. All molecules
must be equally accessible to primer hybridization, form primer-template hybrids at
equal rate and have the same polymerase extension efficiency to avoid uneven
amplification rates. This is unrealistic for universal bacteria primers like 338f and 518r
with natural variances in affinity with respect to different 16S DNA sequences. An
article comparing primer coverage rates (Wang and Qian, 2009) shows that predicted
primers covering the bases 338 – 358 (relative to the position in Escherichia coli)
have an average coverage rate of 97.3 %. The 338f primer used in this experiment is
one base shorter than the predicted primer, but has the same sequence covering
base 338 – 357. It will therefore probably have a similar coverage rate as the
predicted primer. The coverage rate for a known primer covering the bases 334 –
356 is 74.2 %. The 338 – 356 sequence is identical to the 338 primer used here.

4. Discussion
47
DNA sequences with a high GC content is suspected to dissociate with lower
efficiency leading to a preferential strand separation of genes with lower GC content
(Wintzingerode et al., 1997). It is also been indicated a template threshold of
approximately 1 % of the total DNA (Muyzer et al., 1993) making small communities
underrepresented in the PCR product even if the total microbe count in the sample is
substantial. These are constant biases and should hence not affect comparison
between similar samples.
Some differential in DNA amplification of environmental samples are dependent on
the choice of primers and number of cycles of replication (Wintzingerode et al.,
1997). This is because reannealing of gene products progressively inhibits the
formation of template-primer hybrids when primers with high amplification efficiency
are used. This may make PCR biases non constant, but in this experiment the same
primer and number of replication cycles were used on all DNA samples. The
inhibition is likely reduced if the sample is highly diverse since amplification of any
gene will less likely produce amplicons in an inhibiting concentration. If non-universal
primers were applied the template diversity would decrease significantly and the
biases may increase (Wintzingerode et al., 1997).
PCR products can be contaminated by artificial DNA sequences like chimeras made
from two DNA sequences with high similarity (Ferris and Ward, 1997), but this will
due to small amounts not significantly interfere with DGGE analysis of complex
communities (Murray et al., 1996). The PCR product may also be contaminated by
alien DNA since universally conserved regions of bacterial genes serve as target
sequence. The most likely source of additional bands is still variations in the
ribosomal RNA operon copy number and variations in the 16S sequence in each
operon (Crosby and Criddle, 2003). The variation in operon copy number will affect
the amount of 16S DNA and thus the strength of the DGGE band representing the
organism. Each operon may also have distinct 16S sequences, presented as
different bands on a DGGE gel. This can make microbial quantity estimation difficult,
but comparison of samples is still possible since the biases are constant.
DGGE analysis requires a GC-clamp attached to the primer during PCR. The GC-
clamp may cause incomplete strand synthesis leading to multiple and unclear bands

4. Discussion
48
for one template. Dissimilar sequences with similar GC content may co-migrate to the
same position in the gel gradient causing bands to be a mixture of more than one
sequence. This may interfere with microbe diversity estimations and may be a source
of error for DNA sequencing. (Nübel et al., 1996)
4.2.2 Sources of error when sequencing DNA excised from DGGE
Sequencing of DNA excised from a DGGE gel can be difficult due to several possible
sources of error. The main source is incomplete separation of strands or
contamination of bands. This is clearly the case in Gel C, Figure 3.6, where each
PCR product applied is from an excised band from Gel B, Figure 3.5. The PCR
products obviously consist of more than one DNA sequence, as Gel C shows several
distinct bands for each PCR product. A DGGE band may consist of DNA from more
than one sequence due to co-migration of sequences of similar GC content or by
incomplete strand synthesis caused by the GC-clamp. The bands can also be
contaminated by general traces of the total DNA. The latter is likely since the bands
in Gel C, Figure 3.6, are located in all denaturing gradients and not only in the area
where the original DNA samples was excised. This is a different result than seen in
the master thesis by Røstad Nordgård (2010) were all the different reamplified DNA
samples from excised bands became positioned on a horizontal line in the new gel.
The incomplete separation might also be caused by the sheer number of bands
produced by a universal primer like 338f/518r. The multitude of bands may prove
difficult to adequately separate within the physical limits of a DGGE gel since even
the 7 % gradient of gel D in Figure 3.7 was insufficient.
The sequence results presented in Figure 3.4 and Figure 3.8 shows weak signals of
poor quality. The weak signal might be caused by low DNA concentrations, but the
sample concentrations were tested by NanoDrop measurements and were in the
region recommended by Eurofins.
Røstad Nordgård excised 16 DGGE bands and 4 of them were successfully
sequenced. They were analyzed and tentatively identified (Røstad, 2010). Røstad
4. Discussion
49
Nordgård used a gene specific primer for methanogenic archaea. This specific primer
would have produced fewer bands than the universal 338f/518r primer set, and
hence give more separated and distinct bands when applied to a DGGE gel. This
would increase the success rate for DNA sequencing and may explain the positive
results compared to the negative results in this experiment.
4.3 DGGE as a method for supervising anaerobic fermenters
DGGE is with respect to this experiment’s results capable of reflecting community
shifts and the gels neatly illustrate the microbial community composition. It is a highly
reproducible and consistently performing fingerprinting technique and even the
biases are of a constant nature. Band pattern changes do hence reflect actual
variations in microbial community composition. However, the band pattern variations
is this experiment could not with be directly correlated to either operating conditions
or gas production. An increase in sampling frequency could make it possible to
connect changes in band patterns to changes in operating condition, but the potential
results would probably not be worth the extra work load.
The missing correlation between operating conditions and band pattern could also be
explained by the fact that microbial activity does not necessary correspond with
changes in biomass that would be visible by DGGE. DGGE bands only indicate the
presence of microbes, not their activity levels. This conclusion is supported by Malin
and Illmer (2008). DGGE might hence not be first choice of first choice to assess fast
changes in fermenter community.
Minor changes in overall DGGE band strength and variations could be considered
unreliable due to large uncertainties and variations in the sampling method and
sample composition before DNA extraction (e.g. amount of granules relative to
liquid).
To increase the advantages of DGGE analysis, DGGE band pattern analysis
software like GelCompar II (Applied Maths) or Gel2K (Svein Nordland, University of
Bergen) can be used. This will give more reliable and sensitive analysis of the gel
pattern variations.
4. Discussion
50
Increased knowledge about the microbes present would give the foundation of further
research based on e.g. more specific primers. Sequencing of excised band has been
proved difficult with the parameters tested here, and different methods should be
evaluated. This will be further discussed in section 4.4. The samples can also be
analysed by FISH, to examine the spatial orientation of the microbes.
Measurements of DNA content of the fermenter sludge might be a good parameter to
monitor fermenter performance. It has been observed an approximate fivefold
increase in DNA content at times with high reactor performance compared to low
(Malin and Illmer, 2008).
4.4 Further work
The extracted DNA is eluted in 100μL elution buffer. This may prove to be a small
volume if several analyses are needed. DNA extraction should therefore be made
with at least two extractions per sample. It would also be relevant to check if the
microbial compositions in new DNA extractions from the stored samples are
comparable to extractions made when the samples were fresh. This would be a
continuation of the storage experiment started by Forsberg (2011).
A better understanding of the changes in microbial composition may give the
foundation for optimization of the operating conditions, fewer reactor problems and
better biogas yield. Further work should hence focus on optimizing the method for
DNA sequencing. The main areas of focus can be choice of primers, see section
4.4.1 or sequencing method, see section 4.4.2. FISH analysis should be performed
when suitable probe sequences are established, see section 4.4.3.
4. Discussion
51
4.4.1 Primers
The primers 338f and 518r are probably unsuitable for DNA sequencing, see section
3.3 and 4.2.2, since too many PCR products for sufficient separation on a DGGE gel
were produced. More specific primers should hence be tested, even if the microbial
diversity is decreased. The universal primer can still be used for monitoring the
microbial compositions in the reactors.
Hydrolysis and acid formation is as mentioned in section 1.2.3 carried out by a wide
consortium of bacteria. Some of the genera involved are Bacteroids, Bifidobacteria,
Clostridium, Escherichia, Lactobacillus, and Proteus (Gerardi, 2006). Acidogens are
spread across more than 20 phyla (Kim et al., 2011) indicating that their phylogenetic
position and phenotypic function of acid production are not tightly linked. Primer
design must hence be even more specific.
In research on wastewater reactors, Aeromonas spp. and Clostridium sticklandii were
identified as common acidogens with Aeromonas the likely major acidogenic group,
especially during startup of a reactor. They are both probably significant in both
amounts and activity in initiating anaerobic digestion. Two primers presented in Table
4.1 were designed targeting the genus Aeromonas or the species C. sticklandii.
Aeromonas have high specie homology (> 97,8 %) for the 16S rDNA sequence,
hence the genus target. There were insignificantly few false positives for both primer
sets. (Kim et al., 2011)
Some syntrophic acetate oxidizing bacteria has been identified in anaerobic biogas
reactors, and suitable primers for identification has been suggested (Westerholm et
al., 2011). They are presented in Table 4.1.
Formyltetrahydrofolate synthetase (FTHFS) is a key enzyme in the acetyl-CoA
pathway, used for assimilation of CO2 into cell carbon and conversion of energy
found in some acetogenic bacteria. The gene coding for FTHFS might hence be used
to identify some acetogenic bacteria. (Westerholm et al., 2011)
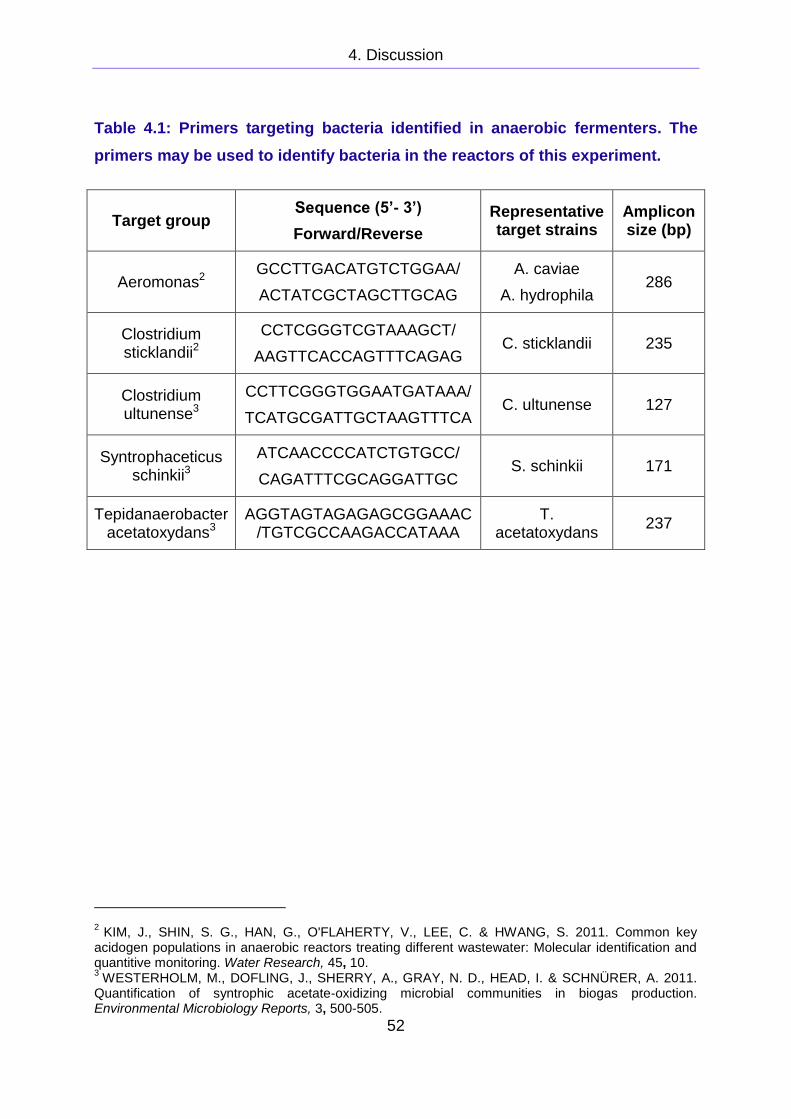
4. Discussion
52
Table 4.1: Primers targeting bacteria identified in anaerobic fermenters. The
primers may be used to identify bacteria in the reactors of this experiment.
Target group Sequence (5’- 3’)
Forward/Reverse
Representative target strains
Amplicon size (bp)
Aeromonas2 GCCTTGACATGTCTGGAA/
ACTATCGCTAGCTTGCAG
A. caviae
A. hydrophila 286
Clostridium sticklandii2
CCTCGGGTCGTAAAGCT/
AAGTTCACCAGTTTCAGAG C. sticklandii 235
Clostridium ultunense3
CCTTCGGGTGGAATGATAAA/
TCATGCGATTGCTAAGTTTCA C. ultunense 127
Syntrophaceticus schinkii3
ATCAACCCCATCTGTGCC/
CAGATTTCGCAGGATTGC S. schinkii 171
Tepidanaerobacter acetatoxydans3
AGGTAGTAGAGAGCGGAAAC/TGTCGCCAAGACCATAAA
T. acetatoxydans
237
2 KIM, J., SHIN, S. G., HAN, G., O'FLAHERTY, V., LEE, C. & HWANG, S. 2011. Common key
acidogen populations in anaerobic reactors treating different wastewater: Molecular identification and quantitive monitoring. Water Research, 45, 10. 3 WESTERHOLM, M., DOFLING, J., SHERRY, A., GRAY, N. D., HEAD, I. & SCHNÜRER, A. 2011.
Quantification of syntrophic acetate-oxidizing microbial communities in biogas production. Environmental Microbiology Reports, 3, 500-505.
4. Discussion
53
4.4.2 Sequencing methods
The traditional method of sequencing environmental samples is to make and
sequence clone libraries. By introducing one 16S rDNA sequence from the
environmental sample into each host cell (typically an easy-to-grow, benign,
laboratory strain of E. coli bacteria) and plating the host cells, each colony will contain
the same alien 16S rDNA sequence in addition to its own genome. DNA can then be
extracted from each colony, amplified and sequenced . This method is both time and
work consuming, and the number of different sequences possible to process is low
compared to other methods for sequencing. (Simmons, 2010)
An alternative to cloning is the 454/Roche FLX pyrosequencing method (F.
Hoffmann-La Roche Ltd). This sequencing method enables direct sequencing of
several environmental samples at once. The amplified DNA from each sample is
marked with a Multiplex Identifier (MID) attached to the primer during PCR to make
the sequences traceable (F. Hoffmann-La Roche Ltd, 2011 and 2012). Subsequent
analysis will separate the sequence based on MIDs, and estimate phylogenetic
diversity. These data can be used to generate taxonomic summaries and
phylogenetic threes. The individual sequences can be analyzed by Basic Local
Alignment Tool (BLAST).
The system is capable of more than one million reads with a length of 700 high
quality bases. A full sequencing run can be completed in 23 hours. There are 132
MIDs available, and 2, 4, 8 and 16 gaskets possible. The gaskets are different
physical compartments capable of increasing the number of possible samples
significantly. In one experiment, a total of 473 169 sequence reads with an average
of 260 bases including MIDs and primer sequences were obtained from 57 samples
(Wu et al., 2010).
The sequencing method is available through e.g. Eurofins MWG Operon (Germany)
and Norwegian Sequencing Center (NSC). The price for a full sequence at NSC is
approximately 100 000 NOK. This gives a total read of 1.2 million sequences. It is
possible to separate the run into two or four gaskets, 200 000 sequences per gasket.
The price for one gasket is between 22 000 and 25 000 NOK.

4. Discussion
54
4.4.3 FISH
Fluorescence in situ hybridization (FISH) is used to identify microbes in their natural
environment, in situ. Fluorescent probes bind to complementary DNA sequences
within the microbe’s ribosomal DNA and will hence be visible by a fluorescent
microscope. FISH can give information about the relative number of microbes of one
type compared to others, and their spatial orientation with respect to each other.
The original three fluorescent colors red, green, and blue can bind to the same
organism and together create a new color. Red and green will for example turn
yellow when combined. Up to seven different populations can be visualized in the
same experiment by combining colors. (Nederlof et al., 1990)
This is a valuable addition to DGGE analysis for microbe analysis of environmental
samples and should be used in further analysis of the reactors after species has
been identified through sequencing. The sequencing results can be used to design
probes relevant to the reactors.

5. Conclusion
55
5 Conclusion
Two reactors respectively based on cow and pig manure were followed from
September 2011 to May 2012 and sampled regularly. DNA was extracted from the
samples and amplified by polymerase chain reaction (PCR) using the universal
bacteria primers 338f and 518r. Fingerprinting by denaturing gradient gel
electrophoresis (DGGE) was used to visualize the microbial diversity in the reactors.
DGGE was capable of detecting shifts in the microbial community, but no correlation
was found between changes in band pattern and changes in operating conditions.
Changes in the microbial diversity can be slow and DGGE can only present the
diversity in relative amounts, not the activity level of said microbes.
DGGE is a highly reproducible and consistently performing fingerprinting technique
capable of comparing several samples in one gel. It is hence an adequate technique
for monitoring the microbial community of the reactor long term.
An assortment of DGGE gel bands was excised and sequences, but the results were
either negative or of too poor quality for further analysis. The main reason is probably
insufficient separation or contamination of the DNA bands leading to plural DNA
sequences in the same sample.

5. Conclusion
56

References
57
References
AMANN, R. I., LUDWIG, W. & SCHLEIFER, K.-H. 1995. Phylogenetic Identification and In Situ Detection of Individual Microbial Cells without Cultivation. Microbiological reviews, 59, 143–169.
BALK, M., WEILMA, J. & STAMS, A. J. M. 2002. Thermotoga lettingae sp. nov., a novel thermophilic, methanol-degrading bacterium isolated from a thermophilic anaerobic reactor. Int J Syst Evol Micr, 52, 7.
BIOFORSK 2010. Biogass, Kunnskapsstatus og forskningsbehov. Bioforsk Report, 5.
BRITTO, D. B. & KRONZUCKER, H. J. 2002. NH4+ toxicity in higher plants: a critical review. Journal of plant physiology, 159, 567-584.
COLE, J. R., WANG, Q., CHAI, B. & TIEDJE, J. M. 2011. The Ribosomal Database Project: sequences and software for high-throughput rRNA analysis in Handbook of Molecular Microbial Ecology I: Metagenomics and Complementary Approaches Hoboken, NJ, J. Wiley & Sons, Inc.
CROSBY, L. D. & CRIDDLE, C. S. 2003. Understanding Bias in Microbial Community Analysis Techniques due to rrn Operon Copy Number Heterogenity. BioTechniques, 34.
DET KONGELIGE LANDBRUKS- OG MATDEPARTEMENTET 2008 - 2009. Stortingsmelding nr. 39 (2008 - 2009), Klimautfordringene - landbruket en del av løsningen, Oslo.
EUROFINS MWG OPERON. 2012. Standard primers [Online]. Available: https://ecom.mwgdna.com/services/manage-primers/standard-primer-list.tcl [Accessed 30.05 2012].
F. HOFFMANN-LA ROCHE LTD 2011. 454 Sequencing; GS FLX+ System; Sanger-like read lengths - the power of next-gen throughput.
F. HOFFMANN-LA ROCHE LTD. 2012. GS FLX+ System [Online]. Available: http://454.com/products/gs-flx-system/index.asp [Accessed 02.07. 2012].
FERRIS, M. J. & WARD, D. M. 1997. Seasonal Distributions of Dominant 16S rRNA-Defined Populations in a Hot Spring Microbial Mat Examined by Denaturing Gradient Gel Electrophoresis. Applied and environmental microbiology, 63, 6.
FORSBERG, I-R. 2011. Biogas from livestock manure, Molecular biological methods for microbial community analysis in biogas plants.
GERARDI, M. H. 2006. Wastwater Bacteria (Wastewater Microbiology). 1 ed.: Wiley.

References
58
HATTAORI, A., KAMAGATA, Y., HANADA, S. & SHOUN, H. 2000. Thermacetogenium phaeum gen. nov., sp. nov., a strictly anaerobic, thermophilic, syntrophic acetate-oxidizing bacterium. Int J Syst Evol Micr, 50, 8.
HJORTH, M., GRÄNITZ, K., ADAMSEN, A. P. S. & MØLLER, H. B. 2011. Extrusion as a pretreatment to increase biogas production. Bioresource Technology, 102, 4989–4994.
INGENY. 2011. INGENYphorU, DGGE equipment [Online]. Available: http://www.ingeny.com/IngenyphorU.html [Accessed 01 Dec 2011].
KIM, J., SHIN, S. G., HAN, G., O'FLAHERTY, V., LEE, C. & HWANG, S. 2011. Common key acidogen populations in anaerobic reactors treating different wastewater: Molecular identification and quantitive monitoring. Water Research, 45, 10.
KLIMA- OG FORURENSNINGSDIREKTORATET. 2011. Nasjonale miljømål, Klima [Online]. Available: http://www.miljostatus.no/miljomal/Mal-og-nokkeltall/Klimaendringer/ [Accessed 15. Nov 2011].
LEE, M. & ZINDER, S. H. 1988. Isolation and Characterization of a Thermophilic Bacterium Which Oxidizes Acetate in Syntrophic Association with a Methanogen and Which Grows Acetogenically on H2-CO2. Applied and environmental microbiology, 54, 5.
MADIGAN, M., MARTINKO, J., STAHL, D. & CLARK, D. 2011. Brock Biology of Microorganisms, Person.
MALIN, C. & ILLMER, P. 2008. Ability of DNA content and DGGE analysis to reflect the performance condition of an anaerobic biowaste fermenter. Microbiological Research, 163.
MO-BIO Instruction Manual PowerSoil DNA Isolation Kit. In: INC., M. B. L. (ed.).
MURRAY, E., HOLLIBAUGH, J. T. & ORREGO, C. 1996. Phylogenetic Compositions of Bacterioplankton from Two California Estuaries Compared by Denaturing Gradient Gel Electrophoresis of 16S rDNA Fragments. Applied and environmental microbiology, 62, 4.
MUYZER, G., DE WAAL, E. C. & UITIERLINDEN, A. G. 1993. Profiling of Complex Microbial Populations by Denaturing Gradient Gel electrophoresis Analysis of Polymerase Chain Reaction-Amplified Genes Coding for 16S rRNA. Applied and environmental microbiology, 59, 695-700.
MUYZER, G. & SMALLA, K. 1998. Application of denaturing gradient gel electrophoresis (DGGE) and temperature gradient gel electrophoresis (TGGE) in microbial ecology. Antonie van Leeuwenhoek, 73, 127-141.

References
59
MØLLER, H. B., SOMMER, S. G. & AHRING, B. K. 2004. Methane productivity of manure, straw and solid fractions of manure. Biomass and Bioenergy, 26, 485-495.
NEDERLOF, P. M., VAN DER FLIER, S., WIEGANT, J., RAAP, A. K., TANKE, H. J., PLOEM, J. S. & VAN DER PLOEG, M. 1990. Multiple Fluorescence In Si tu Hybridization. journal of the International Society for Advanced Cytometry, 11, 5.
NORGES FORSKNINGSRÅD Prosjektbeskrivelse for prosjektnr. (208019/110), Biogas Reactor Tchnology for Norwegian Agriculture.
NÜBEL, U., ENGELEN, B., FELSKE, A., SNAIDR, J., WIESHUBER, A., AMANN, R. I., LUDWIG, W. & BACKHAUS, H. 1996. Sequence Heterogeneities of Genes Encoding 16S rRNAs in Paenibacillus polymyxa Detected by Temperature Gradient Gel Electrophoresis. Journal of Bacteriology, 178, 7.
RØSTAD, A. S. Ø. 2010. Biogass Trøndelag, Mikrobiell metodikk for design og drift av lokale gårdsanlegg. Institute of biotechnology, NTNU.
SIMMONS, M.S., D. M. , Principles of Genetics. 5th ed. 2010: Wiley
SCHNÜRER, A. & JARVIS, Å. 2009. Mikrobiologisk handbok för biogasanlägningar. , Avfall Sverige Utvecling och Svensk Bastekniskt Center AB.
SCHNÜRER, A., SCHINK, B. & SVENSSON, B. H. 1996. Clostridium ultunense sp. nov., a mesophilic bacterium oxidizing acetate in syntrophic association with a hydrogenotrophic methanogenic bacterium. Int J Syst Evol Micr 46, 8.
VOLFOVA, O., SUCHARDOVA, O. & KRUMPHANZL, V. 1982. Anaerobic Degradation of Cellulose and Formation of Methane. Folia Microbiologica, 27, 354-362.
WANG, Y. & QIAN, P.-Y. 2009. Conservative Fragments in Bacterial 16S rRNA Genes and primer Design for 16S Ribosomal DNA Amplicons in Metagenomic Studies. PLoS ONE, 4.
WESTERHOLM, M., DOFLING, J., SHERRY, A., GRAY, N. D., HEAD, I. & SCHNÜRER, A. 2011. Quantification of syntrophic acetate-oxidizing microbial communities in biogas production. Environmental Microbiology Reports, 3, 500-505.
WESTERHOLM, M., ROOS, S. & SCHNÜRER, A. 2010. Syntrophaceticus schinkii gen. nov., sp. nov., an anaerobic, syntrophic acetate-oxidizing bacterium isolated from a mesophilic anaerobic filter. FEMS Microbiology Reviews, 309, 4.
WINTZINGERODE, F. V., GÖBEL, U. B. & SRACKEBRANDT, E. 1997. Determination of microbial diversity in environmental samples: pitfalls of PCR-based rRNA analysis. FEMS Microbiology Reviews, 21, 6.

References
60
WU, G. D., LEWIS, J. D., HOFFMANN, C., CHEN, Y.-Y., R., K., BITTINGER, K., HWANG, J., CHEN, J., BERKOWSKY, R., NESSEL, L., LI, H. & BUSHMAN, F. D. 2010. Sampling and pyrosequencing methods for characterizing bacterial communities in the human gut using 16S sequence tags. MBC Microbiology, 10.
YUN, F. 2011. Project description and process figure from Fan Yun. In: COLLEGE, T. U. (ed.).
ØSTGAARD, K. 2005. Miljøbioteknologi Del 1: Basis, Institutt for bioteknologi, NTNU.

Appendices
Appendices
Appendix A: Primary data for the cow manure reactor
Appendix B: Primary data for the pig manure reactor
Appendix C: Protocol for PowerSoil®DNA Isolation Kit
Appendix D: Protocol for QIAquick PCR Purification Kit
Appendix E: Protocol for Ingeny DGGE system

Appendices
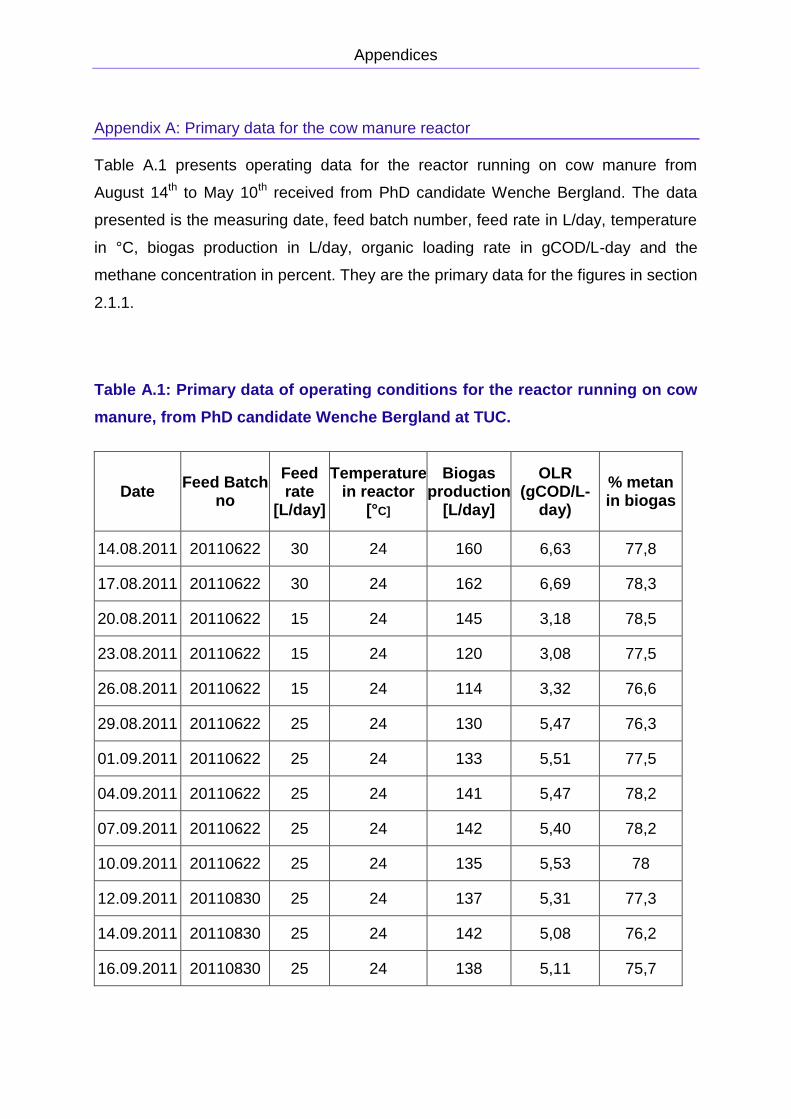
Appendices
Appendix A: Primary data for the cow manure reactor
Table A.1 presents operating data for the reactor running on cow manure from
August 14th to May 10th received from PhD candidate Wenche Bergland. The data
presented is the measuring date, feed batch number, feed rate in L/day, temperature
in °C, biogas production in L/day, organic loading rate in gCOD/L-day and the
methane concentration in percent. They are the primary data for the figures in section
2.1.1.
Table A.1: Primary data of operating conditions for the reactor running on cow
manure, from PhD candidate Wenche Bergland at TUC.
Date Feed Batch
no
Feed rate
[L/day]
Temperature in reactor
[°C]
Biogas production
[L/day]
OLR (gCOD/L-
day)
% metan in biogas
14.08.2011 20110622 30 24 160 6,63 77,8
17.08.2011 20110622 30 24 162 6,69 78,3
20.08.2011 20110622 15 24 145 3,18 78,5
23.08.2011 20110622 15 24 120 3,08 77,5
26.08.2011 20110622 15 24 114 3,32 76,6
29.08.2011 20110622 25 24 130 5,47 76,3
01.09.2011 20110622 25 24 133 5,51 77,5
04.09.2011 20110622 25 24 141 5,47 78,2
07.09.2011 20110622 25 24 142 5,40 78,2
10.09.2011 20110622 25 24 135 5,53 78
12.09.2011 20110830 25 24 137 5,31 77,3
14.09.2011 20110830 25 24 142 5,08 76,2
16.09.2011 20110830 25 24 138 5,11 75,7

Appendices
19.09.2011 20110830 25 24 150 5,36 75,5
21.09.2011 20110830 25 24 154 5,56 75,8
23.09.2011 20110830 25 24 152 5,43 76
26.09.2011 20110830 10 24 154 1,95 76,2
28.09.2011 20110830 10 24 103 2,08 75,7
30.09.2011 20110830 25 24 91 5,14 74,5
03.10.2011 20110830 25 24 144 5,00 74,7
05.10.2011 20110830 25 24 142 5,54 75,5
07.10.2011 20110830 25 24 150 5,46 75,7
10.10.2011 20110830 25 24 148 4,94 76
12.10.2011 20110830 25 30 145 5,48 75,9
14.10.2011 20110830 25 30 200 5,03 73,3
17.10.2011 20110830 25 30 193 5,00 72,5
19.10.2011 20110830 25 35 198 5,05 72,7
21.10.2011 20110830 25 35 222 4,78 71,6
24.10.2011 20110830 25 35 202 5,29 72,3
26.10.2011 20110830 25 35 203 5,12 71,6
28.10.2011 20110830 50 35 204 10,43 71,8
31.10.2011 20110830 50 35 309 9,59 73,7
02.11.2011 20110830 50 35 315 9,99 74,6
04.11.2011 20110830 50 35 319 10,31 74,5
07.11.2011 20111107 50 35 305 9,81 74,4
09.11.2011 20111107 50 35 290 10,22 73,6
11.11.2011 20111107 50 35 260 10,48 73,6
14.11.2011 20111107 50 35 247 10,76 71,6
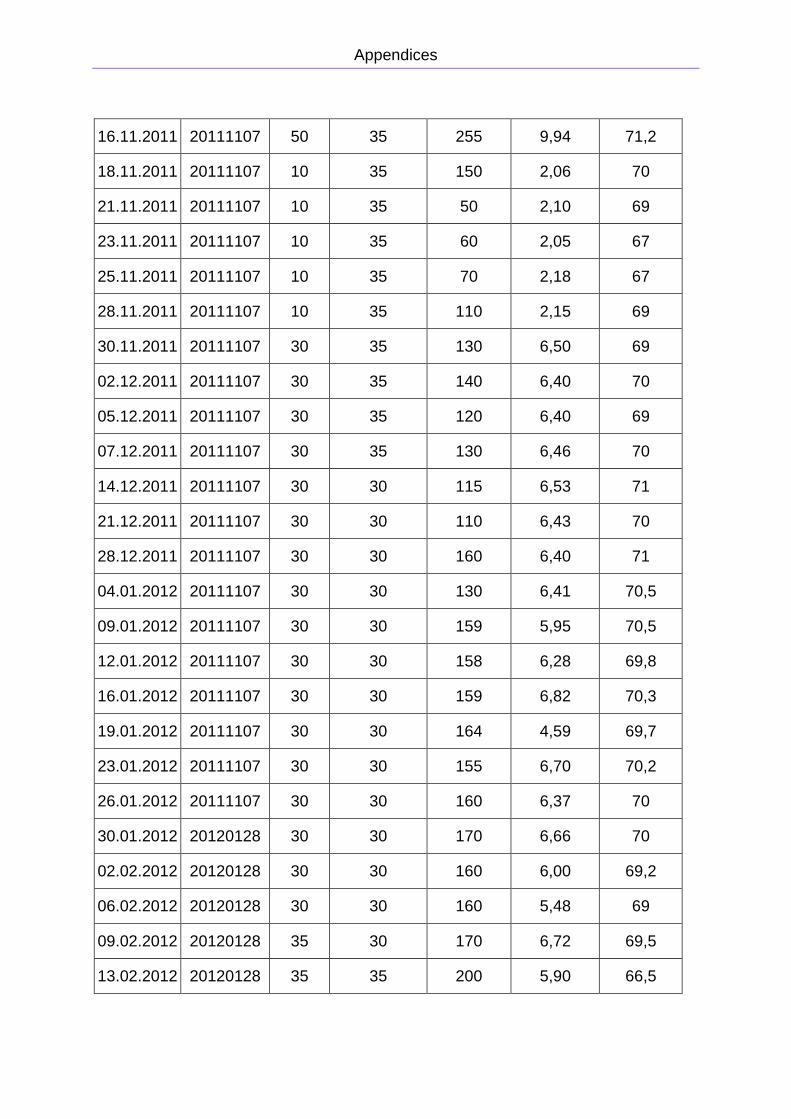
Appendices
16.11.2011 20111107 50 35 255 9,94 71,2
18.11.2011 20111107 10 35 150 2,06 70
21.11.2011 20111107 10 35 50 2,10 69
23.11.2011 20111107 10 35 60 2,05 67
25.11.2011 20111107 10 35 70 2,18 67
28.11.2011 20111107 10 35 110 2,15 69
30.11.2011 20111107 30 35 130 6,50 69
02.12.2011 20111107 30 35 140 6,40 70
05.12.2011 20111107 30 35 120 6,40 69
07.12.2011 20111107 30 35 130 6,46 70
14.12.2011 20111107 30 30 115 6,53 71
21.12.2011 20111107 30 30 110 6,43 70
28.12.2011 20111107 30 30 160 6,40 71
04.01.2012 20111107 30 30 130 6,41 70,5
09.01.2012 20111107 30 30 159 5,95 70,5
12.01.2012 20111107 30 30 158 6,28 69,8
16.01.2012 20111107 30 30 159 6,82 70,3
19.01.2012 20111107 30 30 164 4,59 69,7
23.01.2012 20111107 30 30 155 6,70 70,2
26.01.2012 20111107 30 30 160 6,37 70
30.01.2012 20120128 30 30 170 6,66 70
02.02.2012 20120128 30 30 160 6,00 69,2
06.02.2012 20120128 30 30 160 5,48 69
09.02.2012 20120128 35 30 170 6,72 69,5
13.02.2012 20120128 35 35 200 5,90 66,5

Appendices
16.02.2012 20120128 35 35 185 6,55 68
23.02.2012 20120128 50 35 225 9,73 68,8
27.02.2012 20120128 50 35 230 9,22 68,8
01.03.2012 20120128 50 35 250 9,62 69,2
05.03.2012 20120128 50 35 252 9,21 69,3
08.03.2012 20120128 50 35 270 9,61 69
12.03.2012 20120128 50 35 290 10,44 69,8
15.03.2012 20120128 50 35 280 9,58 69,4
19.03.2012 20120128 25 35 230 4,67 70
22.03.2012 20120128 25 35 160 5,01 69,7
26.03.2012 20120128 25 35 170 4,67 69,3
29.03.2012 20120327 25 35 160 4,93 69,2
02.04.2012 20120327 25 35 160 4,87 69,1
05.04.2012 20120327 25 35 170 5,36 69
09.04.2012 20120327 25 35 180 5,50 68,8
13.04.2012 20120327 25 35 185 5,49 69,1
16.04.2012 20120327 25 35 200 4,89 69
20.04.2012 20120327 25 35 120 4,82
23.04.2012 20120327 25 35 140 5,34 64
26.04.2012 20120327 25 35 150 5,78 65
30.04.2012 20120327 25 35 160 5,73 67,5
03.05.2012 20120327 25 35 200 5,73 68
07.05.2012 20120327 25 35 200 5,78 69,2
10.05.2012 20120327 35 35 205 7,77 69,5
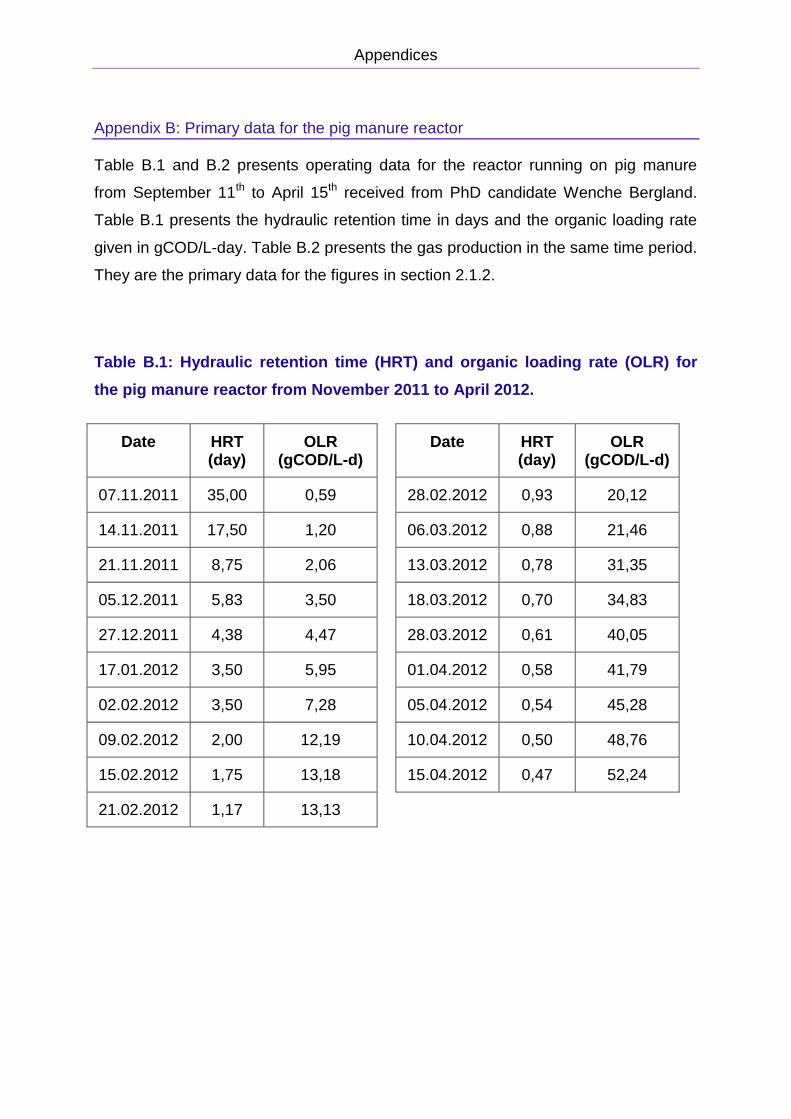
Appendices
Appendix B: Primary data for the pig manure reactor
Table B.1 and B.2 presents operating data for the reactor running on pig manure
from September 11th to April 15th received from PhD candidate Wenche Bergland.
Table B.1 presents the hydraulic retention time in days and the organic loading rate
given in gCOD/L-day. Table B.2 presents the gas production in the same time period.
They are the primary data for the figures in section 2.1.2.
Table B.1: Hydraulic retention time (HRT) and organic loading rate (OLR) for
the pig manure reactor from November 2011 to April 2012.
Date HRT (day)
OLR (gCOD/L-d)
Date HRT (day)
OLR (gCOD/L-d)
07.11.2011 35,00 0,59 28.02.2012 0,93 20,12
14.11.2011 17,50 1,20 06.03.2012 0,88 21,46
21.11.2011 8,75 2,06 13.03.2012 0,78 31,35
05.12.2011 5,83 3,50 18.03.2012 0,70 34,83
27.12.2011 4,38 4,47 28.03.2012 0,61 40,05
17.01.2012 3,50 5,95 01.04.2012 0,58 41,79
02.02.2012 3,50 7,28 05.04.2012 0,54 45,28
09.02.2012 2,00 12,19 10.04.2012 0,50 48,76
15.02.2012 1,75 13,18 15.04.2012 0,47 52,24
21.02.2012 1,17 13,13
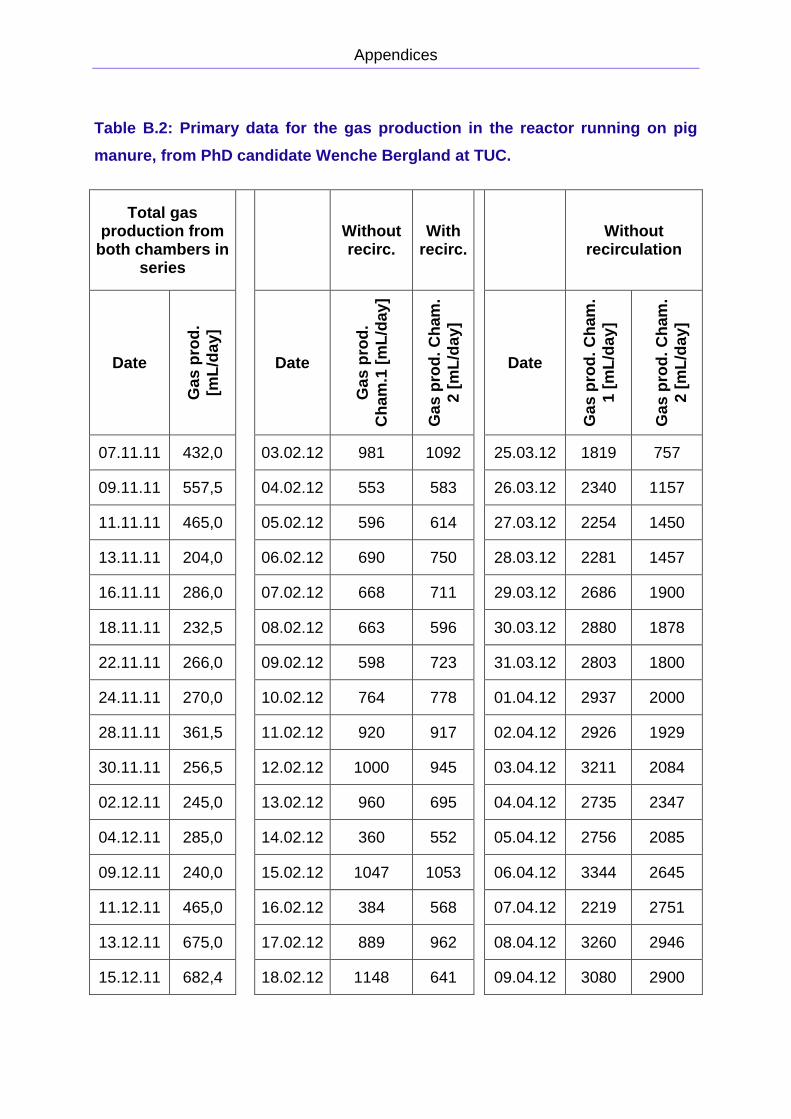
Appendices
Table B.2: Primary data for the gas production in the reactor running on pig
manure, from PhD candidate Wenche Bergland at TUC.
Total gas production from
both chambers in series
Without recirc.
With recirc.
Without recirculation
Date
Ga
s p
rod
.
[mL
/da
y]
Date G
as
pro
d.
Ch
am
.1 [
mL
/day
]
Ga
s p
rod
. C
ham
.
2 [
mL
/da
y]
Date
Ga
s p
rod
. C
ham
.
1 [
mL
/da
y]
Ga
s p
rod
. C
ham
.
2 [
mL
/da
y]
07.11.11 432,0 03.02.12 981 1092 25.03.12 1819 757
09.11.11 557,5 04.02.12 553 583 26.03.12 2340 1157
11.11.11 465,0 05.02.12 596 614 27.03.12 2254 1450
13.11.11 204,0 06.02.12 690 750 28.03.12 2281 1457
16.11.11 286,0 07.02.12 668 711 29.03.12 2686 1900
18.11.11 232,5 08.02.12 663 596 30.03.12 2880 1878
22.11.11 266,0 09.02.12 598 723 31.03.12 2803 1800
24.11.11 270,0 10.02.12 764 778 01.04.12 2937 2000
28.11.11 361,5 11.02.12 920 917 02.04.12 2926 1929
30.11.11 256,5 12.02.12 1000 945 03.04.12 3211 2084
02.12.11 245,0 13.02.12 960 695 04.04.12 2735 2347
04.12.11 285,0 14.02.12 360 552 05.04.12 2756 2085
09.12.11 240,0 15.02.12 1047 1053 06.04.12 3344 2645
11.12.11 465,0 16.02.12 384 568 07.04.12 2219 2751
13.12.11 675,0 17.02.12 889 962 08.04.12 3260 2946
15.12.11 682,4 18.02.12 1148 641 09.04.12 3080 2900
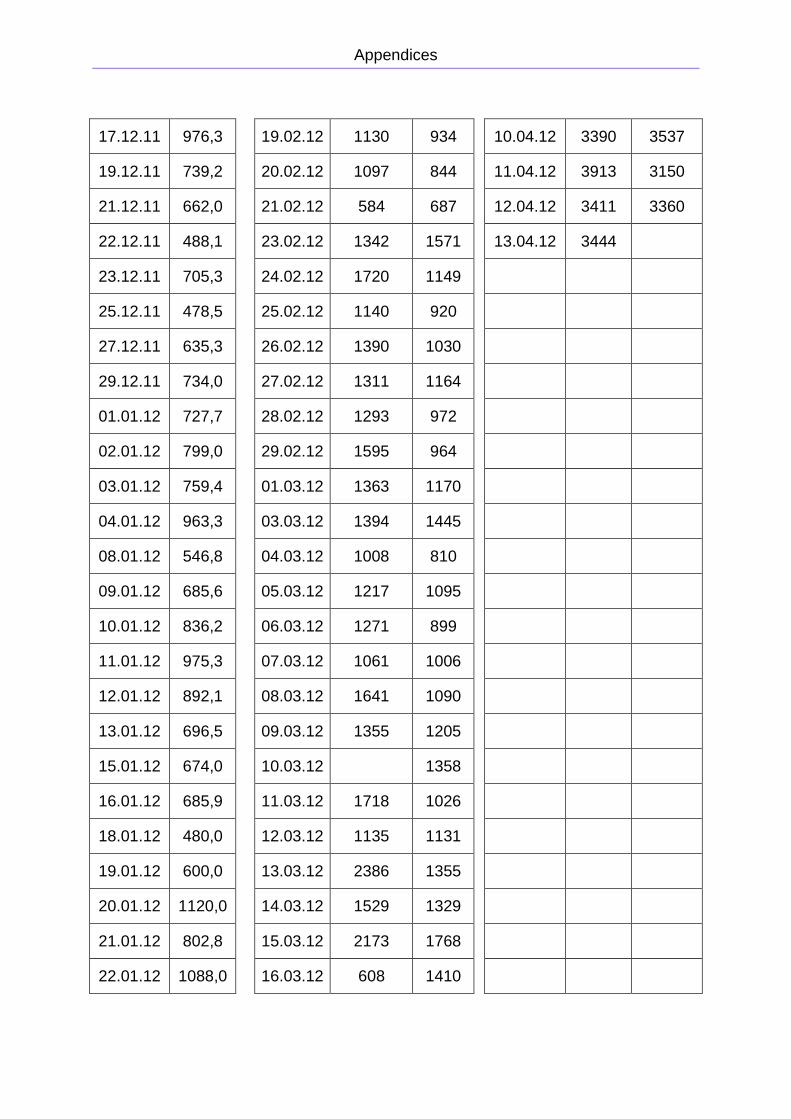
Appendices
17.12.11 976,3 19.02.12 1130 934 10.04.12 3390 3537
19.12.11 739,2 20.02.12 1097 844 11.04.12 3913 3150
21.12.11 662,0 21.02.12 584 687 12.04.12 3411 3360
22.12.11 488,1 23.02.12 1342 1571 13.04.12 3444
23.12.11 705,3 24.02.12 1720 1149
25.12.11 478,5 25.02.12 1140 920
27.12.11 635,3 26.02.12 1390 1030
29.12.11 734,0 27.02.12 1311 1164
01.01.12 727,7 28.02.12 1293 972
02.01.12 799,0 29.02.12 1595 964
03.01.12 759,4 01.03.12 1363 1170
04.01.12 963,3 03.03.12 1394 1445
08.01.12 546,8 04.03.12 1008 810
09.01.12 685,6 05.03.12 1217 1095
10.01.12 836,2 06.03.12 1271 899
11.01.12 975,3 07.03.12 1061 1006
12.01.12 892,1 08.03.12 1641 1090
13.01.12 696,5 09.03.12 1355 1205
15.01.12 674,0 10.03.12
1358
16.01.12 685,9 11.03.12 1718 1026
18.01.12 480,0 12.03.12 1135 1131
19.01.12 600,0 13.03.12 2386 1355
20.01.12 1120,0 14.03.12 1529 1329
21.01.12 802,8 15.03.12 2173 1768
22.01.12 1088,0 16.03.12 608 1410
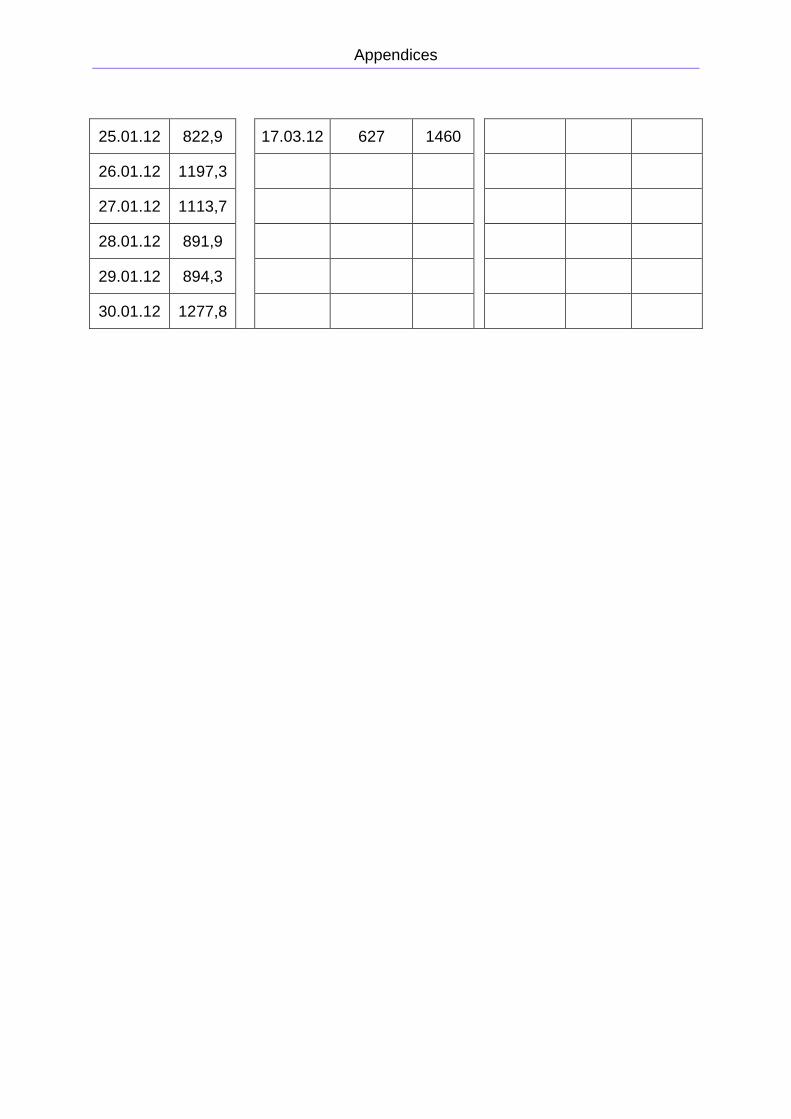
Appendices
25.01.12 822,9 17.03.12 627 1460
26.01.12 1197,3
27.01.12 1113,7
28.01.12 891,9
29.01.12 894,3
30.01.12 1277,8
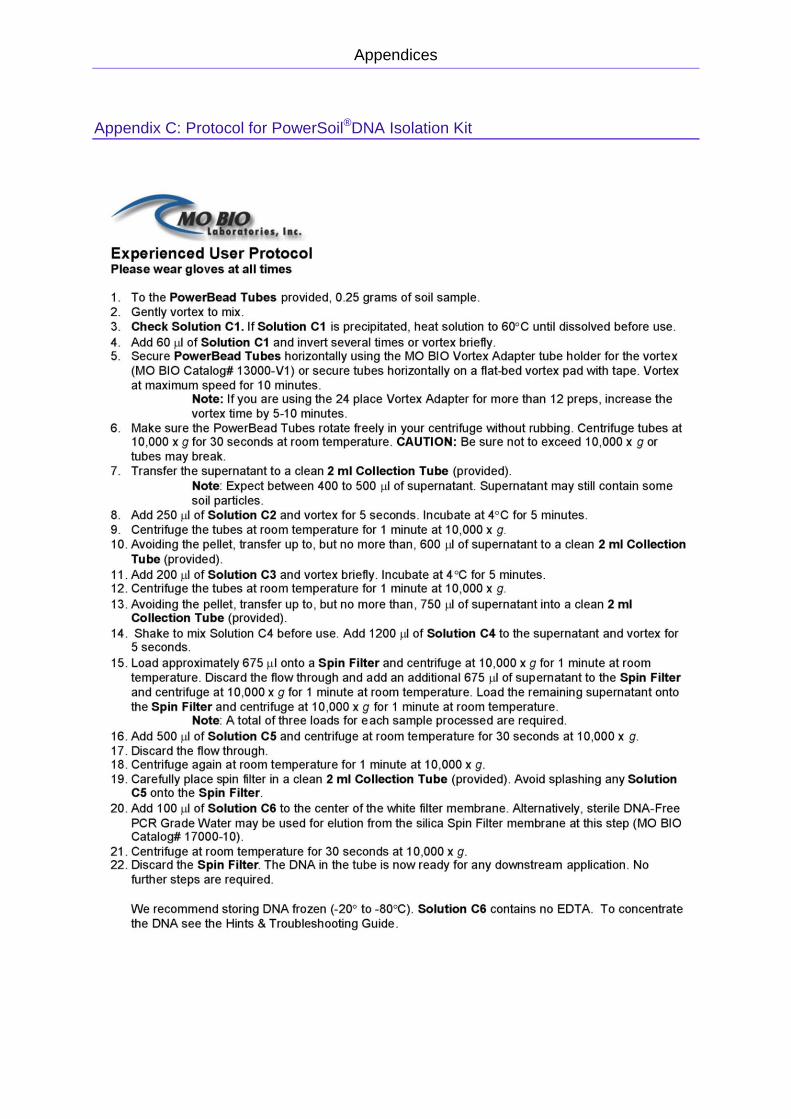
Appendices
Appendix C: Protocol for PowerSoil®DNA Isolation Kit

Appendices

Appendices
Appendix D: Protocol for QIAquick PCR Purification Kit

Appendices

Appendices
Appendix E: Protocol for Ingeny DGGE system
Mounting of glass plates
1. Wash the two glass plates, the spacer, and comb, using Deconex soap and hot
tap water. Finally rinse well with water to remove any traces of soap. Polish one
side of each glass plate using 96% ethanol and Kimwipe paper.
2. Assemble the glass plates and spacer, and place it all in the gel box. Assure that
the spacer is aligned to the lower edge of the glass plates. Tighten the screws.
3. Loosen the two uppermost screws, mount the comb, and then tighten the screws
again.
Preparation of DGGE solutions
1. Determine the acrylamide per cent and the denaturing gradient of the gel (for
recipes of solutions, -see below).
2. Make acrylamide solutions with the desired denaturing percentages in two 50 ml
tubes (total volume in each tube will be 24 ml; see table below for volumes of 0%
and 80% denaturing solutions).
3. The 0% denat. acrylamide solution can be added to the 50 ml tubes without
sterile filtration. The 80% denat. acrylamide solution needs to be filtered upon
addition.
4. Prepare a 50 ml tube with 8 ml 0% denat. acrylamide solution (“stacking gel” for
the top part of the gel).
5. When ready to pour the gel, add 16µl TEMED to the 24 ml gel solutions, and 10µl
TEMED until the 8 ml ”stacking gel” solution.
6. Directly prior to pouring the gel, add 87µl APS (10% Ammonium persulfate) in
both 24 ml gel solutions (for the stacking gel, add 40µl APS, but not until the
stacking gel is ready for pouring).

Appendices
Casting the gel
1. Rinse the gradient mixer and the tubes by pumping MilliQ water through the
system.
2. Turn off the pump, close the valve between the chambers of the gradient mixer,
and put the gradient mixer on magnetic stirring.
3. Pour the gel solution with low denat. percentage in the “left” chamber. Quickly
open and close the valve to remove any air bubbles in the channel between the
chambers. Use a pipette to remove the small amounts of gel solution from the
“right” chamber.
4. Pour the gel solution with high denat. percentage in the “right” chamber.
5. Start the pump, wait a few seconds until the gel solution from the ”right” chamber
has migrated ~7-8 cm out in the tube. Then open the valve between the
chambers. Assure stirring in both chambers.
6. Place the syringe between the glass plates (assure that no water from the
washing step is left in the tube).
7. When the gel reaches approximately 1 cm below the comb, stop the pump,
remove the syringe, and empty leftovers from the mixing chambers and the
flexible tubes. Rinse the system with a small amount of MilliQ water.
8. When the mixing chambers are empty from water, close the valve and stop the
pump. Add APS to the “stacking gel” solution, mix, and pour into the “right”
chamber.
9. Start the pump again. When the glass plates are completely filled with the
stacking gel, turn off the pump, and press the comb down to the correct position.
Tighten the screws.
10. Leave the gel for polymerization for at least two hours.
11. Pump MilliQ water through the system to avoid gel polymerization in the tubes.

Appendices
Preparations and addition of samples
1. Make 20 l of 0.5 x TAE (200ml 50 x TAE + 20 l MilliQ) and add appr. 17 l to the
buffer tank (the buffer may be used for 3 runs). Turn on the instrument to heat the
buffer to 600C.
2. Carefully remove the comb from the gel. Loosen all screws, and carefully push
down the spacer. Tighten the screws at the sides of the glass plates (the screws
at the bottom should be loose throughout the electrophoresis).
3. Place the gel system in the buffer tank. Avoid air bubbles beneath the gel.
4. Attach cables and tube, turn on the recirculation. Use a syringe with buffer to
rinse the wells. Turn on the power (100 Volts; should result in approximately 27-
35 mA) and let run while preparing the samples.
5. Add 2-4µl loading dye to 5-15 µl PCR sample. When all samples are ready for
loading, turn of the recirculation and the push the “low voltage” button. Apply the
samples to the wells. Avoid using the 2-3 outermost wells on each side due to
”smiling effects”.
Running the gel
1. Turn on the ”high voltage button”, set the voltage to 100. Run 5-10 min without
recirculation.
2. Turn on the recirculation and run for 17-18 hours.
Staining and visualization
1. Turn off the instrument; lift the gel system over to the blue box.
2. Loosen the screws, and lift out the gel. Carefully separate the glass plates (use
the small red plastic equipment).
3. Transfer the gel to a plastic foil sheet, and place it in the dark blue box.
4. Prepare the staining solution: 30ml MilliQ + 3µl SYBR Gold + 600µl 50 x TAE in a
50 ml tube.

Appendices
5. Distribute the staining solution on the gel, put the lid on the box, and leave for 1-2
hours.
6. Carefully take out the gel, rinse with MilliQ water. Carefully let the water run of
the gel, use a paper towel at the edges of the gel to remove excess water.
7. Wash the UV plate of the ”gel doc” with distilled water and ethanol. Use Kimwipe
paper, and take care to avoid dust and particles on the UV plate (easier to avoid
dust if the plate is not allowed to dry). Finally distribute MilliQ water on the plate
(this makes it possible to move the gel on the UV plate).
8. Carefully transfer the gel from the plastic foil to the UV plate (by turning the
plastic foil “upside down”). Before removing foil, position the gel at the plate.
9. Photograph the gel at different exposures, and save the pictures in original file
format, and e.g. pdf or other formats.
Eluation of bands for sequencing
1. Print out a picture of the gel, and number the bands that are to be sequenced.
2. Add 20µl sterile MilliQ water to eppendorf tubes, and number the tubes according
to the numbering of bands.
3. Pull out the UV plate, and pull on the UV screen. Cover the wrists to protect from
UV radiation. Use the blue 1 ml pipette tips to stick out material from the bands.
Take care to avoid touching other bands. Use a pipette to blow out the material in
the eppendorf tube with water (it should be possible to see whether there is
material in the pipette tip when transferring it to the water).
4. Place the tubes in the fridge overnight.
5. Use 1 µl of the eluate as template in a 25µl PCR reaction.

Appendices
Recipes
For all solutions, add distilled water to obtain the final volume.
50 x TAE-buffer
Per litre:
Tris base 242g
Glacial acetic acid 57,1ml
0.5 M EDTA (pH 8,0) 100ml
Autoclave the buffer.
Deionized formamide:
Deionize 200 ml formamide by adding 7,5g DOWEX RESIN AG 501X8, and stir for 1
hour at room temperature.
Acrylamide solution (0% denaturing):
8% acrylamide in 0,5 x TAE (per 250 ml):
40% acrylamide solution (BioRadLab Inc., Ca., USA) 50 ml
50 x TAE 2.5 ml
Store the solution at 4 0C, protect from light.

Appendices
Denaturing acrylamide solution (80% denaturing):
8% acrylamide, 5,6M urea, 32% formamide in 0,5 x TAE (per 250 ml):
40% acrylamide solution (BioRadLab Inc., Ca., USA) 50 ml
50 x TAE 2,5 ml
Urea 84 g
Deionized formamide 80 ml
Store the solution at 4 0C, protect from light. This solution must be sterile filtered
before pouring the gel.
Composition of low and high denaturing solutions:
Denaturing % 0% 80% TEMED + 10% APS Total volume
15 19,5ml 4,5ml 16µl + 87µl 24ml
25 16,5ml 7,5ml 16µl + 87µl 24ml
30 15 ml 9 ml 16µl + 87µl 24ml
40 12 ml 12 ml 16µl + 87µl 24ml
45 10,5ml 13,5ml 16µl + 87µl 24ml
50 9ml 15ml 16µl + 87µl 24ml
55 7,5ml 16,5ml 16µl + 87µl 24ml
60 6 ml 18 ml 16µl + 87µl 24ml
75 1,5ml 22,5ml 16µl + 87µl 24ml
0% “Stacking gel”:
8 ml 0% acrylamide solution, 40µl 10% APS and 10µl TEMED.
Appendices
10% APS (ammonium persulfate):
10g ammonium persulfate dissolved in 100ml dH2O
Sterile filter the solution, distribute in eppendorf tubes (250µl in each), and keep
frozen.