biofuels and food security - ecofys · biofuels and food security ... lack of agricultural...
TRANSCRIPT

Biofuels and food securityRisks and opportunities
ii
ECOFYS Netherlands B.V. | Kanaalweg 15G | 3526 KL Utrecht| T +31 (0)30 662-3300 | F +31 (0)30 662-3301 | E [email protected] | I www.ecofys.com
Chamber of Commerce 30161191
Biofuels and food security Risks and opportunities
By: Carlo Hamelinck
Date: August 2013
Project number: BIENL13469
© Ecofys 2013 by order of: ePURE

iii
ECOFYS Netherlands B.V. | Kanaalweg 15G | 3526 KL Utrecht| T +31 (0)30 662-3300 | F +31 (0)30 662-3301 | E [email protected] | I www.ecofys.com
Chamber of Commerce 30161191
Summary
This comprehensive overview of the main aspects of the interrelation between food and biofuels
synthesizes previous research on the subject. It addresses the causality between biofuels production,
global crop commodity prices and eventual implications for food security, especially in poor regions
and for poor households. This overview attempts to bring together the relevant economic forces
influencing global (and local) food prices, many of which are absent in other analyses. Thus, it
addresses low stock level impacts on price volatility, how cheap food encourages waste, to what
extent global prices transmit to local prices across regions, and why high prices encourage local
agricultural investment and food security.
Our analysis leads to the following conclusions:
• 2010 crop production was enough to feed 12 billion people and the world can produce more;
• Hunger and poverty have steadily decreased over the past few decades;
• Local hunger is primarily caused by yield gaps, food waste, poor infrastructure, lack of
agricultural investments, lack of local market organisation, conflicts and bad harvests, not by
reduced exports from developed countries;
• Biofuels can help to reduce food price volatility in the EU and in developing economies;
• Higher food and commodity prices can improve food security, especially in developing countries;
• It is uncertain whether EU ethanol raises or lowers the overall price of food. EU ethanol has had
small impacts on global starch and sugar feedstock prices; the historic impact of EU biofuels
demand until 2010 increased world grain prices by about 1-2% and, without any cap on crop-
based biofuel production may lead to another 1% increase through 2020;
• EU historical biodiesel demand for the same period likely increased oilseed prices by around 4%
and, without any cap, may increase future prices by around 10%;
• The prices of primary global agricultural commodities (from which biofuels are produced) are not
directly correlated to food prices, both because local food markets are often disconnected from
global markets and also because commodity costs are often only a small component of final food
production costs. The terms “primary agricultural commodities” and “food” are not fungible;
• Protein rich co-products from ethanol and biodiesel production avoid land use elsewhere;
• Agricultural commodity prices are strongly linked to the oil price. Biofuels could reduce oil price
increases and as such limit future commodity price increases;
• In no case are biofuels the largest market for globally traded agricultural commodities. For starch
feedstocks, the global trade is driven by animal feed demand, with human and biofuel demand
each under 5%. The global trade in sugar feedstock is driven by sugar; biofuels are the second
largest driver, albeit mostly at national levels. For oilseeds, the global trade is driven primarily by
animal feed demand, secondarily by human food markets and only thirdly by biodiesel;
• Systemic factors, like reduced reserves, food waste, speculation, transportation issues, storage
costs and problems, and hoarding play a much larger role in local food prices. These factors can
be solved and should get much more attention.
We are open to receiving any additional remarks, data or views, at [email protected].
iv
ECOFYS Netherlands B.V. | Kanaalweg 15G | 3526 KL Utrecht| T +31 (0)30 662-3300 | F +31 (0)30 662-3301 | E [email protected] | I www.ecofys.com
Chamber of Commerce 30161191
Table of contents
Summary iii
1 Introduction 1
1.1 Brief history on the food-fuel debate 1
1.2 Food security should be central to the analysis 2
2 Biofuels and global food price developments 4
2.1 Sketch of the situation 4
2.2 Role of biofuels in increasing food prices – summary of other studies 6
2.3 Food crop use for biofuels 7
2.4 Other factors that increase food prices 9
2.5 Biofuels mandates could reduce global price volatility 12
2.6 The role of co-products 13
2.7 Biofuels could reduce the price of oil 14
2.8 Growing biofuel on abandoned cropland 14
2.9 The consequences of high food prices for the poor are ambiguous 15
3 Biofuels and local food security 16
3.1 Transmission of crop prices to food commodity prices 16
3.2 Transmission of global to local food prices 17
3.3 Who gains or loses? 18
3.4 Impact on poverty and hunger 21
4 An opportunity for developing countries 22
4.1 Investments in agriculture are needed 22
4.2 Using bioenergy to improve food security 22
BIENL13469 1
1 Introduction
1.1 Brief history on the food-fuel debate
As biofuels are produced from crops, there is persistent concern that biofuels compete with food
production. The assumption is that this competition drives up food prices and price volatility and so
causes hunger. Many people, including very dignified authorities, accept this simple causality chain.
In October 2007, amidst the 2006-2008 food price crisis, the then UN Special Rapporteur on the right
to food, Jean Ziegler, opined that converting crops into fuels was driving up the prices of food, land
and water. He stated that “it is a crime against humanity to convert agricultural productive soil into
soil which produces food stuff that will be burned into biofuel”1.
In April 2008, the then World Bank President Robert Zoellick said that the demand for ethanol and
other biofuels was a “significant contributor” to soaring food prices around the world (April 2008)2.
Although he insisted that biofuels were not the primary factor and also mentioned six other important
factors3, many article headlines covering his speech put the full blame on biofuels.
Also in April 2008, the UN secretary-general, Ban Ki-moon, rejected Ziegler’s proposal for a
moratorium but called for a comprehensive review of the policy on biofuels as a factor in global food
prices, to which he added that “just criticising biofuel may not be a good solution”4.
Just a few months later, in July 2008, the UK newspaper the Guardian covered a draft of an internal
World Bank report5, claiming that biofuels may be responsible for up to three quarters of the recent
increase in global food prices6,7. The article appeared just days before the G8 summit in Japan, where
soaring food and fuel prices were top of the agenda. When the World Bank officially released a
slightly modified version later that month, the Bank was accused of a cover-up8. The latter version
was largely identical to the draft version, adding an analysis of other reports’ conclusions on biofuels
and food prices.
1 UN News Center, 26 October 2007, UN independent rights expert calls for five-year freeze on biofuel production. 2 NPR, 11 April 2008, World Bank Chief: Biofuels Boosting Food Prices. 3 All the factors mentioned by Mr. Zoellick are: 1) high energy prices; 2) increased demand from developing countries “going from 1 meal a
day to 2 meals a day”; 3) increased meat consumption; 4) biofuels; 5) droughts; 6) reduced food stocks; and 7) speculators. 4 Guardian, 5 April 2008, UN chief calls for review of biofuels policy. 5 World Bank (Mitchell), 2008, A note on rising food prices. 6 Guardian, 3 July 2008, Secret report: biofuel caused food crisis – Internal World Bank study delivers blow to plant energy drive. 7 Note that the Guardian misquoted the World Bank report. Actually, the report quantified 25-30% of the price increase to some factors, and
associated the remaining 70-75% to a list of other factors in which biofuels came first, but not alone. 8 Guardian, 10 July 2008, Exclusive: we publish the biofuels report they didn't want you to read.
BIENL13469 2
The World Bank report received severe critique9 for putting the entire impact of export bans and
commodity speculation on the shoulders of biofuels (the last market entrant), while ignoring other
factors. A later (2010) World Bank report concluded that “the effect of biofuels on food prices has not
been as large as originally thought”10 while another World Bank paper reports that “about 88% of the
rise in global food prices is caused by factors other than biofuels”11. Finally, a 2013 World Bank report
concluded that biofuels have had a very minor impact on global prices over the past decade and that
two thirds of crop commodity price increases have been caused by the global oil price increase and
exchange rate movements12. It is worth noting that this complete reversal of World Bank conclusions
has been almost entirely ignored by the media and policymakers in both 2010 and 2013.
In the past five years, many others have explored the role of biofuels in global food prices. This is
often done by taking into account other structural and incidental factors contributing to increasing
food prices. Other (fewer) studies evaluated the systematic factors that determine how food prices
react to demand and supply shocks. In Chapter Biofuels and global food price developments we
summarise and analyse the key reports.
1.2 Food security should be central to the analysis
The main concern of Ziegler, Zoellick and the leading global institutions involved in the biofuels
debate is, importantly, not about high global food prices but rather about food security for the poor,
which in turn depends on many factors in which biofuels may play a role, positive or negative.
When considering food prices only, the impact on poverty and food security is already ambiguous.
High food prices indeed increase the cost of food for consumers. But they also increase income for
farmers, who represent the bulk of the world’s poor. And they stimulate local investments in
agriculture, necessary for future food security. Whether the net effects are positive or negative
depends on whether poor households or countries buy or import, or sell or export food13.
This study aims to shed more light on the link between biofuels and food security. For this, we think
it is important to understand:
• The distinction between gradual price movements and spikes;
• The link between prices of crops, commodities and food, as these are not identical;
• How flaws in international agricultural trade exacerbate volatility;
• If a predictable demand for a commodity (biofuels) can reduce volatility;
• How global commodity prices affect local food prices;
• Why some countries are more vulnerable to high global food prices than others;
• If high commodity prices are good or bad (or both);
9 For example: LECG, 9 July 2008, critique of world bank working paper “a note of rising food prices”. 10 World Bank (Baffes and Haniotis), 2010, Placing the 2006-2008 commodity price boom into perspective. 11 World Bank (Timilsina and Shrestha), 2010, Biofuels – Markets, targets and impacts. 12 World Bank (Baffes and Dennis), 2013, Long-term drivers of food prices. 13 Swinnen and Squicciarini, 2012, Mixed messages on prices and food security, Science 335:405-406.

BIENL13469 3
• If and how local food supply in developing countries is hindered or helped by biofuels.
These factors have been addressed separately in many different studies. This report summarises and
compares their results. With this comprehensive analysis we aim to present a complete
understanding of how biofuels impact food security and how they could improve food security.
BIENL13469 4
2 Biofuels and global food price developments
2.1 Sketch of the situation
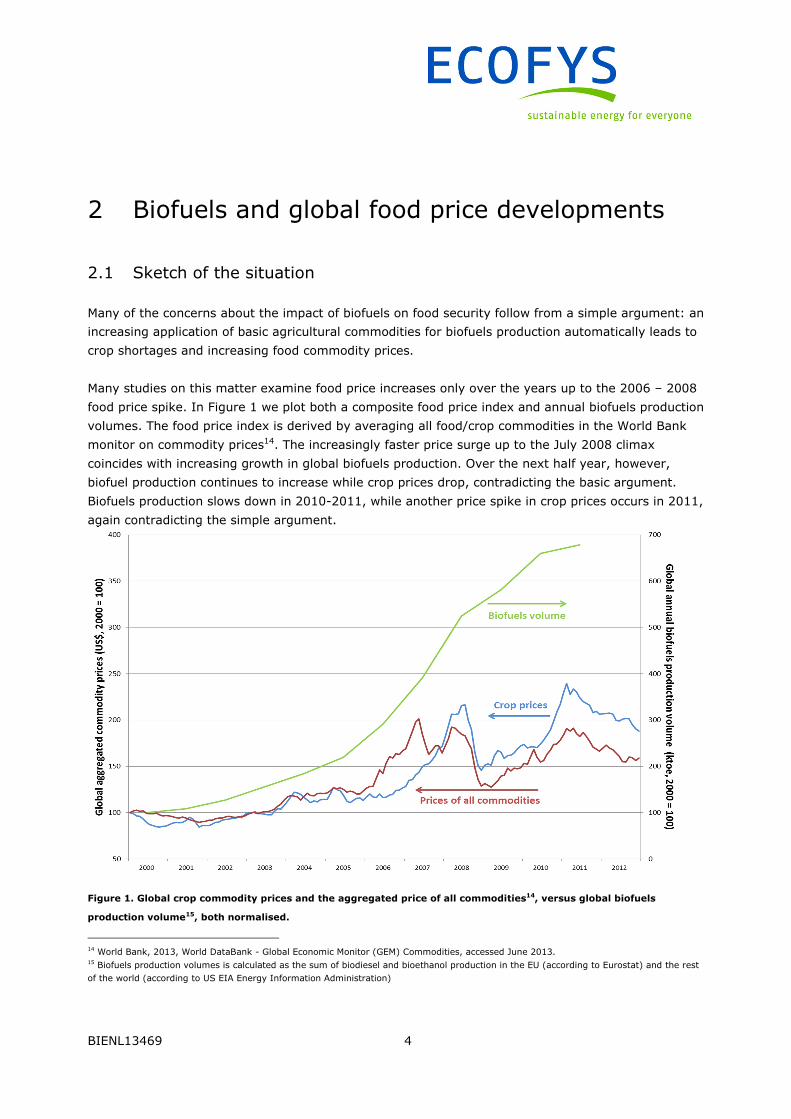
Many of the concerns about the impact of biofuels on food security follow from a simple argument: an
increasing application of basic agricultural commodities for biofuels production automatically leads to
crop shortages and increasing food commodity prices.
Many studies on this matter examine food price increases only over the years up to the 2006 – 2008
food price spike. In Figure 1 we plot both a composite food price index and annual biofuels production
volumes. The food price index is derived by averaging all food/crop commodities in the World Bank
monitor on commodity prices14. The increasingly faster price surge up to the July 2008 climax
coincides with increasing growth in global biofuels production. Over the next half year, however,
biofuel production continues to increase while crop prices drop, contradicting the basic argument.
Biofuels production slows down in 2010-2011, while another price spike in crop prices occurs in 2011,
again contradicting the simple argument.
Figure 1. Global crop commodity prices and the aggregated price of all commodities14, versus global biofuels
production volume15, both normalised.
14 World Bank, 2013, World DataBank - Global Economic Monitor (GEM) Commodities, accessed June 2013. 15 Biofuels production volumes is calculated as the sum of biodiesel and bioethanol production in the EU (according to Eurostat) and the rest
of the world (according to US EIA Energy Information Administration)

BIENL13469 5
Indeed, the chart above shows that a correlation between crop prices and biofuels volume is absent
after 2008, while crop prices correlate strongly with the prices of all commodities, suggesting that the
underlying issue is not biofuels, but something larger.
Disaggregating food prices into subcategories, it becomes clear that price spikes for some crops have
been stronger than for others, see Figure 2. Almost all crops experienced a price spike in 2006-2008,
except cash crops (coffee, tea, etc.). The highest spike concerned crops used for biofuels production,
whereas the bigger part of these crops is used for food and feed. The spike was slightly lower for
food-feed crops that are not used for biofuels and for crops that are applied as a material source
(cotton, rubber).
The figure also shows that the second price spike, in 2010-2011, has been less pronounced for
biofuels/food/feed crops and was actually very strong for crops that have a material application,
which have no causal relation whatsoever to biofuels.
Figure 2. Global crop commodity prices split into subcategories, normalised. ‘Biofuel’ indicates crops and derivatives
that are typically – although not mainly – used for biofuel production (maize, palm oil, soybean oil, soybean,
sorghum, sugar, wheat). ‘Non biofuel’ indicates major food/feed crops that are not or rarely used for biofuels
(coconut oil, copra, groundnut oil, palm kernel oil, rice, barley, soybean meal). ‘Material’ indicates crops that mainly
have material use (cotton, rubber). ‘Fruit’ indicates fruit (bananas, oranges). ‘Luxury’ is a basket of cash crops
(cocoa, coffee, tea, tobacco).
BIENL13469 6
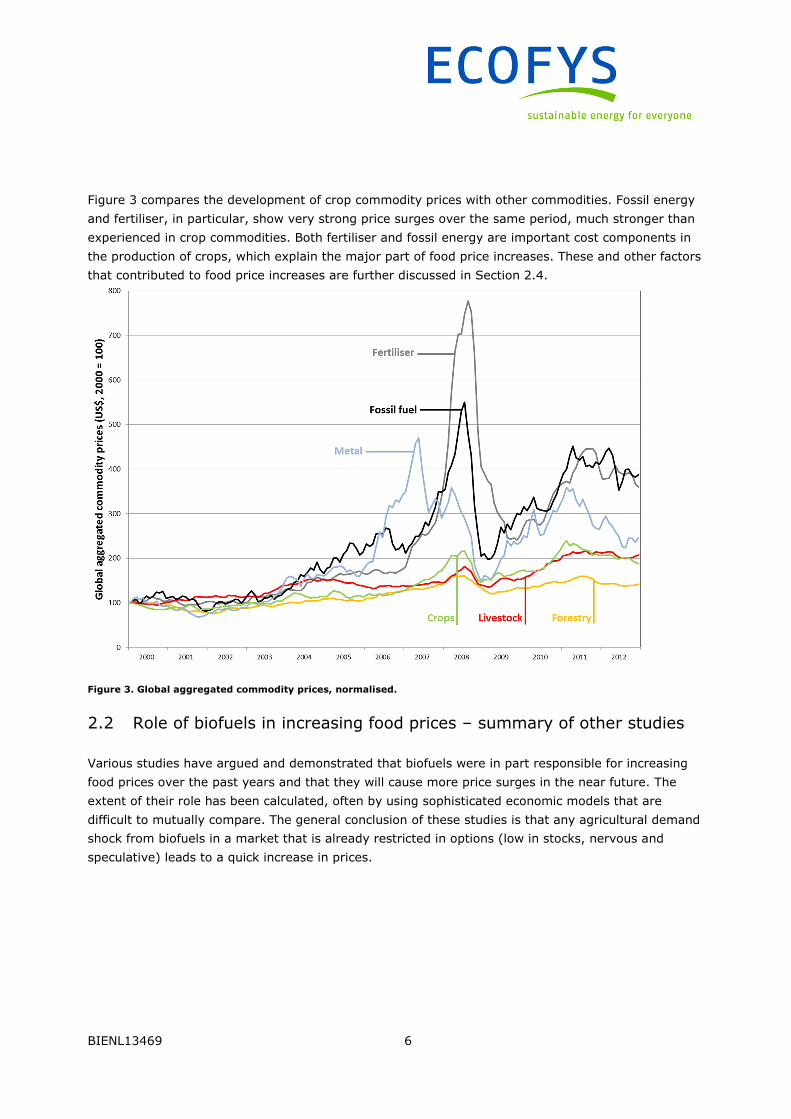
Figure 3 compares the development of crop commodity prices with other commodities. Fossil energy
and fertiliser, in particular, show very strong price surges over the same period, much stronger than
experienced in crop commodities. Both fertiliser and fossil energy are important cost components in
the production of crops, which explain the major part of food price increases. These and other factors
that contributed to food price increases are further discussed in Section 2.4.
Figure 3. Global aggregated commodity prices, normalised.
2.2 Role of biofuels in increasing food prices – summary of other studies
Various studies have argued and demonstrated that biofuels were in part responsible for increasing
food prices over the past years and that they will cause more price surges in the near future. The
extent of their role has been calculated, often by using sophisticated economic models that are
difficult to mutually compare. The general conclusion of these studies is that any agricultural demand
shock from biofuels in a market that is already restricted in options (low in stocks, nervous and
speculative) leads to a quick increase in prices.

BIENL13469 7
In 2012, Action Aid commissioned the Institute for European Environmental Policy (IEEP) to review
the evidence base on the link between policy driven EU biofuels demand and global agricultural
prices16. The study was on a selection of modelling studies.
As a presumption, IEEP notes that “It is clear that this additional demand […] will increase
agricultural commodity prices […]”. As we will argue below, this relates to the short term impacts,
but it remains to be seen if this also holds in the long run.
The study provides a very useful summary of many studies, which they noted “provides a very
heterogeneous picture from which it is very difficult to draw definite conclusions”. Earlier, the World
Bank already noted that “the magnitude of impacts of biofuels on food prices [in a range of cited
literature] is very much sensitive to the models used to assess those impacts”11.
IEEP finds that the most robust model of the impact of EU biofuels policy at the forefront of the group
of models examined predicts, if there is no cap on crop-based fuels in the EU, global increases in
2020 crop prices of about 1% for sugar and starch crops used for ethanol production.
The study also predicts price increases of between 2.5% and 11.3% for certain biodiesel feedstocks,
although it should be noted that the highest price increases were for rapeseed and rape oil, which are
not used at all in poorer countries17. Correcting for this, the study predicts price increases of between
2.48% and 7.3% for oils and oilseeds used for food.
Oxfam Novib cites only the higher ranges from studies that IEEP apparently does not find “most
robust”, and suggests that the IEEP study supports these higher estimates18.
Complementing these conclusions, a back-casting scenario analysis19 shows that EU-27 expanding
biofuel use had only a small contribution to the historical cereal price increases in 2007 to 2010. The
wheat and coarse grain prices increased by about 1-2%, compared to a scenario without biofuel
expansion in the EU-27 during 2000-2010. The price of other crops, including oil crops, increased by
about 4%, compared to a scenario without biofuel expansion in the EU-27 during 2000-2010.
2.3 Food crop use for biofuels
Global biofuels production accounts for a significant part of global use of a number of crops.
FAO/OECD state that in the 2007-09 period, 20% of all sugar cane, 9% of both oilseeds and coarse
grains, and 4% of sugar beet was used for biofuels20. These percentages do not consider co-products.
16 IEEP, 2012, EU biofuel use and agricultural commodity prices: a review of the evidence base, report prepared for Action Aid, Institute for
European Environmental Policy, 17 Actually, EU rapeseed production doubled between 2003 and 2010, largely stimulated by biofuels. 18 Oxfam Novib, 2012, The hunger grains – briefing paper. 19 Ecofys, 2012, Progress in renewable energy and biofuels sustainability. 20 FAO/OECD, 2011, Price volatility in food and agricultural markets: policy responses.
BIENL13469 8
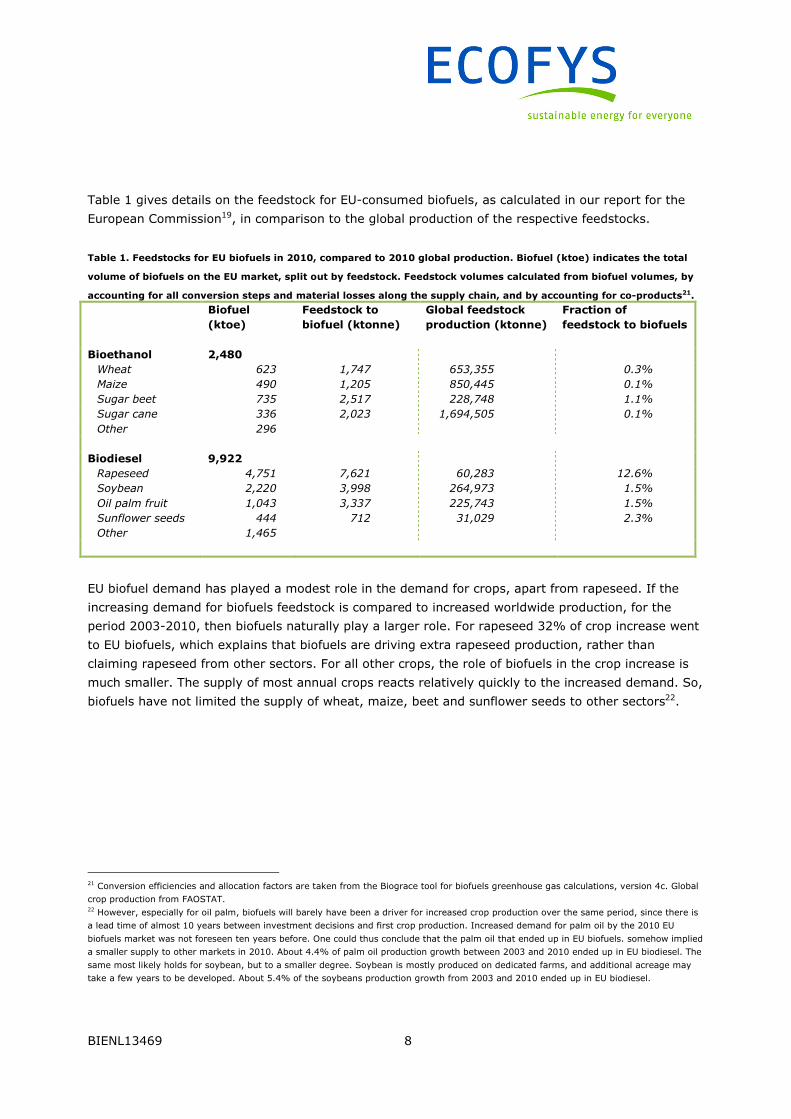
Table 1 gives details on the feedstock for EU-consumed biofuels, as calculated in our report for the
European Commission19, in comparison to the global production of the respective feedstocks.
Table 1. Feedstocks for EU biofuels in 2010, compared to 2010 global production. Biofuel (ktoe) indicates the total
volume of biofuels on the EU market, split out by feedstock. Feedstock volumes calculated from biofuel volumes, by
accounting for all conversion steps and material losses along the supply chain, and by accounting for co-products21.
Biofuel
(ktoe)
Feedstock to
biofuel (ktonne)
Global feedstock
production (ktonne)
Fraction of
feedstock to biofuels
Bioethanol 2,480
Wheat 623 1,747 653,355 0.3%
Maize 490 1,205 850,445 0.1%
Sugar beet 735 2,517 228,748 1.1%
Sugar cane 336 2,023 1,694,505 0.1%
Other 296
Biodiesel 9,922
Rapeseed 4,751 7,621 60,283 12.6%
Soybean 2,220 3,998 264,973 1.5%
Oil palm fruit 1,043 3,337 225,743 1.5%
Sunflower seeds 444 712 31,029 2.3%
Other 1,465
EU biofuel demand has played a modest role in the demand for crops, apart from rapeseed. If the
increasing demand for biofuels feedstock is compared to increased worldwide production, for the
period 2003-2010, then biofuels naturally play a larger role. For rapeseed 32% of crop increase went
to EU biofuels, which explains that biofuels are driving extra rapeseed production, rather than
claiming rapeseed from other sectors. For all other crops, the role of biofuels in the crop increase is
much smaller. The supply of most annual crops reacts relatively quickly to the increased demand. So,
biofuels have not limited the supply of wheat, maize, beet and sunflower seeds to other sectors22.
21 Conversion efficiencies and allocation factors are taken from the Biograce tool for biofuels greenhouse gas calculations, version 4c. Global
crop production from FAOSTAT. 22 However, especially for oil palm, biofuels will barely have been a driver for increased crop production over the same period, since there is
a lead time of almost 10 years between investment decisions and first crop production. Increased demand for palm oil by the 2010 EU
biofuels market was not foreseen ten years before. One could thus conclude that the palm oil that ended up in EU biofuels. somehow implied
a smaller supply to other markets in 2010. About 4.4% of palm oil production growth between 2003 and 2010 ended up in EU biodiesel. The
same most likely holds for soybean, but to a smaller degree. Soybean is mostly produced on dedicated farms, and additional acreage may
take a few years to be developed. About 5.4% of the soybeans production growth from 2003 and 2010 ended up in EU biodiesel.

BIENL13469 9
2.4 Other factors that increase food prices
Other studies have identified other causal factors of recent food price increases/spikes (Table 2).
Table 2. Factors that increase food prices.
Factor Sub-factors
Low stocks • Global market integration reduces the need for domestic stocks
• Demand growth exceeding production increase
• Lagging investments in agriculture
o Low commodity prices in earlier years
o Commodity prices below costs (dumping)
• Yield gap
• Food waste
Decreased supply • Harvest failures (droughts and floods)
• Decrease in subsidized exports and food aid
Increasing demand • Population and diet, obesity and luxury
• Importer policies (hoarding)
• Rapid expansion of biofuels
• (Future: biobased economy)
Increased production costs • Oil and gas price
• Fertiliser
Market dynamics • Speculation
• Trade restrictions (export bans, stockpiling)
• Currency exchange rates (weak dollar)
Among experts there is still uncertainty as to the weighting of the contributions of individual
factors23. Most studies focus on the incidental factors, i.e. the factors that had clearly changed
compared to the situation (shortly) before the price crisis: decreased supply, increased demand and
increased production costs. Long-term factors that paved the way for the crisis are more difficult to
pinpoint than short term factors that caused the incident. Often, market dynamics are seen as factors
that did not, by themselves, cause the food price increase, but amplified the effect so that spikes
rapidly occurred. As there is already much literature that provides detailed analysis on individual
factors, only the main lines are drawn here.
Declining stocks
Agricultural stocks have decreased in recent decades for various reasons. It was even one of the
anticipated consequences of the Uruguay Round Agreement on Agriculture in Marrakesh (April 1994)
that structural surpluses would decrease and that world agricultural prices would “strengthen” (in
effect meaning “rise”, but with a more positive intonation given that in the 1990s the global political
consensus was that higher agricultural prices were needed) as a result of this24. Liberalisation of
23 EC DG AGRI, 2011, High commodity prices and volatility … what lies behind the roller coaster ride? Agricultural Markets Brief #1. 24 ICTSD/FAO 2012, Trade policy responses to food price volatility in poor net food-importing countries.
BIENL13469 10
international trade reduced the need to keep national stocks and increased global competition even
demotivated stockpiling.
While falling stocks may increase the risk of price spikes, all studies typically find it difficult to
quantify such underlying causes that impact the interaction between demand, supply and price. USDA
suggests that a long-term trend of gradually slowing production growth likely played a negligible role
in the recent increase in world prices25. On the other hand, the European Commission concludes that
the price elasticity26 to movements in stocks has increased in the past decades23.
In 2002 Oxfam argued that the Uruguay Round Agreement on Agriculture was inherently unjust, by
legalising unfair trading practices by rich countries and denying poorer countries the chance to
benefit from their share of the wealth generated by global trade. Food prices were depressed to
levels at which local producers in developing countries could not produce. Hence, trade liberalisation
not only reduced stocks, but also hindered agricultural production in the most vulnerable countries27.
One of the causes for the reduction in yield growths and prolongation of yield gaps is the lack of
investment in agriculture.
In recent years, subsidized exports and food aid have drastically declined. This is expected to support
long-term food security, but would do so, necessarily by causing short-term adjustment problems for
those countries that heavily depend on food assistance24.
Low stocks are also connected to inefficiencies in the food chain. After production, it is estimated that
30% to 50% of all food worldwide is currently wasted along the supply chain. In developing
countries, food wastage is mainly caused by inefficient harvesting, inadequate local transportation,
poor infrastructure, inadequate storage and poor market organisation. In mature, fully developed
countries the same fraction of produce is wasted through retail and customer behaviour. Ironically,
the waste in developed countries is largely caused by food being cheap and undervalued28, while in
developed countries the waste points to the necessity of infrastructure investments.
Increasing demand
The complete agri-food system supplies more than sufficient quantities of food for all. The FAO
estimates that, today, enough food is produced to feed 12 billion people29. In their 2012 Statistical
Yearbook, FAO calculates that the world produced over 13 quadrillion calories of food in 2010,
equalling some 5,359 kcal per person per day30, which is indeed more than twice the recommended
average dietary intake of about 2,400 kcal.
25 USDA, 2008, Global agricultural supply and demand: factors contributing to the recent increase in food commodity prices (revised version
July 2008). 26 The change in price compared to the change in commodity supply stock. 27 Oxfam, 2002, Boxing match in agricultural trade - Will WTO negotiations knock out the world’s poorest farmers? Briefing paper 32. 28 Institution of Mechanical Engineers, 2013, Global food waste not, want not. 29 While many organisations cite this claim, we could not find the original source. 30 FAO, Statistical yearbook 2012 – World food and agriculture, Part 3: Feeding the world.
BIENL13469 11
In other studies, the FAO predicts that the global average food intake could rise to 3,070
kcal/person/day by 205031, which is more than recommended for most age and gender groups. The
World Bank notes32 that the “current global overweight and obesity epidemic is likely to expand. This
will present even more challenges to the post-2015 efforts to reduce global malnutrition.” In
combination with more people consuming meat, dairy and vegetable oils, this means that much more
food and feed would be required.
A very different factor that temporarily increases demand is the increased hoarding in reaction to
shortages in the international market. We assume that this can be seen as a healthy correction to the
decreased stockpiling in previous years, discussed in the previous section.
Crops for biofuels and biobased materials put additional pressure on the crop supply, both directly
when they tap into the existing crop production, but also indirectly as land claimed for this feedstock
is not, or is less, available to food production. This is a realistic concern and central to this report. In
Section 2.3, we discussed that the demand for feedstock for EU biofuels so far is small compared to
the crop volumes. In Section 4 we discuss how biofuel feedstock could be produced while enhancing
food supply.
Increasing production costs
Costs of food production have increased as a consequence of increasing energy costs. High crude oil
prices directly impacted the energy costs in crop production, while high natural gas prices increased
the production costs for fertiliser. The USDA convincingly demonstrates that food prices closely follow
the crude oil price, though at a reduced level. During the 2008 food price increase, actually most
non-agricultural prices rose more than agricultural prices33. In fact, a 2013 World Bank report on the
subject calculates that oil price movements explain most of the price rise in biofuel feedstock prices
over the past decade, with demand side factors (biofuels, expanded population, changing diets and
stocks all lumped together) altogether account for less than 10% of the price increase34,35.
31 FAO (Alexandratos and Bruinsma), 2012, World agriculture towards 2030/2050: the 2012 revision. 32 World Bank, 2013, Food Price Watch - March. Elsewhere in the same paper, the World Bank argues that unhealthy calories tend to be
cheaper than healthy ones, while referencing to junk food in the developed world. While this has been taken for granted many years, it is
questionable whether junk food is cheaper than healthy food. USDA find that healthy foods actually cost less than less healthy foods, see
USDA 2012, Are healthy foods really more expensive? It depends on how you measure the price. 33 USDA, 2011, Why have food commodity prices risen again? 34 World Bank (Baffes and Dennis), 2013, Long-term drivers of food prices. 35 In their summary, Baffes and Dennis conclude that stock to use ratios and exchange rate movements each account for about 15%.
However, this is a typo, they mean to write “together”. In the text this is further explained “That is, oil prices account for almost two thirds
of the price changes from 1997-2004 to 2005-12, followed by S/U ratios and exchange rate with less than 10 percent each.”
BIENL13469 12
Market dynamics
ICTSD/FAO and others find that the food price increase was exacerbated by considerable speculation
activity in the markets24,36. However, a study by the UK Government finds that it is impossible to
draw definitive conclusions on if and how speculation impacted the prices37.
In reaction to increasing commodity prices, several countries started to hoard the crops they
produced, and took measures to limit the export, by outright export bans or taxation. “Approximately
a quarter of the countries surveyed by FAO resorted to such measures in 2007-08, and again in
2010-11 several important cereal exporters resorted to similar measures”24.
Back to biofuels
Biofuels were one factor in the increasing demand. Between 2002 and 2008 worldwide biofuels
production rapidly increased. Statistics show an exponential increase which flattened around 2010
and which is expected by most policy analysis to grow until 2020 in a more predictable and gradual
way. The past increase in EU biofuels consumption, from virtually nothing to 5% of all gasoline and
diesel between 2002 and 2010, was much faster and unexpected than the anticipated growth in the
following decade, with another 3% until 2020. Also, biofuel policies until 2010 show great variation
between countries and in time, whereas by now policies are mostly formulated in terms of more
predictable mandates.
Determining the extent to which biofuels may have caused the global food price spikes requires
consideration of how to account for structural and systematic factors. In the end, it may be
impossible to quantify how much of a price increase was caused by an individual factor. The
contribution of biofuels seems to be rather limited and currently declining again. In other words,
those concerned with food security should focus their attention on repairing structural elements in the
global agricultural trade system and those concerned with food security in developing countries
should concentrate their attention on infrastructure and policy improvements in those countries.
2.5 Biofuels mandates could reduce global price volatility
Whereas normal volatility is an essential component of efficient markets, producers and traders
cannot effectively respond to “excessive” volatility24. Extremely volatile markets are an unattractive
environment for investments by farmers and global companies.
FAO/OECD concluded that food prices since 2006 have been extraordinary volatile. In the same study
they also find that biofuel production aggravates the price inelasticity of demand that contributes to
volatility in agricultural prices20, but the mechanism is not explained.
36 Kaufman, 2010, The food bubble, Harper’s magazine, July 2010. 37 HM Government (cross-Whitehall group of officials), 2010, The 2007/08 agricultural price spikes: causes and policy implications.
BIENL13469 13
We find that biofuel policies in fact create a rather predictable feedstock demand between certain
price bandwidths. We expect that this reduces price volatility.
In initial years of biofuels policies in the EU, most demand was supported through tax incentives. This
indirectly set a price cap on feedstocks: when the feedstock becomes too expensive, it becomes less
attractive for biofuels, since production costs would be higher than the revenues (in turn set by the
fossil reference fuel price plus the tax incentive). A problem was that at low feedstock prices, the
market for biofuels was virtually unlimited. This was demonstrated by the very attractive German
excise exemption scheme between 2003 and 2006, which stimulated a very large national biodiesel
market. As this would become very costly for the national budget this policy was changed into a
budget neutral obligation scheme.
In recent years, most incentive schemes globally have been reformulated as mandates that demand
a certain share (volume) of biofuels. These schemes increase the predictability of feedstock demand.
With long-term stable biofuels policies, it is possible for the market to predict how much feedstock is
maximally needed for biofuels. This helps to reduce crop demand fluctuations, as part of the total
demand becomes more predictable.
On the price side, as biofuels are produced from a broad feedstock range, the feedstock price
accepted in each supply chain is limited by the competing options. For example, if the price of wheat
is high, ethanol from sugar cane will become more attractive.
Recent high corn prices in the US demonstrated this effect in practice: At the end of 2012, about
12% of the US ethanol production capacity was idled because of high corn prices, mainly due to
droughts in the US Midwest38. In April 2013, the Ensus ethanol plant in the UK, one of the largest in
the EU, closed for the third time in three years. The main reasons are the high feedstock costs as a
consequence of poor wheat harvests, and competition with cheaper ethanol from the US39. Moreover,
in most EU Member States, the volume mandates have buy-out options for fuel distributors who find
the biofuels price too high. In other words, if the price is too high, the distributor pays the buy-out
price. (This is not a fine but a legal way out). This indirectly caps the feedstock price to a level that
would still be acceptable for biofuels production.
2.6 The role of co-products
Cereal ethanol and oilseed biodiesel deliver protein rich animal feed as by-products, which will have
an impact on the global animal feed market, so that elsewhere land use is avoided and net land use
is substantially reduced40 by 50 to 100% based on substitution of soy meal41. The effect is so large
because protein oriented crops, like soy, are often very inefficient compared to cereals.
38 Biofuels International, November 2012, High corn prices see off another ethanol plant; Abengoa to idle ethanol plant in US (both page 8). 39 Biofuels international, May/June 2013, Ensus idles UK bioethanol for foreseeable future (page 6). 40 RFA (Renewable Fuels Agency), 2008, The Gallagher review of the indirect effects of biofuels production.
BIENL13469 14
When biofuels co-products avoid pressure on land elsewhere, this will attenuate any impact from
biofuels on feed and food prices. Moreover, biofuel-related protein meals are lowering prices for
animal feeds in Europe (by dramatically increasing supply of such meals, since biofuels in general
produce larger quantities of such meals than they produce biofuels themselves) and so lowering
prices in related food markets. In other words, a wheat ethanol plant may increase the price of local
wheat but may lower total feed costs for nearby animal producers; focusing on only the wheat price
increase and ignoring the total food price impact is thus irresponsible as it provides an objectively
incomplete picture, especially considering that biofuel "co-products" are produced in such large
quantities.
2.7 Biofuels could reduce the price of oil
As we have seen, the oil price is the major driver of agricultural commodity prices. It impacts the cost
of food throughout all phases of food distribution, storage and processing.
The use of biofuels reduces the demand for crude oil, or slows down the demand increase. Via the
price elasticity, this would mean that the price of crude oil decreases, or that price increases are
limited. In 2007, the European Commission assumed that if 7% of the EU transport fuel market
would consist of biofuels, this would lower the global price of oil by around 1.5%. This would have a
concomitant downward impact on agricultural commodity and food prices42.
2.8 Growing biofuel on abandoned cropland
The EU has more than enough land to produce food. Continuously agricultural land is taken out of
production, for economic reasons, and by set-aside obligations. Still, the food and feed commodity
production increases.
In 2009, the European Commission reported that “the main effect of EU biofuel consumption has
been the reuse of recently abandoned agricultural land, or a reduced rate of land abandonment”43.
Earlier, the Commission estimated that by 2020, for every million hectares of EU land used for
biofuels feedstock production 620,000 hectares would come from idle or abandoned cropland. This
would help to prevent land abandonment and loss of valuable open habitats42.
The FAO forecasts that the long term process of cropland abandonment is set to continue for the
coming decades, so that between 2009 to 2050 in developed regions, cropland use is expected to
decrease by a further 50 million hectares44.
41 PBL (Netherlands Environmental Assessment Agency), 2010, The contribution of by-products to the sustainability of biofuels.
42 European Commission, 2007, Commission staff working document accompany the biofuels progress report, SEC (2006) 1721. 43 European Commission, 2009. Commission staff working document. Accompanying document to the renewable energy progress report.
SEC(2009) 503 final. 44 FAO, 2009. Global agriculture to 2050. High Lever Expert Forum – How to Feed the World in 2050.

BIENL13469 15
2.9 The consequences of high food prices for the poor are ambiguous
Much of the analysis so far seeks to understand if and how biofuels have increased food prices.
However, understanding the impact on food security needs some more steps.
High food prices are often perceived as decreasing food security. However, as ICTSD/FAO write, “the
opposite episodes of depressed world prices, especially when prolonged, are also detrimental to food
security by slowly eroding and displacing otherwise viable domestic production”. This results in
greater national dependency on the world market in the longer term24.
Also, a 2012 article in Science notes that “the arguments put forward today, that high food prices
generally hurt the poor, are in contrast with those put forward a few years ago, that low food prices
were hurting the poor”13. Before the “2006-2008 food price crisis”, several organisations warned that
food prices were too low, on a global level and in developing countries. The FAO wrote in 2005, that
“The long-term downward trend in agricultural commodity prices threatens the food security of
hundreds of millions of people in some of the world's poorest developing countries where the sale of
commodities is often the only source of cash”45. In 2005 Oxfam noted that “Surplus production is sold
on world markets at artificially low prices, making it impossible for farmers in developing countries to
compete”46. Earlier, in 2002, Oxfam also argued that the dumping of subsidy driven food surpluses
by rich countries on the world markets, depressed prices to levels so low that local producers could
no longer compete. In 2008, Oxfam explained how “the recent sharp increase in food prices should
have benefited millions of poor people who make their living from agriculture”47. So, high food prices
are not the core problem.
45 FAO, 2005, Agriculture commodity prices continue long-term decline, press release on the 2004 FAO report The State of Agricultural
Commodity Markets. 46 Oxfam, 2005, International celebrities get dumped on at the WSF, press release. Later, Oxfam puts out this source as an obscure press
release, the primary purpose of which was to announce celebrity photos, see Kripke, 2012, Food price complexities require nuance. 47 Oxfam, 2008, Double-edged prices, Lessons from the food price crisis: 10 actions developing countries should take.

BIENL13469 16
3 Biofuels and local food security
3.1 Transmission of crop prices to food commodity prices
Fluctuations in the major food crop prices are not fully translated into the prices of overall food
commodities33 as can be seen from Figure 5. Especially during the 2007-2008 price spike, global food
prices and meat prices increased much less than crop prices.
Figure 5. Price indices for food commodities, meats and crops. Reproduced from USDA33, based on International
Monetary Fund Primary Commodity Price data48 Food Price Index, The ‘crops’ line represents the average of wheat,
rice, corn and soybean prices, ‘meat’ is the average of beef, pork and chicken prices.
48 IMF Primary Commodity Prices, accessed August 2 2013.

BIENL13469 17
3.2 Transmission of global to local food prices
Transmissions of fluctuations on the global market to domestic and local markets are not
straightforward. The level of integration of a domestic market with the international market differs
per country. The extent and timing of the impact depend on several factors:
• Structure of the markets, costs of infrastructure and marketing;
• Agriculture and trade policy measures;
• Local currency valuation;
• Level of self-sufficiency;
• Amount of product typically lost to waste, spoilage and theft;
• Degree of processing of final consumption goods.
High world food commodity prices had limited short-term impacts on food security in developing
countries33. This is because high domestic production in 2010, in particular in Sub-Saharan Africa, led
to adequate food supplies. Also, there is often little or a lagged price transmission from the
international market to local markets “due to limited integration in the global marketplace, poor
market infrastructure, and subsidies provided by these governments”33.
Even if international fluctuations do not affect markets in the short term, they will indicate a general
trend in the long term. However, many spikes in domestic prices do not result from international
price fluctuations, but rather from domestic events, especially where domestic markets have less
integration with the international market.
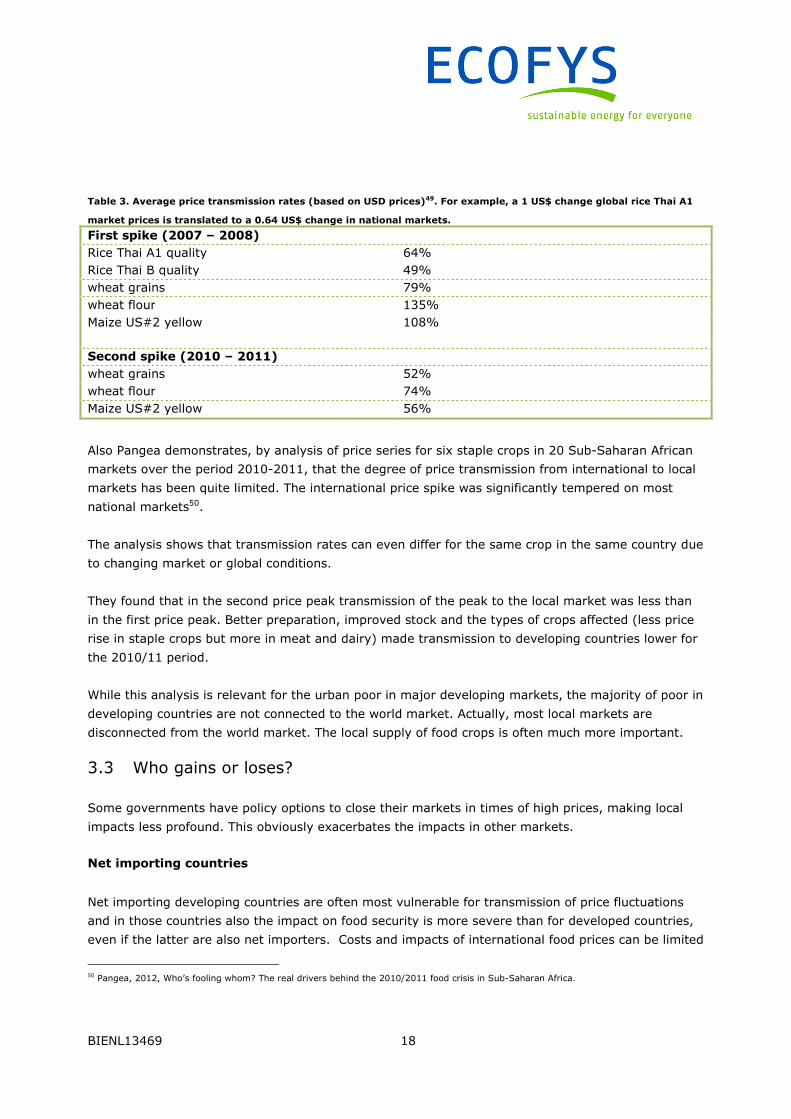
FAO AMIS analysed 155 price series for 52 countries and found that domestic prices rose more than
world prices in about one third of the series. Transmissions were between 50-100% in another third
of the series and below 50% in the remaining third part of the series49. In the majority of analysed
cases, the price rises in local currency terms were lower than in US Dollar terms. The average price
transmission rates are given in Table 3.
FAO AMIS notes that for many countries in Africa, other studies find that the maize price transmission
is usually very weak, because the traded volumes are small compared to the domestic supply.
However, the analysis of the first price spike shows an unusually high price rise. FAO AMIS suggests
that there may have been problems with the domestic price data in some of the cases.
49 FAO AMIS 2011, Enhancing market transparency – Review of changes in domestic cereal prices during the global price spikes, Agricultural
Market Information System.
BIENL13469 18
Table 3. Average price transmission rates (based on USD prices)49. For example, a 1 US$ change global rice Thai A1
market prices is translated to a 0.64 US$ change in national markets.
First spike (2007 – 2008)
Rice Thai A1 quality 64%
Rice Thai B quality 49%
wheat grains 79%
wheat flour 135%
Maize US#2 yellow
108%
Second spike (2010 – 2011)
wheat grains 52%
wheat flour 74%
Maize US#2 yellow 56%
Also Pangea demonstrates, by analysis of price series for six staple crops in 20 Sub-Saharan African
markets over the period 2010-2011, that the degree of price transmission from international to local
markets has been quite limited. The international price spike was significantly tempered on most
national markets50.
The analysis shows that transmission rates can even differ for the same crop in the same country due
to changing market or global conditions.
They found that in the second price peak transmission of the peak to the local market was less than
in the first price peak. Better preparation, improved stock and the types of crops affected (less price
rise in staple crops but more in meat and dairy) made transmission to developing countries lower for
the 2010/11 period.
While this analysis is relevant for the urban poor in major developing markets, the majority of poor in
developing countries are not connected to the world market. Actually, most local markets are
disconnected from the world market. The local supply of food crops is often much more important.
3.3 Who gains or loses?
Some governments have policy options to close their markets in times of high prices, making local
impacts less profound. This obviously exacerbates the impacts in other markets.
Net importing countries
Net importing developing countries are often most vulnerable for transmission of price fluctuations
and in those countries also the impact on food security is more severe than for developed countries,
even if the latter are also net importers. Costs and impacts of international food prices can be limited
50 Pangea, 2012, Who’s fooling whom? The real drivers behind the 2010/2011 food crisis in Sub-Saharan Africa.

BIENL13469 19
by reducing applied tariffs, avoiding export restrictions, creating buffer stock and domestic food
assistance, regional market integration and investing in food production and resilience51.
While it is relevant to understand that net importers are most severely impacted by high food prices,
it is even more relevant to understand why countries have become net importers. This can be for a
variety of internal and external factors, as is strikingly the case in Mexico. A famous example relevant
for the food-biofuels debate is the tortilla crisis in Mexico in 2007. The growing US ethanol industry
was blamed for a decreased US maize export and increasing maize prices across the border, in
Mexico, which made tortillas (the staple food product in Mexico) more expensive. However, in the
past, Mexico had a thriving national maize sector. Failing agricultural subsidy programs within
Mexico, in combination with market liberalisation and cheap import as a consequence of the 1994 the
North American Free Trade Agreement (NAFTA) with the United States and Canada, eventually
created a vulnerable and inefficient Mexican maize production sector52. Actually, it is disputable
whether the US ethanol industry at all caused an increase in tortilla prices53.
Indeed, the causes for high tortilla prices may have been entirely national. The Federal Competition
Commission blamed “structural problems” in the industry related to the concentration of market
power in the hands of a few large players, while others suggest that hoarding and speculation played
a major role54.
Ironically, also in 2007, Mexico was looking into biofuels as an option to stimulate the rural economic
activity, including maize farming55.
Food security and affordability include not only production, imports and supply, but also availability,
accessibility, stability of supply, affordability and the quality and safety of food. In addition, it is
necessary to take into account socio-economic issues, particularly in developing countries where
farmers are more affected.
The way domestic and global price fluctuations impact local consumers also differs for different
countries. With crops comprising a small share of the final cost of food in high-income countries, the
impact of price effects on food consumers is smaller56. In low-income countries, where expenditure
on raw grains and vegetable oils comprises a much larger share of the household food budget, a
given increase in crop prices will have a much larger impact on food consumers56. Developing country
markets often lack the capacity to absorb domestic shocks (creating high local volatility)20. Climate
shocks, pests or natural calamities may have an increased impact in these countries due to the fact
51 FAO, 2011, The state of food insecurity in the world - How does international price volatility affect domestic economies and food security? 52 Woodrow Wilson International Center for Scholars, 2010, Subsidizing inequality - Mexican corn policy since NAFTA. 53 White corn prices rose much higher than yellow corn prices. However, no white corn is used for US ethanol production. Also, the US corn
export fluctuates continuously. 54 Los Angeles Times, 2007 January 12, Mexico probes tortilla price hike. 55 USDA, 2007, Foreign Agricultural Service GAIN report: Mexico bio-fuels annual report. 56 World Bank, 2011, World Bank Research Group: The role of inventory adjustments in quantifying factors causing food price inflation,
August 2011.
BIENL13469 20
that farmers have poor access to technologies and in general practice poor management of soil and
water resources. Additional factors increasing shocks in domestic markets can be: poor
infrastructure, high transport costs, absence of credit/insurance markets and various policy and
governance failures.
Not only between countries or regions, but also between different groups in a country there can be
different responses to high food prices. High prices can be beneficial for one group but negative for
another, depending on their consumption/production pattern and their level of income. This is caused
by the various dimensions underlying the concept of food affordability and security57:
• Availability of food is determined by domestic production, import capacity, existence of food
stocks and food aid;
• Access to food depends on levels of poverty, purchasing power of households, prices and the
existence of transport and market infrastructure as well as food distribution and storage systems;
• Stability of supply and access may be affected by weather, price fluctuations, human-induced
disasters and a variety of political and economic factors;
• Safe and healthy food utilization depends on care and feeding, food safety and quality, access to
clean water, health and sanitation.
Urban populations are mostly negatively affected by high food prices, since they are net consumers
and cannot profit from the higher income created by high food prices.
For the rural population, there are differences. The rural population is diverse, consisting of large
producers, small holders, net consumers etc. Many smallholders and agricultural labourers are net
purchasers of food, as they do not own sufficient land to produce enough food for their families.
Empirical evidence from a number of Sub-Saharan African countries shows that a majority of farmers
or rural households (depending on the survey definition) are not net food sellers. For the poorest,
high food prices are most of the time negative although the creation of labour in agriculture might
compensate that partially51.
In the longer term, however, high prices are beneficial since they provide opportunities and higher
profitability for agricultural markets (which are, most of the time, also in developing rural regions).
Moreover, biofuel production creates opportunities to generate income and as a boost to development
of agriculture practices/technologies51,58.
Since it is expected that the volatility of agricultural markets will not reduce in the short term, it is
important to strengthen the position of smallholders and rural populations in these price fluctuations
and changing markets. Among these suggestions are indications to reduce volatility of the
agricultural market like51:
57 FAO, 2008, The state of food and agriculture – Biofuels: prospects, risks and opportunities. 58 FAO/BEFSCI, 2012, Impacts of bioenergy on food security - Guidance for assessment and response.
BIENL13469 21
• Access of small-scale farmers to better seeds, better agricultural inputs, better equipment and
know-how;
• Better/reliable and up-to-date information on markets and prices;
• Crop insurance;
• Set up of international food stocks which can absorb fluctuations in production better;
• Reduction of import barriers, trade distorting measures and all forms of export subsidies;
• Reduction of wastes so as to increase production of feedstock.
Furthermore they provide ideas that would help smallholders to be more resilient, like improving of
agricultural innovation systems and supporting smallholders to develop and invest technologies and
practices.
3.4 Impact on poverty and hunger
Central to the concern about biofuels and food prices, is that food price increases impact food
affordability and quickly lead to reduced food intake or a switch towards a cheaper but less healthy
diet, risking malnutrition and undernourishment.
According to the World Bank, currently about 1.2 billion people, or 21% of the global population, live
on less than $1.25 a day59. The FAO estimates that 868 million people (12.5%) are undernourished60.
Both numbers declined continuously over the past two decades, despite a growing world population,
although it must be acknowledged that the indicators receive criticism.
FAO concludes that since 2007–08 the global progress in reducing hunger has slowed down and
levelled off61. In different studies, using different methodologies, the World Bank, the FAO and the
USDA estimated that global poverty rose by between 63 and 160 million people62. The International
Food Policy Research Institute IFPRI, on the other hand, has listed serious critique on the underlying
models. They find that these three prominent hunger models are far too crude to reliably predict the
impact of a rise in international food prices, on hunger. When comparing these studies to global self-
reported food insecurity, IFPRI concludes that self-reported indicators of food insecurity actually
reveal a trend opposite to the simulations, and that actually poverty and hunger seem to have
decreased63.
An Oxfam report on the 2008 food price crisis argues that food prices, whether high or low, are like a
double edged sword bound to hurt either consumers or producers47. It seems that “the news on the
food prices front is always bad for the world’s poor, regardless of whether prices are rising or
falling”64.
59 1.25 dollar per day is an often used indicator for extreme poverty, http://povertydata.worldbank.org/poverty/home/ 60 FAO monitors the trend of global hunger and food insecurity, http://www.fao.org/hunger/en/ 61 FAO, 2012, The state of Food Insecurity in the World – Economic growth is necessary but not sufficient to accelerate reduction of hunger
and malnutrition. 62 The World Bank, FAO and USDA studies have been summarised by IFPRI 2011 (footnote 63). We have not analysed those cited studies. 63 IFPRI (International Food Policy Research Institute), 2011, Was the global food crisis really a crisis? Simulations versus self–reporting. 64 Weblog Dani Roderik, November 2010, Are high food prices good or bad for poverty?

BIENL13469 22
4 An opportunity for developing countries
4.1 Investments in agriculture are needed
Agriculture in developing countries, whether those be in post-colonial Africa or post-communist
Eastern Europe, is currently far from achieving its full potential. The countries that currently receive
most interest in agricultural investment, achieve less than 25% of the potential yield on currently
cultivated areas65. The corn “yield gap” between Eastern Europe and Western Europe suggests that
Eastern Europe can double or triple its harvests per hectare with existing technology. The World Bank
stresses the need for more and better investment in agriculture “to reduce poverty, increase
economic growth and promote environmental sustainability”65.
For many countries, private investments in biofuels provide a potential to modernise not only
farming, but the complete agricultural production and market system. This is important as public
funding has dried up. For example, in 1980, 30% of World Bank funding concerned agriculture in
Africa; this decreased to 7% in 2000, eventually mounting to 12% in 2010 (in reaction to the food
price crisis)66. Eastern Europe never enjoyed EU production subsidies, and intervention programs
have now been discontinued. Agriculture is a key sector to start economic growth and to address
poverty needs67.
Investment in agriculture, more than investment in other sectors, can generate economic growth and
benefit the poor61 because they can thrive in remote rural areas. More specifically, bioenergy
investments can stimulate productivity growth of food crops68. A few bioenergy projects already
today address food production.
4.2 Using bioenergy to improve food security
Generic claims stating that bioenergy production benefits food security should be treated with
caution, just as claims stating the opposite68. A single biofuel project can never address all the issues
at the same time. The food security of a region or country will only be improved if certain conditions
are met. It is important that project development is matched with appropriate policies, legislation and
regulation in the producing country.
65 World Bank, 2011, Report 59463, Rising global interest in farmland: can it yield sustainable and equitable benefits? 66LDPI (Land Deal Politics Initiative), 2011, Is water the hidden agenda of agricultural land acquisition in Sub-Saharan Africa? 67 Huang J, Yang J, Msangi S, Rozelle S, Weersink A, 2012, Biofuels and the poor: Global impact pathways of biofuels on agricultural
markets, Food Policy 37(4):439–451. 68 LEI, 2013, Combining bioenergy production and food security.

BIENL13469 23
Work in the area of food-fuel synergy by LEI68 and FAO69 makes clear that both the food supply side
and the affordability (i.e. income) side have to be improved. Huang et al. warn that as a result of
investment and market development, the price of the food basket can also increase67.
Based on Ecofys projects for Mozambique70 and Tanzania71, we have identified crucial elements for
sustainable development of biofuels projects in developing countries. These elements are important
for food security, but also address related issues:
• Identification of preferred developing zones;
• Careful land acquisition process;
• Attractive legal and financial environment for project developers;
• Investments in essential infrastructure and services;
• Social, environmental and economic impact assessments;
• Robust selection of feasible projects and intensive support;
• Smallholder inclusion;
• Increase agricultural productivity (crop yields and livestock).
All these elements have to be addressed in detail, in a comprehensive and coherent legislative and
regulatory framework. This framework should be tailored per country, taking into account both
concerns and drivers, and should be developed in close cooperation with national stakeholders on all
sides of the biofuel field. Such an effort is as applicable to Europe as it is to Africa.
These elements lead to a roadmap of actions that create the conditions and setting within which the
desired developments are stimulated, so that a viable bioenergy sector can be developed while at the
same time improving the existing agricultural sector, so that agricultural land in developing countries
can be utilized most effectively.
69 FAO, 2010, Making integrated food-energy systems work for people and climate - an overview. 70 Ecofys and Utrecht University, 2011, Strategic evaluation large scale sustainable bioenergy export from Mozambique to the Netherlands. 71 Ecofys, 2012, Biofuels policy, legislative and regulatory framework for Tanzania, Sida/Norad/MEM biofuels project, especially see the
subsidy Key drivers for biofuel market development in Tanzania.

ECOFYS Netherlands B.V. | Kanaalweg 15G | 3526 KL Utrecht| T +31 (0)30 662-3300 | F +31 (0)30 662-3301 | E [email protected] | I www.ecofys.com

ECOFYS Netherlands B.V.
Kanaalweg 15G
3526 KL Utrecht
T: +31 (0) 30 662-3300
F: +31 (0) 30 662-3301
I: www.ecofys.com