bioflocculation of wastewater treatment pond suspended …
TRANSCRIPT
0
Bioflocculation of Wastewater Treatment Pond Suspended Solids
A Master’s Thesis Presented to the Faculty of California Polytechnic State University
San Luis Obispo
In partial fulfillment of The requirements for the degree
Master of Science Civil and Environmental Engineering
By
Louis Charles Lefebvre
2012

ii
© 2012 Louis Lefebvre
ALL RIGHTS RESERVED
iii
Committee Membership
TITLE: Bioflocculation of Wastewater Treatment Pond Suspended Solids
AUTHOR: Louis Lefebvre DATE SUBMITTED: 2012 COMMITTEE CHAIR: Dr. Tryg Lundquist COMMITTEE MEMBER: Dr. Yarrow Nelson COMMITTEE MEMBER: Dr. Sam Vigil

iv
Abstract
Bioflocculation of Wastewater Treatment Pond Suspended Solids
Louis Lefebvre
Wastewater treatment lagoons and high rate algae ponds (HRAPs) can provide
cost effective wastewater treatment, but they commonly have high effluent
concentrations of total suspended solids (TSS). In this thesis algae pond effluent
was treated in a beaker testing apparatus (mixed and aerated) with various
mixtures of activated sludge and primary effluent simulating differing activated
sludge aeration basin compositions then was allowed to settle to assess
settleability. Conventionally, microalgal suspended solids are removed by
chemical coagulation followed by separation methods that often have a high cost
relative to the low cost lagoon or HRAP system where the solids were produced.
This separation step is often cost prohibitive or operationally complex for
municipalities or too energy intensive for application in algae biofuels production.
This research investigates using a small amount of activated sludge material to
promote bioflocculation of algae in pond effluent. It was hoped that the findings
may demonstrate a path for municipalities to keep their lagoons, while increasing
capacity and improving treatment without excessive cost or complexity.
Experiments were conducted on microalgae samples from a pilot-scale HRAP
and activated sludge and primary effluent samples from a local municipal
wastewater plant. The samples were placed in a mixing apparatus and allowed to
settle for a given period of time, after which TSS was analyzed for settleability.
v
The experiments investigated the effect of various lab-scale activated sludge
reactor operational schemes by varying the volumes (and masses) of activated
sludge, algae-rich water, and activated sludge in the beaker. Results in the
sorption test (tests with only activated sludge and algae-rich water) demonstrated
algae pond effluent treated with activated sludge concentrations of 3000 mg/L or
greater produced final effluent TSS concentrations near discharge requirements
(40-50 mg/L) with only 30 minutes of settling and without addition of primary
effluent. However, such high activated sludge concentrations are not feasible at
full scale. Furthermore, beakers with activated sludge concentrations greater
than 3000 mg/L reduced TSS concentrations by more than 150 mg/L with only 30
minutes of settling and without addition of primary effluent. Results in the aerobic
beaker tests (tests with primary effluent, activated sludge, and algae-rich water)
showed greater than 200 mg/L TSS removal and final effluent TSS concentration
less than 30 mg/L was achieved using activated sludge to primary effluent
volumetric ratios of 1:1 and greater which corresponded to activated sludge
concentrations of 730 mg/L and greater. Activated sludge concentrations of 730
mg/L may not be feasible at full scale. This report shows that a PETRO-like
process is effective in lowering wastewater pond suspended solids, however not
to typical discharge standards.

vi
Acknowledgments
To Drs. Lundquist, Nelson, and Vigil: Thank you for all assistance, editing, and constructive criticism. To Brant Haflich: Thanks for saving me from the dirt. To Mike Chang and Corissa Bellis: Thank you for the early mornings and the late evenings. To Ian Woertz and Matt Hutton: Thanks for letting bounce ideas and frustrations off of you and for your mentorship. To my friends and family: Thanks for politely nodding your heads in understanding of what I was investigating.

vii
Table of Contents List of Tables ........................................................................................................ ix
List of Figures ....................................................................................................... x
Introduction ........................................................................................................... 1
Background .......................................................................................................... 5
Methods .............................................................................................................. 13
Culturing Microalgae: Aerobic Beaker and Bacterial-Algal Sorption Tests .. 16
Culturing Microalgae: Anaerobic Preconditioning Beaker Test .................... 17
Aerobic Beaker Tests – Experimental Procedure ........................................... 17
Test AE-2 Beaker Plan ................................................................................ 20
Tests AE-3 and AE-4 Beaker Plan .............................................................. 22
Bacterial-Algal Soprtion Beaker Test – Experimental Procedure .................... 23
Bacterial-Algal Sorption Beaker Plan .......................................................... 25
Anaerobic Preconditioning Beaker Test – Experimental Procedure ................ 26
Anaerobic Preconditioning Beaker Plan ...................................................... 32
Beaker Constituents – Solids analysis ............................................................ 33
Microscopy ...................................................................................................... 34
Results and Discussion ...................................................................................... 35
Culture Observations ................................................................................... 35
Activated Sludge Observations ................................................................... 36
Suspended Solids Removal ............................................................................ 36
Constituent Total Suspended Solids Concentrations .................................. 38
Aerobic Beaker Tests .................................................................................. 38

viii
Bacterial-Algal Sorption Beaker Test ........................................................... 52
Anaerobic Preconditioning Beaker Test ...................................................... 58
General Discussion ............................................................................................ 64
Conclusions ........................................................................................................ 71
Works Cited ........................................................................................................ 74
Appendix A Photo Micrographs .......................................................................... 80
Appendix B Data Tables ..................................................................................... 82

ix
List of Tables
Table 1. An overview of the three independent test and the constituents that
were varied in each test. ..................................................................................... 13
Table 2. A process summary for Aerobic Beaker Tests AE-2, AE-3, and AE-4. . 19
Table 3. Plan for Aerobic Beaker Tests AE-2. .................................................... 22
Table 4. Plan for Aerobic Beaker Tests AE-3 and AE-4. .................................... 23
Table 5. A summary of when the steps take place and/or their duration for
Bacterial-Algal Sorption Beaker Test. ................................................................. 24
Table 6. Plan for the Bacterial-Algal Sorption experiment. ................................. 25
Table 7. A summary of the experimental process for the Anaerobic
Preconditioning Beaker Test demonstrating when each step occurred within a
given stage. ........................................................................................................ 31
Table 8. Plan for Anaerobic Preconditioning Beaker Test. ................................. 33
Table 9. Total suspended solids concentrations of the constituents used in all
tests prior to testing. (Algae-rich water values are TSS in the “raw” algae-rich
water samples, Araw.) .......................................................................................... 38
Table 10. Aerobic Beaker Test AE-2 data including change in supernatant TSS
based on Eq. 1 and Eq. 2. Afin and solids ratios are provided in Table B-1. ...... 39
Table 11. Plan for Aerobic Beaker Tests AE-3 and AE-4 and the change in
supernatant TSS based on Eq. 1 and Eq. 2. Solids ratios are provided in
Tables B-2 and B-3 in Appendix B. ..................................................................... 40
Table B-1. Aerobic Beaker Test AE-2 volumetric ratios, solids mass ratios, and
results. Raw algae-rich water TSS concentration, Ar, for AE-2 was 269 mg/L. .. 82
x
Table B-2. Aerobic Beaker Test AE-3 volumetric ratios, solids mass ratios, and
results. Beakers DC1 and DC2 were duplicates of beakers C1 and C2,
respectively. Beakers 1a, 2a, and 6a were duplicates of beakers 1, 2, 6,
respectively. Raw algae-rich water TSS concentration, Ar, for AE-3 was 276
mg/L. .................................................................................................................. 83
Table B-3. Aerobic Beaker Test AE-4 volumetric ratios, solids mass ratios,
and results. Beakers labeled DC1 and 6a were duplicates of beakers C1 and
6a respectively. Raw algae-rich water TSS concentration, Ar, for AE-4 was
253mg/L. ............................................................................................................ 84
Table B-4. Bacterial-Algal Sorption Test solids mass ratios, and results.
Beakers labeled 3a and 8a were duplicates of beakers 3 and 8, respectively.
All beakers were mixed and aerated. Raw algae-rich water TSS
concentration, Ar, for the Bacterial-Algal Sorption test was 285 mg/L. ............... 85
Table B-5. Anaerobic Preconditioning Test solids mass ratios, and results.
(ARW is algae-rich water.) Raw algae-rich water TSS concentration, Ar, for
the Anaerobic Preconditioning Test was 96 mg/L. ............................................. 86
List of Figures
Figure 1. PETRO integrated pond systems with trickling filters at two different
locations, from Meiring and Oellermann (1999). ................................................... 8
Figure 2. Flow diagram of the Soshanguve PETRO ASP variant plant. (A)
Primary facultative pond, broken line square- fermentation pit, (B±D)
secondary oxidation ponds, (E) BNR reactor, (F) clarifiers, (G) chlorination
xi
facility, (a) stream containing VFA for P-removal in the BNR reactor, (b) primary
pond effluent,(c) oxidation pond recycle; recycle rate= c:(a+e)= 1.5, (d) algae-
rich recycle, (e) BNR aerobic zone feed, (g) return activated sludge, (h) waste
activated sludge to the aerobic sludge digester, (j) effluent to river, (k) to the
sludge drying beds from Shipin et al., (1999a). .................................................. 10
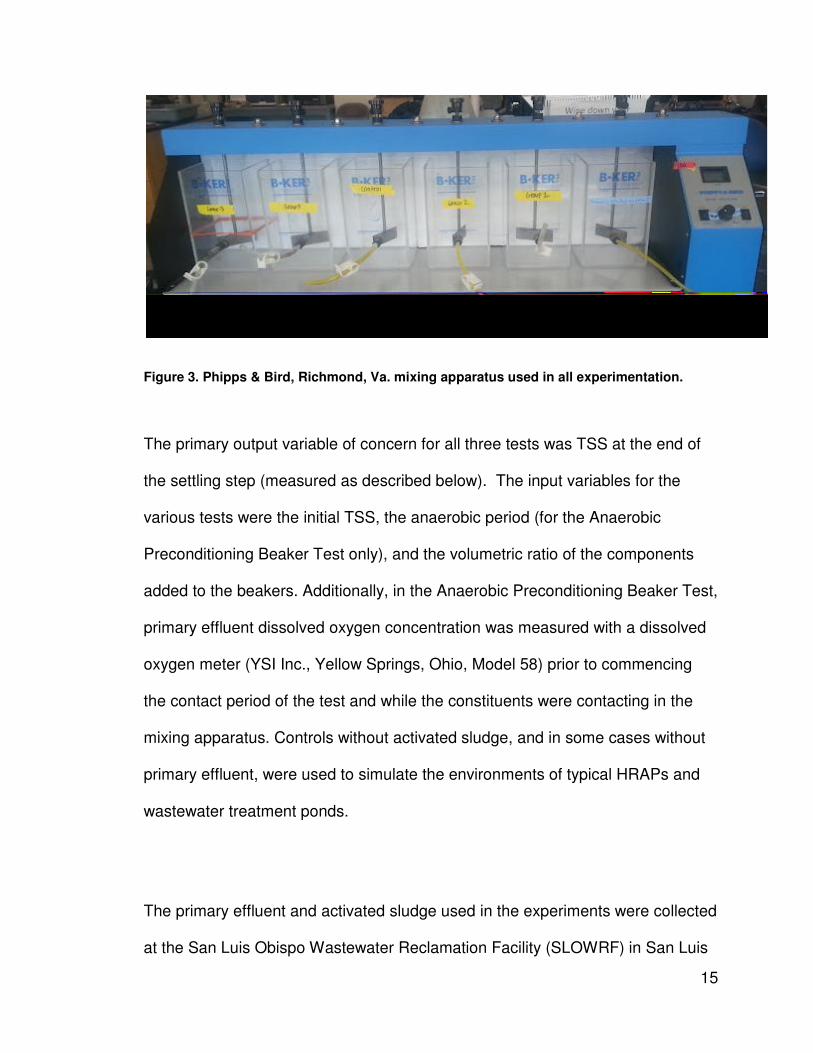
Figure 3. Phipps & Bird, Richmond, Va. mixing apparatus used in all
experimentation. ................................................................................................. 15
Figure 4. A diagram of the Aerobic Beaker Tests, associated abbreviations for
each test in the series, and a brief explanation of the waters tested. ................. 18
Figure 5. Aerobic beaker test initial algae-rich water TSS concentration, ����,
and final TSS concentrations, ����. ................................................................... 41
Figure 6. Final TSS concentrations at different activated sludge
concentrations in lab reactors for tests AE-2, AE-3, and AE-4. .......................... 42
Figure 7. TSS removed, based on Eq. 1, at different activated sludge
concentrations in lab reactors. Control reactors (reactors with no activated
sludge) were omitted from this graph. ................................................................ 43
Figure 8. TSS removed, based on Eq. 2, after treatment with different
activated sludge concentrations. Control reactors (reactors with no activated
sludge) were omitted from this graph. ................................................................ 45
Figure 9. TSS removed, based on Eq. 2, after treatment with specified
activated sludge to primary effluent volumetric ratios (Table 3 and Table 4) for
aerobic beaker tests AE-2, AE-3, and AE-4. The zero ratio points refer to
xii
mixtures with no activated sludge or to control mixtures that had only
algae-rich water. ................................................................................................. 46
Figure 10. TSS removed, based on Eq. 2, after treatment different algae-rich
water to primary effluent volumetric ratios (Table 3 and Table 4) for aerobic
beaker tests AE-2, AE-3, and AE-4. ................................................................... 48
Figure 11. TSS removed observed in test AE-2, calculated using Eq. 2, at
different activated sludge solids to algae-rich solids mass ratios. The zero ratio
points refer to mixtures with no activated sludge in the mixture or control
mixtures that had only algae-rich water. ............................................................. 49
Figure 12. TSS removed observed in test AE-3, calculated using Eq. 2, at
different activated sludge to algae-rich solids mass ratios. The zero ratio
points refer to mixtures with no activated sludge in the mixture or control
mixtures that had only algae-rich water. ............................................................. 50
Figure 13. TSS removed observed in test AE-4, calculated using Eq. 2, at
different activated sludge to algae-rich solids mass ratios. The zero ratio
points refer to mixtures with no activated sludge in the mixture or control
mixtures that had only algae-rich water. ............................................................. 51
Figure 14. Final TSS concentration after treatment at different activated
sludge concentrations in the beaker. The “clean water curve” represents
theoretical final TSS concentration if water was used in place of activated
sludge. Average activated sludge solids to algae-rich solids mass ratio
was 3.3. .............................................................................................................. 54
xiii
Figure 15. TSS removed from suspension after treatment with different
activated sludge concentrations, using Eq. 1...................................................... 57
Figure 16. TSS removed from suspension after treatment with different
activated sludge concentrations, using Eq. 2...................................................... 57
Figure 17. TSS concentrations after each of four sequential repetitions of
treatment in the Anaerobic Preconditioning Beaker Test. TSS concentrations
reported in Stage 1 were of a sample of the specified volumetric ratio while
still “fresh”. TSS concentrations reported in Stage 2 were of a sample that
underwent 12 hour–overnight anaerobic settling. TSS concentrations
reported in Stage 3 were from the supernatant of a mixture after Cycle 1.
TSS concentrations reported in Stage 4 were from the supernatant of a
mixture that after Cycle 2. The seed was 20% (m/m) dose of activated
sludge. Refer to Table 8 for the beaker plan. ARW stands for algae-rich
water. The ratios specified in the legend are primary effluent to algae-rich
water volumetric ratios. The stages are defined in Table 7. ............................... 59
Figure 18. TSS removed observed in Stages 3 and 4 of the Anaerobic
Preconditioning Test, calculated using Eq. 2, at different activated sludge to
algae-rich solids mass ratios. Control beakers and beakers that received no
activated sludge seed were omitted from this analysis. ...................................... 62
Figure A-1. Golenkinia attached to larger particle with spiral-like
microorganism. From HRAP used in the Anaerobic Preconditioning Test
before treatment. ................................................................................................ 80
xiv
Figure A-2. Micractinium attached to a floc of bacteria and smaller spherical
Chlorella-like algae cells. .................................................................................... 80
Figure A-3. Micractinium colony in untreated “control” culturing fish tank water
sample used in Aerobic Beaker Test 4. .............................................................. 80
Figure A-4. Micractinium colony in untreated HRAP sample used in Aerobic
Beaker Test 4. .................................................................................................... 80
Figure A-5. Large floc of stalked ciliates in an activated sludge sample.
Demonstrates typical composition of activated sludge throughout
experimentation. ................................................................................................. 80
Figure A-6. Activated sludge sample with typical consortia throughout testing.
Rotifers and stalked ciliates appear in significant quantities. .............................. 80
Figure A-7. Periphery of large algal-bacterial floc. Discernible algae and
diatom species are spherical Chlorella-like and Synedra type species
respectively. Stalked ciliates were found near floc peripheries nearly without
exception. ........................................................................................................... 81
Figure A-8. Filamentous algae with algal-bacterial flocs attached. ..................... 81
Figure A-9. Symmetrically braided filamentous algae with unicellular
microalgae adjacent. .......................................................................................... 81
Figure A-10. Floc of Micractinium-like algae with extracellular projections and
colonial coating. .................................................................................................. 81
Figure A-11. Ring or torus shaped floc with stalked ciliates provide structure
for algal aggregation. Sample from settled biomass in Anaerobic
Preconditioning Test. .......................................................................................... 81
xv
Figure A-12. Stalked ciliate at the periphery of algal-bacterial flocs. .................. 81
Figure A-13. Filamentous algae with floc formed at the center of a stalked
ciliate ring and colloidal algae in bulk water. ....................................................... 82
Figure A-14. Colloidal Chlamydomonas-like algae species with a Synedra
species also present. Sample from HRAP in Anaerobic Preconditiong Test. ..... 82
Figure A-15. Oscillatoria-type filamentous algae next to large flow, sample
from controlled fish tank used in Aerobic Beaker Tests and Bacterial-Algal
Sorption Test. ..................................................................................................... 82
Figure A-16. Large algae floc and rotifers in a sample from the “controlled”
culturing fish tank. ............................................................................................... 82
Figure A-17. A finger of a large algae floc from the culturing fish tank. .............. 82
Figure A-18. Large algae floc with free non-colonial Oscillatoria-like algae
adjacent and rotifer. Notice hair-like structures on floc periphery. ...................... 82

1
Introduction
Wastewater treatment pond systems are known for their low cost, but effluent
suspended solids and nutrient concentrations are often higher than modern
discharge limits allow (Gutzeit et al., 2005). As discharge limits for wastewater
treatment facilities become stricter, and energy inputs become more expensive,
municipalities and various industries will be looking to enhance their treatment
efficiency and limit cost. Improving the sustainability of wastewater treatment
facilities is another current emphasis of the wastewater treatment industry (Van
De Hende et al., 2011). In conventional activated sludge treatment technology,
50% or more of plant energy consumption can be used for mechanical aeration,
and their overall energy consumption is substantial (Tchobanoglous et al., 2003).
When performing nitrification-denitrification, activated sludge and similar
technologies also destroy fixed nitrogen, which under ideal conditions or with
some pond technologies, would be captured and recycled as fertilizer to improve
sustainability (Van De Hende et al., 2011). Additionally, Shaw and Barnard
(2011) make the case that phosphorus removal and reuse is, above all other
environmental impacts, the most important consideration in wastewater treatment
because phosphorus is a non-renewable resource upon which the world’s food
supply is dependent as a fertilizer. Algal ponds represent a means of
phosphorus recovery and reuse (Van De Hende et al., 2011).

2
One wastewater treatment design that promises to have lower cost and greater
sustainability than conventional mechanical treatment technologies is high rate
algal ponds (HRAPs), which are shallow, paddle wheel-mixed raceways for
growing microalgae at high productivity (Craggs et al., 2011). Current full-scale
HRAPs have similar suspended solids and nutrient removal deficiencies as
conventional oxidation ponds. However, these deficiencies reportedly have been
overcome by integration of HRAPs with activated sludge or trickling filter systems
(Meiring and Oellerman, 1995; Gutzeit et al., 2005; Shipin et al., 1999).
HRAPs oxidize wastewater constituents and assimilate nutrients through
photosynthesis performed by microalgae within the pond (Nurdogan and Oswald,
1995). Microalgae are considered a potential feedstock for the production of
transportation fuels and other energy sources (Murphy and Allen, 2011), as well
as other uses including animal feed supplements, fertilizers, soil conditioners,
cosmetics, and health food supplements (Benemann, 2003; Ogbanna et al.,
1997; Becker, 2007). However, the use of HRAP technology for wastewater
treatment is restricted by land availability, evaporation, and climate (Benemann,
1997). Regardless of these resource limitations, simple gravity separation of
microalgae remains difficult to achieve for large-scale HRAPs (Park et al.,
2011a).

3
Separation of microalgae can be accomplished by centrifugation, flotation,
filtration, and sedimentation (Murphy and Allen, 2011). These energy intensive
(i.e. dissolved air flotation and centrifugation) and/or chemical intensive (i.e.
chemical coagulation/flocculation) processes may defeat the goals of simplicity,
economy, recycling of biomass for some uses, and low energy intensity of
HRAPs systems (Christenson and Sims, 2011; Park et al., 2011b). Thus, to
maintain a “clean” biomass product, high effluent quality, and low energy
requirement, bioflocculation of algae followed by gravity sedimentation is the
ideal separation methodology.
Microbial bioflocculation is often observed in the presence of extracellular
polysaccharides (EPS) (Leppard, 1995; Liao et al., 2001; Sheng et al., 2010).
Some algae and bacterial biomasses used in activated sludge systems are
known to secrete sticky EPS (Medina and Neis, 2007; Gutzeit et al., 2005; Shipin
et al., 1999a; Lundquist et al., 2011). These EPS have significant effect on the
physicochemical properties of microbial aggregates including structure, surface
charge, flocculation, settling properties, dewatering, and adsorptive capacity
(Sheng et al., 2010).
The primary focus of the research herein is to investigate, at lab scale, the ability
of activated sludge to promote the flocculation of colloidal algae with the longer-
term goal of developing a full-scale process for pond effluent clarification. The

4
experiments measured the effect of blending various ratios of algae-rich pond
effluent, primary clarifier effluent, and waste activated sludge. A secondary
objective was to perform qualitative community analysis, comparing settleable
communities with suspended-colloidal communities using microscopy.
Observations presented in this research may help guide municipal, agricultural,
and industrial wastewater treatment works with managing their pond systems or
provide insight into an alternative treatment process for systems needing
upgrades. Similarly, this thesis has implications for the algae biofuel/biomass
industry by developing methods to improve algal bioflocculation, a key step for
competitive commercial algal biomass production.

5
Background
Pond systems are common wastewater treatment technologies, with around
7,000 publicly-owned systems in the United States alone (USEPA, 2008).
Because of their low capital cost, operational simplicity, and ability generally to
meet oxygen demand discharge limits, more ponds are likely to be built in the
future. Furthermore, many more ponds may be constructed if a substantial
market for algae biofuels develops. However, many existing pond systems need
upgrading, replacement, and/or expansion due to population growth, new
discharge limits, desire for wastewater reuse, or poor treatment performance
(Lundquist et al., 2011). A few simple measures can be taken to prolong the life
of a pond system and increase performance. Typically this includes adding
floating mechanical aeration to enhance biochemical oxygen demand (BOD)
removal (Lundquist et al., 2011). Another way to enhance a pond system’s
effluent quality is to integrate a secondary biological treatment process
downstream of the ponds.
Meiring and Oellerman (1995) demonstrated a high quality effluent using an
integrated pond system with a trickling filter downstream of the pond system
(Figure 1). This process is known as the Pond Enhanced Treatment and
Operation (PETRO) process, or more specifically, the PETRO trickling filter
(PETRO TF). Shipin et al., (1999b) operated multiple lab-scale PETRO TFs and
concluded that high performance in the trickling filter was based on three factors:

6
(1) increased activity of predation on microalgae by protozoa and rotifers, (2)
heterotrophy of both microalgae and bacteria, and (3) dissolved organics
conversion to, and production of, extracellular polysaccharides (Shipin et al.,
1999b). Meiring and Oellerman (1995) reported, for two operating schemes, that
an integrated system effluent suspended solids and chemical oxygen demand
(COD) were below 30 mg/L and 100 mg/L, respectively. The effluent sent to the
trickling filter was pretreated in a facultative pond or anaerobic pond. A portion of
the effluent from the facultative or anaerobic pond was diverted to an oxidation
pond, while the remainder of the flow was sent to the trickling filter.
The primary differences between anaerobic, aerobic, and facultative ponds type
are below (Birchall et al., 2008):
1. Anaerobic ponds use bacterial metabolism to decompose incoming
organic matter in three stages (hydrolysis, fermentation, and
methanogenisis). These processes breakdown particulate matter into
soluble substrate (hydrolysis), the soluble substrate is degraded into
volatile fatty acids (VFAs), ��, and hydrogen (fermentation), and
methanogenic bacteria produce methane from acetate or a combination
hydrogen and ��.
2. Aerobic ponds use aerobic bacterial metabolism to degrade incoming
organic material into cell mass, ��, and water using dissolved oxygen.
Bacteria in naturally aerated ponds use oxygen produced by

7
phytoplankton and are better suited for dilute wastes. Cell growth is much
quicker than in anaerobic ponds.
3. Facultative ponds are ponds in which anaerobic, aerobic, and facultative
(metabolism of substrate with or without the presence of oxygen) bacteria
decompose wastes.
In the PETRO system anaerobic pretreatment was done to increase the supply of
readily available organic matter, which stimulated heterotrophic growth in the
biofilms formed on the trickling filter media and markedly increased the biofilm’s
adsorptive capacity (Meiring and Oellerman, 1995). In Figure 1 there are two
PETRO TF schemes depicted. The lower schematic uses an anaerobic pond to
pre-treat raw waste before a portion of the total flow is diverted to the oxidation
ponds and trickling filter. The upper schematic uses a facultative pond to pre-
treat raw waste before flow is diverted to the oxidation ponds and the trickling
filter. In both schematics a portion of effluent from the trickling filter is recycled to
the anaerobic or facultative pond. Similarly in both schematics a portion of the
flow leaving the anaerobic or facultative ponds is recycled back to the anaerobic
or facultative pond before flowing downstream to either the trickling filter or the
oxidation ponds.

8
Figure 1. PETRO integrated pond systems with trickling filters at two different locations, from Meiring and Oellermann (1999).
Another method in which a mechanically driven biological process is integrated
into a pond system is by adding an activated sludge basin downstream of the
oxidation pond, instead of a trickling filter. The secondary positioning of the
activated sludge process (ASP) leads to increased flocculation and nitrification
potential in the activated sludge flocs (Shipin et al., 1999a; Figure 2). Shipin et al.
(1999a) suggested that the mechanism is a co-flocculation of algae with bacteria
due to light-limiting, stress induced EPS production causing flocculation.
Similarly, it was found that algae secrete EPS in light-limiting turbid natural

9
waters to flocculate particulate matter thus allowing increased light penetration
(Avnimelech et al., 1982).
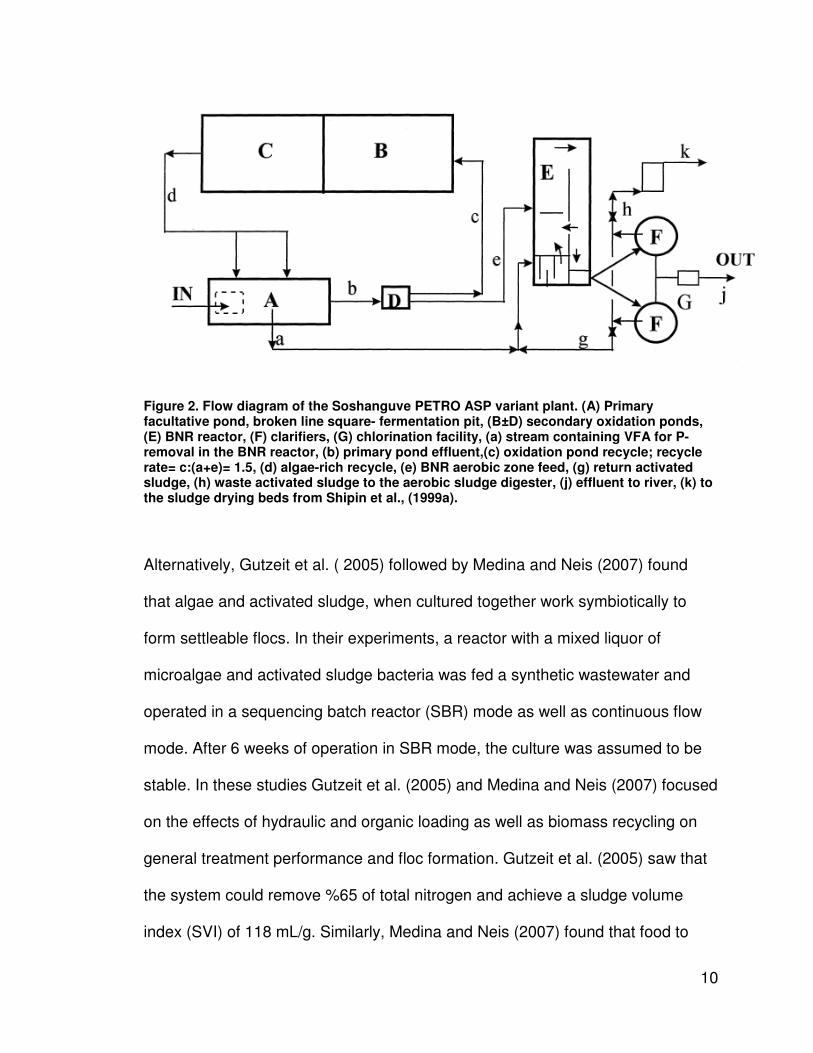
The PETRO activated sludge process (ASP) variant uses a biological nutrient
removal (BNR) ASP, in which there are aerobic, anoxic, and anaerobic zones
within the reactor. Figure 2 depicts a full scale PETRO ASP process. Raw
sewage enters a primary facultative pond with a fermentation pit. A portion of the
flow from the facultative pond flows to the activated sludge basin, while the other
portion of the flow goes to the first secondary oxidation pond. Then a portion of
the flow from the first secondary oxidation pond goes to the activated sludge
basin while the remainder of flow is sent to the second two oxidation ponds. All
flow through the secondary oxidation ponds is recycled back to the primary
facultative pond. Flow from the activated sludge reactor is sent to two clarifiers
where a portion of the underflow is returned back the activated sludge basin and
the remainder is wasted. Supernatant from the clarifier is discharged to the
nearby waterway.
10
Figure 2. Flow diagram of the Soshanguve PETRO ASP variant plant. (A) Primary facultative pond, broken line square- fermentation pit, (B±D) secondary oxidation ponds, (E) BNR reactor, (F) clarifiers, (G) chlorination facility, (a) stream containing VFA for P-removal in the BNR reactor, (b) primary pond effluent,(c) oxidation pond recycle; recycle rate= c:(a+e)= 1.5, (d) algae-rich recycle, (e) BNR aerobic zone feed, (g) return activated sludge, (h) waste activated sludge to the aerobic sludge digester, (j) effluent to river, (k) to the sludge drying beds from Shipin et al., (1999a).
Alternatively, Gutzeit et al. ( 2005) followed by Medina and Neis (2007) found
that algae and activated sludge, when cultured together work symbiotically to
form settleable flocs. In their experiments, a reactor with a mixed liquor of
microalgae and activated sludge bacteria was fed a synthetic wastewater and
operated in a sequencing batch reactor (SBR) mode as well as continuous flow
mode. After 6 weeks of operation in SBR mode, the culture was assumed to be
stable. In these studies Gutzeit et al. (2005) and Medina and Neis (2007) focused
on the effects of hydraulic and organic loading as well as biomass recycling on
general treatment performance and floc formation. Gutzeit et al. (2005) saw that
the system could remove %65 of total nitrogen and achieve a sludge volume
index (SVI) of 118 mL/g. Similarly, Medina and Neis (2007) found that food to

11
microorganism ratio (F/M) was important for stabilizing algae once incorporated
into biomass and also effected the removal efficacy of total nitrogen. While SVI is
an indicator of settleability, neither stated effluent TSS concentrations were in
their respective tests.
In addition to biological and operational characteristics that aided in successful
operation of wastewater treatment methods described by Gutzeit et al. (2005),
Medina and Neis (2007), Shipin et al. (1999a), and Meiring and Oellerman
(1999), physical characteristics of activated sludge were found to have an effect
of effluent quality (Sheng et al., 2010; Subramanian et al., 2010). Fuchs and
Staudinger (1999) found that activated sludges with a “cross-linked matrix” had
clearer effluents than sludges without a cross-linked matrix. After 30 minutes of
settling with sludge possessing a well cross-linked matrix relative transparency
was nearly restored where the “disperse” sludge required more time to regain a
lower level of relative transparency (Fuchs and Staudinger, 1999). Results from
Fuchs and Staudinger (1999) extrapolate on the “mass action” effect of a blanket
of activated sludge moving down through the water column, clarifying the
supernatant.
Based on knowledge found in the literature review, this thesis research was
conducted to investigate the effect on bioflocculation of similar methods on
algae-rich pond effluents using activated sludge. Experiments were carried out in

12
lab scale reactors with typical reaction times of 4 hours, settling times of 30
minutes, and with aerobic and anaerobic conditions.

13
Methods
Three independent types of experiments were completed (Table 1). In the
Aerobic Beaker Tests volumes (and subsequently suspended solids masses) of
algae-rich water, primary effluent, and activated sludge were varied. In the
Anaerobic Preconditioning Beaker Test the same three constituents were varied
however an additional variable, anaerobic conditioning of algae-rich water and
primary effluent, was added. Lastly, in the Bacterial-Algal Sorption Beaker Test
only algae-rich water and activated sludge volumes (and subsequently
suspended solids masses) were varied.
Table 1. An overview of the three independent test and the constituents that were varied in each test.
Aerobic Beaker Tests Anaerobic Preconditioning
Beaker Test Bacterial-Algal Sorption
Test
1. Algae-rich water
2. Primary effluent
3. Activated sludge
1. Algae-rich water
2. Primary effluent
3. Activated sludge
1. Algae-rich water
2. Activated sludge
The Aerobic Beaker Tests and Anaerobic Preconditioning Beaker Test used
similar mixtures of primary effluent, algae-rich water, and activated sludge
inoculum. The difference between the two tests was that in the Aerobic Beaker
Tests, all of the mixture constituents (primary effluent, algae-rich water, and
activated sludge) were collected the day of the experiment and were considered
“fresh,” while in the Anaerobic Beaker Test, the primary effluent mixed with
algae-rich water was aged anaerobically for more than 12 hours prior to
experimentation and the other constituents were “fresh.” The Bacterial-Algal
Sorption Test was different from the Aerobic Beaker Tests and the Anaerobic

14
Preconditioning Beaker Test because no primary effluent was used in any of the
mixtures.
The mixtures in the three test types were placed into 2-L rectangular beakers
(Phipps & Bird, Richmond, Va.), then mixed/contacted for a specified period
using a 1.5-in paddle with a rotational speed of 15 RPM using a mixing
apparatus (also Phipps & Bird, Richmond, Va., Model PB 700 and Model 7790-
400; Figure 3). After the allotted mixing/contact time, the mixing apparatus was
turned off and the mixture was allowed to settle.
The beakers were aerated with lab compressed air, with the flow split to each of
the beakers that required aeration using a simple air manifold. Valves on the
manifold allowed for manual adjusting to achieve approximately equal air flow to
each beaker.
15
Figure 3. Phipps & Bird, Richmond, Va. mixing apparatus used in all experimentation.
The primary output variable of concern for all three tests was TSS at the end of
the settling step (measured as described below). The input variables for the
various tests were the initial TSS, the anaerobic period (for the Anaerobic
Preconditioning Beaker Test only), and the volumetric ratio of the components
added to the beakers. Additionally, in the Anaerobic Preconditioning Beaker Test,
primary effluent dissolved oxygen concentration was measured with a dissolved
oxygen meter (YSI Inc., Yellow Springs, Ohio, Model 58) prior to commencing
the contact period of the test and while the constituents were contacting in the
mixing apparatus. Controls without activated sludge, and in some cases without
primary effluent, were used to simulate the environments of typical HRAPs and
wastewater treatment ponds.
The primary effluent and activated sludge used in the experiments were collected
at the San Luis Obispo Wastewater Reclamation Facility (SLOWRF) in San Luis
16
Obispo, Calif. The primary effluent was collected from the effluent channel of the
#2 primary clarifier, and the activated sludge came from the return activated
sludge influent channel of the activated sludge basins.
Prior to running any beaker test, the influent TSS and volatile suspended solids
(VSS) were determined for each of the three constituents (i.e., algae-rich water,
primary effluent, and activated sludge) added to a given beaker.
Culturing Microalgae: Aerobic Beaker and Bacterial-Algal Sorption Tests
In preparation for the Aerobic Beaker Test and the Bacterial-Algal Sorption Test,
suspended microalgae were collected from a pond system treating municipal
wastewater from the community of San Jerardo near Salinas, California. These
algae were used for inoculation to grow larger quantities of algae in the lab.
Culturing of the algae-rich water used in the Aerobic Beaker Tests and the
Bacterial-Algal Sorption Test began by adding 5 gallons of the San Jerardo
inoculum and 20 gallons of primary effluent to a transparent 40-gallon fish tank. A
small circulation pump (Hydor, Sacramento, Ca., Model Koralia Evolution) was
placed in the fish tank, the tank was then covered with transparent plexiglass
with an air gap, and was allowed to acclimatize for one week outside. After one
week, the tank was brought to a volume of 40 gallons with 15 more gallons of
primary effluent. Every day thereafter, 10 gallons of the algae-wastewater
mixture was removed and replaced with 10 gallons of primary effluent that was

17
collected daily. Replacing 10 gallons of the water inside the fish tank with freshly
collected primary effluent daily provided a hydraulic residence time (HRT) of 4
days, similar to that of typical HRAPs. After two weeks of operating the fish tank
on a 4-day HRT, samples were collected for beaker testing.
Culturing Microalgae: Anaerobic Preconditioning Beaker Test
The algae culture used in the Anaerobic Preconditioning Beaker Test was grown
in HRAPs at the Cal Poly Algae Field Station (AFS) located at the SLOWRF. The
plastic-lined HRAPs at the Cal Poly AFS had a surface area 30 m and a nominal
depth of 30 cm. Paddle wheels continuously mixed the ponds and imparted an
average flow velocity of 30 cm/s. No chemical or gas addition was used in
culturing the algae in the ponds. This algae culture initially grew, in batch mode,
in SLOWRF reclaimed effluent circulating in the HRAPs, but then primary effluent
was added continuously to grow the algae with a 4-day HRT. After two weeks of
4-day HRT operation, the culture in Pond 5 was used in the Anaerobic
Preconditioning Beaker Test.
Aerobic Beaker Tests – Experimental Procedure
Beakers in the Aerobic Beaker Tests were mixed and aerated to simulate
conditions in a full scale activated sludge basin or the gentle mixing in HRAPs.
Each beaker was placed in the mixing apparatus unless the beaker was an
unmixed control or otherwise specified. After placing the beakers in the mixing

18
apparatus, they were brought to a volume of 2 liters according to each tests’
respective beaker plan (Table 3 and Table 4). Immediately after being brought to
a 2-L volume, the beakers started to receive aeration and mixing as called for in
their respective beaker plan.
Figure 4. A diagram of the Aerobic Beaker Tests, associated abbreviations for each test in the series, and a brief explanation of the waters tested.
Once the constituents were added to the beakers, and mixing and aeration
began, a given amount of time was allotted for any reaction to take place and
achieve appropriate contact. In the case of AE-2, the beakers were allowed a
Aerobic Jar Tests
Experiment 2 "AE-2"
Tested a wide range of volumetric ratios of
constituents (algae-rich water, primary effluent, and activated sludge).
The constituents were mixed and areated for 4
hours followed by 30 minutes of settling, after
which a supernatant solids sample was taken
and analyzed.
Experiment 3 "AE-3"
Tested fewer volumetric ratios of algae-rich water, primary
effluent, and activated sludge compared to AE-2, as no
substantial difference was observed in beakers with
similar volumetric ratios of the constituents.
The constituents were mixed and areated for 4
hours followed by 30 minutes of settling, after
which a supernatant solids sample was taken
and analyzed.
Experiment 4 "AE-4"
AE-4 was a repeat of AE-3.
The constituents were mixed and areated for 4
hours followed by 30 minutes of settling, after
which a supernatant solids sample was taken
and analyzed.
19
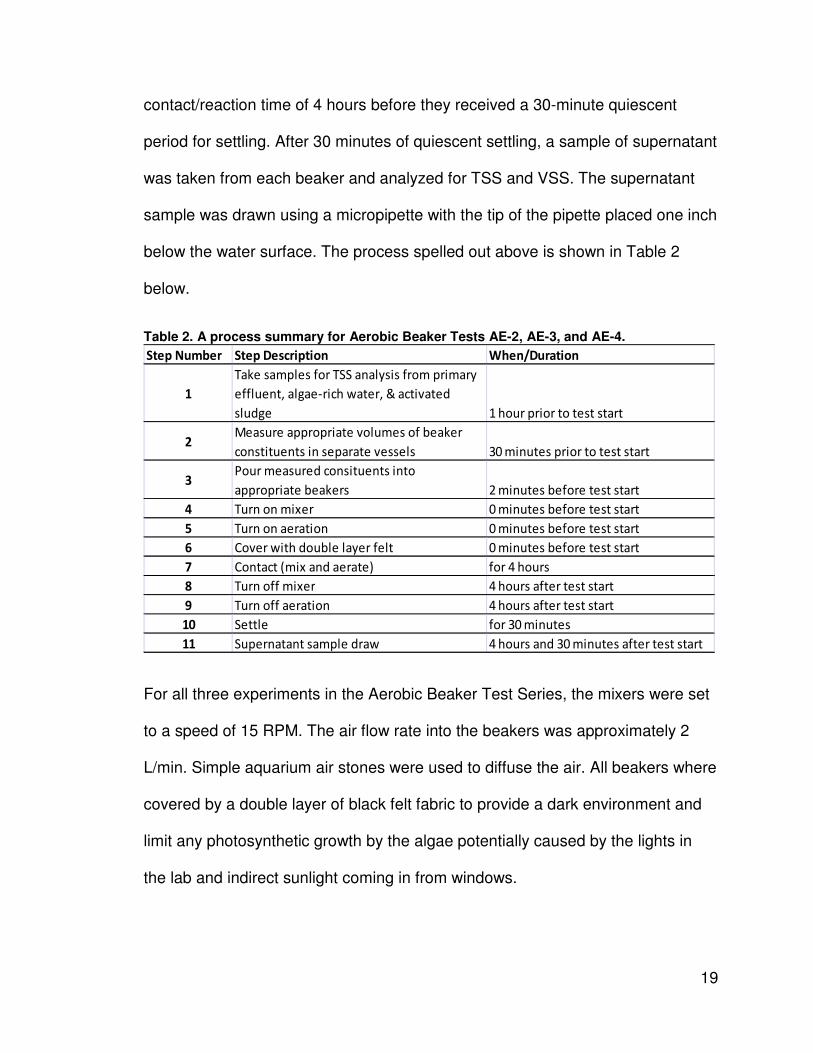
contact/reaction time of 4 hours before they received a 30-minute quiescent
period for settling. After 30 minutes of quiescent settling, a sample of supernatant
was taken from each beaker and analyzed for TSS and VSS. The supernatant
sample was drawn using a micropipette with the tip of the pipette placed one inch
below the water surface. The process spelled out above is shown in Table 2
below.
Table 2. A process summary for Aerobic Beaker Tests AE-2, AE-3, and AE-4.
Step Number Step Description When/Duration
1
Take samples for TSS analysis from primary
effluent, algae-rich water, & activated
sludge 1 hour prior to test start
2Measure appropriate volumes of beaker
constituents in separate vessels 30 minutes prior to test start
3Pour measured consituents into
appropriate beakers 2 minutes before test start
4 Turn on mixer 0 minutes before test start
5 Turn on aeration 0 minutes before test start
6 Cover with double layer felt 0 minutes before test start
7 Contact (mix and aerate) for 4 hours
8 Turn off mixer 4 hours after test start
9 Turn off aeration 4 hours after test start
10 Settle for 30 minutes
11 Supernatant sample draw 4 hours and 30 minutes after test start
For all three experiments in the Aerobic Beaker Test Series, the mixers were set
to a speed of 15 RPM. The air flow rate into the beakers was approximately 2
L/min. Simple aquarium air stones were used to diffuse the air. All beakers where
covered by a double layer of black felt fabric to provide a dark environment and
limit any photosynthetic growth by the algae potentially caused by the lights in
the lab and indirect sunlight coming in from windows.
20
Test AE-2 Beaker Plan
The volumes of the constituents used in Experiment AE-2 are described in Table
3. Beakers labeled C1 and C2 were for algae-rich water controls (Table 3). C1
received no aeration and no mixing, while C2 received only mixing and no
aeration. These control treatments were chosen to mimic the relative stagnation
typical in treatment ponds (C1) and the gentle mixing induced in flocculation
basins and in HRAPs (C2). Furthermore, the volumetric ratios chosen for AE-2,
and the subsequent Aerobic Beaker Tests (AE-3 and AE-4) and Anaerobic
Preconditioning Beaker Test were based on the typical mixed liquor suspended
solid (MLSS) concentrations of conventional return activated sludge plant
aeration basins. Using conventional aeration basin MLSS concentrations would
yield results more applicable to municipalities considering attaching an activated
sludge system downstream of treatment ponds. No duplicate beakers were
tested in AE-2.
Beakers 1 and 4 did not receive any activated sludge but did have a primary
effluent component and were the only beakers in AE-2 that did not receive
activated sludge, besides the controls. All beakers, except the two controls,
received aeration. The aeration of the beakers was performed in attempt to
imitate the oxic, growth-promoting conditions of an activated sludge basin.
21
Beaker 11 had a significantly higher volumetric ratio of algae-rich water to
primary effluent and subsequently higher algal TSS in the lab reactor. This high
algal solids concentration in the reactor was used to see if an “algal-overloading”
effect as described in Shipin et al., (1999b) and Meiring and Oellermann (1999),
was observed. For all experiments, the suspended solids concentration was
determined in each ingredient of the mixtures. These data are reported in the
Results section under the “Beaker Constituents - Initial Total Suspended Solids
Concentrations” subheading.

22
Table 3. Plan for Aerobic Beaker Tests AE-2.
C1 2000 0 0 2000 n/a n/aNot Mixed,
Not Aerated
C2 2000 0 0 2000 n/a n/aMixed, Not
Aerated
1 1600 400 0 2000 4:1 n/aMixed,
Aerated
2 1456 364 182 2002 4:1 2:1Mixed,
Aerated
3 1332 333 333 1998 4:1 1:1Mixed,
Aerated
4 1332 666 0 1998 2:1 n/aMixed,
Aerated
5 1144 572 286 2002 2:1 2:1Mixed,
Aerated
6 1000 500 500 2000 2:1 1:1Mixed,
Aerated
7 1000 400 600 2000 5:2 2:3Mixed,
Aerated
8 1200 300 500 2000 4:1 3:4Mixed,
Aerated
9 1000 800 200 2000 5:4 4:1Mixed,
Aerated
10 1200 600 200 2000 2:1 3:1Mixed,
Aerated
11 1400 200 400 2000 7:1 1:2Mixed,
Aerated
Volumetric Ratio
of Primary
Effluent to
Activated
Mixing
and
Aeration
Beaker
Label
Algae-rich
Water (mL)
Primary
Effluent (mL)
Activated
Sludge (mL)
Total
(mL)
Volumetric Ratio
of Algae-rich
Water to Primary
Effluent
Tests AE-3 and AE-4 Beaker Plan
The beaker plan for Tests AE-3 and AE-4 were the same as test AE-2 except
that beakers 7 through 11 were omitted. Beaker 11 was omitted because of a
lack of substantial difference relative to other beakers in the prior experiment,
AE2. Beakers 7 through 10 were omitted largely to simplify the experiment and
because there was no reason to trial intermediate volumetric ratios without first
substantiating differences of the more elementary volumetric ratios (e.g. 2:1
algae-rich water to primary effluent, 1:1 primary effluent to activated sludge, 1:1
algae-rich water to primary effluent).

23
Duplicate beakers were tested in AE-3 and AE-4. In Test AE-3 beakers C1, C2,
1, 2, and 6 used duplicates (Table 4). In Test AE-4 beakers C1, C2, and 6 used
duplicates (Table 4).
Table 4. Plan for Aerobic Beaker Tests AE-3 and AE-4.
Beaker
Label
Algae-rich
Water
(mL)
Primary
Effluent
(mL)
Activated
Sludge
(mL)
Total
(mL)
Volumetric Ratio
of Algae-rich
Water to Primary
Effluent
Volumetric Ratio
of Primary
Effluent to
Activated Sludge
Mixing
and
Aeration
C1 2000 0 0 2000 n/a n/a
Not Mixed,
Not
Aerated
C2 2000 0 0 2000 n/a n/a
Mixed, Not
Aerated
1 1600 400 0 2000 4:1 n/a
Mixed,
Aerated
2 1456 364 182 2002 4:1 2:1
Mixed,
Aerated
3 1332 333 333 1998 4:1 1:1
Mixed,
Aerated
4 1332 666 0 1998 2:1 n/a
Mixed,
Aerated
5 1144 572 286 2002 2:1 2:1
Mixed,
Aerated
6 1000 500 500 2000 2:1 1:1
Mixed,
Aerated
Bacterial-Algal Soprtion Beaker Test – Experimental Procedure
The Bacterial-Algal Sorption Beaker Test was used to determine how much TSS
could be sorbed to activated sludge flocs during a short time that allowed for only
minor bacterial growth. The Bacterial-Algal Sorption Beaker Test used the same
equipment as the Aerobic Beaker Tests and was generally conducted in the
same fashion. The primary difference was that the Bacterial-Algal Sorption
Beaker Test used only mixtures of algae-rich water and activated sludge. Table 5
summarizes the process followed in the Bacterial-Algal Sorption Beaker Test.
24
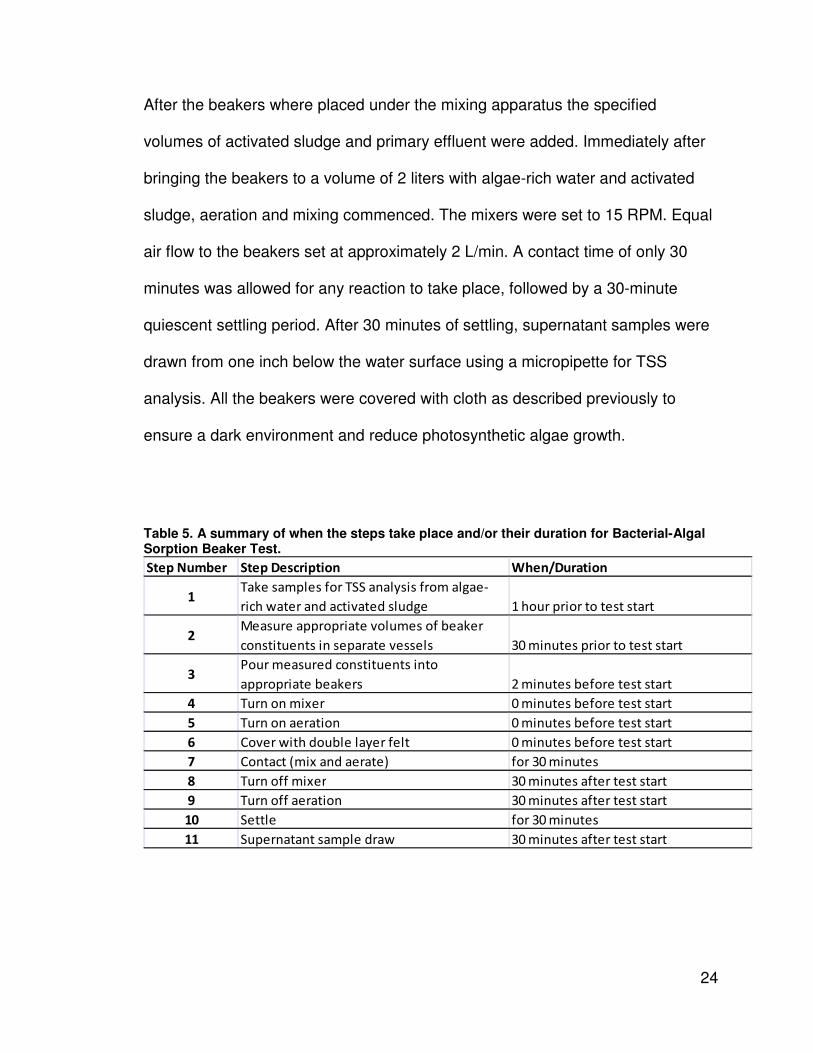
After the beakers where placed under the mixing apparatus the specified
volumes of activated sludge and primary effluent were added. Immediately after
bringing the beakers to a volume of 2 liters with algae-rich water and activated
sludge, aeration and mixing commenced. The mixers were set to 15 RPM. Equal
air flow to the beakers set at approximately 2 L/min. A contact time of only 30
minutes was allowed for any reaction to take place, followed by a 30-minute
quiescent settling period. After 30 minutes of settling, supernatant samples were
drawn from one inch below the water surface using a micropipette for TSS
analysis. All the beakers were covered with cloth as described previously to
ensure a dark environment and reduce photosynthetic algae growth.
Table 5. A summary of when the steps take place and/or their duration for Bacterial-Algal Sorption Beaker Test.
Step Number Step Description When/Duration
1Take samples for TSS analysis from algae-
rich water and activated sludge 1 hour prior to test start
2Measure appropriate volumes of beaker
constituents in separate vessels 30 minutes prior to test start
3Pour measured constituents into
appropriate beakers 2 minutes before test start
4 Turn on mixer 0 minutes before test start
5 Turn on aeration 0 minutes before test start
6 Cover with double layer felt 0 minutes before test start
7 Contact (mix and aerate) for 30 minutes
8 Turn off mixer 30 minutes after test start
9 Turn off aeration 30 minutes after test start
10 Settle for 30 minutes
11 Supernatant sample draw 30 minutes after test start
25
Bacterial-Algal Sorption Beaker Plan
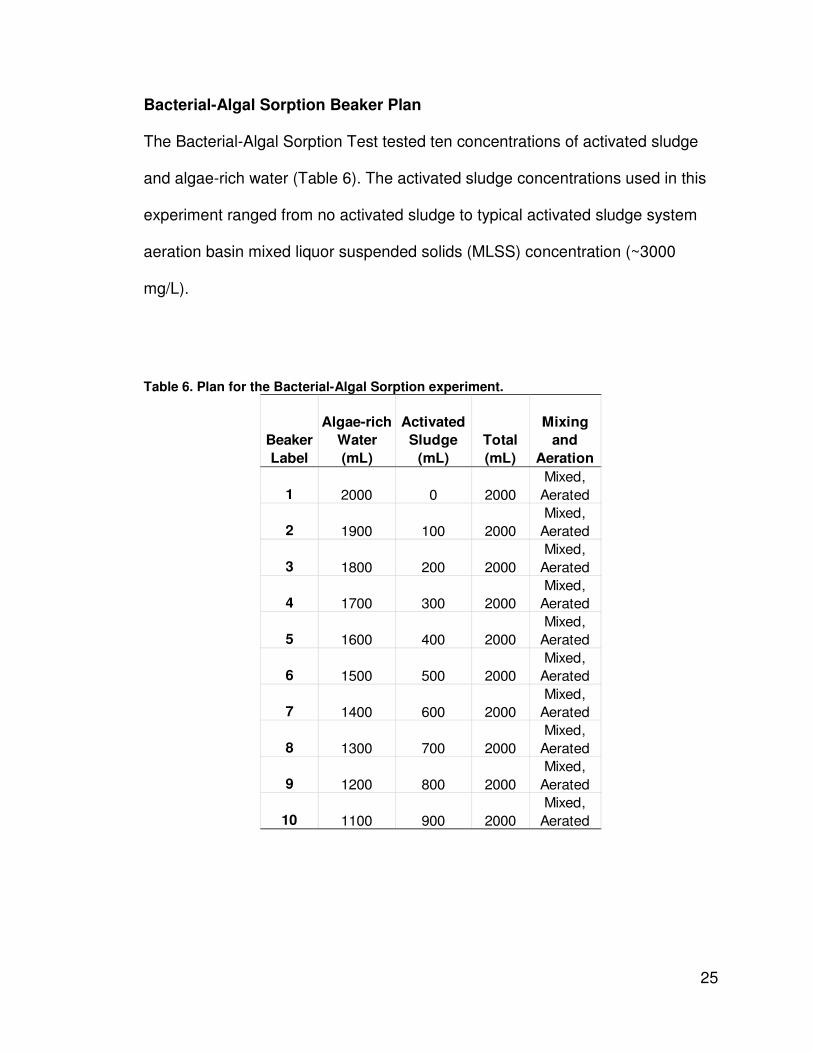
The Bacterial-Algal Sorption Test tested ten concentrations of activated sludge
and algae-rich water (Table 6). The activated sludge concentrations used in this
experiment ranged from no activated sludge to typical activated sludge system
aeration basin mixed liquor suspended solids (MLSS) concentration (~3000
mg/L).
Table 6. Plan for the Bacterial-Algal Sorption experiment.
Beaker
Label
Algae-rich
Water
(mL)
Activated
Sludge
(mL)
Total
(mL)
Mixing
and
Aeration
1 2000 0 2000
Mixed,
Aerated
2 1900 100 2000
Mixed,
Aerated
3 1800 200 2000
Mixed,
Aerated
4 1700 300 2000
Mixed,
Aerated
5 1600 400 2000
Mixed,
Aerated
6 1500 500 2000
Mixed,
Aerated
7 1400 600 2000
Mixed,
Aerated
8 1300 700 2000
Mixed,
Aerated
9 1200 800 2000
Mixed,
Aerated
10 1100 900 2000
Mixed,
Aerated

26
Anaerobic Preconditioning Beaker Test – Experimental
Procedure
The Anaerobic Preconditioning Beaker Test was largely the same as the Aerobic
Beaker Tests: the main difference was in constituent conditioning and repetition
of the contact operation, as explained later. The algae and primary effluent were
subjected to an anaerobic period prior to contact with the activated sludge, with
the intention of generating volatile fatty acids (and other “readily available organic
matter”) and/or stress that might promote flocculation. Before adding the
constituents to the beakers, algae-rich water, activated sludge, and primary
effluent were collected the day before the experiment. The algae-rich water and
primary effluent were then added to a clean 5-gallon bucket at a volumetric ratio
specified by the beaker plan. This mixture was then agitated vigorously 3
seconds. Immediately after agitation, the mixture was poured into two 2-L
Erlenmeyer flasks. The flasks were filled such that there was one-quarter inch of
headspace. The flask mouths were then covered with Parafilm. These measures
promoted anaerobic conditions. Filling flasks in this manner was repeated for all
specified volumetric ratios of algae-rich water and primary effluent.
After intermixing of algae water and primary effluent, the flasks were stored at
room temperature in the dark, with no agitation for a period of 12 to 14 hours.
The dissolved oxygen concentrations of each mixture before and after the 12-
hour period were determined, and confirmed anaerobic conditions were
27
achieved. The dissolved oxygen concentration of freshly collected algae-rich
water and primary effluent was also determined prior to intermixing. In addition to
preparing the anaerobic flasks the day before the experiment, TSS analysis was
carried out on the “fresh” algae-rich water, primary effluent, activated sludge, and
the freshly prepared mixtures (of algae-rich water and primary effluent) in the
flasks. After the sample of fresh activated sludge was taken for solids analysis,
the remainder was stored overnight at a temperature of 5⁰C for use in the
experiment the following day.
Solids analyses were conducted at intermediate points in the experimental
process to allow for comparison to “no-treatment” results (Table 7). The day of
the experiment, another solids analysis was carried out on the 12-hour aged
constituents. This solids analysis was performed on the (1) supernatant of the
quiescent anaerobic flask mixtures, (2) mixed anaerobic flask mixtures, (3) “pure”
aged quiescent algae-rich water, and (4) “pure” aged mixed algae-rich water.
Using the solids data from the day before the experiment, the appropriate
amount of activated sludge “seed” could be determined. An approximate 20% (by
mass) seed was used. The 20% (by mass) seed was based on the mass of the
algae-rich water and primary effluent suspended solids in the beaker. For
example, if the beaker contained an algae-rich suspended solids mass of 50 mg
28
and a primary effluent suspended solids mass of 50 mg (a total of 100 mg/L
TSS), then 20 mg of activated sludge mass was added to the beaker.
Once the beakers were brought to a volume of 2-L with the specified volumetric
ratio of algae-rich water to primary effluent and the activated sludge “seed,” the
beakers were promptly placed in the stirring apparatus. Immediately, the stirrers
were turned on and aeration commenced. The stirrers were set at 15 RPM, and
to approximately 2 L/min. Dissolved oxygen concentration readings were taken
periodically to ensure that the beakers were receiving adequate air flow. The
aeration and mixing lasted for 4 hours and was followed by 30 minutes of
quiescent settling, after which time supernatant samples were drawn from each
beaker one inch below the water surf ace using a micropipette and analyzed for
solids. This first contact operation was referred to as “Cycle 1.”
The settled activated sludge and other solids were recycled into subsequent
cycles to simulate a continuous activated sludge-like process, possibly with some
change (adaptation) in the characteristics of this seed material. Following
sample draw, the contents in the beakers that contained activated sludge seed
were manually decanted leaving only the solids that settled during the quiescent
period. This was done by removing the beakers from the mixing apparatus and
slowly tilting the beaker to not re-suspend the settled material.

29
Finally, after the beakers were decanted, another set of anaerobic flask mixtures,
exactly same as the previous mixtures, were added to the beakers. When the
beakers were refilled, they were placed under the mixing apparatus, and aeration
and mixing at 15 RPM were applied for 4 hours. The 4 hours of mixing and
aeration were followed by 30 minutes of settling, after which supernatant
samples were drawn from all beakers. This second operation was referred to as
“Cycle 2.” Time constraints inhibited additional decant and biomass recycling
operations, where further adaptations may have been observed.
This experiment can be summarized in terms of stages that correspond to
sampling point and to the intermediate points of treatment. The stages were
defined as follows:
Stage 1. TSS concentrations reported in Stage 1 were for samples that were
freshly prepared (e.g., the resulting TSS obtained immediately after mixing
a 2:1 ratio of algae-rich water with primary effluent).
Stage 2. TSS concentrations reported in Stage 2 were for samples that
underwent 12-hour settling along with their precondition/pretreatment
(e.g., the TSS resulting after 12-hr settling of “pure” algae-rich water and
“pure” anaerobic algae-rich water).
Stage 3. TSS concentrations reported in Stage 3 were for samples from the
supernatant of beakers that had undergone its prescribed treatment in
Cycle 1.

30
Stage 4. TSS concentrations reported in Stage 4 were for samples from the
supernatant of beakers that had undergone its prescribed treatment in
Cycle 2.
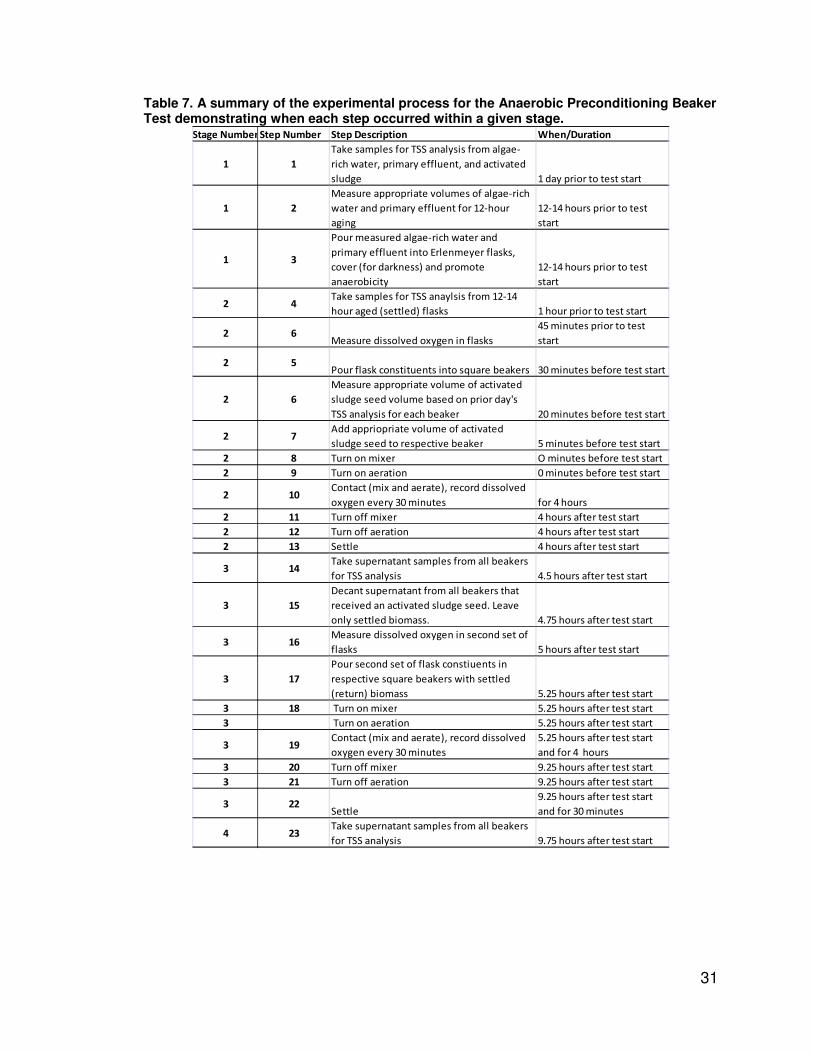
Table 7 below further describes the experimental process of the Anaerobic
Preconditioning Test.
31
Table 7. A summary of the experimental process for the Anaerobic Preconditioning Beaker Test demonstrating when each step occurred within a given stage.
Stage Number Step Number Step Description When/Duration
1 1
Take samples for TSS analysis from algae-
rich water, primary effluent, and activated
sludge 1 day prior to test start
1 2
Measure appropriate volumes of algae-rich
water and primary effluent for 12-hour
aging
12-14 hours prior to test
start
1 3
Pour measured algae-rich water and
primary effluent into Erlenmeyer flasks,
cover (for darkness) and promote
anaerobicity
12-14 hours prior to test
start
2 4Take samples for TSS anaylsis from 12-14
hour aged (settled) flasks 1 hour prior to test start
2 6Measure dissolved oxygen in flasks
45 minutes prior to test
start
2 5Pour flask constituents into square beakers 30 minutes before test start
2 6
Measure appropriate volume of activated
sludge seed volume based on prior day's
TSS analysis for each beaker 20 minutes before test start
2 7Add appriopriate volume of activated
sludge seed to respective beaker 5 minutes before test start
2 8 Turn on mixer O minutes before test start
2 9 Turn on aeration 0 minutes before test start
2 10Contact (mix and aerate), record dissolved
oxygen every 30 minutes for 4 hours
2 11 Turn off mixer 4 hours after test start
2 12 Turn off aeration 4 hours after test start
2 13 Settle 4 hours after test start
3 14Take supernatant samples from all beakers
for TSS analysis 4.5 hours after test start
3 15
Decant supernatant from all beakers that
received an activated sludge seed. Leave
only settled biomass. 4.75 hours after test start
3 16Measure dissolved oxygen in second set of
flasks 5 hours after test start
3 17
Pour second set of flask constiuents in
respective square beakers with settled
(return) biomass 5.25 hours after test start
3 18 Turn on mixer 5.25 hours after test start
3 Turn on aeration 5.25 hours after test start
3 19Contact (mix and aerate), record dissolved
oxygen every 30 minutes
5.25 hours after test start
and for 4 hours
3 20 Turn off mixer 9.25 hours after test start
3 21 Turn off aeration 9.25 hours after test start
3 22Settle
9.25 hours after test start
and for 30 minutes
4 23Take supernatant samples from all beakers
for TSS analysis 9.75 hours after test start
32
Anaerobic Preconditioning Beaker Plan
The Anaerobic Preconditioning Beaker Test used eight different mixtures of
algae-rich water, primary effluent, and activated sludge (Table 8). Two of the
mixtures were controls termed algae-rich water (ARW) and did not receive
activated sludge seed. One of the controls received no aeration, no mixing, and
no anaerobic preconditioning, thus it was labeled ARW No Treatment. The
second control received anaerobic preconditioning (achieved through 12-14 hour
aging), and mixing, but did not receive aeration (Mixed ARW Anaerobic Control).
The remaining six beakers received differing volumetric ratios of anaerobically
preconditioned algae-rich water and primary effluent. Beakers that received
activated sludge seed are labeled – “w/ seed.”

33
Table 8. Plan for Anaerobic Preconditioning Beaker Test.
Beaker
Label
Volumetric
Ratio of
Primary
Effluent to
Algae-rich
Water
Activated
Sludge
Seed (mL)
Total
(mL)
Mixing
and
Aeration
ARW
Control No
Treatmentn/a 0 2000
Not
Mixed,
Not
Aerated
ARW
Anaerobic
Control No
Seed n/a 0 2000
Mixed,
Not
Aerated
2:1
Anaerobic
Feed 2:1 0 1999
Mixed,
Aerated
1:1
Anaerobic
Feed 1:1 0 2000
Mixed,
Aerated
1:2
Anaerobic
Feed 1:2 0 1999
Mixed,
Aerated
2:1
Anaerobic
Feed w/
Seed 2:1 9 2008
Mixed,
Aerated
1:1
Anaerobic
Feed w/
Seed 1:1 10 2010
Mixed,
Aerated
1:2
Anaerobic
Feed w/
Seed 1:2 11 2010
Mixed,
Aerated
Beaker Constituents – Solids analysis
TSS and VSS concentrations were determined using standard methods using
Fisher Scientific G4 filters (nominal particle retention size 1.2 µm) in accordance
34
with Method 2500 (APHA, 1995). No set sample volume was passed through the
filters. A sample volume was poured until the filter became nearly clogged and
flow passed through in a drop-by-drop fashion.
Microscopy
Culture observations were carried out using a phase contrast microscope
(Olympus, Lapu-Lapu City, Cebu, Philippines, Model: CX41RF) and camera
(Lumenera, Ottawa, Ontario, Canada, Model: Infinity 2-1C). Identification of algal
genus and diatom taxa was assisted by use of Prescott et al. (1978) and
Spaulding et al. (2012) respectively. Species and morphological dominances
where determined qualitatively at 400X and 1000X magnifications.

35
Results and Discussion
This section describes in detail the results of the five successful experiments
conducted. First, the algae cultures subjected to the experiments are described.
Culture Observations
Chlorella, Scenedesmus, and Chlorococcum were the dominant algal genera in
the algae stock culture used in the Aerobic Beaker Tests and the Bacterial-Algal
Sorption Test. However, there was a minor presence of filament-forming algae
tentatively identified as Anabaena and Oscillatoria. A significant diatom fraction
was observed, with morphologies including nitzschoids, biraphids, and
monoraphids.
The algae culture from the high rate ponds used in the Anaerobic Preconditioning
Beaker Test was dominated by Micractinium, Golenkinia, and other spherical uni-
cellular algae such as Chlorella. In this culture, many sub-dominant Euglena-like
and Synedra-like algae were present. Filamentous algae were noticeably more
populous in the anaerobic preconditioning test algae-rich water than the algae-
rich water used in Aerobic Beaker and Bacterial-Algal Sorption experiments.
Oscillatoria-type algae appeared to exclusively comprise the filamentous
population.

36
Activated Sludge Observations
Activated sludge flora and fauna appeared to be relatively constant in terms of
microfauna composition over the duration of the experiments. The most populous
microfauna were various forms of protozoa. Stalked, crawling, and free
swimming ciliates appeared nearly without exception in all flocs. Rotifers were
numerous in the periphery of the activated sludge flocs and in the supernatant.
In the experiments, after the activated sludge was contacted with algae,
significant amounts of algae were observed within the matrix of many flocs.
Suspended Solids Removal
The TSS of the original algae-rich water from the fish tank or pond (����) was
diluted by the addition of primary effluent and activated sludge. This dilution
needed to be considered in TSS removal calculations.
The relationship between ���� and the pre-reaction diluted algae-rich water TSS
concentration (����) was proportional to the ratio of raw algae-rich water volume
(����) to the final volume of the entire mixture in the beaker (��������:
���� ����� !����
!"#�$#� (Eq. 3)
The TSS change was calculated two ways—one used ���� and one used ����.
Both used the settled beaker supernatant TSS (�%�&) as the final concentration.

37
The TSS concentration change that used the initial diluted TSS (����) was termed
'�(�)� , indicating true net removal of TSS, corrected and not overstated due to
dilution.
∆�(�)� � ���� , �%�& True removal, corrected for dilution of algae-rich water (Eq. 1.)
The second method determined the observed TSS change ('�-�.) based on the
undiluted raw algal TSS concentration (����) in the original algae-rich water from
the fish tank or pond.
∆�-�. � ���� , �%�& TSS change observed due to dilution and removal (Eq. 2.)
Where:
���� = original raw algae-rich water TSS concentration in the tank or pond
���� = pre-reaction diluted algae-rich water TSS concentration
�%�& = final settled supernatant TSS concentration after treatment. �%�&
was a combination algae-rich, activated sludge, and primary effluent TSS
concentration remaining in supernatant after treatment.
∆�(�)� = TSS removal based on pre-reaction diluted algae-rich water TSS
∆�-�. = TSS change observed between raw undiluted algae-rich water
final settled supernatant TSS
The increase of TSS due to the addition of primary effluent and activated sludge
is not considered in the equations. To simplify, this added TSS is assumed to be
completely removed in the reaction and settling process.

38
The TSS removed (calculated using both Eq. 1 and Eq. 2) contains algal solids,
primary effluent solids and activated sludge solids.
Constituent Total Suspended Solids Concentrations
Before any test was run, the initial total suspended solids concentration of each
constituent added to the mixture was measured (Table 9).
Table 9. Total suspended solids concentrations of the constituents used in all tests prior to testing. (Algae-rich water values are TSS in the “raw” algae-rich water samples, Araw.)
Test Constituent TSS (mg/L)
Algae-rich Water 269
Primary Effluent 55
Activated Sludge 2836
Algae-rich Water 276
Primary Effluent 83
Activated Sludge 2918
Algae-rich Water 253
Primary Effluent 55
Activated Sludge 5265
Algae-rich Water 285
Primary Effluent n/a
Activated Sludge 4125
Algae-rich Water 96
Primary Effluent 56
Activated Sludge 5971
AE-2
AE-3
AE-4
Bacterial-Algal
Sorption
Anaerobic
Preconditiong
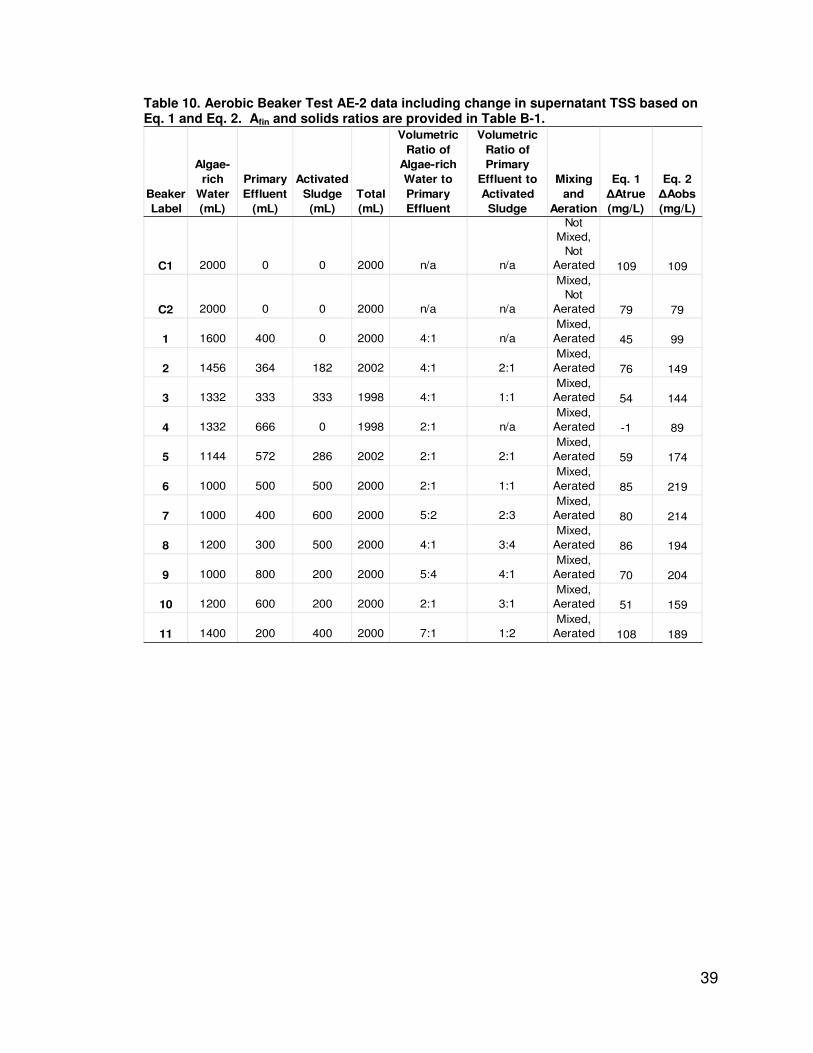
Aerobic Beaker Tests
The three Aerobic Beaker Tests used volumetric ratios defined in Table 3 (AE-2)
and Table 4 (AE-3 and AE-4). A summary of change in TSS concentration,
based on Eq. 1 and Eq. 2, as a result of the Aerobic Beaker Tests (AE-2, AE-3,
and AE-4) accompanies the beaker plans in Tables 10 and 11.
39
Table 10. Aerobic Beaker Test AE-2 data including change in supernatant TSS based on Eq. 1 and Eq. 2. Afin and solids ratios are provided in Table B-1.
C1 2000 0 0 2000 n/a n/a
Not
Mixed,
Not
Aerated 109 109
C2 2000 0 0 2000 n/a n/a
Mixed,
Not
Aerated 79 79
1 1600 400 0 2000 4:1 n/a
Mixed,
Aerated 45 99
2 1456 364 182 2002 4:1 2:1
Mixed,
Aerated 76 149
3 1332 333 333 1998 4:1 1:1
Mixed,
Aerated 54 144
4 1332 666 0 1998 2:1 n/a
Mixed,
Aerated -1 89
5 1144 572 286 2002 2:1 2:1
Mixed,
Aerated 59 174
6 1000 500 500 2000 2:1 1:1
Mixed,
Aerated 85 219
7 1000 400 600 2000 5:2 2:3
Mixed,
Aerated 80 214
8 1200 300 500 2000 4:1 3:4
Mixed,
Aerated 86 194
9 1000 800 200 2000 5:4 4:1
Mixed,
Aerated 70 204
10 1200 600 200 2000 2:1 3:1
Mixed,
Aerated 51 159
11 1400 200 400 2000 7:1 1:2
Mixed,
Aerated 108 189
Eq. 1
∆Atrue
(mg/L)
Eq. 2
∆Aobs
(mg/L)
Volumetric
Ratio of
Primary
Effluent to
Activated
Sludge
Mixing
and
Aeration
Beaker
Label
Algae-
rich
Water
(mL)
Primary
Effluent
(mL)
Activated
Sludge
(mL)
Total
(mL)
Volumetric
Ratio of
Algae-rich
Water to
Primary
Effluent

40
Table 11. Plan for Aerobic Beaker Tests AE-3 and AE-4 and the change in supernatant TSS based on Eq. 1 and Eq. 2. Solids ratios are provided in Tables B-2 and B-3 in Appendix B.
Beaker
Label
Algae-
rich
Water
(mL)
Primary
Effluent
(mL)
Activated
Sludge
(mL)
Total
(mL)
Volumetric
Ratio of
Algae-rich
Water to
Primary
Effluent
Volumetric
Ratio of
Primary
Effluent to
Activated
Sludge
Mixing
and
Aeration
AE-3
Eq. 1
∆Atrue
(mg/L)
AE-3
Eq. 2
∆Aobs
(mg/L)
AE-4
Eq. 1
∆Atrue
(mg/L)
AE-4
Eq. 2
∆Aobs
(mg/L)
C1 2000 0 0 2000 n/a n/a
Not
Mixed,
Not
Aerated 128 128 128 128
C2 2000 0 0 2000 n/a n/a
Mixed,
Not
Aerated 62 62 113 113
1 1600 400 0 2000 4:1 n/a
Mixed,
Aerated 73 128 57 108
2 1456 364 182 2002 4:1 2:1
Mixed,
Aerated 101 176 69 138
3 1332 333 333 1998 4:1 1:1
Mixed,
Aerated 104 196 83 168
4 1332 666 0 1998 2:1 n/a
Mixed,
Aerated -1 91 48 133
5 1144 572 286 2002 2:1 2:1
Mixed,
Aerated 98 216 64 173
6 1000 500 500 2000 2:1 1:1
Mixed,
Aerated 118 256 66 193
Control beakers that did not have activated sludge or aeration were used to
mimic the relative stagnation typical in treatment ponds (C1) and the gentle
mixing used in flocculation basins and in HRAPs (C2). Beakers with higher initial
diluted algae-rich water solids concentrations tended to have higher TSS
concentrations after the aerobic beaker treatment was performed (Figure 5).
Part of this effect is due to the lesser volume of dilution water from primary
effluent and activated sludge liquid for beakers with higher initial algae-rich water
TSS concentrations.

41
Figure 5. Aerobic beaker test initial algae-rich water TSS concentration, ����, and final TSS concentrations, ����.
The tests also showed that the higher the activated sludge concentration in the
beaker at the start of the test, the lower the final TSS in the supernatant (Figure
6). Of course, most of this effect is due to the higher dilution of algae-rich water
TSS by the greater volumes of activated sludge liquid added. In later figures, this
dilution effect is factored out.
y = 0.87x - 46.01
R² = 0.66
y = 0.91x - 67.74
R² = 0.63
y = 0.54x + 7.43
R² = 0.74
0
50
100
150
200
250
0 50 100 150 200 250 300
Fin
al
TS
S C
on
cen
tra
tio
n (
mg
/L)
Initial Algae-rich Water TSS Concentration, Adil (mg/L)
AE-2
AE-3
AE-4
42
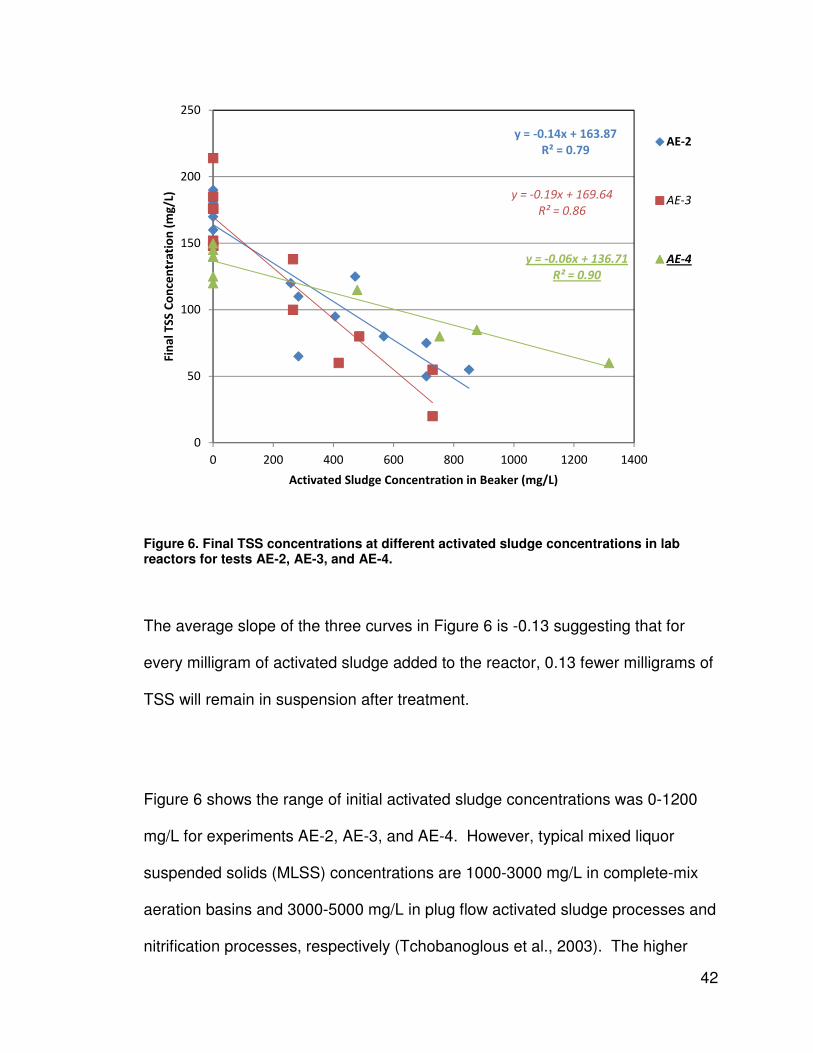
Figure 6. Final TSS concentrations at different activated sludge concentrations in lab reactors for tests AE-2, AE-3, and AE-4.
The average slope of the three curves in Figure 6 is -0.13 suggesting that for
every milligram of activated sludge added to the reactor, 0.13 fewer milligrams of
TSS will remain in suspension after treatment.
Figure 6 shows the range of initial activated sludge concentrations was 0-1200
mg/L for experiments AE-2, AE-3, and AE-4. However, typical mixed liquor
suspended solids (MLSS) concentrations are 1000-3000 mg/L in complete-mix
aeration basins and 3000-5000 mg/L in plug flow activated sludge processes and
nitrification processes, respectively (Tchobanoglous et al., 2003). The higher
y = -0.14x + 163.87
R² = 0.79
y = -0.19x + 169.64
R² = 0.86
y = -0.06x + 136.71
R² = 0.90
0
50
100
150
200
250
0 200 400 600 800 1000 1200 1400
Fin
al
TS
S C
on
cen
tra
tio
n (
mg
/L)
Activated Sludge Concentration in Beaker (mg/L)
AE-2
AE-3
AE-4
43
activated sludge concentrations used in the present thesis research would not be
practical in most situations because generating sufficient activated sludge would
mean most of the wastewater would be receiving activated sludge treatment and
the ponds would be only marginally useful. .
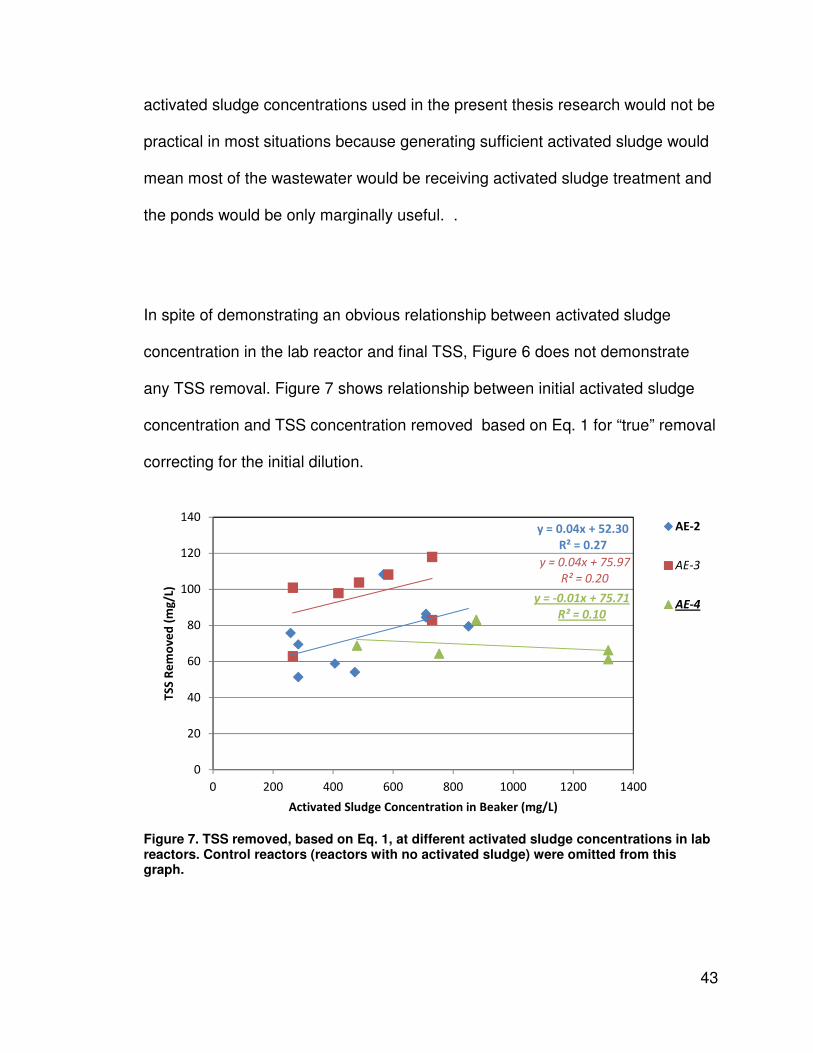
In spite of demonstrating an obvious relationship between activated sludge
concentration in the lab reactor and final TSS, Figure 6 does not demonstrate
any TSS removal. Figure 7 shows relationship between initial activated sludge
concentration and TSS concentration removed based on Eq. 1 for “true” removal
correcting for the initial dilution.
Figure 7. TSS removed, based on Eq. 1, at different activated sludge concentrations in lab reactors. Control reactors (reactors with no activated sludge) were omitted from this graph.
y = 0.04x + 52.30
R² = 0.27
y = 0.04x + 75.97
R² = 0.20
y = -0.01x + 75.71
R² = 0.10
0
20
40
60
80
100
120
140
0 200 400 600 800 1000 1200 1400
TS
S R
em
ov
ed
(m
g/L
)
Activated Sludge Concentration in Beaker (mg/L)
AE-2
AE-3
AE-4

44
Though the correlation is not strong, as demonstrated by low /values,
regressions from AE-2 and AE-3 show a trend of higher activated sludge
concentrations resulting in increased supernatant solids removal, however, AE-4
does not. The flatness of slope observed in the AE-4 regression was likely a
result of the high TSS concentration of the activated sludge used in test AE-4
(Table 9). Nevertheless the high TSS concentration of the activated sludge does
not explain the poor TSS removal, resulting in the negatively sloped regression,
observed in test AE-4.The relatively flat slopes demonstrate that activated sludge
concentration did not have a large effect on TSS removed.
Figure 8, below, is based on Eq. 2 and demonstrates substantive weak
relationship between the TSS removal capacity by activated sludge;
demonstrated by the relatively flat slope of the three curves. The regression for
test AE-3 had the highest slope (0.17). This suggests approximately, an
additional 450 mg/L of activated sludge solids concentration is required remove
an extra 75 mg/L from the beaker supernatant.

45
Figure 8. TSS removed, based on Eq. 2, after treatment with different activated sludge concentrations. Control reactors (reactors with no activated sludge) were omitted from this graph.
The effect of initial activated sludge concentration on TSS removed was
strongest for test AE-3 (greatest slope) and the 01 values were greater in Figure
8, than Figure 7. This stronger correlation is due to dilution.
Dilution would also occur in this process at full scale. The algae-rich water would
be mixed with activated sludge and be diluted, just as in the beaker tests. Such
dilution also occurs in conventional activated sludge operations where primary
effluent is diluted with return activated sludge upon entering the aeration basin.
The Eq. 1 “true” removal is presented to help with the understanding of
y = 0.08x + 140.16
R² = 0.44y = 0.17x + 120.39
R² = 0.74y = 0.06x + 119.36
R² = 0.88
0
50
100
150
200
250
300
0 200 400 600 800 1000 1200 1400
TS
S R
em
ov
ed
(m
g/L
)
Activated Sludge Concentration in Beaker (mg/L)
AE-2
AE-3
AE-4

46
bioflocculation, but the Eq. 2 change in TSS is equivalent to what would be
observed at a full-scale plant.
Activated Sludge to Primary Effluent Volumetric Ratio
Figure 9 displays the TSS removed (calculated using Eq. 2) as a result of
treatment with the various activated sludge to primary effluent volumetric ratios
used in the Aerobic Beaker Tests. The average slope for the TSS removed for
activated sludge to primary effluent volumetric ratio relationship in the Aerobic
Beaker Tests is 73. This suggests for every one unit increase in the activated
sludge to primary effluent volumetric ratio will result in 73 mg/L less TSS in the
final supernatant.
Figure 9. TSS removed, based on Eq. 2, after treatment with specified activated sludge to primary effluent volumetric ratios (Table 3 and Table 4) for aerobic beaker tests AE-2, AE-3, and AE-4. The zero ratio points refer to mixtures with no activated sludge or to control mixtures that had only algae-rich water.
y = 57.44x + 130.61
R² = 0.45
y = 118.00x + 110.11
R² = 0.78
y = 62.06x + 121.82
R² = 0.780
50
100
150
200
250
300
0 0.2 0.4 0.6 0.8 1 1.2 1.4 1.6
TS
S R
em
ov
ed
(m
g/L
)
Activated Sludge : Primary Effluent Volumetric Ratio
AE-2
AE-3
AE-4

47
The correlation in Figure 9 was best represented with a linear regression. This
suggests that the sorptive capacity or suspended solids removal capacity per
volume (and consequently mass) of activated sludge was being fully used.
Nonetheless, if the solids removal capacity is fixed per mass of activated sludge,
then the test with the highest activated sludge concentration (Table 9) should
have exhibited the greatest solids removal. There was a more substantial effect,
demonstrated by greater slopes, on TSS removed when analyzed in this fashion
(Figure 9) as opposed to the analysis of initial activated sludge concentration on
TSS removed (e.g. Figure 8). However, this stronger trend was not observed
when the effect of algae-rich water to primary effluent volumetric ratio was
analyzed (Figure 10).
Algae-rich Water to Primary Effluent Volumetric Ratio
Because there was a small range of algae-rich water to primary effluent ratios
any trend observed in Figure 10 may be misleading.

48
Figure 10. TSS removed, based on Eq. 2, after treatment different algae-rich water to primary effluent volumetric ratios (Table 3 and Table 4) for aerobic beaker tests AE-2, AE-3, and AE-4.
The volumetric ratio of algae-rich water to primary effluent was important
because it represents two important variables in the performance of a PETRO-
like system; algae-rich water and primary effluent. Drawing a relationship
between the relative volumes of algae-rich water and primary effluent in the
beaker was desired. Shipin et al. (1999a) saw flocculation benefits and increased
effluent quality (lower TSS and other pollutants) in similar experiments.
However, Figure 10 shows a generally negative slope of the algae-rich water to
primary effluent volumetric ratio regression. This suggests the increase in
primary effluent relative to algae-rich water may improve the ability of activated
sludge to remove suspended solids. The increase in primary effluent relative to
algae-rich water was represented by a decrease in the algae-rich water to
primary effluent volumetric ratio; it was at these lower ratios where greater TSS
y = -2.03x + 173.13
R² = 0.01
y = -24.20x + 244.40
R² = 0.19
y = -19.17x + 223.00
R² = 0.700
50
100
150
200
250
300
0 1 2 3 4 5 6 7 8
TS
S R
em
ov
ed
(m
g/L
)
Algae-rich Water : Primary Effluent Volumetric Ratio
AE-2
AE-3
AE-4

49
removal was observed. If there were a synergistic flocculating effect, which would
have been observed via increased TSS removal for both of the ratios (activated
sludge to primary effluent ratio and algae-rich water to primary effluent ratio)
tested, a non-linear relationship would have resulted.
Activated Sludge Solids to Algae-rich Solids Mass Ratio
The following three figures (Figures 11, 12, and 13) display the TSS removal for
the three Aerobic Beaker Tests as a function of activated sludge solids to algae-
rich solids mass ratio. All three tests showed increased TSS removal with
increasing activated sludge solids to algae-rich solids mass ratio.
Figure 11. TSS removed observed in test AE-2, calculated using Eq. 2, at different activated sludge solids to algae-rich solids mass ratios. The zero ratio points refer to mixtures with no activated sludge in the mixture or control mixtures that had only algae-rich water.
y = 20.76x + 108.49
R² = 0.79
0
50
100
150
200
250
300
0 1 2 3 4 5 6 7
TS
S R
em
ov
ed
(m
g/L
)
Activated Sludge Solids : Algae-rich Solids Mass Ratio
AE-2 Activated
Sludge Solids :
Algae-rich
Solids Mass
Ratio
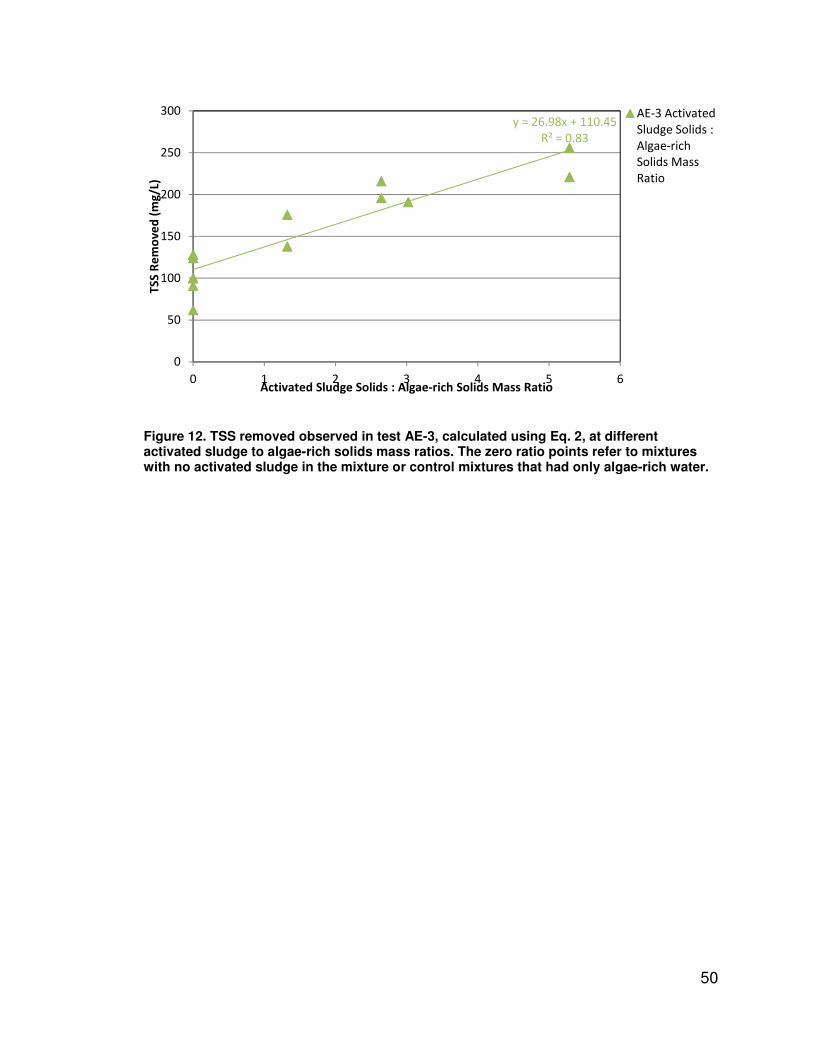
50
Figure 12. TSS removed observed in test AE-3, calculated using Eq. 2, at different activated sludge to algae-rich solids mass ratios. The zero ratio points refer to mixtures with no activated sludge in the mixture or control mixtures that had only algae-rich water.
y = 26.98x + 110.45
R² = 0.83
0
50
100
150
200
250
300
0 1 2 3 4 5 6
TS
S R
em
ov
ed
(m
g/L
)
Activated Sludge Solids : Algae-rich Solids Mass Ratio
AE-3 Activated
Sludge Solids :
Algae-rich
Solids Mass
Ratio

51
Figure 13. TSS removed observed in test AE-4, calculated using Eq. 2, at different activated sludge to algae-rich solids mass ratios. The zero ratio points refer to mixtures with no activated sludge in the mixture or control mixtures that had only algae-rich water.
y = 8.15x + 117.88
R² = 0.88
0
50
100
150
200
250
0 2 4 6 8 10 12
TS
S R
em
ov
ed
(m
g/L
)
Activated Sludge Solids : Algae-rich Solids Mass Ratio
AE-4 Activated
Sludge Solids :
Algae-rich Solids
Mass Ratio

52
The slope in Figures 11, 12, and 13 represents the TSS removed per unit
increase (i.e. 1:1 to 2:1) of mass ratio of activated sludge solids to algae-rich
solids. The average slope of the curves in Figure 12, 13 and 14 is approximately
18.6. Thus the average describes the ability for a one unit increase in the mass
ratio of activated sludge solids to algae-rich solids (i.e. 1:1 to 2:1) to remove 18.6
mg/L of TSS. AE-4 had a flatter slope (Figure 14) than in the other figures
(Figure 12 and 13). This was not expected. One plausible explanation for the flat
slope was the much higher activated sludge concentration (Table 8). There was
much more activated sludge mass used in test AE-4 because of the higher initial
activated sludge concentration (Table 8). The greater activated sludge solids
mass effected the slope in Figure 13 by lowering the TSS removed per unit
increase in the activated sludge solids to algae-rich solids mass ratio. If there
was a sorptive effect to be observed it would have been seen in Figure 14. The
increased sludge mass in AE-4 provided more potential sorption sites and
additional solids contact relative to AE-2 and AE-3 resulting in an increase in
TSS removal; but this did not happen.
Bacterial-Algal Sorption Beaker Test
In this experiment, primary effluent was not used, but a broader range of
activated sludge and algae-rich water concentrations in the lab reactors was
used than in the Aerobic Beaker Tests. Additionally, less reaction time was
allotted in this experiment. Unlike in the Aerobic Beaker Tests with 4-hours of
reaction time, only 30 minutes of reaction time in the Bacterial-Algal Sorption

53
Test was used. The settling time was 30 minutes in both experiments. A shorter
reaction time was used because the goal of the experiment was to observe any
mass action effect or spontaneous sorption of suspended solids onto the
activated sludge.
The TSS concentration remaining in suspension after treatment decreased
dramatically with increasing activated sludge concentration (Figure 14). Also
shown in Figure 14 is a theoretical curve, termed the dilution curve,
demonstrating the final TSS concentration if clean water was used in place of
activated sludge. This dilution curve demonstrates the theoretical effect that
solely diluting algae-rich water with non-reactive water would have on TSS
removed.
Calculating final supernatant TSS for the dilution curve was similar to Eq. 2,
stated previously. However, because this thesis did not experiment using only
water to dilute the algae-rich water, the final supernatant TSS concentration �%�
was not determined from a water sample. Instead final supernatant TSS was
calculated (Eq. 4).
∆�-�. � ���� , �%�& TSS change observed due to dilution and removal (Eq. 2a)
�%�& ����� !��
!2�� theoretical final TSS concentration (Eq. 4)
Where:

54
'�-�. � 345678 96 :;; <5=8> ?6 @5A 5B758 , @934 A5C8@ :;;
�%�& � D965B =EF8@65C56C :;; 3?6386C@5C9?6 GH. 4�
���� � @5A 5B758 , @934 5C8@ :;; 3?6386C@5C9?6
�� � C48?@8C935B K?BEL8 ?D >9BEC9?6 A5C8@ E=8>
�M�� � C48 D965B K?BEL8 ?D C48 86C9@8 L9NCE@8 96 C48 O5@
Clarifying further, ��, was the theoretical volume of water used to obtain the final
TSS concentration in Eq. 2a. This theoretical volume of water was equal to the
different volumes of activated sludge in the experiment. Therefore the x-axis in
Figure 14 is not valid for the dilution curve (no activated sludge was used).
Figure 14. Final TSS concentration after treatment at different activated sludge concentrations in the beaker. The “clean water curve” represents theoretical final TSS
y = -0.0582x + 240
R² = 1
y = -0.1116x + 256.65
R² = 0.9614
0
50
100
150
200
250
300
0 500 1000 1500 2000
Fin
al
TS
S C
on
cen
tra
tio
n (
mg
/L)
Activated Sludge Concentration in Beaker (mg/L)
Dilution with
Clean Water
Activated
Sludge

55
concentration if water was used in place of activated sludge. Average activated sludge solids to algae-rich solids mass ratio was 3.3.
The Bacterial-Algal Sorption Test demonstrated a strong linear correlation
between the final TSS and the activated sludge concentration (@ � 0.96). The
linear relationship suggests some of this decrease in TSS could be attributed to
dilution of the algae-rich water by the activated sludge or that the number of
sorption sites provided by the activated sludge bacterial consortium is a constant
property of the activated sludge sample used and that all the sites become
“immediately” occupied by suspended microalgae and other solids:
(3?6=C56C �&)S��� -% .-�T(�-& .�(�.
UV
W-% �X(�Y�(�� .�)�Z�
)
The two curves in Figure 14 diverge as a result of differing slopes. However, the
dilution has a flatter slope than the slope observed with activated sludge. This
suggests that the difference in the final TSS concentration is due to the presence
of activated sludge.
Because the final TSS concentration was not determined over a range of settling
times it is difficult to infer a discrete sludge blanket-supernatant interface
separation process as described by Fuchs and Staudinger (1999). After 30
minutes of batch settling, no significant increase in supernatant clarity (defined by
% transparency) occurs for a cross-linked settling activated sludge (Fuchs and
Staudinger, 1999).
56
The slope of the activated sludge regression line in Figure 14 is -0.11; this
implies that 0.11 less milligrams of TSS will remain in suspension for every
milligram of activated sludge increase in the reactor. If the algae-rich water was
solely diluted with clean water, .06 less milligrams of TSS would remain in
suspension for every milliliter of clean water; represented by the slope of the
dilution curve
The relationship in Figure 14 provides a means to predict effluent TSS of a
similarly operated activated sludge reactor with a similar algae-rich influent.
Figure 15 and Figure 16 display the amount of TSS removed due to treatment in
the Bacterial-Algal Sorption Test. Results were not substantially different
compared to results in the Aerobic Beaker Tests.

57
Figure 15. TSS removed from suspension after treatment with different activated sludge concentrations, using Eq. 1.
Figure 16. TSS removed from suspension after treatment with different activated sludge concentrations, using Eq. 2.
y = 0.04x + 28.35
R² = 0.78
0
20
40
60
80
100
120
0 500 1000 1500 2000
TS
S R
em
ov
ed
(m
g/L
)
Activated Sludge Concentration in Beaker (mg/L)
y = 0.11x + 28.35
R² = 0.96
0
50
100
150
200
250
0 500 1000 1500 2000
TS
S R
em
ov
ed
(m
g/L
)
Activated Sludge Concentration in Beaker (mg/L)
58
Once more it is shown that the higher the activated sludge concentration in the
reactor, the higher TSS removal observed. Figures 15 and 16 above do
demonstrate a significant reduction in TSS and perhaps more importantly do so
within a range of conventional aeration basin activated sludge concentrations
(1500-4000 mg/L). It is important to note that the shape of the curve in Figure 15
and Figure 16 is identical the curve produced when the x-axis is changed to the
mass ratio of activated sludge solids to algae-rich solids mass. The curves in
Figure 15 and Figure 16 have a slight sorption isotherm appearance when the
linear regression line is removed. This observation may suggest that Figure 15
and 16 are demonstrating the initial and more linear portion of a sorption
isotherm. Nevertheless, the inverse of the regression line slope is the sorption
ratio: 18 mg activated sludge were able to sorb 1 mg of microalgal cells (Figure
16).
Anaerobic Preconditioning Beaker Test
The Anaerobic Preconditioning Beaker Test was similar to the Aerobic Beaker
Tests, however there were two main differences. One new variable was
introducing the algae-rich water and primary effluent to anaerobic conditions for
twelve hours prior to use in the test. Secondly, recycling settled biomass was
completed in attempt to develop a setteable culture over the course of the test.
Another difference in the Anaerobic Preconditioning Beaker Test was that at
intermittent points in the experimental process TSS samples were taken and
analyzed. This allowed for comparison of treatment quality during the course of
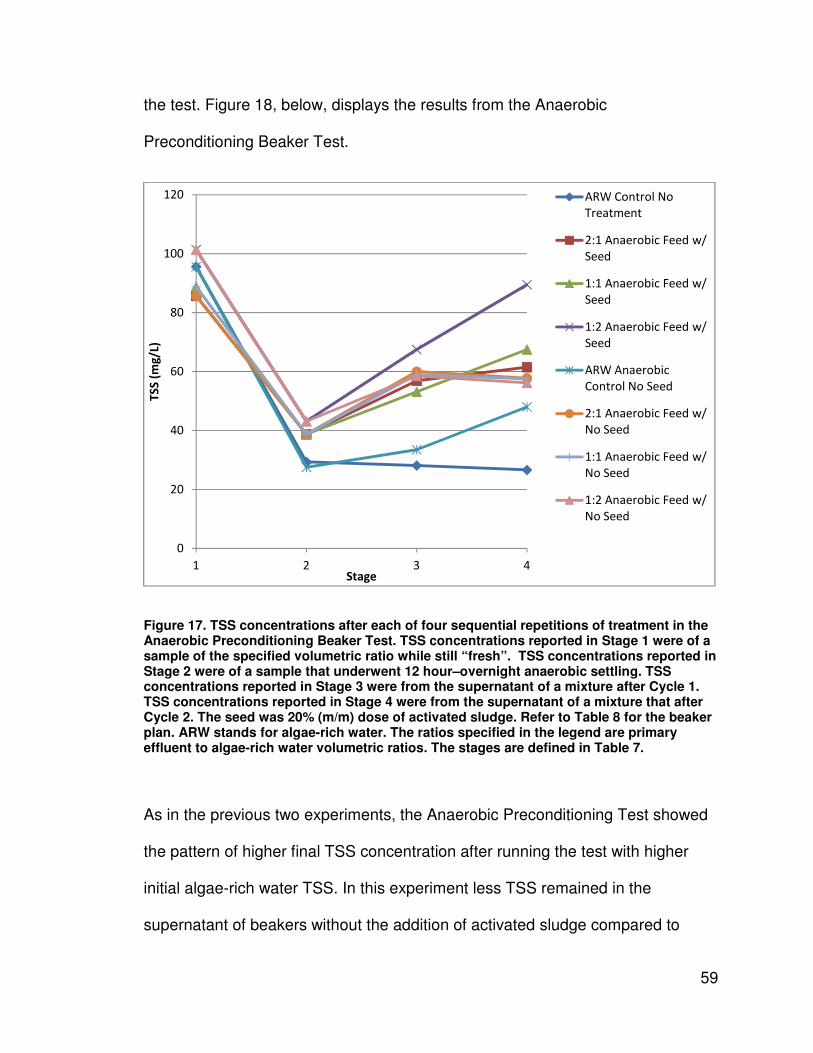
59
the test. Figure 18, below, displays the results from the Anaerobic
Preconditioning Beaker Test.
Figure 17. TSS concentrations after each of four sequential repetitions of treatment in the Anaerobic Preconditioning Beaker Test. TSS concentrations reported in Stage 1 were of a sample of the specified volumetric ratio while still “fresh”. TSS concentrations reported in Stage 2 were of a sample that underwent 12 hour–overnight anaerobic settling. TSS concentrations reported in Stage 3 were from the supernatant of a mixture after Cycle 1. TSS concentrations reported in Stage 4 were from the supernatant of a mixture that after Cycle 2. The seed was 20% (m/m) dose of activated sludge. Refer to Table 8 for the beaker plan. ARW stands for algae-rich water. The ratios specified in the legend are primary effluent to algae-rich water volumetric ratios. The stages are defined in Table 7.
As in the previous two experiments, the Anaerobic Preconditioning Test showed
the pattern of higher final TSS concentration after running the test with higher
initial algae-rich water TSS. In this experiment less TSS remained in the
supernatant of beakers without the addition of activated sludge compared to
0
20
40
60
80
100
120
1 2 3 4
TS
S (
mg
/L)
Stage
ARW Control No
Treatment
2:1 Anaerobic Feed w/
Seed
1:1 Anaerobic Feed w/
Seed
1:2 Anaerobic Feed w/
Seed
ARW Anaerobic
Control No Seed
2:1 Anaerobic Feed w/
No Seed
1:1 Anaerobic Feed w/
No Seed
1:2 Anaerobic Feed w/
No Seed

60
beakers that added activated sludge. Furthermore, through the determination of
solids over the course of this experiment, it was discovered that TSS in the
supernatant of all 12–hour aged quiescent beakers was less than in the beakers
that underwent the prescribed treatments, which included mixing.
ARW labeled beakers that were not aerated, or mixed (ARW Control No
Treatment) had lower TSS concentrations at nearly all stages of treatment
(Figure 17). Conversely, Figure 17 showed that the beaker with 1:2 anaerobic
feed with activated sludge seed had the highest TSS concentration at nearly all
stages of treatment. This observation, however, was expected for the 1:2
anaerobic feed beakers because these two beakers had the most initial solids,
mainly in the form of diluted algae-rich water solids. All the beakers, except the
control beaker, which received no treatment, demonstrated an increase in TSS
after receiving activated sludge seed, aeration, and mixing relative to the TSS
concentrations observed due to overnight settling.
Since supernatant TSS was higher for all beakers after 12-14 hours of settling
than after Stage 2, simple overnight settling of the waters tested was more
effective than any of the treatments tried in this test. Lower TSS concentration
observed after 12-14 hours (for all beakers) compared to TSS concentrations
measured after mixing/aeration with or without activated sludge, suggests a
61
longer period of settling may be required to show substantive differences in the
treatments’ ability to produce an effluent with low TSS concentration.
The seed (a 20% (m/m) dose of activated sludge) had the greatest effect on the
beakers with 1:2 anaerobic feed. At the end of Stage 4 the beaker with 1:2
anaerobic feed and activated sludge seed had a final TSS concentration 30 mg/L
greater than the identically treated beaker with no seed. All beakers that
received activated sludge seed demonstrated higher TSS concentrations at the
end of Stage 4 compared to their “no-seed” counterparts. Because 30-minute
settled TSS concentrations were not measured on “pure” activated sludge, an
increase in final TSS in the seeded beakers may be blamed on the addition of
suspended solids from the activated sludge seed. Approximately 10 mL of
activated sludge seed was added to the beakers that required seed (specified by
beaker plan Table 8). The activated sludge used in the Anaerobic
Preconditioning Test had a TSS concentration of 5971 mg/L (Table 8). Therefore
a 10-mL seed only added 60 mg of readily settleable solids to the beaker
(settleable, relative to solids in algae–rich water and primary effluent).
Lastly, the ARW control beaker that did not receive any treatment (ARW Control
No Treatment) had the lowest TSS concentrations at Stages 3 and 4. This
observation shows that algae-rich water is more settleable if left quiescent than if
gently mixed followed by 30 minutes of settling (ARW Anaerobic Control No

62
Seed). After Stage 2, the controls performed nearly identical to each other. It was
only after two 4-hour periods of gentle mixing followed by 30-minute settling that
the TSS concentration increased in the ARW Anaerobic Control No Seed beaker
(Stages 3 and 4). This indicates that a settling time longer than 30-minutes may
be required to highlight substantive differences in TSS among the treatments.
Relating the activated sludge solids to algae-rich solids mass ratio to TSS
removed in the Anaerobic Preconditioning Test is only possible for beakers that
received activated sludge seed. Analyzing the relationship between the activated
sludge solids to algae-rich solids mass ratio showed a stronger trend in Stage 4
results compared to Stage 3 results (Figure 18).
Figure 18. TSS removed observed in Stages 3 and 4 of the Anaerobic Preconditioning Test, calculated using Eq. 2, at different activated sludge to algae-rich solids mass ratios. Control beakers and beakers that received no activated sludge seed were omitted from this analysis.
y = 5.91x + 30.91
R² = 0.06
y = 29.61x - 9.61
R² = 0.87
0
5
10
15
20
25
30
35
40
45
0 0.5 1 1.5 2
TS
S R
em
ov
ed
(m
g/L
)
Activated Sludge Solids : Algae-rich Solids Mass Ratio
Stage 3
Stage 4
63
The primary difference between Stages 3 and 4 was the reuse of settled biomass
from Stage 3 in Stage 4. This allowed activated sludge bacteria another 4 hours
of growth, contact time, and adaptation to the conditions imparted in the beaker.
Additionally there was more settleable biomass (activated sludge bacteria,
bacterial-algal flocs, and algae flocs) to sorb the suspended solids poured into
the beaker during Stage 4.
In Figure 18, Stage 4 demonstrated a stronger correlation (greater slope) in this
analysis than Stage 3. While TSS removed during Stage 3 was higher at
activated sludge solids to algae-rich solids mass ratios equal to and less than 1,
the greater slope observed by the Stage 4 curve shows promise for increased
removal at higher ratios.

64
General Discussion
The most valuable pattern observed in the course of experimentation was the
pattern of higher activated sludge to primary effluent volumetric ratios resulting in
higher TSS removal. For all experiments, except the Anaerobic Preconditioning
Beaker Test, higher activated sludge concentrations (activated sludge to primary
effluent volumetric ratios) always demonstrated greater TSS removal than
beakers with less (or no) activated sludge. Beakers in the Anaerobic
Preconditioning Beaker Test that had activated sludge seed showed higher final
TSS concentrations than beakers that did not receive activated sludge seed.
Increased final TSS in beakers with activated sludge seed was not expected in
the Anaerobic Preconditioning Beaker Test. Though some unexpected
observations were made in the Anaerobic Precondition Beaker Test, the
observations were important. For example, it was observed that the control
beaker that was not mixed produced a final TSS concentration lower than the
same control beaker that was mixed. Furthermore, the Anaerobic Preconditioning
Beaker Test showed that all mixtures of algae-rich water and primary effluent had
lower TSS concentrations after a 12-hour settling period than after being mixed
with or without an activated sludge seed followed by 30-minute settling.
There were, however, two primary concerns regarding the experiments in this
thesis:
1. Limited settling time

65
2. Inability to culture a settleable activated sludge-algal biomass
Allowing colloidal microalgae only 4 hours of contact time with activated sludge
was meant to simulate the hydraulic residence time of activated sludge aeration
basins. The sequencing batch mode of operation during the Anaerobic
Preconditioning Beaker Test required a filling, reaction, sedimentation, and
decant cycle time of about 5 hours, which is typical for treatment of domestic
wastewater with a semi-batch reactor (SBR) activated sludge system. The
equivalent filling, reaction, sedimentation and decanting processes described in
Medina and Neis (2007) and Gutzeit et al. (2005) took 2 days. This allowed
ample time for reaction and build-up of settleable biomass to occur. Furthermore,
Medina and Neis (2007) and Gutzeit et al. (2005), cultured their symbiotic algal-
bacteria broth for 6 weeks. This method of culturing recycled settled biomass
would have likely encouraged the buildup of a more settleable culture.
In this thesis research, only 30 minutes of settling were allowed so that positive
effects on settling might be more distinct. Longer settling periods (2-hour, 12-
hour, and 24-hour) should result in improved supernatant clarity. This improved
clarity was suggested in the Anaerobic Preconditioning Beaker Test, where the
supernatant in all beakers had lowest TSS concentrations after 12 hours of
settling. Typical sedimentation tanks allow 2 hours of detention time
(Tchobanoglous et al., 2003), 4-times greater than was allowed for settling
66
herein. Thus, the results may underestimate the TSS removal capabilities of the
trialed treatments.
Even when allowed a retention time of 1-2 days in an algal settling pond only 50-
80% of algal biomass from a HRAP was observed to be removed (Park et al.,
2011b). After performing algal biomass recycling and maintaining a near 90%
species dominance of Pediastrum sp. in the HRAPs studied, Park et al. (2011b)
saw settling efficiencies near 90%, an improvement of 30% over the settling
efficiency of the control. Despite high removal efficiencies with biomass recycling
and the maintenance of a settleable, multicellular algal species, removal of TSS
to permissible levels was still difficult. Lastly, the case of Nurdogan and Oswald
(1995) a removal of 86% of TSS was observed but only when a stable culture of
Micractinium sp. was present and using a modest settler over flow rate of 0.15
ZTS
%([ . Despite high removal efficiencies nowhere in these studies do the authors,
Park et al. (2011b) and Nurdogan and Oswald (1995) disclose effluent TSS.
However, the build-up of a stable settleable bacterial-algal culture was not the
purpose of this effort. Instead, the goal was to determine the ability for a
conventional activated sludge to remove a colloidal culture from suspension.
“Mass action” or rapid bio-sorptive mechanisms were sought rather than a
languid bioflocculating mechanism.

67
The efforts in this study largely attempted to recreate the efforts of Shipin et al.
(1999a & 1999b) and Meiring and Oellermann (1995) who saw high quality
effluents from minutes of contact time (PETRO TF) to hours of contact time
(PETRO ASP). This study was relatively successful in demonstrating improved
final TSS concentrations in a PETRO-like fashion.
The “mass action” mechanism was described, by Fuchs and Staudinger (1999),
briefly mentioned earlier. They describe the ability of two different sludges that
have similar settling rates to produce entirely different effluent quality. It was
found that sludges that produced a higher quality (as defined by transparency of
the supernatant) formed a cross-linked matrix between sludge flocs, which in turn
created a sharp interface between the settling sludge blanket and the
supernatant (Fuchs and Staudinger, 1999). On the other hand, a disperse sludge
blanket-supernatant interface produced a poorer quality effluent (Fuchs and
Staudinger, 1999). Development of adequate cross linkage depended on
activated sludge concentration (thus limiting the distance between the sludge
flocs) and the individual flocculation properties of the sludge bacterial consortia
(Fuchs and Staudinger, 1999). Well cross-linked sludges described in Fuchs and
Staudinger (1999) demonstrated a maximum effluent quality after 30 minutes of
batch settling. If the sludge used in this research project were of the cross-linking
sort, then the best achievable supernatant (effluent) may have been observed.

68
On the other hand, if the sludge used in the present report was the disperse
settling sort, then the best achievable supernatant (effluent) may not have been
observed.
Furthermore, EPS may have a crucial role binding bacterial cells together
forming flocs and adsorbing soluble and particulate matter in bulk fluid (Sheng et
al. 2010; Subramanian et al. 2010). Sheng et al. (2010) and Wingender (1999)
go further in saying, that EPS is responsible for forming a substantial net-like
structure binding cells to cells, have many sites for adsorption, and can even be
described by the Fruendlich sorption equation in some instances. However,
because no significant sorptive removal mechanism was observed, EPS
concentrations in the activated sludge from SLOWRF may have been low. If EPS
concentrations were significant enough to have an effect, they should have been
observed as the time allotted for mixing in all experiments was more than
adequate for typical flocculation processes in wastewater (Tchobanoglous et al.,
2003).
Alternatively, significant quantities of EPS may have been in the activated
sludge, but the characteristics and composition of the activated sludge may have
not had any effect on the suspended algal matrix. The lack of multivalent cations
has proved to reduce activated sludge flocculation and subsequent settling by
bridging negatively charged particles (i.e. anionic EPS or negatively charged

69
bacteria/microalgae) (Subramanian et al. 2010). Therefore, a potential lack of
multivalent cations in the waters tested in this research may have led to poor
suspended algae removal.
Many flocs observed under the microscope demonstrated the tendency for algae
to be at the center of flocs when the floc contained activated sludge organisms
(Apendix – A Micrographs 11, 12, and 13). It appeared that ciliates and other
components of activated sludge entrapped or encircled algae, forming a floc.
Ciliates and other activated sludge components were almost always on the
periphery of floc (with algae in the center) (Appendix- A). This suggested that
algae may not be sorbing to the surface of the activated sludge floc. From the
micrographs it is difficult to decipher the origin of the floc. Origin of algal-bacterial
flocs observed include the following possibilities:
1. Colloidal microalgae began to flocculate forming a larger floc
followed by a microbial envelopment
2. The algae floc was a pin floc and EPS (bacterial and algal)
secretion sorbed surrounding algal pin floc and bacterial
components
3. Stalked ciliates possess a flocculating mechanism near the end of
their stalk to form the “ciliate rings”.
Other researchers show that EPS may even inhibit activated sludge
performance. There is reported to be a threshold quantity of EPS that is

70
beneficial, after which EPS will inhibit mass transfer (Liao et al., 2001; Sheng et
al., 2010). Inhibition of mass transfer is caused by the “clogging” of potential
sorption site by the EPS (Sheng et al., 2010) and by increasing the net negative
charge of the negatively charged microorganism (Mikkelson & Nielsen, 2001). In
any event, the complexity of the role of EPS on the flocculation of activated
sludge, and its effect on a recalcitrant suspension of algae, warrants caution
declaring relationships and drawing conclusions based on EPS concentration or
composition.

71
Conclusions
In general, higher activated sludge concentrations led to higher TSS removal and
subsequently lower final TSS concentration of algal suspensions. Conversely,
greater concentrations of algae-rich water led to higher final TSS concentrations
and less TSS removal.
When concentrations of activated sludge were nearly equal to those typical of
activated sludge MLSS concentrations, supernatant TSS concentration
approached regulatory limits (for example, <40 mg/L). However, only one reactor
during the course of experimentation produced an effluent TSS concentration
less than 30 mg/L. However, this beaker in the Anaerobic Preconditioning Beaker
Test (ARW Control No Treatment) experienced a long settling time (>12 hours)
which is likely to blame for low final TSS concentration.
Overnight quiescence proved to leave less TSS in the supernatant than a 4-hour
aerobic reaction time with activated sludge and mixing. In fact, in the Anaerobic
Preconditioning Beaker Test, activated sludge was observed to inhibit TSS
removal from the supernatant compared to beakers that received no activated
sludge seed. Only two 4-hour cycles of SBR-like operation in the Anaerobic
Preconditioning Beaker Test likely did not build up a settleable microbial
consortium acclimatized to algae-rich influents. Conversely, the PETRO ASP is a
72
continuously operating reactor that returns settled biomass, inevitably building a
microbial stock accustomed to settling solids in algae-rich waters.
No predominance of a specific algae species was observed in any of the
experiments. Species predominance can be affected by biomass recycling.
Longer reaction times and biomass recycling, effectively increasing the mean cell
residence time (MCRT) should be considered in future experimentation.
Furthermore, studies explicitly on the effect of EPS on settleability of algae
should be performed.
Results of this study specifically show:
1. >12 hours of anaerobic settling can lower HRAP TSS effluent
concentration to 30 mg/L (Figure 18).
2. Addition of > 3000 mg/L activated sludge concentrations can produce final
effluents near discharge requirements (40-50 mg/L) with only 30 minutes
of settling and without the addition of any primary effluent (Figure 17).
3. A 1 unit increase in the activated sludge to primary effluent volumetric
ratio (i.e. 1:1 to 2:1) results in approximately 73 mg/L less TSS in the
supernatant (Figures 9, 10, and 11)
4. A 1 unit increase in the activated sludge solids to algae-rich solids mass
ratio (i.e. 1:1 to 2:1) in the beaker resulted in approximately 19 mg/L less
TSS in the supernatant (Figures 12, 13, and 14).
73
5. >200 mg/L TSS removal was achieved using activated sludge to primary
effluent ratios equal to, and greater than 1:1 (Figures 9 and 10).
6. >250 mg/L TSS removal was achieved using an activated sludge
concentration of 730 mg/L with the addition of primary effluent (Figure 8).
The work presented herein reports the difficulty of removing algae from
suspension using typical activated sludge processes. Moreover, the results add
to the library of activated sludge performance and algae removal from
wastewater treatment lagoons and HRAPs.
74
Works Cited
Abeliovich, A., Weisman, D. "Role of Heterophic Nutrition in Growth of Alga
Scenedesmus Obliquus in High Rate Oxidation Ponds." Applied and
Environmental Microbiology, 1978: 32-37.
Agency, United States Environmenta Protection. Clean Watersheds Needs
Survey 2008 A Report to Congress. Survey, Washington D.C.: United
States Environmental Protection Agency, 2008.
Al-Shayji, Y.A., Puskas, K., and Al-Daher, K. "Production and Separation of
Algae in a High-rate Ponds System." Environment International, 1994:
541-550.
APHA. Standard Methods for the Examination of Water and Wastewater.
American Public Health Association, American Water Works Association,
Water Environment Federation, 1995.
Avnimelech, Y., Troeger, B., Reed, L. "Mutual Flocculation of Algae and Clay:
Evidence and Implications." Science, 1982: 63-65.
Becker, E. "Algae as a Source of Protein." Biotechnology Advances, 2007: 207-
210.

75
Benemann, J. Biofixation of CO2 and Greenhouse Gas Abatement with
Microalgae - Technology Roadmap. Final Report, U.S. Department of
Energy: National Energy Technology Laboratory, 2003.
Benemann, J. "CO2 Mitigation with Microalgae Systems." Energy Conversion
and Management, 1997: 475-479.
Birchall, S., D. Cliff, and R. Wrigley. Effluent and Manure Management Database
for the Australian Dairy Industry. Southbank Victoria: Dairy Australia,
2008.
Christenson, L., Sims, R. "Production and Harvesting of Microalgae for
Wastewater Treatment, Biofuels, andBioproducts." Biotechnology
Advances, 2011: 686-702.
Craggs, R.J., Huebeck, S., Lundquist, T.J., Benemann, J.R. "Algal Biofuels from
Wastewater Treatment High Rate Algal Ponds." Water Science and
Technology, 2011: 660-665.
Fuchs, A., Staudinger, G. "Characterising the Clarification of the Supernatant of
Activated Sludges." Water Research, 1999: 2527-2534.
Gutzeit, G., Lorch, D., Weber, A., Engels, M., Heis, U. "Bioflocculent Algal-
Bacterial Biomass Improves Low-Cost Wastewater Treatment." Water
Science and Technology, 2005: 9-18.

76
Leppard, G. "The characterization of algal and microbial mucilages and their
aggregates in aquatic ecosystems." The Science of the Total
Environment, 1995: 103-131.
Liao, B., Allen, D., Droppo, I., Leppard, G., and Liss, S. "Surface properties of
sludge and their role in bioflocculation and settleability." Water Research,
2001: 339-350.
Lundquist, T., Frost, D., Podevin, M. "Advances in Wastewater Treatment Pond
Performance Using High Rate Ponds." 84th Annual Water Environment
Federation Technical Exhibition and Conference. Los Angeles: Water
Environment Federation, 2011.
Medina, M., Neis, U. "Symbiotic Algal Bacterial Wastewater Treatment: Effect of
Food to Microorganism Ratio and Hydraulic retention Time on the Process
Performance." Water Science and Technology, 2007: 165-171.
Meiring, P., Oellerman, R. "Biological Removal of Algae in an Integrated Pond
System." Water Science Technology, 1995: 21-31.
Mikkelsen, L., Nielsen, P. "Quantification of the bond energy of bacteria attached
to activated sludge floc surfaces." Water Science Technology, 201: 67-75.
Murphy, C., Allen, D. "Energy-Water Nexus for Mass Cultivation of Algae."
Environmental Science and Technology, 2011.
Nurdogan, Y., Oswald, W. "Enhanced Nutrient Removal in High-Rate Ponds."
Water Science and Technology., 1995: 33-43.

77
O'Colla, P. Physiology and Biochemistry of Algae. New York: Academic Press,
1962.
Ogbanna, J., Masui, H., Tanaka, H. "Sequential Heterotrophic/Autotrophic
cultivation – An Efficient Method of Producing Chlorella Biomass for
Health food and Animal Feed." Journal of Applied Phycology, 1997: 359-
366.
Park, J. Craggs, R., Shilton, A. "Wastewater Treament High Rate Algal Ponds for
Biofuel Production." Bioresource Technology, 2011a: 35-42.
Park, J., R. Craggs, and A. Shilton. "Recylcing Algae to Improve Species Control
and Harvest Efficiency from a High Rate Algal Pond." Water Research,
2011b: 6637-6649.
Prescott, G., Bamrick, J., Cawley, E., and Jaques, W. How to know the
freshwater algae. Dubuque, Iowa: W.C. Brown, 1978.
Shaw, A., Barnard, J. "What's you Phosphorus Footprint?" 84th Annual Water
Environment Federation Technical Exhibition and Conference. Los
Angeles: Water Environment Federation, 2011. 4422-4429.
Sheng, G., Yu, H., Li, X. "Extracellular Polymeric Substances (EPS) of Microbial
Aggregates in Biological Wastewater Treatment Systems: A Review."
Biotechnology Advances, 2010: 882-894.
78
Shipin, O., Meiring, P., Phswana, R., Kluever, H. "Integrating Ponds and
Activated Sludge Process in the PETRO Concept." Water Research,
1999a: 1767-1774.
Shipin, O., Rose, P., Meiring, P. "Microbial processes underlying the PETRO
concept (trickling filter variant)." Water Research, 1999b: 1645-1651.
Spaulding, S.A., Lubinski, D.J. and Potapova, M. Diatoms of the United States. 5
6, 2012. http://westerndiatoms.colorado.edu.
Subramanian, S., Yan, S., Tyagi, R., Surampalli, R. "Extracellular polymeric
substances (EPS) producing bacterial strains of municipal wastewater
sludge: Isolation, molecular identification, EPS characterization and
performance for sludge settling and dewatering." Water Research, 2010:
2253-2266.
Tchobanoglous, G., Burton F.L., and H.D. Stensel. Wastewater Engineering:
Treatment and Reuse. New York: McGraw-Hill Higher Education, 2003.
Van De Hende, S., Vervaeren, H., Desmet, S., Boon, N. "Bioflocculation of
Microalgae and Bacteria Combined with Flue Gas to Improve Sewage
Treatment." New Biotechnology, 2011.
Wingender, J., Neu, T., Flemming, H. "What are bacterial extracellular polymeric
substances?" In Microbial extracelluar polymeric substances:
characterization, structures and function., by J., Neu, T., Flemming, H.
Wingender, 1-18. New york: Berlin Heidelberg: Springer-Verlag, 1999.

79

80
Appendix A Photo Micrographs
Figure A-1. Golenkinia attached to larger particle with spiral-like microorganism. From HRAP used in the Anaerobic Preconditioning Test before treatment.
Figure A-2. Micractinium attached to a floc of bacteria and smaller spherical Chlorella-like algae cells.
\ Figure A-3. Micractinium colony in untreated “control” culturing fish tank water sample used in Aerobic Beaker Test 4.
Figure A-4. Micractinium colony in untreated HRAP sample used in Aerobic Beaker Test 4.
Figure A-5. Large floc of stalked ciliates in an activated sludge sample. Demonstrates typical composition of activated sludge throughout experimentation.
Figure A-6. Activated sludge sample with typical consortia throughout testing. Rotifers and stalked ciliates appear in significant quantities.
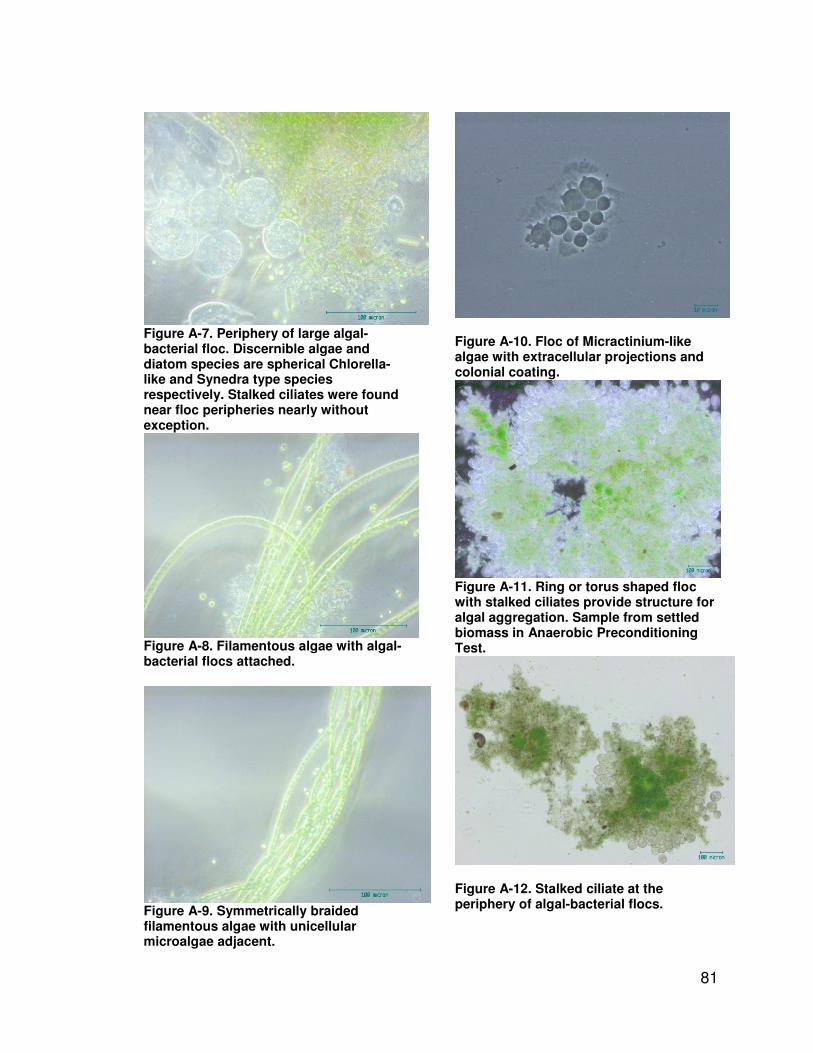
81
Figure A-7. Periphery of large algal-bacterial floc. Discernible algae and diatom species are spherical Chlorella-like and Synedra type species respectively. Stalked ciliates were found near floc peripheries nearly without exception.
Figure A-8. Filamentous algae with algal-bacterial flocs attached.
Figure A-9. Symmetrically braided filamentous algae with unicellular microalgae adjacent.
Figure A-10. Floc of Micractinium-like algae with extracellular projections and colonial coating.
Figure A-11. Ring or torus shaped floc with stalked ciliates provide structure for algal aggregation. Sample from settled biomass in Anaerobic Preconditioning Test.
Figure A-12. Stalked ciliate at the periphery of algal-bacterial flocs.
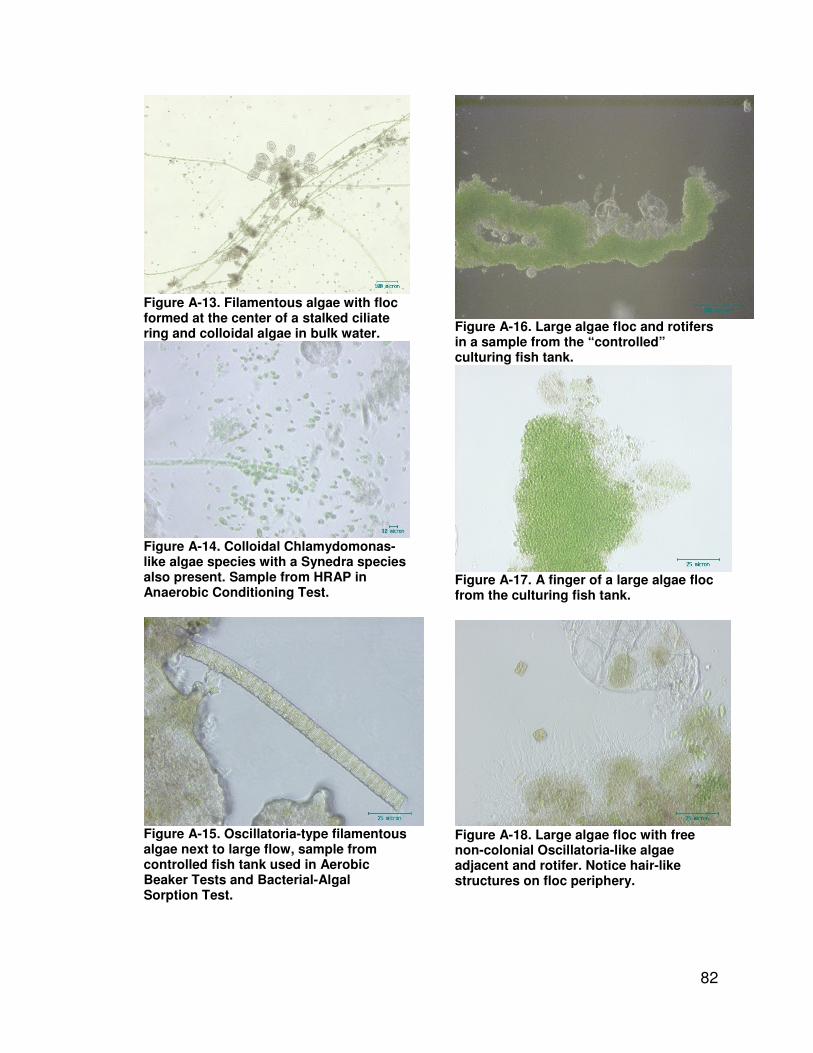
82
Figure A-13. Filamentous algae with floc formed at the center of a stalked ciliate ring and colloidal algae in bulk water.
Figure A-14. Colloidal Chlamydomonas-like algae species with a Synedra species also present. Sample from HRAP in Anaerobic Conditioning Test.
Figure A-15. Oscillatoria-type filamentous algae next to large flow, sample from controlled fish tank used in Aerobic Beaker Tests and Bacterial-Algal Sorption Test.
Figure A-16. Large algae floc and rotifers in a sample from the “controlled” culturing fish tank.
Figure A-17. A finger of a large algae floc from the culturing fish tank.
Figure A-18. Large algae floc with free non-colonial Oscillatoria-like algae adjacent and rotifer. Notice hair-like structures on floc periphery.

82
Appendix B Data Tables
Table B-1. Aerobic Beaker Test AE-2 volumetric ratios, solids mass ratios, and results. Raw algae-rich water TSS concentration, Ar, for AE-2 was 269 mg/L.
C1 2000 0 0 2000 n/a n/a n/a
Not
Mixed,
Not
Aerated 0 269 0.00 160 109.00 109.00
C2 2000 0 0 2000 n/a n/a n/a
Mixed,
Not
Aerated 0 269 0.00 190 79.00 79.00
1 1600 400 0 2000 4:1 n/a 0
Mixed,
Aerated 0 215 0.00 170 45.20 99.00
2 1456 364 182 2002 4:1 8:1 1:2
Mixed,
Aerated 258 196 1.32 120 75.83 149.00
3 1332 333 333 1998 4:1 4:1 1:1
Mixed,
Aerated 472 179 2.64 125 54.15 144.00
4 1332 666 0 1998 2:1 n/a 0
Mixed,
Aerated 0 179 0.00 180 -0.85 89.00
5 1144 572 286 2002 2:1 4:1 1:2
Mixed,
Aerated 406 154 2.64 95 58.87 174.00
6 1000 500 500 2000 2:1 2:1 1:1
Mixed,
Aerated 709 135 5.27 50 84.50 219.00
7 1000 400 600 2000 5:2 5:3 3:2
Mixed,
Aerated 851 135 6.33 55 79.50 214.00
8 1200 300 500 2000 4:1 12:5 4:3
Mixed,
Aerated 709 161 4.39 75 86.40 194.00
9 1000 800 200 2000 5:4 5:1 1:4
Mixed,
Aerated 284 135 2.11 65 69.50 204.00
10 1200 600 200 2000 2:1 6:1 1:3
Mixed,
Aerated 284 161 1.76 110 51.40 159.00
11 1400 200 400 2000 7:1 7:2 2:1
Mixed,
Aerated 567 188 3.01 80 108.30 189.00
Eq. 1
∆Ap
(mg/L)
Eq. 2
∆At
(mg/L)
Mixing
and
Aeration
Beaker
Label
Algae-
rich
Water
(mL)
Primary
Effluent
(mL)
Activated
Sludge
(mL)
Total
(mL)
Volumetric
Ratio of Algae-
rich Water to
Primary
Effluent
Activated
Sludge TSS
in Beaker
(mg/L)
Activated
Sludge Solids
to Algae-rich
Solids Mass
Ratio
Final
TSS
(mg/L)
Diluted Algae-
rich Water TSS
in Beaker (mg/L)
Volumetric
Ratio of
Activated
Sludge to
Primary
Effluent
Volumetric
Ratio of Algae-
rich Water to
Activated
Sludge

83
Table B-2. Aerobic Beaker Test AE-3 volumetric ratios, solids mass ratios, and results. Beakers DC1 and DC2 were duplicates of beakers C1 and C2, respectively. Beakers 1a, 2a, and 6a were duplicates of beakers 1, 2, 6, respectively. Raw algae-rich water TSS concentration, Ar, for AE-3 was 276 mg/L.
C1 2000 0 0 2000 n/a n/a n/a n/a
Not
Mixed,
Not
Aerated 0 276 0.00 148 128.00
DC1 2000 0 0 2000 n/a n/a n/a n/a
Not
Mixed,
Not
Aerated 0 276 0.00 152 124.00
C2 2000 0 0 2000 n/a n/a n/a n/a
Mixed,
Not
Aerated 0 276 0.00 214 62.00
DC2 2000 0 0 2000 n/a n/a n/a n/a
Mixed,
Not
Aerated 0 276 0.00 176 100.00
1 1600 400 0 2000 4:1 n/a n/a 0
Mixed,
Aerated 0 221 0.00 148 72.80
1a 1600 400 0 2000 4:2 n/a n/a 0
Mixed,
Aerated 0 221 0.00 176 44.80
2 1456 364 182 2002 4:1 8:1 2:1 1:2
Mixed,
Aerated 266 201 1.32 100 100.93
2a 1456 364 182 2002 4:1 8:1 2:1 1:2
Mixed,
Aerated 266 201 1.32 138 62.93
3 1332 333 333 1998 4:1 4:1 1:1 1:1
Mixed,
Aerated 486 184 2.64 80 103.82
4 1332 666 0 1998 2:1 n/a n/a 0
Mixed,
Aerated 0 184 0.00 185 -1.18
5 1144 572 286 2002 2:1 4:1 2:1 1:2
Mixed,
Aerated 417 158 2.64 60 97.87
6 1000 500 500 2000 2:1 2:1 1:1 1:1
Mixed,
Aerated 730 138 5.29 20 118.00
6a 1000 500 500 2000 2:1 2:1 1:1 1:1
Mixed,
Aerated 730 138 5.29 55 83.00
Eq. 1
∆Ap
(mg/L)
Volumetric
Ratio of
Primary
Effluent to
Activated
Sludge
Mixing
and
Aeration
Beaker
Label
Algae-
rich
Water
(mL)
Primary
Effluent
(mL)
Activated
Sludge
(mL)
Total
(mL)
Volumetric
Ratio of Algae-
rich Water to
Primary
Effluent
Activated
Sludge TSS
in Beaker
(mg/L)
Activated
Sludge Solids
to Algae-rich
Solids Mass
Ratio
Final
TSS
(mg/L)
Diluted Algae-
rich Water TSS
in Beaker (mg/L)
Voluemtric
ratio of
Activated
Sludge to
Primary
Effluent
Volumetric
Ratio of Algae-
rich Water to
Activated
Sludge

84
Table B-3. Aerobic Beaker Test AE-4 volumetric ratios, solids mass ratios, and results. Beakers labeled DC1 and 6a were duplicates of beakers C1 and 6a respectively. Raw algae-rich water TSS concentration, Ar, for AE-4 was 253 mg/L.
C1 2000 0 0 2000 n/a n/a n/a n/a
Not
Mixed,
Not
Aerated 0 253 0.00 125 127.50
DC1 2000 0 0 2000 n/a n/a n/a n/a
Not
Mixed,
Not
Aerated 0 253 0.00 140 112.50
C2 2000 0 0 2000 n/a n/a n/a n/a
Mixed,
Not
Aerated 0 253 0.00 140 112.50
DC2 2000 0 0 2000 n/a n/a n/a n/a
Mixed,
Not
Aerated 0 253 0.00 150 102.50
1 1600 400 0 2000 4:1 n/a n/a 0
Mixed,
Aerated 0 202 0.00 145 57.00
2 1456 364 182 2002 4:1 8:1 2:1 1:2
Mixed,
Aerated 479 184 2.60 115 68.82
3 1332 333 333 1998 4:1 4:1 1:1 1:1
Mixed,
Aerated 877 168 5.20 85 83.17
4 1332 666 0 1998 2:1 n/a n/a 0
Mixed,
Aerated 0 168 0.00 120 48.17
5 1144 572 286 2002 2:1 4:1 2:1 1:2
Mixed,
Aerated 753 145 5.20 80 64.43
6 1000 500 500 2000 2:1 2:1 1:1 1:1
Mixed,
Aerated 1316 127 10.41 60 66.25
6a 1000 500 500 2000 2:1 2:1 1:1 1:1
Mixed,
Aerated 1316 127 10.41 65 61.25
Eq. 1
∆Ap
(mg/L)
Volumetric
Ratio of
Primary
Effluent to
Activated
Sludge
Mixing
and
Aeration
Beaker
Label
Algae-
rich
Water
(mL)
Primary
Effluent
(mL)
Activated
Sludge
(mL)
Total
(mL)
Volumetric
Ratio of Algae-
rich Water to
Primary
Effluent
Activated
Sludge TSS
in Beaker
(mg/L)
Activated
Sludge Solids
to Algae-rich
Solids Mass
Ratio
Final TSS
(mg/L)
Diluted Algae-
rich Water TSS
in Beaker (mg/L)
Volumetric
ratio of
Activated
Sludge to
Primary
Effluent
Volumetric
Ratio of Algae-
rich Water to
Activated
Sludge
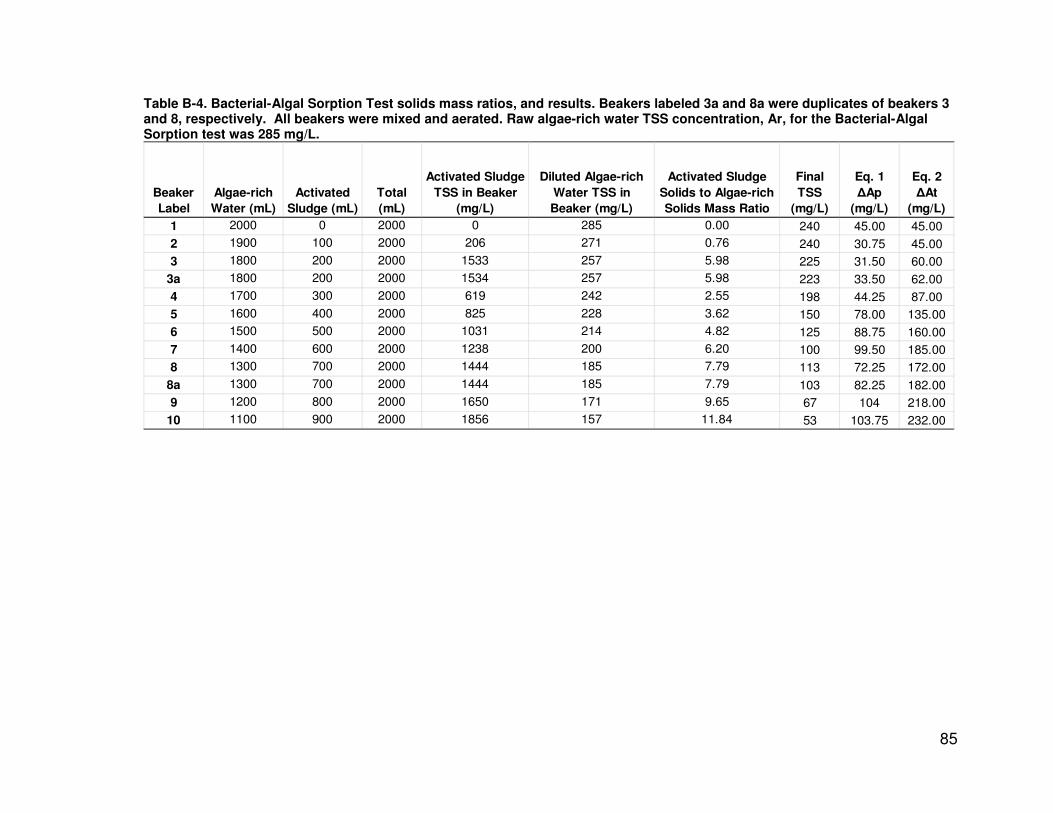
85
Table B-4. Bacterial-Algal Sorption Test solids mass ratios, and results. Beakers labeled 3a and 8a were duplicates of beakers 3 and 8, respectively. All beakers were mixed and aerated. Raw algae-rich water TSS concentration, Ar, for the Bacterial-Algal Sorption test was 285 mg/L.
Beaker
Label
Algae-rich
Water (mL)
Activated
Sludge (mL)
Total
(mL)
Activated Sludge
TSS in Beaker
(mg/L)
Diluted Algae-rich
Water TSS in
Beaker (mg/L)
Activated Sludge
Solids to Algae-rich
Solids Mass Ratio
Final
TSS
(mg/L)
Eq. 1
∆Ap
(mg/L)
Eq. 2
∆At
(mg/L)
1 2000 0 2000 0 285 0.00 240 45.00 45.00
2 1900 100 2000 206 271 0.76 240 30.75 45.00
3 1800 200 2000 1533 257 5.98 225 31.50 60.00
3a 1800 200 2000 1534 257 5.98 223 33.50 62.00
4 1700 300 2000 619 242 2.55 198 44.25 87.00
5 1600 400 2000 825 228 3.62 150 78.00 135.00
6 1500 500 2000 1031 214 4.82 125 88.75 160.00
7 1400 600 2000 1238 200 6.20 100 99.50 185.00
8 1300 700 2000 1444 185 7.79 113 72.25 172.00
8a 1300 700 2000 1444 185 7.79 103 82.25 182.00
9 1200 800 2000 1650 171 9.65 67 104 218.00
10 1100 900 2000 1856 157 11.84 53 103.75 232.00
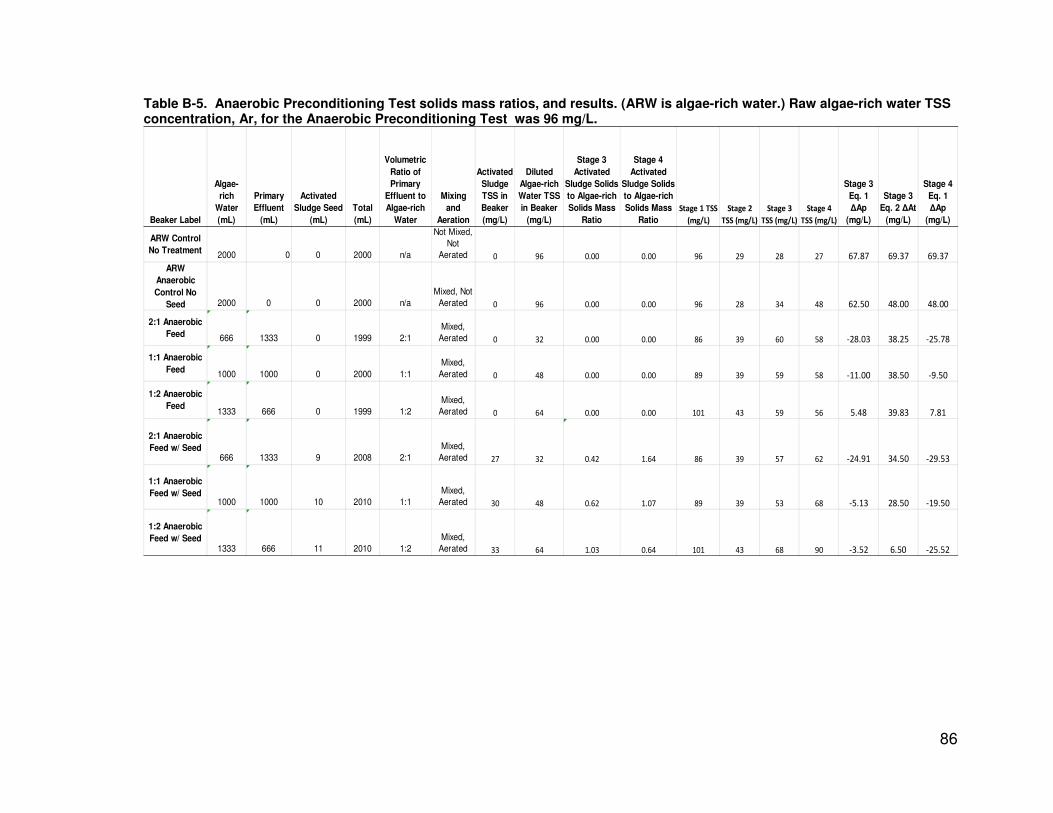
86
Table B-5. Anaerobic Preconditioning Test solids mass ratios, and results. (ARW is algae-rich water.) Raw algae-rich water TSS concentration, Ar, for the Anaerobic Preconditioning Test was 96 mg/L.
Beaker Label
Algae-
rich
Water
(mL)
Primary
Effluent
(mL)
Activated
Sludge Seed
(mL)
Total
(mL)
Volumetric
Ratio of
Primary
Effluent to
Algae-rich
Water
Mixing
and
Aeration
Activated
Sludge
TSS in
Beaker
(mg/L)
Diluted
Algae-rich
Water TSS
in Beaker
(mg/L)
Stage 3
Activated
Sludge Solids
to Algae-rich
Solids Mass
Ratio
Stage 4
Activated
Sludge Solids
to Algae-rich
Solids Mass
Ratio
Stage 1 TSS
(mg/L)
Stage 2
TSS (mg/L)
Stage 3
TSS (mg/L)
Stage 4
TSS (mg/L)
Stage 3
Eq. 1
∆Ap
(mg/L)
Stage 3
Eq. 2 ∆At
(mg/L)
Stage 4
Eq. 1
∆Ap
(mg/L)
ARW Control
No Treatment2000 0 0 2000 n/a
Not Mixed,
Not
Aerated 0 96 0.00 0.00 96 29 28 27 67.87 69.37 69.37
ARW
Anaerobic
Control No
Seed 2000 0 0 2000 n/a
Mixed, Not
Aerated 0 96 0.00 0.00 96 28 34 48 62.50 48.00 48.00
2:1 Anaerobic
Feed 666 1333 0 1999 2:1
Mixed,
Aerated 0 32 0.00 0.00 86 39 60 58 -28.03 38.25 -25.78
1:1 Anaerobic
Feed1000 1000 0 2000 1:1
Mixed,
Aerated 0 48 0.00 0.00 89 39 59 58 -11.00 38.50 -9.50
1:2 Anaerobic
Feed1333 666 0 1999 1:2
Mixed,
Aerated 0 64 0.00 0.00 101 43 59 56 5.48 39.83 7.81
2:1 Anaerobic
Feed w/ Seed666 1333 9 2008 2:1
Mixed,
Aerated 27 32 0.42 1.64 86 39 57 62 -24.91 34.50 -29.53
1:1 Anaerobic
Feed w/ Seed1000 1000 10 2010 1:1
Mixed,
Aerated 30 48 0.62 1.07 89 39 53 68 -5.13 28.50 -19.50
1:2 Anaerobic
Feed w/ Seed1333 666 11 2010 1:2
Mixed,
Aerated 33 64 1.03 0.64 101 43 68 90 -3.52 6.50 -25.52