bioenergy from grain and sugar beet: energy and greenhouse gas
TRANSCRIPT

Bioenergy from grain and sugar beet: Energy and greenhouse gas balances
Final report
Commissioned by the Verband Landwirtschaftliche Biokraftstoffe e.V. (LAB e.V.), Berlin
Heidelberg, 13 August 2008
ifeu - Institute for Energy and Environmental Research Heidelberg GmbH


Bioenergy from grain and sugar beet: Energy and greenhouse gas balances
Commissioned by the Verband Landwirtschaftliche Biokraftstoffe e.V. (LAB e.V.), Berlin
Translation:
Robert Kaplan
(Kern AG, Global Language Services, Nürnberg)
Authors:
Nils Rettenmaier
Dr. Guido Reinhardt
Sven Gärtner
Julia Münch
IFEU – Institute for Energy and Environmental Research Heidelberg GmbH Wilckensstraße 3 D-69120 Heidelberg Tel.: +49 (0)6221 47 67-0; Fax: -19 http://www.ifeu.de
Heidelberg, 13 August 2008

IFEU Heidelberg I
Contents
Summary 1
1 Introduction 4
2 Approach 6
3 Analysed bioenergy paths and scenarios 9
3.1 Selection of the bioenergy paths 9 3.1.1 Bioenergy from triticale 9 3.1.2 Bioenergy from wheat 10 3.1.3 Bioenergy from sugar beet 13
3.2 Considered co-product scenarios 14 3.2.1 Base scenario 14 3.2.2 Expanded scenario 16 3.2.3 All scenarios in an overview 19
3.3 Sensitivity analyses 20
4 Results 22
4.1 Comparisons: Base scenario 22 4.1.1 Bioethanol from sugar beets in detail (Base scenario) 22 4.1.2 Base scenario 23 4.1.3 Sensitivity analyses 26
4.2 Comparisons: Expanded scenario 28 4.2.1 Bioethanol from sugar beets in detail (expanded scenario) 28 4.2.2 Expanded scenario 29 4.2.3 Land use requirements 32
4.3 Convergence of the results 34
4.4 Excursus: Comparison of BtL made from poplar 36
5 Conclusions 38
6 Literature and abbreviations 40
7 Appendix 42
7.1 Considered questions 42
7.2 Sensitivity analyses 44 7.2.1 Bioenergy from grain and sugar beet 44 7.2.2 Bioenergy from triticale whole plants 52
7.3 Comparison of BtL from poplar 53
7.4 Comparisons: Expanded scenarios 54


IFEU Heidelberg 1
Summary
Background and goal of the investigation
Rising prices for agricultural raw materials, increasing land use and utilisation competition along with land use change that is disadvantageous for the climate and the protection of endangered species have pushed the topic of sustainability into the centre of the discussion on bioenergy. As the association of the German bioethanol industry, the LAB e.V., in its desire to confront this discussion, has commissioned the IFEU-Institute for Energy and Environmental Research Heidelberg, to work out the energy and greenhouse gas balances for thirteen selected paths for bioenergy production from grain and sugar beets with various combinations of biofuel and bioenergy production processes (green electricity and green heat).
The main goal of the study is, based on the background of increasing competition for land, to analyse which of the selected bioenergy paths provides the greatest contribution to conserv-ing non-renewable energy resources and to preventing greenhouse gas emissions, thus representing "optimum" land use from these aspects. The selection of the path includes, among others, two established and one innovative process for production of bioethanol, whereas in one production process (established) only sugar beets are used as the raw material, and by contrast in both other production processes (established / innovative) wheat grain and sugar beet are used. The two latter mentioned processes are combined with the intention of the greatest possible usage of the wheat plant with four processes each for bioenergy production from wheat straw. During this, three bioethanol production processes were supplemented by four bioenergy paths using triticale, a grain used as a whole plant.
An additional goal in the frame of this study is to assess how different land use effects, which are associated with co-products from bioethanol production, affect the results. Such land use effects arise because the co-products such as beet pulp, vinasse, thick stillage or DDGS (Distiller's Dried Grains with Solubles) are used instead of conventional fodder such as barley or soy meal and consequently, cultivation areas are not needed for their production. Up to now, this “released” land has been dealt with in life cycle assessments as fallow land, just as in the basis scenario of this investigation. But it can also potentially be used to plant energy crops for additional bioenergy production, considered here in the "expanded" scenarios.
Methodical approach
The energy and greenhouse balances were made for complete life cycles as presently prescribed in, e.g., the life cycle standards DIN 14040 and 14044. During this, the potential environmental impacts of the bioenergy sources across their entire lives ― from biomass cultivation through processing into biofuels and biomass fuel up through their energetic utilisation ― were considered and compared with those of conventional sources. During biomass processing, co-products generally accrue that substitute conventional products with the same utilisation. As during production environmental impacts would also have arisen, these prevented environmental impacts are credited to the bioenergy sources.
2 IFEU Heidelberg
Results and conclusions
The investigation shows that the thirteen analysed bioenergy paths when compared with conventional energy production can conserve non-renewable energy sources and contribute to climate protection in all scenarios and under all boundary conditions.
• The findings from the three investigated bioethanol production processes, i.e. bioethanol production plus energetic utilisation of wheat straw when applicable are comparable in the basis scenario with those of the bioenergy production from triticale. That indicates that there are several opportunities for "optimal" land utilisation from the point of view of resource conservation and climate protection and that none of the investigated bioenergy paths proves genuine advantages. Thus per hectare and year, between 36 and 110 GJ non-renewable primary energy and between 3.8 and 8.1 t CO2 equivalents can be saved. In acreage 1000 ha correspond to the annual primary energy consumption of 220 – 670 German citizens and of the greenhouse gas emissions of 330 – 690 German citizens per year.
• The analysis furthermore shows that many of the paths can be optimised, among others in the areas of energy crop cultivation and biomass conversion. For example, the process energy could also be provided by renewable raw materials such as straw or short-rotation wood. In addition, the end product can have decisive effects on the results: an investiga-tion into processing ethanol to the fuel additive ethyl tertiary butyl ether (ETBE), as part of a sensitivity analysis, always leads to the best balance results by far. Despite the regula-tory limitations of ETBE, its potential should be completely exhausted before replacing gasoline by ethanol.
• Inclusion of land use effects that are associated with the co-products from bioethanol production used as fodder can have significant affects on the results of the energy and greenhouse gas balances:
• Even just considering the expanded scenarios selected here as examples for additional bioenergy production on land that is no longer needed for fodder production, five times more energy and four times more greenhouse gases can be saved as in the basis sce-nario.
• In the expanded scenario all investigated bioethanol production processes from wheat and sugar beets turn out significantly better than the bioenergy production from triticale or even BtL from poplar short-rotation wood, whereas the bioethanol production from sugar beet tends to deliver the best results. The innovative process for producing bio-ethanol from wheat grains and sugar beets („Wheat I“ process) also leads to very ad-vantageous results, but here markedly more land is needed than the one hectare of fal-low land that was provided. Thus, on the whole, the so-called 2nd generation biofuels such as BtL (Biomass-to-Liquid) or lignocellulosic ethanol (LCF-ethanol) do not have any system-inherent advantages compared with conventional biofuels such as bio-ethanol from sugar beets or wheat.
For one, this shows that bioenergy paths with co-products, which affect land use, preserve more non-renewable energy resources under certain boundary conditions than previously assumed and can prevent greenhouse gas emissions. For another, this shows however that the bioenergy scenarios to be considered in life cycle assessments have to be selected with great care and that corresponding questions need to be formulated in detail. Also, the results

IFEU Heidelberg 3
are only applicable in the context of the frame of the investigation. In this respect, this study is very helpful for further discussion about life cycle assessments regarding bioenergy in general and specifically regarding biofuels.
Restrictions
The results and conclusions only apply to the thirteen considered paths for bioenergy pro-duction; when other bioethanol processes or additional bioenergy paths such as biodiesel from rape or biogas from maize are considered, they could turn out considerably differently. Still, the qualitative findings gained here can be viewed as being very robust, while the quantitative findings are to a large extent dependent on the above-mentioned land use effects and the selected co-product substitutes. Likewise, the results and conclusions for the energy and greenhouse balances cannot be transferred to other environmental impacts such as acidification, nutrient input or summer smog. These have to be investigated additionally in the frame of an integral environmental assessment.

4 IFEU Heidelberg
1 Introduction
Background and conceptual interests
In the recent past, climate protection has advanced to one of the most important environmental topics on national, European and international levels. The current progress report from the Intergovernmental Panel on Climate Change (IPCC) greatly contributed to this; accordingly, a restriction of the increase in the global mean temperature can only be achieved by significantly reducing the greenhouse gas emissions.
At the European level, climate protection – along with increasing availability and creating jobs, for instance in rural areas – was the main motivation to promote substituting fossil energies with renewable ones. It is intended to raise their proportion on primary energy consumption to 20% by 2020. The German government made this goal concrete in a decla-ration in April 2007 by specifying objectives for the proportion of renewable energies in the heating, transport and electricity sectors. Among the renewable energies, biomass, with a current proportion of about 70%, takes on the greatest significance.
The biomass utilisation however, due to the limited potentials for biogenous waste products and renewable raw material, cannot simply be expanded at will, especially as the agricultural areas to cultivate renewable raw materials are limited. Even today, biomass cultivation is competing with other land usages such as food and fodder production, and even with nature conservation. Likewise, bioenergy production is competing with other biomass usages such as the utilisation of the material itself.
Furthermore, the biomasses – and the associated land areas – are being used rather less than ideally due to sector-specific political objectives and the general conditions put in place to meet them: The use is not efficient, neither from ecological (greatest possible contribution to climate protection) nor from commercial perspectives (cost-effective reduction of green-house gas emissions). That is what emerges from the scientific studies made during recent years which with the aid of life cycle assessments for example examined the greenhouse gas reduction potential of numerous bioenergy paths.
Against this background, the LAB e.V. commissioned the Institute for Energy and Environ-mental Research Heidelberg (IFEU) to prepare energy and greenhouse balances for some selected paths of bioenergy production from grain and sugar beets.
Goal of the investigation
The goal of the study is a clear definition of the energy and greenhouse gas savings poten-tials for various paths of bioenergy production from grain and sugar beets, each in compari-son to conventional energy production from fossil energy sources. During the study, which was especially intended to increase the client's knowledge, among others three production processes of ethanol from wheat grain and / or sugar beets were examined. Both wheat grain processes were each combined with four variants of straw usage. Together with ethanol production from sugar beets and four variants of bioenergy production from triticale whole plants, a total of thirteen paths results.

IFEU Heidelberg 5
The following points are to be specifically analysed:
• which paths for bioenergy production from grain and sugar beets, with regard to their land-related potential for saving fossil energy sources and to prevent greenhouse gas emissions, are especially advantageous and thus produce "optimal" land utilisation under these aspects,
• how these paths fare in comparison to BtL production (Biomass-to-Liquid) from fast growing woods (here: poplar short-rotation wood),
• which processes in the individual bioenergy paths are especially result-relevant, providing potential opportunities for ecological optimisation and
• how the different land use effects, which are associated with co-products from bioethanol production, affect the results of the energy and greenhouse gas balances.
Basic approach
The investigation will be carried out based on the approach used in life cycle assessments, which will be described in detail in Chapter 2. Based on this approach, the entire life cycles of the bioenergy sources - from biomass cultivation through processing to biofuels or biomass fuel and up to their energetic use in comparison to fossil energy sources - are to be consid-ered. An example of such a simplified life-cycle comparison is shown in Fig. 1-1.
Sugar beet cultivation
Ethanol production
Transport
Crude oilproduction
Refining
Transport
BioethanolGasoline
Use in carsUse in cars
Sugar beets
Fig. 1-1 Simplified schematic life-cycle comparison between fossil gasoline and bioetha-
nol made from sugar beets
A series of co-products (not shown here) also arise along these life-cycles. These bioenergy paths and co-product scenarios analysed during this study are explained in the following chapter (Chapter 3). Subsequently, in Chapter 4, the results for the thirteen selected bio-energy paths are presented, interpreted and the subsequent conclusions are derived in Chapter 5.

6 IFEU Heidelberg
2 Approach
The energy and greenhouse gas balances were made in accordance with the approach in product life cycle assessments according to DIN 14040 and 14044. Based on the type of interest in the insights, only screening balances were created that were not (as prescribed in the standards) externally reviewed, but which can still be considered as very meaningful due to the close conformity to the standards.
In the following, the main details about the basic approach are illustrated, general stipulations and the analysed environmental impacts are described and the derivation of the base data is documented. Please refer to the stated literature for details.
Methodical approach
The procedure for writing a product life cycle assessment is regulated in the DIN standards 14040 and 14044. Special consideration is given to
• the input and output flows (raw and other materials, energy and wastes, wastewater, emissions, etc.) and
• potential environmental impacts (e. g. greenhouse effect, acidification) of the considered product system (product or service)
• along its entire life cycle („cradle-to-grave“, from raw material provision up to disposal).
With that, the product life cycle assessments provide comprehensive information on the ecological impacts for individual production levels as well as on the entire life cycle of prod-ucts and services. Sensitivity analyses are especially used to derive optimisation potentials and to interpret information for decision-making processes.
General specifications
Creating the energy and greenhouse gas balances is mostly oriented on standards for environmental life cycle assessment /DIN 14040 & 14044/. The main stipulations in this study are:
• Functional unit: As a specific product volume or service needed to create the considered product benefits (= functional unit), the product benefits are selected that result from utili-sation of a renewable raw material or waste material from one hectare of land in an aver-age year.
• Geographical and time-related coverage: The referenced area for producing and using the bioenergy sources is initially the Federal Republic of Germany / Central Europe. Starting there, it is correspondingly expanded for raw materials from other countries (e. g. imported soy meal or even crude oil). The reference time period is about 2020 in the as-sumption that the processes for producing biofuels of the so-called 2nd generation such as BtL (Biomass-to-Liquid) and lignocellulosic ethanol will only then be technically ma-ture. Details about the referenced area and time period can be found in /Borken et al. 1999/.
• System boundaries: Fundamentally, the system expansion process is preferred to allocation (for more details see /Borken et al. 1999/). The environmental impacts of the

IFEU Heidelberg 7
entire product system must also be proportionally assigned to the co-products such as beet pulp or vinasse. That is done by balancing with equivalent process during which credits for prevented equivalent processes and their environmental impacts are given, e. g. for the prevented, conventional fodder production from barley or soy meal.
• Depth of detail: All material and energetic inputs and outputs along with the potential environmental impacts of the considered product systems are balanced along the entire life cycle. Merely the infrastructure (building conversion plants, vehicles and traffic routes) is not taken into consideration.
Analysed environmental impacts
The environmental impacts "energy savings" and "greenhouse effect" balanced here are described in Table 2-1. In Table 2-2, the category indicators, life cycle inventory parameters and the characterization factors for the individual environmental impacts are compiled for these effects.
Table 2-1 Examined environmental impacts
Environmental impact
Description
Energy savings Energy consumption and savings are subcategories of the resource require-ments. The non-renewable energy sources, crude oil, natural gas and coal along with uranium ore are presented. As bioenergy sources generally contrib-ute to resource conservation, for the sake of simplified formulation this environ-mental impact is designated in the following with "energy savings".
Greenhouse effect Global warming as a result of the release of climatic-active gases. Here only the anthropogenic greenhouse effect is considered. Along with carbon dioxide (CO2), a series of additional trace gases such as methane (CH4) and laughing gas (dinitrous oxide, N2O) are covered. As these climate gases contribute to the greenhouse effect in varying degrees, their greenhouse potential is converted into carbon dioxide equivalents (CO2 equivalents) using equivalence factors.
Table 2-2 Category indicators, life cycle inventory parameters and characterization factors for the examined environmental impacts
Environmental impact Category indicator Life cycle inventory
parameter Formula Characterizationfactor
Energy savings
Cumulated primary energy expenditure from non-renewable sources in GJ
crude oil Natural gas Hard coal Lignite Uranium ore
– –
Greenhouse effect CO2 equivalent
Carbon dioxide Laughing gas (dinitrous oxide) Methane fossil* Methane biogenous**
CO2 N2O CH4 CH4
1 298
27,75 25
* incl. CO2 effect after CH4 oxidation in the atmosphere ** without CO2 effect after CH4 oxidation in the atmosphere

8 IFEU Heidelberg
Base data
The base data used come from different sources and can be subdivided into these catego-ries:
• Data on provision of biomass and fossil energy sources (including the resources and operating materials needed for that), on their energetic utilisation, transport processes and on provision and usage of equivalent products.
• Data on conversion of triticale and wheat straw to BtL (thermochemical process), to lignocellulosic ethanol (innovative fermentation), to electricity or to electricity plus heat (direct thermal utilisation)
• Data on converting cereal grain and sugar beet to ethanol (conventional fermentation) and on the feed value of the co-products accruing during this.
The data in the first two categories are mostly taken from the internal IFEU database. They were worked out, validated and updated during the years for diverse IFEU life cycle assess-ment studies (/Kaltschmitt & Reinhardt 1997/, /Fritsche et al. 2004/, /Reinhardt et al. 2006/, /Reinhardt et al. 2007/ and /Bringezu et al. 2008/) and are generally acknowledged. It is only for fertilizer use during sugar beet cultivation that the data from /efma 2007/ are fallen back on. The data for provision and use of fossil energy sources come from /ecoinvent 2007/ und /GEMIS 2006/.
The data for the third category were provided by Südzucker AG (/Südzucker 2007-08/) and checked by IFEU for their completeness and consistency. At the request of the client, natural gas was uniformly applied as the energy source for all conversion processes in order to facilitate a technological comparison. The protein animal feeding stuffs vinasse, thick stillage and DDGS (Distiller’s Dried Grains with Solubles), which arise from the various processes, were assessed on the basis of the usable proteins (nXP) (/CropEnergies 2007/, /Weber 2007/ and /DLG 1997/), the concentrated feed beet pulp on the basis of the net energy lactation (NEL) (KTBL 2005).
Result display
In the result charts, each of the differences between the balance from expenditures and credits of bioenergy utilisation and the credits from the substituted fossil energy sources are illustrated and – oriented on the needs of a "speed" reader – are briefly discussed. The graphic display is made in the unit normally used for each environmental impact.
When describing the environmental impacts (see e.g. Table 2-1) and the results, easily comprehended terms are given precedence over scientifically exact portrayal, for example "energy savings" instead of „resource requirements from non-renewable energy sources on the basis of the cumulated primary energy expenditure“.
IFEU Heidelberg 9
3 Analysed bioenergy paths and scenarios
In this chapter, the considered bioenergy paths (life cycles) and scenarios for assessing the co-products are described in detail.
3.1 Selection of the bioenergy paths
In the following, the life cycles of three renewable raw products triticale, wheat and sugar beet including the use of the co-products, processing and the type of energetic utilisation of the biomass are presented. At this point, it is pointed out that the applied substitutions and equivalence processes in one scenario are one of many which, while possibly realistic, do not necessarily reflect the future developments in reality because of uncertainties.
3.1.1 Bioenergy from triticale
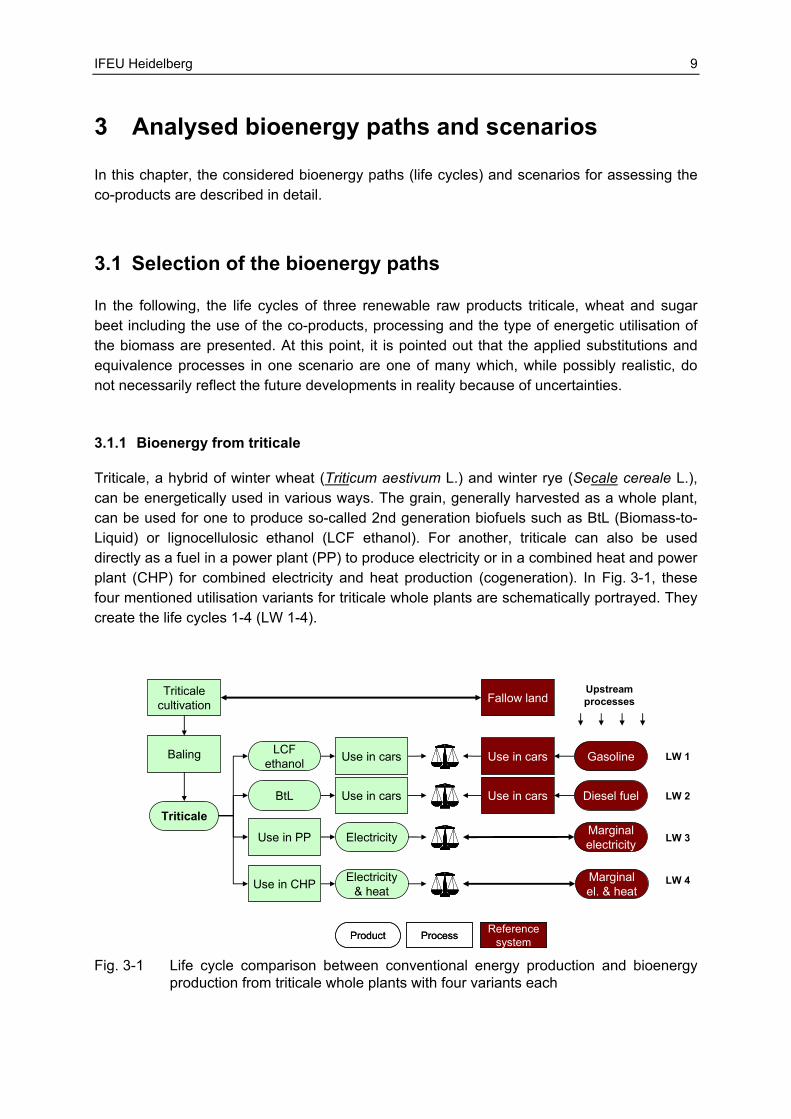
Triticale, a hybrid of winter wheat (Triticum aestivum L.) and winter rye (Secale cereale L.), can be energetically used in various ways. The grain, generally harvested as a whole plant, can be used for one to produce so-called 2nd generation biofuels such as BtL (Biomass-to-Liquid) or lignocellulosic ethanol (LCF ethanol). For another, triticale can also be used directly as a fuel in a power plant (PP) to produce electricity or in a combined heat and power plant (CHP) for combined electricity and heat production (cogeneration). In Fig. 3-1, these four mentioned utilisation variants for triticale whole plants are schematically portrayed. They create the life cycles 1-4 (LW 1-4).
Triticale
cultivation
Baling
Triticale
Use in cars
Use in cars
Use in cars
Use in cars
Gasoline
Diesel fuel
LCF ethanol
BtL
LW 1
LW 2
LW 3
LW 4Electricity & heat
Electricity
Fallow land
Use in PP
Use in CHP Marginal el. & heat
Marginal electricity
Product Process Reference systemProduct Process Reference system
Upstream processes
Fig. 3-1 Life cycle comparison between conventional energy production and bioenergy
production from triticale whole plants with four variants each

10 IFEU Heidelberg
3.1.2 Bioenergy from wheat
When harvesting wheat, the grain is usually separated from the straw. Ethanol, for example, can be produced from the starch-containing grain. As a conventional process is used here, one refers to this ethanol as a 1st generation biofuel. The straw can be energetically used in various ways, both in the 2nd generation biofuel sector as well as in the electricity and/or heat sector.
In the following, first two processes for ethanol production from wheat grain („Wheat I“ and „Wheat II“) are described in more detail. In both processes, on top of the wheat grain, thick juice from sugar beets is additionally used; i.e. this is actually ethanol from wheat grain and sugar beets. Subsequently, four options for energetic utilisation of wheat straw are pre-sented.
Bioethanol from wheat grain: Wheat I
In this process, the biomass input consists of 72 wt% wheat and 28 wt% sugar beet. One of the particularities of this process is the energy production from bran and the separation of the gluten, which will be used as foodstuffs and replaces conventional wheat gluten here. The beet pulp from the thick juice production is dried, pelletized and sold as dried pulp, which means conventional concentrated feed (e. g. barley) is substituted. The thin stillage accruing during ethanol production is evaporated into thick stillage and substitutes conventional soy meal as protein fodder here. All co-products and the related equivalent products are shown in Fig. 3-2.
Wheat cultivation
Crude oilproduction
Refining
Transport
BioethanolGasoline
Use in cars
TransportTransport
Use in cars
Sugar beet cultivation
Thick juice
Ethanol production
Straw* Grain
Transport
Gluten
Thick stillage
Electricity
Carbona-tation lime
Dried pulp
Beet soil
Agricultural limestone
Concentra-ted fodder
Wheat gluten
Marginal electricity
Soy meal
Fodder
Fertiliser
Fodder
Food
Fallow land
Manure
*LW 5: Straw to LCF-EtOHLW 6: Straw to BtLLW 7: Straw to electricityLW 8: Straw to cogeneration
Product Process Reference system
Fertiliser
Thick juice production
Sugarbeets
Fig. 3-2 Life cycle comparison between gasoline and bioethanol produced using the
„Wheat I“ process.
IFEU Heidelberg 11
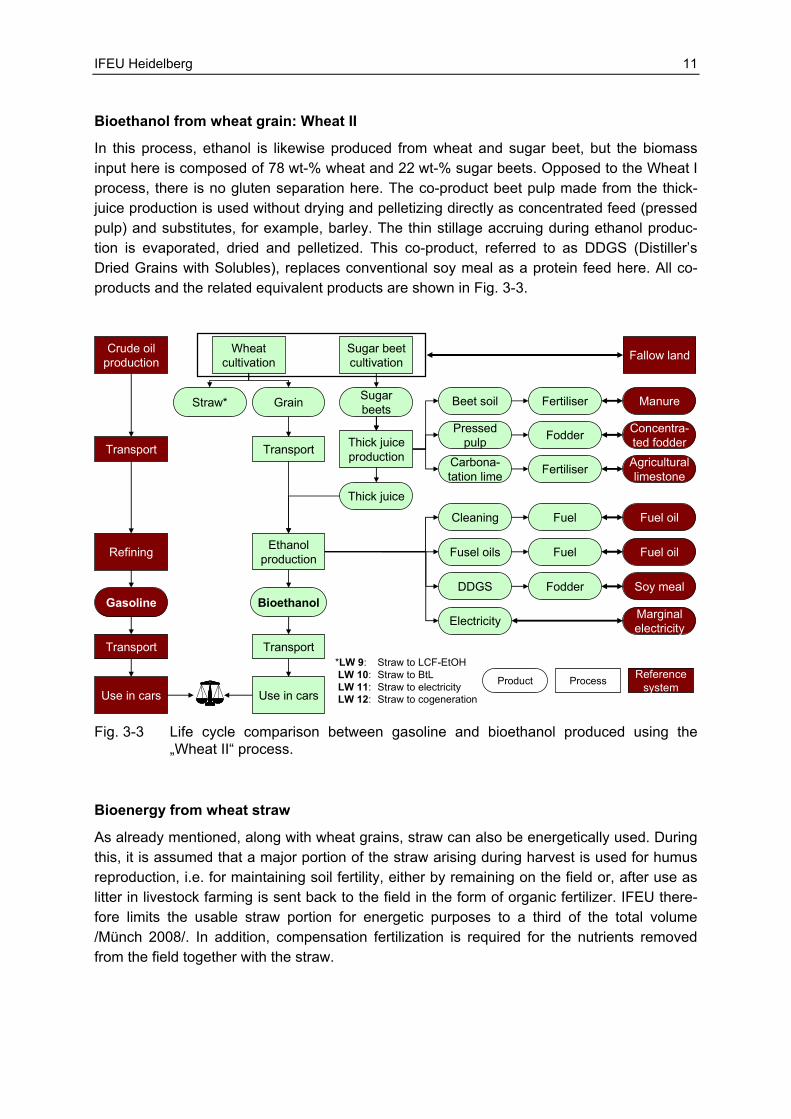
Bioethanol from wheat grain: Wheat II
In this process, ethanol is likewise produced from wheat and sugar beet, but the biomass input here is composed of 78 wt-% wheat and 22 wt-% sugar beets. Opposed to the Wheat I process, there is no gluten separation here. The co-product beet pulp made from the thick-juice production is used without drying and pelletizing directly as concentrated feed (pressed pulp) and substitutes, for example, barley. The thin stillage accruing during ethanol produc-tion is evaporated, dried and pelletized. This co-product, referred to as DDGS (Distiller’s Dried Grains with Solubles), replaces conventional soy meal as a protein feed here. All co-products and the related equivalent products are shown in Fig. 3-3.
Cleaning
Wheat cultivation
Crude oilproduction
Refining
Transport
BioethanolGasoline
Use in cars
TransportTransport
Use in cars
Sugar beet cultivation
Thick juice
Ethanol production
Straw* Grain
Transport
Fusel oils
DDGS
Electricity
Carbona-tation lime
Pressed pulp
Beet soil
Agricultural limestone
Concentra-ted fodder
Fuel oil
Marginal electricity
Soy meal
Fodder
Fertiliser
Fodder
Fuel
Fallow land
Manure
*LW 9: Straw to LCF-EtOHLW 10: Straw to BtLLW 11: Straw to electricityLW 12: Straw to cogeneration
Product Process Reference system
Fertiliser
Thick juice production
Sugarbeets
Fuel oilFuel
Fig. 3-3 Life cycle comparison between gasoline and bioethanol produced using the
„Wheat II“ process.
Bioenergy from wheat straw
As already mentioned, along with wheat grains, straw can also be energetically used. During this, it is assumed that a major portion of the straw arising during harvest is used for humus reproduction, i.e. for maintaining soil fertility, either by remaining on the field or, after use as litter in livestock farming is sent back to the field in the form of organic fertilizer. IFEU there-fore limits the usable straw portion for energetic purposes to a third of the total volume /Münch 2008/. In addition, compensation fertilization is required for the nutrients removed from the field together with the straw.

12 IFEU Heidelberg
In Fig. 3-4, four options for utilisation of wheat straw are schematically portrayed; here, the same utilisation variants are applied as for triticale: LCF ethanol (lignocellulosic ethanol), BtL (Biomass-to-Liquid), electricity and electricity plus heat (cogeneration).
Harvest of surplus straw
Baling
Straw
Use in cars
Use in cars
Use in cars
Use in cars
Gasoline
Diesel fuel
LCF ethanol
BtL
LW 1
LW 2
LW 3
LW 4Electricity & heat
Electricity
Field disposal
Use in PP
Use in CHP Marginal el. & heat
Marginal electricity
Product Process Reference system
Compensat. fertilisation
Upstream processes
Fig. 3-4 Life cycle comparison between conventional energy production and bioenergy
production from usable straw with four variants each
Bioenergy from wheat
The life cycles 5-8 (Wheat I) and 9-12 (Wheat II) result from the combination of both proc-esses for ethanol production from wheat grains with these four straw usages. Table 3-1 clearly lists these life cycles.
Table 3-1 Overview of the combination possibilities resulting from the separate usage of wheat grain and straw (life cycles 5-8 and 9-12)
No. Life cycle Wheat I: Combined usage of grain and straw
Grain Straw 5 Ethanol production LCF-ethanol production 6 “ BtL production 7 “ Electricity production 8 “ Electricity and heat production
(cogeneration plant) Wheat II: Combined usage of grain and straw
Grain Straw 9 Ethanol production LCF-ethanol production
10 “ BtL production 11 “ Electricity production 12 “ Electricity and heat production
(cogeneration plant)
IFEU Heidelberg 13
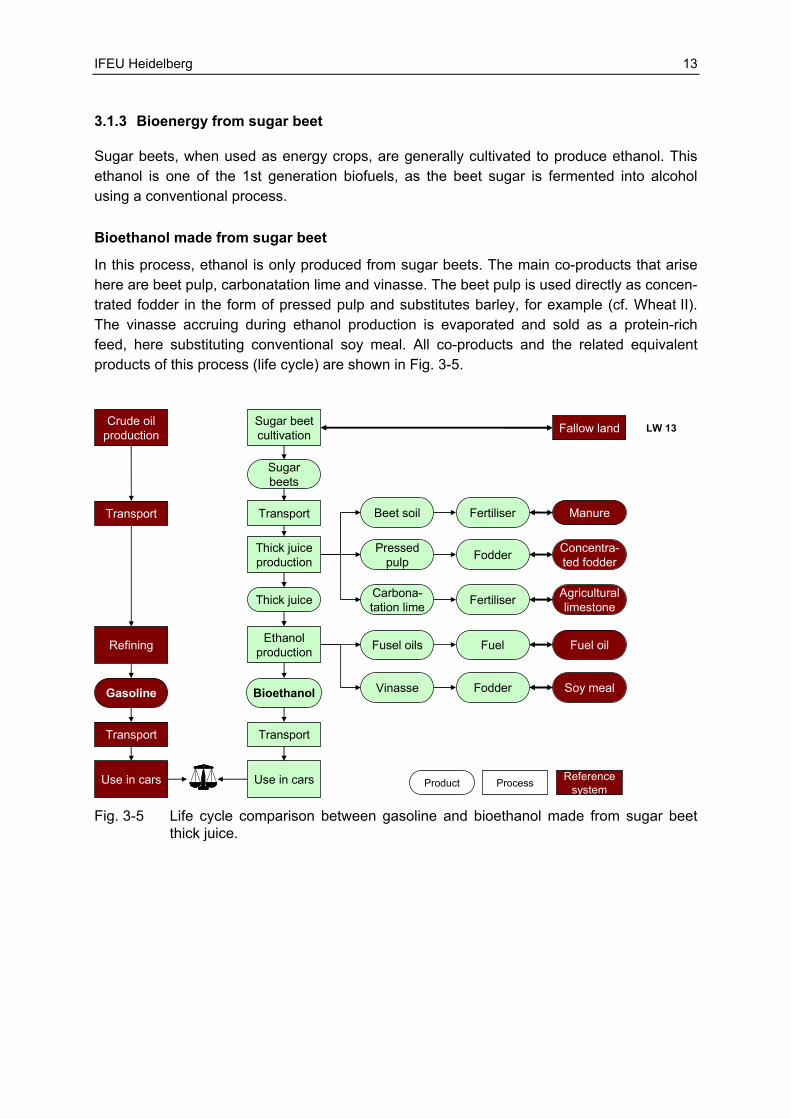
3.1.3 Bioenergy from sugar beet
Sugar beets, when used as energy crops, are generally cultivated to produce ethanol. This ethanol is one of the 1st generation biofuels, as the beet sugar is fermented into alcohol using a conventional process.
Bioethanol made from sugar beet
In this process, ethanol is only produced from sugar beets. The main co-products that arise here are beet pulp, carbonatation lime and vinasse. The beet pulp is used directly as concen-trated fodder in the form of pressed pulp and substitutes barley, for example (cf. Wheat II). The vinasse accruing during ethanol production is evaporated and sold as a protein-rich feed, here substituting conventional soy meal. All co-products and the related equivalent products of this process (life cycle) are shown in Fig. 3-5.
Sugar beet cultivation
Ethanol production
Transport
Crude oilproduction
Refining
Transport
BioethanolGasoline
Use in cars
TransportTransport
Use in cars
Beet soil
Pressed pulp
Carbona-tation lime
Fusel oils
Vinasse
Agricultural limestone
Concentra-ted fodder
Fuel oil
Soy mealFodder
Fodder
Fertiliser
Fuel
Fallow land
Manure
LW 13
Thick juice production
Thick juice
Fertiliser
Product Process Reference system
Sugar beets
Fig. 3-5 Life cycle comparison between gasoline and bioethanol made from sugar beet
thick juice.

14 IFEU Heidelberg
3.2 Considered co-product scenarios
The goal of the study, among other things, is to find out which bioenergy paths for bioenergy production from grain and sugar beets, with regard to their land-related potential for saving fossil energy sources and to prevent greenhouse gas emissions, are especially advanta-geous and thus produce "optimal" land utilisation under these aspects.
The basis for all investigated scenarios is the hypothesis that land required for growing the energy crops (in this study: grain and sugar beets) is available, as currently it is not or in the future will not (no longer) be needed for cultivation of food and fodder or renewable raw materials for material use. If this land would not be used to cultivate energy crops, it would remain unused, i.e. fallow land.
How much land will be available in the future, e.g. for energetic purposes, depends – apart from political decisions such as the EU Reform of the CMO Sugar – decisively on technical and breeding progress in agriculture (state of the art and yield increases), the population development and the development of per capita food consumption. As the published studies on land available in the future greatly differ from one another, the results of this study all refer to one hectare of land.
In the following, a basis scenario (a) and expanded scenario with two variants (b / c) are explained which differ as to how to deal with the land that "becomes free" through co-product production. This means land, that is no longer needed in Germany/Central Europe or even, for example, Brazil, to cultivate animal fodder such as barley or soy beans, as these can be substituted through co-products from ethanol production such as beet pulp, vinasse, thick stillage or DDGS.
3.2.1 Base scenario
In the base scenario, one assumes that land that becomes free due to the co-products accruing during ethanol production remain unused i.e., if demand remains the same will no longer need to be cultivated with conventional food or fodder and will therefore become fallow land. The agricultural reference system in this case is also fallow.
Fig. 3-6 exemplarily depicts this for ethanol production from sugar beets. The yellow high-lighted part of the figure shows the life cycle already known from Fig. 3-5 in a simplified form and only includes the "land-freeing" co-products pressed pulp and vinasse. This fodder replaces barley and soy meal, which now no longer need to be cultivated.
The grey highlighted part of the figure depicts the alternative use of this land: In the base scenario, this is fallow. In the case of soy beans, there is a particularity: As through the omission of cultivation, the previously produced soy oil along with the soy meal will no longer be produced, it has to be replaced with an equivalent product. For this study, a substitution through crude oil based technical oil is applied (not shown here).

IFEU Heidelberg 15
Thick juiceproduction
Pressedpulp
Vinasse Soymeal
Sugar beetcultivation
Soybeancultivation Fallow landEtOH
production
Fallow land
Ethanol Gasoline
Barley Barleycultivation Fallow land
Fig. 3-6 Alternative land use in the "Fallow land" base scenario. Depiction for ethanol
made from sugar beet (life cycle 13a)
The corresponding representation for ethanol production from wheat can be found in the Appendix (Fig. 7-1). In the Wheat I process, an additional, land freeing co-product emerges: gluten. This replaces conventional wheat gluten, for which wheat no longer needs to be cultivated. Here also, the reference system is fallow land. As, however, due to the omission of wheat cultivation, along with the wheat gluten the previously produced wheat starch is also no longer produced so it needs to be substituted with an equivalent product. This is done using potato starch, the production of which carries along additional land requirements for cultivation the potatoes (see Fig. 7-1).
Table 3-2 shows the co-products for all 13 life cycles that free up land, their equivalent products and the alternative land use of the land that is freed up. In base scenario (a), fallow is applied as the agricultural reference system (alternative land utilisation).
Table 3-2 Alternative land utilisation in the "fallow land" base scenario (a).
LW no. Raw material
Co-product Equivalent product
Alternative land utilisation
1-4 Triticale – – – 5a-8a Wheat I Dried pulp Barley Fallow Gluten Wheat gluten Fallow / Potatoes Thick stillage Soy meal Fallow 9a-12a Wheat II Pressed pulp Barley Fallow DDGS Soy meal Fallow 13a Sugar beets Pressed pulp Barley Fallow Vinasse Soy meal Fallow
When using triticale for energy, no co-products that free-up land arise, so that here also, the base scenario does not differ from the expanded scenario described below.

16 IFEU Heidelberg
3.2.2 Expanded scenario
As the land available in Germany and throughout Europe is limited and utilisation competition rages between food and fodder production, nature preservation, cultivation of energy crops and cultivation of renewable raw materials for material use, (see also /Oertel 2007/), an "expanded scenario" is analysed which assumes that the land becoming free no longer – as applied in the base scenario – becomes fallow, but will be used for cultivation of energy crops for ethanol production.
In the following, these alternative land utilisation for two scenarios is presented that differen-tiate in the selection of the equivalent product for the co-product beet pulp: In one case, the beet pulp substitutes conventional concentrated fodder made from barley (b), in the other case it substitutes beet pulp from sugar production (c). At this point, it is once more pointed out that the applied substitutions and equivalence processes in one scenario are one of many which, while possibly realistic, do not necessarily reflect future reality.
Concentrated fodder: Barley
For the ethanol production from sugar beets, Fig. 3-7 in turn exemplarily illustrates how the land that is freed-up through the co-products pressed pulp and vinasse can be used in the expanded "Barley" scenario.
Instead of the no longer required barley, sugar beet is cultivated for ethanol production. In turn, during this, pressed pulp accrues, which replaces barley. Again, on the land freed-up through this, sugar beets for ethanol production are cultivated, etc. This series expansion is continued up to a change of less than 1%.
Instead of the no longer required soy beans, sugar cane is cultivated for ethanol production. The ethanol production is energy self-sufficient due to the use of bagasse. The soy oil previously produced is, just as in the base scenario, substituted by crude oil-based technical oil (not shown).
Thick juiceproduction
Pressedpulp
Vinasse Soymeal
Sugar beetcultivation
Soybeancultivation
Sugar canecultivation
CaneEtOH
EtOHproduction
Fallow land
Ethanol Gasoline
Barley Barleycultivation
Beetcultivation
BeetEtOH Gasoline
Gasoline
Thick juiceproduction
Pressedpulp
Vinasse Soymeal
Sugar beetcultivation
Soybeancultivation
Sugar canecultivation
CaneEtOH
EtOHproduction
Fallow land
Ethanol Gasoline
Barley Barleycultivation
Beetcultivation
BeetEtOH Gasoline
Gasoline
Fig. 3-7 Alternative land use in the expanded "Barley" scenario. Depiction for ethanol
made from sugar beet (life cycle 13b)

IFEU Heidelberg 17
The corresponding representation for ethanol production from wheat can be found in the Appendix (Fig. 7-2). In the Wheat I process, with gluten a land freeing co-product emerges: Through that, no more wheat needs to be cultivated for wheat gluten; instead, it can be used for ethanol production using the same process. As during this gluten accrues in turn, here also a series expansion emerges that is continued up to a change of less than 1%. The wheat starch likewise produced up to now is, just as in the base scenario, replaced by potato starch, the production of which in turn carries along additional land needs for cultivation of potatoes.
Table 3-3 shows the co-products for all 13 life cycles that free up land areas, their equivalent products and the alternative land use of the land that is freed up.
Table 3-3 Alternative land area use for the expanded "Barley" scenario (b)
LW no. Raw material
Co-product Equivalent product
Alt. land use Equivalent product
1-4 Triticale – – – – 5b-8b Wheat I Dried pulp Barley Sugar beets Ethanol Gasoline Gluten Wheat gluten Wheat Ethanol Gasoline Thick stillage Soy meal Sugar cane Ethanol Gasoline 9b-12b Wheat II Pressed pulp Barley Sugar beets Ethanol Gasoline DDGS Soy meal Sugar cane Ethanol Gasoline 13b Sugar beets Pressed pulp Barley Sugar beets Ethanol Gasoline Vinasse Soy meal Sugar cane Ethanol Gasoline
Concentrated fodder: Beet pulp from sugar production
Fig. 3-8 in turn exemplarily illustrates for ethanol production from sugar beets how the land that is freed-up due to the co-products pressed pulp and vinasse can be used in the ex-panded "Beet pulp" scenario.
Sugar beetcultivation Fallow land
Thick juiceproduction
Pressedpulp
Pressedpulp
Beetcultivation
Canesugar
Sugar canecultivation
Sugar canecultivation
CaneEtOH GasolineBeet
sugar
Vinasse Soymeal
Soybeancultivation
Sugar canecultivation
EtOHproduction
Ethanol Gasoline
CaneEtOH Gasoline
Fallow land
Sugar beetcultivation Fallow land
Thick juiceproduction
Pressedpulp
Pressedpulp
Beetcultivation
Canesugar
Sugar canecultivation
Sugar canecultivation
CaneEtOH GasolineBeet
sugar
Vinasse Soymeal
Soybeancultivation
Sugar canecultivation
EtOHproduction
Ethanol Gasoline
CaneEtOH Gasoline
Fallow land
Fig. 3-8 Alternative land use in the expanded "Beet pulp" scenario. Depiction for ethanol
made from sugar beet (life cycle 13c)

18 IFEU Heidelberg
The pressed pulp from ethanol production substitutes pressed pulp from sugar production. The discontinuation of this sugar production frees up land that becomes fallow. As opposed to the "Barley" scenario, sugar beet for ethanol production is not cultivated on those areas, as the accruing pressed pulp in turn substitutes those from sugar production. This chain would continue quasi ad infinitum, i.e., in every step an additional hectare of crop land would be utilised. That means the land that became free in the "Beet pulp" scenario is not used for cultivation of sugar beets for ethanol production.
The sugar produced from sugar beets up to now will be substituted with cane sugar from Brazil, meaning less sugar cane areas are available for ethanol production there. As a consequence, less gasoline can be substituted in Brazil, leading to a "negative credit" for the beet pulp from the thick juice production. Analogue to the "barley" scenario, here also instead of the no longer needed soy beans, sugar cane will now be cultivated for ethanol production. The corresponding scheme for ethanol production from wheat can be found in the Appendix (Fig. 7-3). Here, just as in the "Barley" scenario, ethanol production is applied instead of producing wheat gluten.
Instead of substituting pressed pulp from sugar production with those from ethanol produc-tion, one could also directly compare the sugar beet crops for sugar with those for ethanol because both fallows offset each other in the balance (brown fallow = credit, green fallow = "negative credit"). This would correspond to a situation which might result from the reform of the European CMO Sugar, however with this possible scenario a different set of questions would be taken as a basis.
Table 3-4 shows the co-products for all 13 life cycles that free up land areas, their equivalent products and the alternative use of the land that is freed up.
Table 3-4 Alternative land use for the expanded "Beet pulp" scenario (c)
LW no. Raw material
Co-product Equivalent product
Alt. land use Equivalent product
1-4 Triticale – – – – 5c-8c Wheat I Dried pulp beet pulp Sugar cane Gasoline Gluten Wheat gluten Wheat Ethanol Gasoline Thick stillage Soy meal Sugar cane Ethanol Gasoline 9c-12c Wheat II Pressed pulp beet pulp fallow / Sugar cane Gasoline DDGS Soy meal Sugar cane Ethanol Gasoline 13c Sugar
beets Pressed pulp beet pulp Sugar cane Gasoline
Vinasse Soy meal Sugar cane Ethanol Gasoline

IFEU Heidelberg 19
3.2.3 All scenarios in an overview
To answer the question, which bioenergy paths depict optimal land use for one hectare of fallow land, in the frame of this study the most realistic possible assessment of the co-products needs to be undertaken and suitable system limits need to be chosen. Due to the uncertainty regarding future developments, the reality can, however, only be portrayed to a certain degree. That is why this is done based on scenarios as documented in the previous sections 3.2.1 and 3.2.2. At the same time, it must be clear that in every case this is only one possible co-product assessment, i.e., each co-product is compared with only one possible equivalent product with a possible usage of the possibly freed land areas. These scenarios thus lead to specific events that can no longer be generalised. The same applies when asking another question which affects possibly the system limits to be chosen, which in turn leads to different results.
In Table 3-5, all combinations from the thirteen considered bioenergy paths (life cycles) and the three scenarios for assessing the co-products are clearly summarised. However, here the respective equivalent products from Table 3-2 to Table 3-4 are not listed. That means overall 31 combinations are considered during which three different scenarios can be selected for the life cycles 5-13, which are based on different co-product assessments. For the lack of co-products that free up land areas, only the "Fallow land" scenario is applicable to life cycles 1-4.
Table 3-5 Overview of the considered life cycles and co-product scenarios
Life cycle Reference system Base scenario a:
"Fallow land" Expansion b:
"Barley" Expansion c: "Beet pulp"
Triticale: use of whole plant LCF ethanol 1 BtL 2 Electricity 3 Electricity and heat 4 Wheat I: Combined use of grain and straw Grain Straw Ethanol LCF ethanol 5a 5b 5c “ BtL 6a 6b 6c “ Electricity 7a 7b 7c “ Electricity and heat 8a 8b 8c Wheat II: Combined use of grain and straw Grain Straw Ethanol LCF ethanol 9a 9b 9c “ BtL 10a 10b 10c “ Electricity 11a 11b 11c “ Electricity and heat 12a 12b 12c Sugar beets Ethanol 13a 13b 13c

20 IFEU Heidelberg
3.3 Sensitivity analyses
Sensitivity analyses are made to analyse the influence of individual parameters on the results of the life cycle comparisons. Below, these analyses for (1) ethanol production from wheat grain and sugar beets, (2) the bioenergy production from triticale and wheat straw and (3) the provision of biomasses are shown.
Sugar beet cultivation
Ethanol production
BioethanolGasoline
Use in cars
TransportTransport
Use in cars
Thick juice production
Thick juice
TransportYield
Efficiency of energy carriers
Energyinput
Motorefficiency
Upstream processes
Product Process Reference system
Fig. 3-9 Sensitivity analyses when using sugar beets and wheat grain for ethanol produc-tion
Three different sensitivity analyses are performed for ethanol production from wheat grain and sugar beets (see Fig. 3-9):
• In combined heat and power plants (cogeneration plants), various fuels can be used. To enable a comparison of technologies, the energy source natural gas was uniformly ap-plied to the calculations. During a sensitivity analysis it is tested how the energy source lignite - unfavourable with regard to climate protection - affects the results.
• The efficiency of the fossil combined heat and power plant (cogeneration plant) is initially set equal - independent of the fuel /Südzucker 2007-08/. However gaseous fuels can generally be converted into energy with a higher efficiency than solid fuels, which means there is less fuel consumption for the same energy requirements. For that reason, in a sensitivity analysis, it is examined how different efficiencies (82% for lignite and 92% for natural gas) affect the results.
• Substituting gasoline with ethanol is normally done in a ratio of 1:1 based on the lower calorific value. The latest scientific studies, however, indicate an increase in the mileage of ethanol-powered vehicles (e. g. /List et al. 2007/ and /Geringer et al. 2008/). For that

IFEU Heidelberg 21
reason, during a sensitivity analysis a 6% higher efficiency during use is applied for ethanol as a means of example (substitution 1:0.94).
Triticale / straw
Use in cars
Use in cars
Use in cars
Use in cars
Gasoline
Diesel fuel
LCF ethanol
BtL
Electricity & heat
ElectricityUse in PP
Use in CHP
Process
Yield
Electricitygeneration
Heatutilisation
Product Process Reference system
Marginal electricity &
heat
Marginal electricity
Fig. 3-10 Sensitivity analyses when using triticale whole plants and wheat straw for ethanol
production
For biofuel and bioenergy production from triticale and wheat straw, three different parameter variations are carried out (see Fig. 3-10):
• During BtL production, there are various processes that have different affects on energy savings and the greenhouse effect. The differences result mainly from the different effi-ciencies and the various plant technologies. Both are varied during a sensitivity analysis.
• Electric power generation from triticale or wheat straw takes place in a biomass power plant in standard cases. In one variation, it is examined how co-combusting biomass in a hard coal power plant can affect the balance results.
• There is often no significant heat utilisation possible in a combined heat and power plant (CHP) as no consumers for the heat can be found. For that reason, a heat utilisa-tion of only 20% is applied. As a variation, it is demonstrated which consequences an 80% heat utilisation has on resource conservation and climate protection.
Yields per hectare are very important when providing biomasses. Through technical and breeding advances in agriculture, it was possible to continually increase them in the past.
• As the time reference (2020) selected for this study lies in the future, the yields are applied accordingly higher. To elucidate the affects of these increased yields, they will be compared to the yields from 2005 and 2010 during the sensitivity analysis.
22 IFEU Heidelberg
4 Results
The results from the energy and greenhouse gas balances for the bioenergy paths and questions discussed in Chapter 3 are presented below. First, the results for the base sce-nario are presented, after that the expanded scenarios are analysed and finally a comparison of all scenarios is undertaken.
4.1 Comparisons: Base scenario
As described in Section 3.2.1, in the base scenario it is assumed that the land that is set free due to the co-products accruing during ethanol production becomes fallow. Then the creation of the results charts are explained in detail based on the example of making ethanol from sugar beets. Subsequently the results for all 13 life cycles are presented. The last section is devoted to the sensitivity analyses and provides information on how the individually varying parameters affect the results.
4.1.1 Bioethanol from sugar beets in detail (Base scenario)
Fig. 4-1 shows the advantages and disadvantages of ethanol from sugar beets as compared with fossil gasoline for the environmental impact “greenhouse effect”, expressed in CO2 equivalents per hectare and year. For that, first the expenditures (right of the origin) and credits (left of the origin) for making ethanol from sugar beets are presented in the first bar. The second bar shows the expenditures for the equivalence product, fossil gasoline. The result balance portrayed underneath that (Balance 13a) is the difference between the bioge-nous and fossil fuels and thus the total result for this life cycle comparison. It states how much CO2 equivalent per hectare and year can be saved by using ethanol from sugar beets instead of gasoline.
Results
• By using ethanol made from sugar beets instead of fossil gasoline, CO2 emissions amount to ca. 8 t CO2 equivalents per hectare and year could be saved.
• The expenditures for the ethanol production from sugar beets result mainly from sugar beet crops and the conversion process. Here, it is especially the use of fossil energy sources during thick juice and ethanol production that contribute to the emissions of greenhouse gases. Consumables such as hydrochloric acid and sulphuric acid on the other hand play a rather minor role here.
• The credits are determined above all by the pressed pulp and the vinasse, which are used as fodder for cattle.

IFEU Heidelberg 23
Greenhouse effect
-15 -10 -5 0 5 10 15 20 25
Sugar beet: Ethanol (fallow)
Gasoline
Sugar beet: Ethanol (fallow)
t CO2 equiv. / (ha*a)
Expenditures →
← Advantage
← Credits
Disadvantage for ethanol →
Balance 13a
Cultivation Transport Thick juice production EtOH production Utilisation
Expenditures: Credits: Rest Pressed pulp Vinasse
Gasoline:ProductionUtilisation
Fig. 4-1 Detailed results from the life cycle comparison between ethanol from sugar beets
and gasoline for the "Fallow land" scenario
Legend for the bar "Sugar beet: Ethanol (fallow land)“ for greenhouse effect:
When producing and using ethanol made from sugar beets, on the one hand ca. 9.5 t CO2 equivalents per hectare and year are emitted, on the other about 2.3 t CO2 equivalents per hectare and year are saved by using the co-products. The expenditures for producing and using gasoline result in emissions of ca. 15 t CO2 equivalents per hectare and year. In the balance, the effect of using ethanol from sugar beets instead of gasoline then results in a reduction of 7.8 t CO2 equivalents per hectare and year.
4.1.2 Base scenario
In this section, the results of all 13 life cycle comparisons for the base scenario are pre-sented. Fig. 4-2 shows the advantages and disadvantages of all bioenergy sources as compared with their respective equivalent products for the environmental impacts of energy savings and greenhouse effects.
The graphic results presentation is then made in the form of balances, which were ascer-tained in the manner described in Section 4.1.1. The last bar in Fig. 4-2, which shows the saved greenhouse gas emissions for ethanol from sugar beets, is therefore identical with the balance from Fig. 4-1 (Balance 13a). The bars for ethanol production from wheat grain based on the Wheat I process are subdivided once more to emphasise the contribution of the gluten (left part of the bar).
Based on this illustration, a series of individual results can be derived, during which various biomass raw materials, conversion processes and target products can be compared regard-ing the energy savings and the greenhouse effect.

24 IFEU Heidelberg
Energy savings-78
-71-87
-90
-38-36
-40
-41
-87
-74
-74-70
-71-109
-107-111
-112
-200 -150 -100 -50 0
Ethanol (EtOH)BtLElectricityElectricity & heat (cogeneration)
Grain: EtOH / Straw: EtOHGrain: EtOH / Straw: BtLGrain: EtOH / Straw: ElectricityGrain: EtOH / Straw: Cogeneration
Grain: EtOH / Straw: EtOHGrain: EtOH / Straw: BtLGrain: EtOH / Straw: ElectricityGrain: EtOH / Straw: Cogeneration
Ethanol
GJ PE / (ha*a)
← Advantage
Triticale
Sugar beet
Wheat I
Wheat II
Greenhouse effect-4.3
-4.7-5.9
-5.8
-3.8-3.9
-4.2
-4.2
-7.8
-5.1
-5.1-4.8
-4.7
-8,1
-8,1-7,8
-7,7
-20 -15 -10 -5 0
Ethanol (EtOH)BtLElectricityElectricity & heat (cogeneration)
Grain: EtOH / Straw: EtOHGrain: EtOH / Straw: BtLGrain: EtOH / Straw: ElectricityGrain: EtOH / Straw: Cogeneration
Grain: EtOH / Straw: EtOHGrain: EtOH / Straw: BtLGrain: EtOH / Straw: ElectricityGrain: EtOH / Straw: Cogeneration
Ethanol
t CO2 equiv. / (ha*a)
← Advantage
Triticale
Sugar beet
Wheat I
Wheat II
Fig. 4-2 Results of all life cycle comparisons for the "Fallow land" base scenario Left
partial bar in Wheat I = credit for gluten; PE = Primary energy
Legend for the first blue bar „Ethanol – Triticale“ for the greenhouse effect:
If ethanol made from triticale whole plants is used instead of gasoline, ca. 4.3 t CO2 equivalents per hectare and year can be saved.

IFEU Heidelberg 25
Results
All life cycle comparisons in the investigated bioenergy sources with their fossil pendants lead to a saving of fossil energy resources and a reduction of greenhouse gas emissions. The amount of the savings or reductions however differentiates significantly. The following individual results can be established:
• Comparison of the raw materials: During ethanol production, the use of wheat with the Wheat I process leads to the highest energy savings, followed by sugar beet and triticale. The same pattern also appears for the greenhouse effect, but here no difference between Wheat I and sugar beets can be established. As the results are highly scenario depend-ent, however, (see poor results from the Wheat II process), no general advantage for sugar and starch plants (sugar beet and wheat) as compared with lignocellulose (triticale) can be derived.
• Comparison of the processes: The comparison of both investigated processes for production of ethanol from wheat grain clearly shows advantages for the process with bran and gluten separation (Wheat I), which, however, are only partially process related and, among others, can be attributed to the energy-intensive drying of stillage to DDGS in the Wheat II process. The much greater portion is scenario dependent: for instance, the origin of the high credit for gluten, its yield is only about 700 kg / (ha*a), results when the production of potato starch (as a substitute for the no-longer produced wheat starch) causes equivalent processes with stock flows in multi-tons, which in the end dominates the balance (see left partial bar). Additional details can be found in Section 3.2.1 and in the Appendix (Fig. 7-1).
• Comparison of the products: Both as well as for triticale and for straw, with stationary use for electricity or electricity and heat production, more energy can be saved and greenhouse gas emissions can be saved than with mobile use in the form of liquid biofu-els. In the energy sector however, with only slight heat utilisation it does not matter whether only electricity or electricity and heat are produced; likewise in the transport sec-tor, where lignocellulosic ethanol and BtL produce similar results.
Summary
The advantages of the bioenergy sources as compared with their fossil pendants can only be partially attributed to the combination of biomass raw materials, conversion processes and target products and are highly dependent on the assumed co-product scenarios and other boundary conditions. As can be seen here based on the applied credit for gluten, individual systems can have extreme ramifications on the results during equivalent process balancing.
Among the circumstances selected here, ethanol production from wheat (according to the Wheat I process) and sugar beets turns out better regarding savings of fossil energy re-sources and preventing greenhouse gas emissions than bioenergy production from triticale. However, to what extent generally applicable verifiable statements can be derived from that must be secured through sensitivity analyses (see following Section 4.1.3), in which varia-tions of the individual boundary conditions are used. Likewise, they need to be discussed against the background of the actual land use (see Section 4.2.3).

26 IFEU Heidelberg
4.1.3 Sensitivity analyses
During the sensitivity analyses (see Chapter 3.3), here individual parameters, i.e., no pa-rameter combinations are varied. This leads to the result bandwidths for the base scenario, which is illustrated in Fig. 4-3 with black bars (without variation of the yield). How they came into being is exhaustively documented in the Appendix (Chapter 7.2).
Energy savings
-264
-400 -300 -200 -100 0
Ethanol (EtOH)BtLElectricityElectricity & heat (cogeneration)
Grain: EtOH / Straw: EtOHGrain: EtOH / Straw: BtLGrain: EtOH / Straw: ElectricityGrain: EtOH / Straw: CogenerationGrain: ETBE / Straw: ETBE
Grain: EtOH / Straw: EtOHGrain: EtOH / Straw: BtLGrain: EtOH / Straw: ElectricityGrain: EtOH / Straw: Cogeneration
Ethanol
GJ PE / (ha*a)
← Advantage
Triticale
Wheat II
Sugar beet
Wheat I
Greenhouse effect
-32.1
-40 -30 -20 -10 0
Ethanol (EtOH)BtLElectricityElectricity & heat (cogeneration)
Grain: EtOH / Straw: EtOHGrain: EtOH / Straw: BtLGrain: EtOH / Straw: ElectricityGrain: EtOH / Straw: CogenerationGrain: ETBE / Straw: ETBE
Grain: EtOH / Straw: EtOHGrain: EtOH / Straw: BtLGrain: EtOH / Straw: ElectricityGrain: EtOH / Straw: Cogeneration
Ethanol
t CO2 equiv. / (ha*a)
← Advantage
Wheat II
Sugar beet
Wheat I
Triticale
Fig. 4-3 Results on all life cycle comparisons for the "Fallow land" base scenario with
bandwidths from all individual sensitivity analyses (without variation of the yield). Left partial bar in Wheat I = credit for gluten; PE = Primary energy
IFEU Heidelberg 27
Legend for the third blue bar „Electricity – Triticale“ for the greenhouse effect:
If electricity is generated in a power plant by energetically using triticale and instead of a marginal electricity mix, ca. 5.9 t CO2 equivalents per hectare and year can be saved. The black bars indicate the amount of greenhouse gases that could be saved by co-combusting the triticale whole plants in a hard coal power plant, namely 13.9 t CO2 equiva-lents per hectare and year.
Results
• The bandwidth for BtL results from various processes, which essentially differentiate in efficiencies and co-products. Depending on the process, BtL production comes out better or worse.
• The bandwidth for electricity production results from the type of electricity generation: the biomass can either be used in a pure biomass power plant or co-combusted in a hard coal power plant. In the first case, marginal electricity (50% hard coal / 50% natural gas) is substituted, in the latter; on the other hand, hard coal is directly substituted as the fuel, which leads to better results, especially in terms of climate protection.
• The bandwidth for combined heat and power plants (cogeneration plants) results from the proportion of utilized heat. If 80% of the heat is utilized instead of only 20%, twice as much fossil resources can be saved and greenhouse gases saved in the case of triticale.
• One special case is the lilac bar: Here, ethanol is processed into ETBE (ethyl tertiary butyl ether, a fuel additive), substituting MTBE (methyl tertiary butyl ether). As the production of MTBE is very energy intensive, by using ETBE four times the amount of primary energy can be saved.
• If lignite is used as the fossil energy source, the greenhouse balances worsen for the Wheat II and sugar beet processes significantly, but still remain positive.
• The variation of the degree of effectiveness in the fossil cogeneration plant and the increase of the mileage for ethanol through higher efficiency lead to the results that lie within the above- mentioned bandwidths, i.e., the influence of these parameters is com-paratively slight.
Summary
The results of the variation of individual boundary conditions shows that statements made about the advantageousness of particular paths (for example those in Section 4.1.2) cannot be generalised as they are highly dependent on the system being contemplated. For in-stance the stationary energy production from triticale with consideration of a higher heat utilisation in biomass cogeneration is at least as good as ethanol production from wheat based on the Wheat I process.
In addition, a number of specific results and individual associations can be derived as well: for instance, processing ethanol to the fuel additive ETBE, which replaces the fossil MTBE, leads to the best balance results by far. However, the use of ETBE is regulatory limited by current fuel norms. Still, the potential of ETBE should be completely exhausted before replacing gasoline by ethanol.

28 IFEU Heidelberg
4.2 Comparisons: Expanded scenario
As described in Section 3.2.2, in the expanded base scenario it is assumed that the land that becomes free due to co-products accruing during ethanol production is used for bioenergy sources. The ramifications of this approach are explained in detail below using the example of ethanol made from sugar beet. Subsequently the results for all 13 life cycles are pre-sented. That last section deals with the land use requirements for the individual scenarios.
4.2.1 Bioethanol from sugar beets in detail (expanded scenario)
Analogue to Fig. 4-1, Fig. 4-4 shows the advantages and disadvantages of ethanol from sugar beets as compared with fossil gasoline for the environmental impact “greenhouse effect”, expressed in CO2 equivalents per hectare and year. While doing so, two variants are differentiated for the co-product beet pulp which – as described in Section 3.2.2 – when used as concentrated animal feed could substitute both barley and beet pulp from sugar produc-tion.
The first two bars in Fig. 4-4 represent in turn the expenditures and credits for ethanol made from sugar beets, each with a different credit for the co-product beet pulp. The third bar then shows the expenditures for the equivalence product, fossil gasoline. The result balances portrayed underneath (Balances 13b and 13c) come from subtracting the fossil life cycle of the biogenous life cycles and form the total result of both these life cycle comparisons.
Greenhouse effect
-50 -40 -30 -20 -10 0 10 20 30
Sugar beet: Ethanol (beet pulp)
Sugar beet: Ethanol (barley)
Gasoline
Sugar beet: Ethanol (beet pulp)
Sugar beet: Ethanol (barley)
t CO2 equiv. / (ha*a)
Expenditures →
← Advantage for ethanol
← Credits
Disadvantage →
Balance 13b
Balance 13c
Cultivation Transport Thick juice production EtOH production Utilisation
Expenditures: Credits: Rest Pressed pulp Vinasse
Gasoline:ProductionUtilisation
Fig. 4-4 Detailed results from the life cycle comparison between ethanol from sugar beets
and gasoline for the "Barley" and “Beet pulp" scenarios

IFEU Heidelberg 29
Legend for the bar "Beet: Ethanol (Barley)“ for greenhouse effect:
If ethanol from sugar beets is used instead of gasoline and if conventional barley concen-trated fodder is substituted by the co-product, with consideration of an alternative land use (production of bioenergy sources), ca. 33 t CO2 equivalents per hectare and year could be saved. If as an alternative the pressed pulp is substituted by pressed pulp from sugar production (all other boundary conditions remain the same), ca. 18 t CO2 equivalents per hectare and year can be saved.
Results
The changes in the results can be seen in the yellow bar sections: If the pressed pulp re-places barley as concentrated feed and if in turn the freed-up land is cultivated with sugar beets for ethanol, which substitutes gasoline, a credit results even merely from that of 17.3 t CO2 equivalents per hectare and year. If, in contrast, pressed pulp from sugar production is substituted by pressed pulp from ethanol production and the shortage of sugar is replaced by cane sugar, one only obtains a credit of 1.9 t CO2 equivalents per hectare and year.
Summary
The results from the energy and greenhouse gas balance are decisively defined in the expanded scenario by the credits of those co-products that free up land areas. Depending on the selection of the scenario, the amount of greenhouse gases saved can nearly double. For that reason, a precise documentation of all boundary conditions is indispensable when applying the credit approach.
4.2.2 Expanded scenario
In this section, the results are presented as examples based on the four selected life cycle comparisons with the target product ethanol for the expanded scenario. These are the life cycles 1, 5, 9 and 13, for which Fig. 4-5 depicts the advantages and disadvantages of all bioenergy sources as compared with their respective fossil equivalents regarding the envi-ronmental impacts of energy savings and greenhouse effect. The resulting balances for these four as well as other life cycle comparisons are described in detail once more in the Appendix (Chapter 7.4) in Fig. 7-15 and Fig. 7-16.
The graphic presentation of results is made in the form of balances, which were ascertained in the manner described in Section 4.2.1. Both green bars in the lower part of the Fig. 4-5, which represent the greenhouse gas emissions saved for ethanol made from sugar beets, are therefore congruent with the balances from Fig. 4-4 (Balances 13b and 13c). The bars for ethanol production from wheat grain based on the Wheat I process are subdivided once more to emphasise the contribution of the gluten (left part of the bar).
Based on this illustration, a series of individual findings can be derived, during which various raw materials, conversion processes or target products can be compared with each other regarding the energy savings and the greenhouse effect.
30 IFEU Heidelberg
Energy savings-78
-192
-435
-78
-192
-224
-124
-124
-347
-347
-500 -400 -300 -200 -100 0
Triticale: EthanolW I: Grain: EtOH / Straw: EtOHW II: Grain: EtOH / Straw: EtOHSugar beet: Ethanol
Triticale: EthanolW I: Grain: EtOH / Straw: EtOHW II: Grain: EtOH / Straw: EtOHSugar beet: Ethanol
GJ PE / (ha*a)
← AdvantageBeet pulp vs barley
Beet pulp vs beet pulp
Greenhouse effect-4.3
-14.1
-33.0
-4.3
-14.1
-17.6
-8.3
-8.3
-24,7
-24,7
-50 -40 -30 -20 -10 0
Triticale: EthanolW I: Grain: EtOH / Straw: EtOHW II: Grain: EtOH / Straw: EtOHSugar beet: Ethanol
Triticale: EthanolW I: Grain: EtOH / Straw: EtOHW II: Grain: EtOH / Straw: EtOHSugar beet: Ethanol
t CO2 equiv. / (ha*a)
← AdvantageBeet pulp vs barley
Beet pulp vs beet pulp
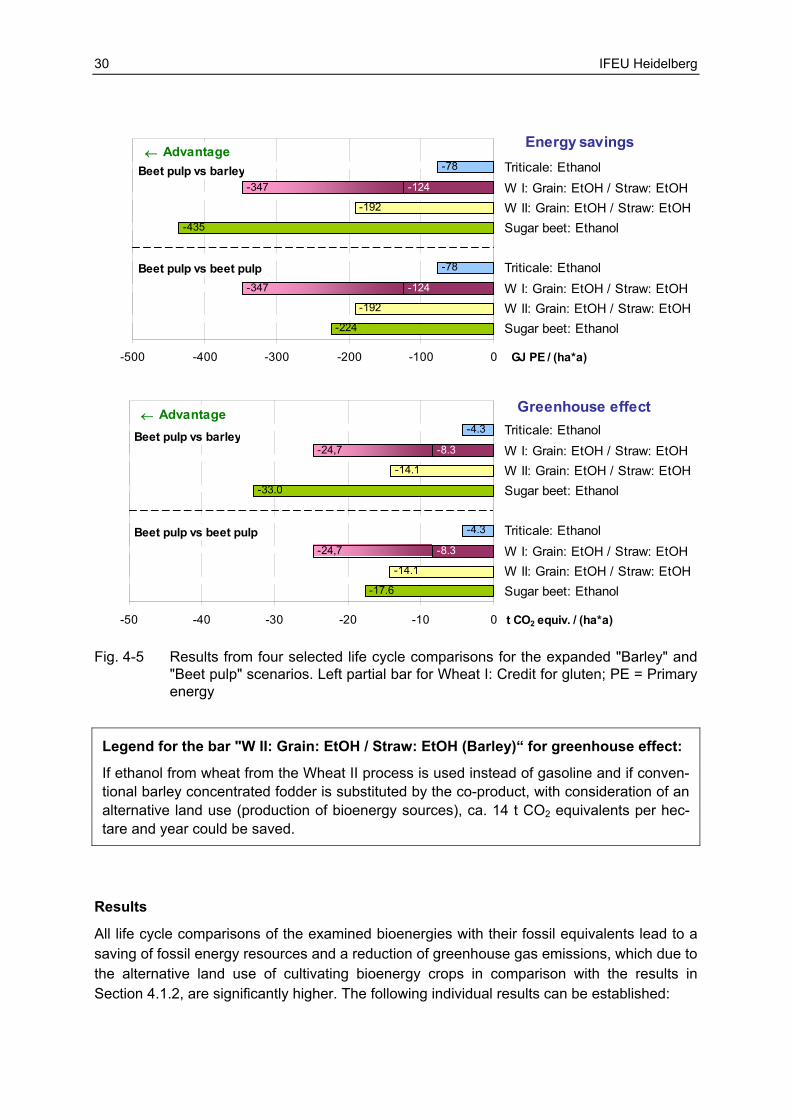
Fig. 4-5 Results from four selected life cycle comparisons for the expanded "Barley" and
"Beet pulp" scenarios. Left partial bar for Wheat I: Credit for gluten; PE = Primary energy
Legend for the bar "W II: Grain: EtOH / Straw: EtOH (Barley)“ for greenhouse effect:
If ethanol from wheat from the Wheat II process is used instead of gasoline and if conven-tional barley concentrated fodder is substituted by the co-product, with consideration of an alternative land use (production of bioenergy sources), ca. 14 t CO2 equivalents per hec-tare and year could be saved.
Results
All life cycle comparisons of the examined bioenergies with their fossil equivalents lead to a saving of fossil energy resources and a reduction of greenhouse gas emissions, which due to the alternative land use of cultivating bioenergy crops in comparison with the results in Section 4.1.2, are significantly higher. The following individual results can be established:

IFEU Heidelberg 31
• Comparison of the raw materials: Use of triticale for ethanol production leads to the lowest energy savings. The results do not show any change in the expanded scenario when compared with the base scenario as here, no land-releasing co-products accrue. When using wheat and sugar beet, the results turn out significantly better, in which the absolute amount of the savings depends on the beet pulp credit, i.e., the results are highly scenario-dependent here also.
• Comparison of the credits: The credit applied to the beet pulp only becomes clearly noticeable when producing ethanol from sugar beets: Here, the "Barley" scenario per-forms significantly better than the "Beet pulp" scenario. That is because, for instance, in the latter case the land that is freed-up can scenario-dependent no longer be used to cul-tivate energy crops (see Section 3.2.2). In the Wheat I and Wheat II processes, in com-parison, the credit applied to the beet pulp has hardly any effect as the sugar beets in this process only make up a small portion (< 5%) on the cultivation area.
• Comparison of the processes: The comparison of both examined processes for ethanol production from wheat grain still shows advantages for the process using energy produc-tion from bran and separation of the gluten (Wheat I). However, the differences here are less obvious. The differences are, however, basically scenario dependent here also, which, among other things can be attributed to the higher credit that DDGS (Wheat II) is given as compared with thick stillage (Wheat I), if the soy bean areas that become free are used for sugar cane cultivation for ethanol production. The influence of the large credit for gluten is magnified in the expanded scenario due to the alternative land use for producing bioenergy sources even when compared with the base scenario.
• Comparison of the products: The same statements apply here as in Section 4.1.2.
Summary
Once again, it appears that the results are highly dependent on the co-product scenarios taken as a basis along with other boundary conditions. However in general, it can be estab-lished that the advantages for the bioenergy sources in the expanded scenario are clearly larger than in the base scenario. The effect of the credit for gluten here is distinctly magnified once again in the expanded scenario.
Among the circumstances selected here, ethanol production from sugar beets in the "Barley" expanded scenario performs the best in terms of energy savings and climate protection, followed by the one from wheat. As the result, as the "Beet pulp" scenario turns out exactly the opposite, hardly any generally applicable, verifiable statements can be derived here. Likewise, this result needs to be discussed against the background of the actual land use requirements (see following Section 4.2.3).

32 IFEU Heidelberg
4.2.3 Land use requirements
Starting with the hypothesis that the land needed for cultivation of energy crops is available in the form of fallow land (see Chapter 3.2), initially one hectare of area is required for cultivating grain and sugar beets. With the generation of co-products such as beet pulp, vinasse, thick stillage or DDGS during ethanol production, land is usually once again re-leased. However, in the case of gluten, which substitutes conventional wheat gluten, addi-tional land use requirements arise for potato cultivation. This is needed for producing the potato starch, which substitutes wheat starch production. Regarding handling the land that becomes free, in the basis scenario it is assumed that this remains unused and becomes fallow land. On the contrary, in the expanded scenario, its use for cultivation of energy crops for ethanol production is applied.
Based on the applied assessment of co-products, depending on the life cycle and scenario, different land use requirements or releases appear. Table 4-1 sums these up separately for Germany/ Central Europe and Brazil, as they can only be offset against each other to a limited extent due to the differing qualities.
Table 4-1 Land use requirements [ha] in the considered life cycles and co-product scenar-ios. Black: Land use requirements between 0 and 1 ha; red: Land use require-ments > 1 ha; green: Land area release
Life cycle Reference system Base scenario a:
"Fallow land" Expansion b:
"Barley" Expansion c: "Beet pulp"
Triticale: use of whole plant Cultivation Germany -1,00 Total -1,00 Wheat I: Combined use of grain and straw Cultivation Germany -1,00 -1,00 -1,00 Dried pulp Germany 0,03 0,00 0,05 Gluten Germany 0,47 -0,48 -0,48 ZWS -0,50 -1,48 -1,43 Thick stillage Brazil 0,41 0,00 0,00 Total -0,09 -1,48 -1,43 Wheat II: Combined use of grain and straw Cultivation Germany -1,00 -1,00 -1,00 Pressed pulp Germany 0,02 0,00 0,03 ZWS -0,98 -1,00 -0,97 DDGS Brazil 1,30 0,00 0,00 Total 0,32 -1,00 -0,97 Sugar beets Cultivation Germany -1,00 -1,00 -1,00 Pressed pulp Germany 0,49 0,00 1,00 ZWS -0,51 -1,00 0,00 Vinasse Brazil 1,18 0,00 0,00 Total 0,67 -1,00 0,00

IFEU Heidelberg 33
Results
• As when using triticale, no by-products accrue that lead to substitution effects with additional land use requirements or land releases, the land balance turns out as ex-pected: exactly one hectare of fallow land is used.
• Things look different for Wheat I: Whereas from a global point of view in the "Fallow land" (a) base scenario, a nearly equalized land area balance is achieved, i.e., the one hectare available is barely used; in the "Barley" and "Beet pulp" (b / c) expanded scenarios nearly one additional hectare land is occupied over and above the one hectare that is available. As a result, more land is required as is available by hypothesis.
• On the contrary, in Wheat II in the expanded scenario, seen worldwide ca. one hectare of crop land is occupied, in the "Fallow land" base scenario however 0.3 ha is even re-leased.
• The sugar beet, depending on the scenario, exhibits very differing land area balances. In the "Fallow land" basis scenario, seen worldwide ca. 0.7 ha cultivation area is released, while the expanded "Beet pulp" scenario shows an equalized land balance. The reason for that is that in the latter case, no additional crop land is required in Germany over and above the existing sugar cultivation areas as the beets will be used in the future for etha-nol production instead of for sugar production. It is merely in the expanded "Barley" sce-nario that exactly one hectare of cultivation land is occupied in Germany.
• Seen worldwide, the equalized to positive land balances in the "Fallow land" basis scenario generally only come into existence through large-scale land releases in Brazil, which, due to the different land qualities, can only be offset in part with those in Germany.
Summary
The statements made in Chapters 4.1 and 4.2 regarding the advantages and disadvantages of individual bioenergy paths must be qualified due to the in part distinct differences in land use requirements. It becomes clear that especially those bioenergy paths turn out especially good in the above-mentioned chapters that actually require more land than the one hectare that is in fact available. That especially applies to the expanded Wheat I scenario, which has significantly better results than Wheat II, whereas in the latter case, a maximum of one hectare is occupied. Furthermore, for the same reason, it is not surprising that for sugar beets, the results for the expanded "Barley" scenario turns out significantly better than the one for the expanded "Beet pulp" scenario, because in the latter case purely and simply more land is needed for bioenergy production.
Based on this example it is once again clarified how greatly the results depend on the assumed co-product scenarios and the consequential, actual land use requirements. Com-parisons between the individual bioenergy paths or even generally-valid, verifiable state-ments on their advantages and disadvantages are only possible to a limited degree.

34 IFEU Heidelberg
4.3 Convergence of the results
In the following, the results of the base scenarios in Chapter 4.1 are converged with those of the expanded scenarios in Chapter 4.2. Fig. 4-6 shows in addition the advantages and disadvantages of all bioenergy sources as compared with their respective fossil equivalents for the environmental impacts of energy savings (blue bars) and greenhouse gas savings (violet bars). The bandwidths of the results of all 13 life cycle comparisons are shown which, due to the consideration of the alternative land use, come into existence in the expanded scenarios.
Results
• With consideration of an alternative use of land freed up, the energy and greenhouse gas balances for life cycles 5-13 turn out distinctly more positive because land-releasing co-products arise in these paths. In the case of sugar beet, the energy savings per hectare is five times that in the base scenario. The results for bioenergy made from triticale whole plants (Life cycles 1-4) on the other hand do not show any change in the expanded sce-nario as compared with the base scenario because here, no land-releasing co-products accrue whatsoever.
• While the energy and greenhouse balances in the base scenario are mainly dominated by the expenditures made during energy crop cultivation and during thick juice and etha-nol production, in the expanded scenario the credits for the substituted equivalent prod-ucts clearly play the more significant role, i.e., the systems are not determined by the supposed main product but rather by the co-products.
• The bandwidths displayed in Fig. 4-6 as compared with those in the sensitivity analyses (see Fig. 4-3) turn out significantly higher, i.e., the consideration of an alternative land use has a much greater affect on the results as any possible data uncertainties.
Summary
As already ascertained in numerous life cycle assessment studies, here also it is clearly demonstrated that the results turn out distinctly different depending on the scenario taken as the basis. At the same time, it is absolutely decisive for the derived statements whether an alternative land use on land that become free is taken into consideration or not. For example, all bioenergy paths with triticale, which in the base scenario still deliver comparatively good results regarding energy and greenhouse gas savings, turn out markedly worse as no land area releasing co-products occur in these paths.
The energy crop cultivation for ethanol production on the areas released in the expanded scenario is one possibility among many. An estimate of land use that tends to be more positive would be, for example, produced by cultivating short-rotation wood for co-combustion in a hard coal power plant. On the contrary, the analysis without consideration of the alternative land utilisations tends to be an estimation downward.
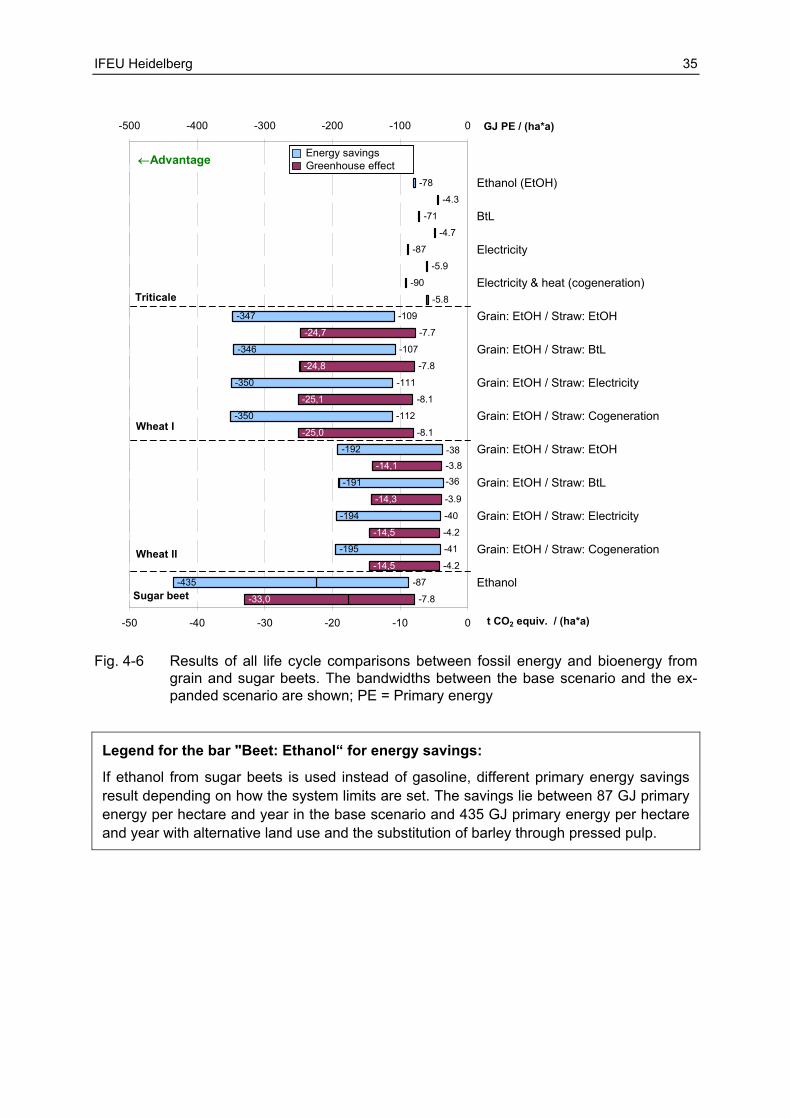
IFEU Heidelberg 35
-4.3
-4.7
-5.9
-5.8
-7.7
-7.8
-8.1
-8.1
-3.8
-3.9
-4.2
-4.2
-7.8
-24,7
-24,8
-25,1
-25,0
-33,0
-14,1
-14,3
-14,5
-14,5
-78
-71
-87
-90
-109
-107
-111
-112
-87
-40
-38
-41
-36
-350
-350
-346
-347
-435
-194
-195
-192
-191
-50 -40 -30 -20 -10 0
Ethanol (EtOH)
BtL
Electricity
Electricity & heat (cogeneration)
Grain: EtOH / Straw: EtOH
Grain: EtOH / Straw: BtL
Grain: EtOH / Straw: Electricity
Grain: EtOH / Straw: Cogeneration
Grain: EtOH / Straw: EtOH
Grain: EtOH / Straw: BtL
Grain: EtOH / Straw: Electricity
Grain: EtOH / Straw: Cogeneration
Ethanol
t CO2 equiv. / (ha*a)
-500 -400 -300 -200 -100 0 GJ PE / (ha*a)
←Advantage
Sugar beet
Triticale
Wheat I
Wheat II
Energy savings Greenhouse effect
Fig. 4-6 Results of all life cycle comparisons between fossil energy and bioenergy from
grain and sugar beets. The bandwidths between the base scenario and the ex-panded scenario are shown; PE = Primary energy
Legend for the bar "Beet: Ethanol“ for energy savings:
If ethanol from sugar beets is used instead of gasoline, different primary energy savings result depending on how the system limits are set. The savings lie between 87 GJ primary energy per hectare and year in the base scenario and 435 GJ primary energy per hectare and year with alternative land use and the substitution of barley through pressed pulp.

36 IFEU Heidelberg
4.4 Excursus: Comparison of BtL made from poplar
Based on the compilation of the results for the bioenergy paths from grain and sugar beets (Chapter 4.3), they are compared in this excursus with the BtL production from poplar short-rotation wood. Fast growing timber such as poplar and willow provide high yields of biomass containing lignocellulose, which can be used for energy production, for example for 2nd generation biofuels like BtL. The BtL utilisation variant is schematically portrayed in Fig. 4-7.
Poplar cultivation
Chipping
Poplar Use in cars Use in cars Diesel fuelBtL LW 2
Fallow land
Product Process Reference system
Upstreamprocesses
Fig. 4-7 Life cycle comparisons between diesel fuel and BtL (Biomass-to-Liquid) gained
from short-rotation wood.
Fig. 4-8 shows the advantages and disadvantages of biofuel paths compared with their respective fossil equivalent for the environmental impacts for energy savings (blue bar) and greenhouse gas savings (violet bar). Once more, the bandwidths of the results are shown between the base scenario and the expanded scenario. A sensitivity analysis on the various BtL production processes is included in the Appendix (Chapter 7.3).
Results
• With BtL from poplar short-rotation wood, 50% more energy can be saved and 70% more greenhouse gas emissions can be saved as compared with BtL gained from triticale.
• BtL from poplar short-rotation wood thus turns out – at least in the base scenario – similarly positive like ethanol from wheat grain and sugar beets according to the Wheat I process and also ethanol that is made purely from sugar beets.
• However, the choice of the BtL process (see Fig. 7-14) influences the ranking of the three last-mentioned biofuel paths: In the most favourable case, it clearly leads to better results for BtL from poplar short-rotation wood as compared with other paths.
• The results for BtL from poplar short-rotation wood do not show any differences between the base scenario and the expanded scenario as here – analogue to triticale whole plants – no co-products that would free up land accrue. With consideration of these land use effects, conventional biofuel paths made from sugar and starch plants (sugar beet and wheat) deliver clearly better results than those that use the lignocellulosic biomass (pop-lar short-rotation wood and triticale).

IFEU Heidelberg 37
-8.1
-4.7
-7.7
-7.8
-3.8
-3.9
-7.8
0.0
0.00.0
0.0
0.0
0.0
0.0
0.0
-4.3
-24,7
-24,8
-14,1
-14,3
-33,0
-106
-78
-71
-109
-107
-36
-87
-38
-347
-346
-191
-192
-435
-50 -40 -30 -20 -10 0
BtL
Ethanol (EtOH)
BtL
Grain: EtOH / Straw: EtOH
Grain: EtOH / Straw: BtL
Grain: EtOH / Straw: EtOH
Grain: EtOH / Straw: BtL
Ethanol
t CO2 equiv. / (ha*a)
-500 -400 -300 -200 -100 0 GJ PE / (ha*a)
← Advantage
Sugar beet
Triticale
Wheat I
Wheat II
Poplar
Energy savings Greenhouse effect
Fig. 4-8 Results of selected life cycle comparisons between fossil fuels and biofuels made
from wheat and sugar beets as well as from poplar short-rotation wood (only BtL). The bandwidths between the base scenario and the expanded scenario are shown; PE = Primary energy
Legend for the bar "Poplar: BtL“ for energy savings:
If BtL from poplar short-rotation wood is used instead of diesel fuel, 106 GJ of primary energy per hectare and year can be saved.
Summary
The approximately 25% greater yield per hectare of poplar short-rotation wood as compared with triticale becomes obvious in the results for the energy and greenhouse balances for BtL from poplar short-rotation wood. However, the comparatively good BtL production in the base scenario turns out substantially worse in the expanded scenario as the bioethanol production from both the wheat and sugar beet processes.
With consideration of land use effects, which are associated with the co-products from ethanol production, the 1st generation sugar and starch based biofuels considered here contribute significantly more to preserving non-renewable energy resources and to prevent-ing greenhouse gas emissions as those from the 2nd generation based on lignocellulose. With consideration of the question regarding the "optimal" land use however, additional bioenergy paths such as, for example, vegetable oil and biodiesel made from rape or biogas and biomethane made from maize could be examined, during which the consideration of land effects (e. g. rape meal versus soy meal), probably also would become noticeable.

38 IFEU Heidelberg
5 Conclusions
In this study, the potential of energy and greenhouse gas savings of various paths for bio-energy production from grain and sugar beet was determined. The investigation shows that all thirteen analysed bioenergy paths when compared with conventional energy production from fossil energy sources can contribute to preserving non-renewable energy resources and to climate protection in all scenarios and under all boundary conditions. Even when using lignite as energy source for bioethanol production, the greenhouse balance still comes out positive, although not nearly as good as with natural gas.
• The findings from the three investigated processes for bioethanol production from wheat and sugar beets, i.e. bioethanol production plus energetic wheat straw use are compara-ble in the basis scenario with those of the bioenergy production from triticale. That indi-cates that there are a number of opportunities for "optimal" land use from the point of view of resource conservation and climate protection and that none of the investigated bioenergy paths proves genuine advantages. Among the investigated processes, the Wheat I process with bran and gluten separation turns out markedly better than the Wheat II process, which, among other things, is to be attributed to the energy-intensive drying of the stillage to produce DDGS in the Wheat II process, and the extensive substi-tution of fossil process energy by energetic use of the bran in the Wheat I process.
• The comparison of BtL made from polar short-rotation wood does not change this state-ment. Due to the higher crop yields per area, the environmental advantages are greater than with BtL from triticale, but with this path not more non-renewable energy resources can be conserved and greenhouse gas emissions can be saved as with ethanol made from wheat and sugar beets based on the Wheat I process.
• The analysis furthermore shows that many of the paths can be optimised, among others, in the areas of cultivation of energy crops and biomass conversion. For example, the process energy could also be provided by renewable raw materials such as straw or short-rotation wood. In addition, the end product can have decisive effects on the results: as part of a sensitivity analysis, an investigation into processing ethanol to the fuel addi-tive ethyl tertiary butyl ether (ETBE), which replaces the fossil MTBE, always leads to the best balance results by far. Despite the regulatory limitations of ETBE, its potential should be completely exhausted before replacing gasoline by ethanol.
• On top of that, some generally valid associations were derived: for example both for triticale as well as for straw, with stationary use for electricity or electricity and heat pro-duction, more energy and greenhouse gas emissions can be saved than with mobile use in the form of 2nd generation biofuels. In the transport sector it makes no difference here whether lignocellulosic ethanol or BtL is produced, whereas in the energy sector – apart from the biomass co-combustion in coal-fired power plants – the best results are gained through combined use of heat and power with a high degree of heat utilisation.

IFEU Heidelberg 39
• Inclusion of land effects that are associated with the co-products from bioethanol produc-tion used as fodder can have significant affects on the results of the energy and green-house gas balances:
• Even just considering the expanded scenarios selected here as examples for additional bioenergy production on land that is no longer needed for fodder production, five times more energy and four times more greenhouse gases can be saved as in the basis sce-nario.
• All investigated ethanol production processes from wheat and sugar beets turn out sig-nificantly better in the expanded scenario than the bioenergy production from triticale or even BtL from poplar short-rotation wood, whereas the ethanol production from sugar beet tends to deliver the best results. The innovative process for manufacturing bio-ethanol from wheat grains and sugar beets (Wheat I process) also leads to very advan-tageous results, but here markedly more land is needed as the one hectare of fallow land actually available. Thus, on the whole, the so-called 2nd generation biofuels such as BtL (Biomass-to-Liquid) or lignocellulosic ethanol (LCF-ethanol) do not have any system-inherent advantages compared with conventional biofuels such as bioethanol gained from sugar beets or wheat.
For one, this shows that bioenergy paths with co-products, which affect land use, under certain boundary conditions preserve more non-renewable energy resources and can pre-vent greenhouse gas emissions than previously assumed. For another, this shows however that the bioenergy scenarios to be considered in life cycle assessments have to be selected with great care and that corresponding questions need to be formulated in detail. Also, the results are only applicable in the context of the frame of the investigation. In this respect, this study is very helpful for further discussion about life cycle assessments regarding bioenergy in general and specifically regarding biofuels.
However, the above-mentioned results and conclusions only apply to the thirteen considered paths for bioenergy production; when other bioethanol processes or additional bioenergy paths such as biodiesel from rape or biogas from maize are considered, they could turn out considerably differently. Still, the qualitative findings gained here can be viewed as being very robust, while the quantitative findings are to a large extent dependent on the above-mentioned land use effects and the selected co-product substitutes. Likewise, the results and conclusions for the energy and greenhouse balances cannot be transferred to other envi-ronmental impacts such as acidification, nutrient input or summer smog. These have to be investigated additionally in the frame of an integral environmental assessment.

40 IFEU Heidelberg
6 Literature and abbreviations
Literature
/Borken et al. 1999/ Borken, J., Patyk, A. & Reinhardt, G.A.: Basisdaten für ökologische Bilanzierungen. Einsatz von Nutzfahrzeugen in Transport, Landwirtschaft und Bergbau. Vieweg, Braunschweig / Wiesbaden, 1999
/Bringezu et al. 2008/ Bringezu, S. (Wuppertal Institut) und 16 weitere Autoren: Optionen einer nachhaltigen Flächennutzung und Ressourcenschutzstrategien unter besonderer Berücksichtigung der nachhaltigen Versorgung mit nachwachsenden Rohstoffen. Wuppertal Institut, Fraunhofer UMSICHT & IFEU. Wuppertal / Oberhausen / Heidel-berg, 2008
/CropEnergies 2007/ CropEnergies AG: ProtiGrain – Das Plus fürs Protein. Ochsenfurt, 2007
/DIN 14040 & 14044/ DIN EN ISO 14040 & 14044. Deutsches Institut für Normung e.V.. Beuth Verlag, Berlin, 2006
/DLG 1997/ Deutsche Landwirtschafts-Gesellschaft (DLG e.V.): DLG-Futterwerttabellen – Wiederkäuer. DLG-Verlag, Frankfurt (Main), 1997
/ecoinvent 2007/ Frischknecht, R. et al.: ecoinvent Data v2.0 – Ökoinventare für Energiesys-teme. ESU-services, Uster (Schweiz), 2007
/efma 2007/ European Fertilizer Manufacturers Association (EFMA): Fertilizer application in EU 15 & EFMA 17 in 2004/05. EFMA-JRC (IES) meeting, Brussels, 04/09/2007
/Fritsche et al. 2004/ Fritsche, U. (Ökoinstitut) and 25 additional authors: Stoffstromanalyse zur nachhaltigen energetischen Nutzung von Biomasse. Endbericht. Ökoinstitut, Fraunhofer UMISCHT, IE, IFEU, IZES, TU Braunschweig & WZW. Darmstadt [u. a.], 2004
/Geringer et al. 2007/ Geringer, B., Holub, F. & Urbanek, M.: Bioethanol – Alltagstauglichkeit und weiteres Potenzial im motorischen Einsatz. Vortrag im Rahmen des ÖAMTC-Experten Forums Umwelt „Bioethanol als Kraftstoff“, Wien, 21.05.2008
/GEMIS 2007/ Fritsche, U. et al.: Globales Emissions-Modell Integrierter Systeme (GEMIS), Version 4.4. Ökoinstitut, Darmstadt, 2007
/IFEU 2008/ Institut für Energie- und Umweltforschung: IFEU-interne Berechnungen und Abschätzungen. Heidelberg, 2008
/Jungk & Reinhardt 2000/ Jungk, N. & Reinhardt, G.A.: Landwirtschaftliche Referenzsyste-me in ökologischen Bilanzierungen. Eine Basisanalyse. IFEU, Heidelberg, 2000
/Kaltschmitt & Reinhardt 1997/ Kaltschmitt, M. & Reinhardt, G.A. (Hrsg.): Nachwachsende Energieträger. Grundlagen, Verfahren, ökologische Bilanzierung. Vieweg, Braun-schweig / Wiesbaden, 1997
/KTBL 2005/ Kuratorium für Technik und Bauwesen in der Landwirtschaft (KTBL): Faustzah-len für die Landwirtschaft. Landwirtschaftsverlag, Münster, 2005

IFEU Heidelberg 41
/List et al. 2007/ List, R., Hofmann, P. & Urbanek, M.: The Effects of Bio-Ethanol Mixtures on the SI-Engine Operation. Proceedings of the 6th International Colloquium Fuels, Stutt-gart / Ostfildern, January 10-11, 2007
/Münch 2008/ Münch, J.: Nachhaltig nutzbares Getreidestroh in Deutschland. Positionspa-pier des Instituts für Energie- und Umweltforschung. IFEU, Heidelberg, 2008
/Oertel 2007/ Oertel, D.: Industrielle stoffliche Nutzung nachwachsender Rohstoffe. Büro für Technikfolgen-Abschätzung beim Deutschen Bundestag (TAB), Karlsruhe, 2007
/Reinhardt et al. 2006/ Reinhardt, G.A., Gärtner, S., Patyk, A. & Rettenmaier, N.: Ökobilan-zen zu BTL: Eine ökologische Gesamteinschätzung. IFEU, Heidelberg, 2006
/Reinhardt et al. 2007/ Reinhardt, G.A., Detzel, A., Gärtner, S., Rettenmaier, N. & Krü-ger, M.: Nachwachsende Rohstoffe für die chemische Industrie: Optionen und Potenzi-ale für die Zukunft. IFEU, Heidelberg, 2007
/Südzucker 2007-08/ Wach, W. & Klenk, I.D.: Persönliche Mitteilungen. Südzucker AG, Mannheim / Ochsenfurt, 2007/2008
/Weber 2007/ Weber, M.: Ethanolschlempe in der Tierfütterung. Landesanstalt für Landwirt-schaft, Forsten und Gartenbau (LLFG) Sachsen-Anhalt, Vortrag im Rahmen der 9. Ta-gung Thüringer Landwirtschaft, Erfurt, 15.02.2007
Abbreviations
a annum (lat. for year) BK Lignite BtL Biomass-to-Liquid CH4 Methane CHP Combined heat and power plant CO2 Carbon dioxide DDGS Distiller's Dried Grains with Solubles EG Natural gas Equiv. Equivalent(s) ETBE Ethyl-tertiary-butyl-ether EtOH Ethanol GJ Gigajoule (109 J) ha Hectare (104 m2) IPCC Intergovernmental Panel on Climate Change, Weltklimarat KWK Combined heat and power (cogeneration) LCF Lignocellulosic feedstock MTBE Methyl-tertiary-butyl-ether N2O Dinitrous oxide, laughing gas OK Gasoline, petrol PE Primary energy PP Power plant SK Hard coal η Efficiency

42 IFEU Heidelberg
7 Appendix
7.1 Considered questions
Base scenario
Thick juiceproduction
Driedpulp1
Thickstillage
Soymeal
Sugar beetcultivation
Soybeancultivation Fallow land
EtOHproduction
Fallow land
Ethanol Gasoline
Barley Barleycultivation Fallow land
Wheatcultivation
Gluten2 Wheatgluten
Wheatcultivation Fallow land
Wheatstarch
Potato starch
Potato cultivation
1 Wheat II: Pressed pulp2 Wheat II: No gluten isolation3 Wheat II: DDGS
Grain Thick juiceproduction
Driedpulp1
Thickstillage
Soymeal
Sugar beetcultivation
Soybeancultivation Fallow land
EtOHproduction
Fallow land
Ethanol Gasoline
Barley Barleycultivation Fallow land
Wheatcultivation
Gluten2 Wheatgluten
Wheatcultivation Fallow land
Wheatstarch
Potato starch
Potato cultivation
1 Wheat II: Pressed pulp2 Wheat II: No gluten isolation3 Wheat II: DDGS
Grain
Fig. 7-1 Alternative land use in the "Fallow land" base scenario. Combined depiction for
ethanol made from wheat based on the Wheat I and Wheat II processes
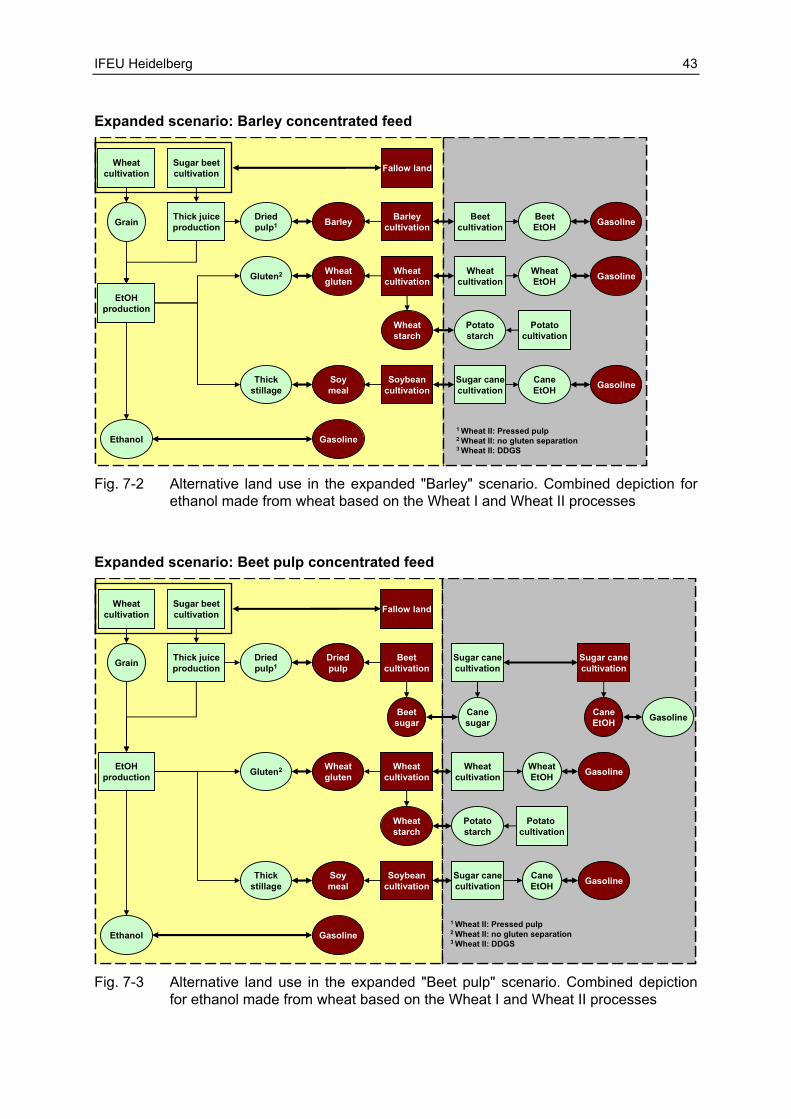
IFEU Heidelberg 43
Expanded scenario: Barley concentrated feed
Thick juiceproduction
Driedpulp1
Thickstillage
Soymeal
Sugar beetcultivation
Soybeancultivation
Sugar canecultivation
EtOHproduction
Fallow land
Ethanol Gasoline
Barley Barleycultivation
Beetcultivation Gasoline
Wheatcultivation
Gluten2 Wheatgluten
Wheatcultivation
Wheatcultivation
Wheatstarch
Potatostarch
Potatocultivation
WheatEtOH Gasoline
CaneEtOH
BeetEtOH
1 Wheat II: Pressed pulp2 Wheat II: no gluten separation3 Wheat II: DDGS
Gasoline
Grain Thick juiceproduction
Driedpulp1
Thickstillage
Soymeal
Sugar beetcultivation
Soybeancultivation
Sugar canecultivation
EtOHproduction
Fallow land
Ethanol Gasoline
Barley Barleycultivation
Beetcultivation Gasoline
Wheatcultivation
Gluten2 Wheatgluten
Wheatcultivation
Wheatcultivation
Wheatstarch
Potatostarch
Potatocultivation
WheatEtOH Gasoline
CaneEtOH
BeetEtOH
1 Wheat II: Pressed pulp2 Wheat II: no gluten separation3 Wheat II: DDGS
Gasoline
Grain
Fig. 7-2 Alternative land use in the expanded "Barley" scenario. Combined depiction for
ethanol made from wheat based on the Wheat I and Wheat II processes
Expanded scenario: Beet pulp concentrated feed
Thick juiceproduction
Driedpulp1
Thickstillage
Soymeal
Sugar beetcultivation
EtOHproduction
Fallow land
Ethanol Gasoline
Driedpulp
Wheatcultivation
Gluten2 Wheatgluten
Wheatcultivation
Wheatcultivation
Wheatstarch
Potatostarch
Potato cultivation
WheatEtOH Gasoline
Canesugar
Sugar canecultivation
Sugar canecultivation
CaneEtOH Gasoline
Beetcultivation
Beetsugar
Soybeancultivation
Sugar canecultivation
CaneEtOH Gasoline
1 Wheat II: Pressed pulp2 Wheat II: no gluten separation3 Wheat II: DDGS
Grain Thick juiceproduction
Driedpulp1
Thickstillage
Soymeal
Sugar beetcultivation
EtOHproduction
Fallow land
Ethanol Gasoline
Driedpulp
Wheatcultivation
Gluten2 Wheatgluten
Wheatcultivation
Wheatcultivation
Wheatstarch
Potatostarch
Potato cultivation
WheatEtOH Gasoline
Canesugar
Sugar canecultivation
Sugar canecultivation
CaneEtOH Gasoline
Beetcultivation
Beetsugar
Soybeancultivation
Sugar canecultivation
CaneEtOH Gasoline
1 Wheat II: Pressed pulp2 Wheat II: no gluten separation3 Wheat II: DDGS
Grain
Fig. 7-3 Alternative land use in the expanded "Beet pulp" scenario. Combined depiction
for ethanol made from wheat based on the Wheat I and Wheat II processes

44 IFEU Heidelberg
7.2 Sensitivity analyses
7.2.1 Bioenergy from grain and sugar beet
Efficiency of fossil combined heat and power plant (cogeneration plant) for energy source natural gas
Energy savings
-38
-87
-47
-97
-150 -100 -50 0
W II: Grain- & Straw-EtOH
Sugar beet: Ethanol
GJ PE / (ha*a)
η EG = η BK η EG > η BK ← Vorteil für Ethanol ← Advantage for ethanol
Greenhouse effect
-3.8
-7.8
-4.5
-8.4
-15 -10 -5 0
W II: Grain- & Straw-EtOH
Sugar beet: Ethanol
t CO2 equiv. / (ha*a)
η EG = η BK η EG > η BK ← Advantage for ethanol
Fig. 7-4 Environmental impacts of ethanol according to the Wheat II and sugar beet
processes as compared with gasoline with the variation of the efficiency of fossil cogeneration. Single-colour bar: same efficiency (η) for natural gas (EG) and lig-nite (BK); crosshatched bar: ηEG = 92% and ηBK = 82%; W II = Wheat II; PE = Primary energy
Legend for the bar “Beet: EtOH – ηEG > ηBK” for greenhouse effect:
If ethanol from sugar beets is used instead of gasoline and it is simultaneously assumed that natural gas has a higher use efficiency than lignite, 8.4 t CO2 equivalents per hectare and year can be saved, 0.6 t CO2 equivalents per hectare and year more than when as-suming the same use efficiency for natural gas and lignite.

IFEU Heidelberg 45
Energy sources: Natural gas or lignite
Energy savings
-109-109
-41
-92
-38
-87
-150 -100 -50 0
W I: Grain- & Straw-EtOH
W II: Grain- & Straw-EtOH
Sugar beet: Ethanol
GJ PE / (ha*a)
Natural gas Lignite ← Vorteil für Ethanol ← Advantage for ethanol
Greenhouse effect
-7.7-7.1
-1.3
-3.4-7.8
-3.8
-15 -10 -5 0
W I: Grain- & Straw-EtOH
W II: Grain- & Straw-EtOH
Sugar beet: Ethanol
t CO2 equiv. / (ha*a)
Natural gas Lignite
← Advantage for ethanol
Fig. 7-5 Environmental impacts of ethanol based on the three investigated ethanol pro-
duction processes as compared with gasoline. Variation of the energy source used in the production process with the same degree of efficiency of fossil co-generation. Single-colour bar: Energy source natural gas; crosshatched bar: En-ergy source lignite; W I = Wheat I; W II = Wheat II; PE = Primary energy
Legend for the bar “W II: Grain & Straw EtOH – natural gas” for greenhouse effect:
If, instead of gasoline, ethanol from the Wheat II process is used and natural gas is used as the energy source for the process energy for producing the ethanol, 3.8 t CO2 equiva-lents per hectare and year can be saved. If, on the contrary, lignite is used as the energy source for the process energy, the savings from using ethanol from the Wheat II process are reduced in comparison by 2.5 t CO2 equivalents per hectare and year to merely 1.3 t CO2 equivalents per hectare and year.

46 IFEU Heidelberg
Higher use efficiency through bioethanol
Energy savings
-109
-87
-115
-100
-150 -100 -50 0
W I: Grain- & Straw-EtOH
Sugar beet: Ethanol
GJ PE / (ha*a)
η EtOH = η OK η EtOH > η OK ← Vorteil für Ethanol ← Advantage for ethanol
Greenhouse effect
-7.7
-7.8
-8.2
-8.8
-15 -10 -5 0
W I: Grain- & Straw-EtOH
Sugar beet: Ethanol
t CO2 equiv. / (ha*a)
η EtOH = η OK η EtOH > η OK ← Advantage for ethanol
Fig. 7-6 Environmental impacts of ethanol based on Wheat I and sugar beet process as
compared with gasoline. Single-colour bar: Substitution of gasoline (OK) with ethanol (EtOH) in a ratio of 1:1 based on the lower calorific value; crosshatched bar: Substitution of gasoline with ethanol in a proportion of 1:0.94 based on the lower calorific value. η = efficiency; W I = Wheat I; PE = Primary energy
Legend for the bar “W I: Grain & Straw EtOH – ηEtOH > ηOK” for greenhouse effect:
If ethanol from the Wheat I process is used instead of gasoline and it is simultaneously assumed that ethanol increases the efficiency of the engine by 6% as compared with gasoline, 8.4 t CO2 equivalents per hectare and year can be saved, 0.7 t CO2 equivalents more per hectare and year than when assuming the same engine efficiency for ethanol and gasoline.
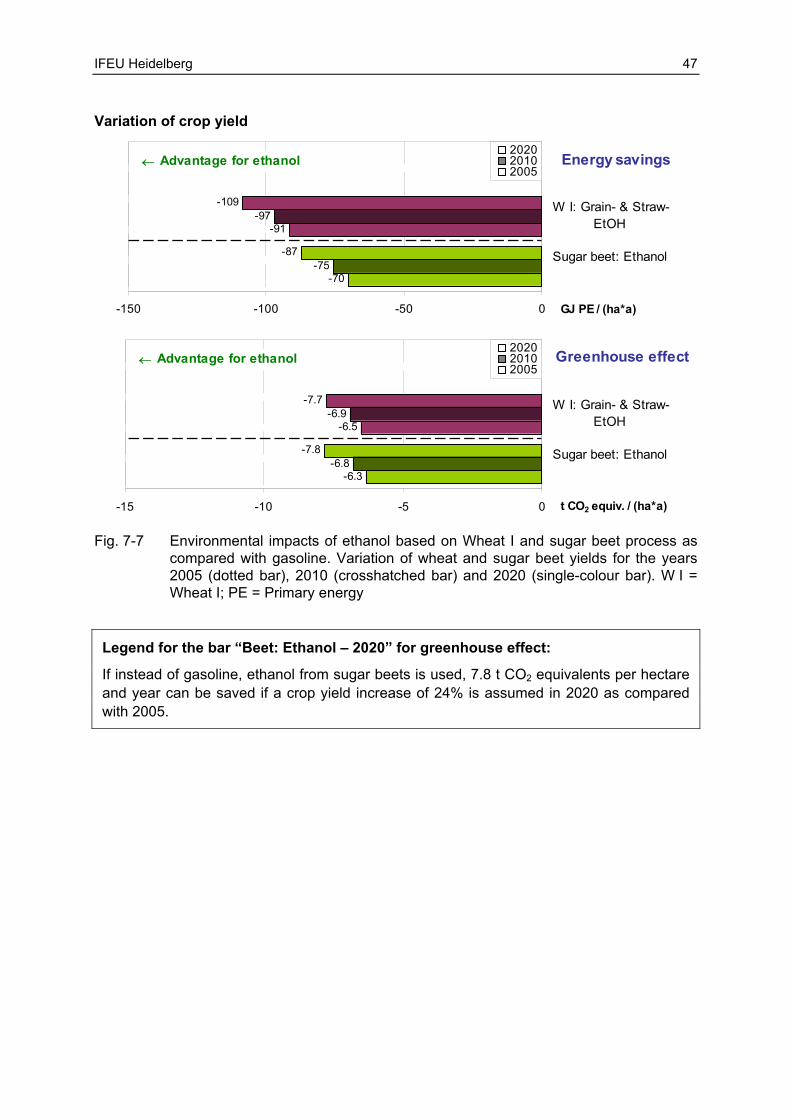
IFEU Heidelberg 47
Variation of crop yield
Energy savings
-109
-87
-97
-75
-91
-70
-150 -100 -50 0
W I: Grain- & Straw-EtOH
Sugar beet: Ethanol
GJ PE / (ha*a)
202020102005
← Advantage for ethanol
Greenhouse effect
-7.7
-7.8
-6.9
-6.8
-6.5
-6.3
-15 -10 -5 0
W I: Grain- & Straw-EtOH
Sugar beet: Ethanol
t CO2 equiv. / (ha*a)
202020102005
← Advantage for ethanol
Fig. 7-7 Environmental impacts of ethanol based on Wheat I and sugar beet process as
compared with gasoline. Variation of wheat and sugar beet yields for the years 2005 (dotted bar), 2010 (crosshatched bar) and 2020 (single-colour bar). W I = Wheat I; PE = Primary energy
Legend for the bar “Beet: Ethanol – 2020” for greenhouse effect:
If instead of gasoline, ethanol from sugar beets is used, 7.8 t CO2 equivalents per hectare and year can be saved if a crop yield increase of 24% is assumed in 2020 as compared with 2005.

48 IFEU Heidelberg
BtL process
Energy savings
-36
-107
-150 -100 -50 0
W I: Grain: EtOH / Straw: BtL
W II: Grain: EtOH / Straw: BtL
GJ PE / (ha*a)
← Advantage
Greenhouse effect
-3.9
-7.8
-15 -10 -5 0
W I: Grain: EtOH / Straw: BtL
W II: Grain: EtOH / Straw: BtL
t CO2 equiv. / (ha*a)
← Advantage
Fig. 7-8 Environmental impacts of ethanol from wheat grain and BtL from wheat straw as
compared with gasoline and diesel fuel. Variation of the BTL process; W I = Wheat I; W II = Wheat II; PE = Primary energy
Legend for the bar “W I: Grain: EtOH / Straw: BtL” for greenhouse effect:
If instead of using gasoline, ethanol is used from the wheat grain and instead of diesel fuel, BtL from wheat straw is used, depending on the applied BtL process between 7.6 and 8.0 t CO2 equivalents per hectare and year can be saved.

IFEU Heidelberg 49
Straw co-combustion in hard coal power plants
Energy savings
-111
-40
-124
-53
-150 -100 -50 0
W I: Grain: EtOH / Straw: Electricity
W II: Grain: EtOH / Straw: Electricity
GJ PE / (ha*a)
Biomass power plant Co-combustion hard coal PP
← Advantage
Greenhouse effect
-8.1
-4.2
-10.0
-6.1
-15 -10 -5 0
W I: Grain: EtOH / Straw: Electricity
W II: Grain: EtOH / Straw: Electricity
t CO2 equiv. / (ha*a)
Biomass power plant Co-combustion hard coal PP
← Advantage
Fig. 7-9 Environmental impacts of ethanol from wheat grain and electricity from wheat
straw as compared with gasoline and marginal electricity mix with variation of the straw combustion. Single-colour bar: Straw combustion in a biomass power plant (biomass PP); crosshatched bar: Straw co-combustion in a hard coal power plant (SK PP); PE = Primary energy
Legend for the bar “W II: Grain: EtOH / Straw: Electricity – co-combustion” for greenhouse effect:
If instead of gasoline, ethanol made from wheat grain is used and the wheat straw is co-fired for producing electricity in a hard coal power plant, 6.1 t CO2 equivalents per hectare and year can be saved, 1.9 t more than with energetic use of the straw in a purely biomass power plant.

50 IFEU Heidelberg
Heat utilisation in biogenous combined heat and power plants (cogeneration plants)
Energy savings
-112
-41
-127
-57
-150 -100 -50 0
W I: Grain: EtOH / Straw: Cogeneration
W II: Grain: EtOH / Straw: Cogeneration
GJ PE / (ha*a)
20% utilisation of heat 80% utilisation of heat ← Advantage
Greenhouse effect
-8.1
-4.2
-9.1
-5.2
-15 -10 -5 0
W I: Grain: EtOH / Straw: Cogeneration
W II: Grain: EtOH / Straw: Cogeneration
t CO2 equiv. / (ha*a)
20% utilisation of heat 80% utilisation of heat ← Advantage
Fig. 7-10 Environmental impacts of ethanol from wheat grain and electricity and heat
(cogeneration) from wheat straw as compared with gasoline and marginal elec-tricity mix with variation of the heat utilisation. Single-colour bar: 20% heat utilisa-tion; crosshatched bar: 80% heat utilisation; PE = Primary energy
Legend for the bar “W I: Grain: EtOH / Straw: Cogeneration – 80%” for greenhouse effect:
If instead of gasoline, ethanol made from wheat grain is used and the wheat straw is used instead of the marginal electricity and heat mix for producing electricity and heat, 5.2 t CO2 equivalents per hectare and year can be saved if 80% of heat can be used.
Subsequent processing of bioethanol to ETBE
Legend for the bars “Grain & Straw ETBE” for greenhouse effect:
If instead of MTBE ETBE from ethanol production of the Wheat I process is used, ca. 32 t CO2 equivalents per hectare and year can be saved, 24.4 t CO2 equivalents per hectare and year more than when using ethanol from wheat grain and straw instead of gasoline.

IFEU Heidelberg 51
Energy savings-109
-264
-400 -300 -200 -100 0
Grain- & Straw-EtOH
Grain- & Straw-ETBE
GJ PE / (ha*a)
← Advantage
Wheat I
Greenhouse effect-7.7
-32.1
-40 -30 -20 -10 0
Grain- & Straw-EtOH
Grain- & Straw-ETBE
t CO2 equiv. / (ha*a)
← Advantage
Wheat I
Fig. 7-11 Environmental impacts of ethanol or ETBE from wheat as compared with gaso-
line or MTBE; PE = Primary energy
Wheat cultivation
Crude oilproduction
Refining
Transport
BioethanolGasoline
Sugar beet cultivation
Thick juice
Ethanol production
Straw* Grain
Transport
Gluten
Thick stillage
Electricity
Carbona-tation lime
Dried pulp
Beet soil
Agricultural limestone
Concentra-ted fodder
Wheat gluten
Marginal electricity
Soy meal
Fodder
Fertiliser
Fodder
Food
Fallow land
Manure
Product Process Reference system
Fertiliser
Thick juice production
Sugarbeets
MTBEproduction
ETBEMTBE
Use in cars
TransportTransport
Use in cars
MTBEproduction
Fig. 7-12 Life cycle comparison between MTBE and ETBE. The bioethanol needed for
ETBE production is produced based on the "Wheat I" process.

52 IFEU Heidelberg
7.2.2 Bioenergy from triticale whole plants
BtL process, co-combustion and cogeneration heat utilisation
Energy savings
-90
-87
-71
-200 -150 -100 -50 0
BtL
Electricity
Electricity & heat (cogeneration)
GJ PE / (ha*a)
← Advantage
Triticale
Greenhouse effect-4.7
-5.9
-5.8
-20 -15 -10 -5 0
BtL
Electricity
Electricity & heat (cogeneration)
t CO2 equiv. / (ha*a)
← Advantage
Triticale
Fig. 7-13 Environmental impacts of various products made from triticale; PE = Primary
energy
Legend for the bars “Electricity” for greenhouse effect:
If instead of the marginal electricity mix, electricity is used which is produced by energetic use of triticale whole plants in a biomass power plant, 5.9 t CO2 equivalents per hectare and year can be saved. If, on the other hand, triticale whole plants are co-fired in a hard coal power plant for producing electricity, they practically substitute coal so that 13.9 t CO2 equivalents per hectare and year can be saved. This potential is represented by the black bars.
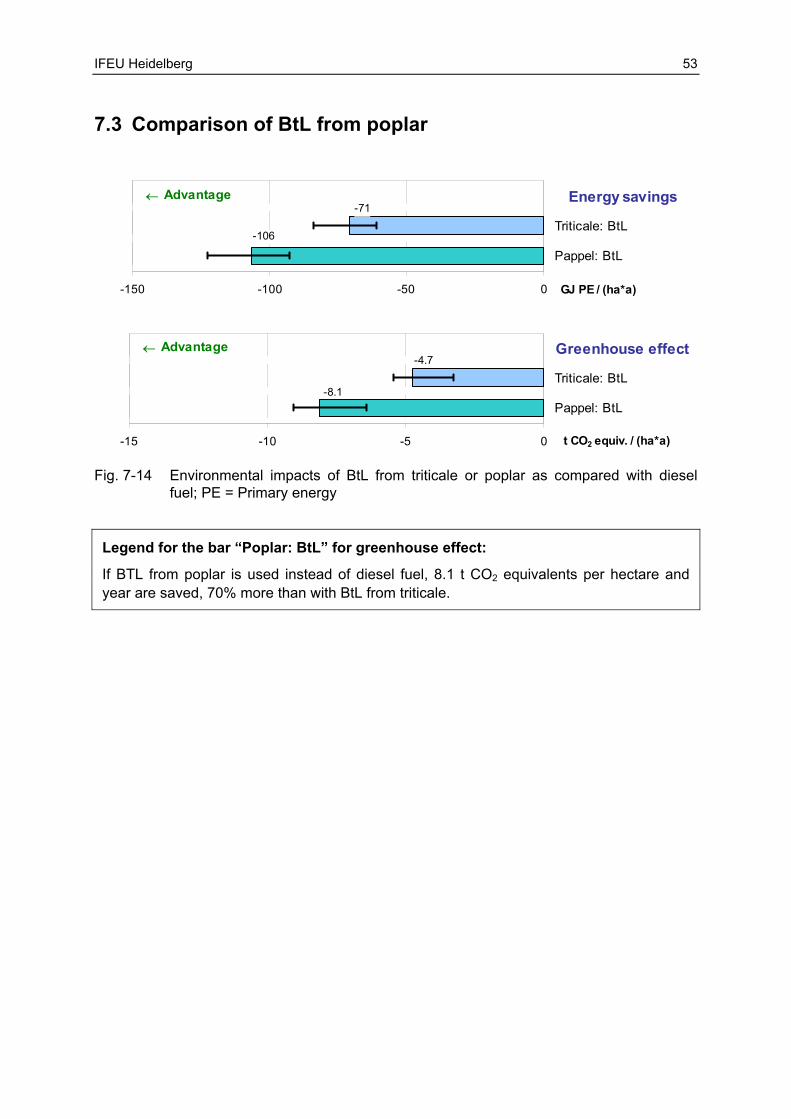
IFEU Heidelberg 53
7.3 Comparison of BtL from poplar
Energy savings-71
-106
-150 -100 -50 0
Triticale: BtL
Pappel: BtL
GJ PE / (ha*a)
← Advantage
Greenhouse effect-4.7
-8.1
-15 -10 -5 0
Triticale: BtL
Pappel: BtL
t CO2 equiv. / (ha*a)
← Advantage
Fig. 7-14 Environmental impacts of BtL from triticale or poplar as compared with diesel
fuel; PE = Primary energy
Legend for the bar “Poplar: BtL” for greenhouse effect:
If BTL from poplar is used instead of diesel fuel, 8.1 t CO2 equivalents per hectare and year are saved, 70% more than with BtL from triticale.

54 IFEU Heidelberg
7.4 Comparisons: Expanded scenarios
Energy savings-78
-71
-87
-90
-192
-190
-194
-195
-435
-78
-71
-87
-90
-192
-191
-194
-195
-224
-127
-126
-122
-124
-127
-127
-123
-124
-350
-349
-346
-347
-347
-346
-350
-350
-500 -400 -300 -200 -100 0
Ethanol (EtOH)
BtL
Electricity
Electricity & heat (cogeneration)
Grain: EtOH / Straw: EtOH
Grain: EtOH / Straw: BtL
Grain: EtOH / Straw: Electricity
Grain: EtOH / Straw: Cogeneration
Grain: EtOH / Straw: EtOH
Grain: EtOH / Straw: BtL
Grain: EtOH / Straw: Electricity
Grain: EtOH / Straw: Cogeneration
Ethanol
GJ PE / (ha*a)
← Advantage
Sugar beet
Beet pulp vs barley
Beet pulp vs beet pulp
Sugar beet
Triticale
Wheat I
Wheat II
Triticale
Wheat I
Fig. 7-15 Results from all selected life cycle comparisons for the expanded "Barley" and
"Beet pulp" scenarios for energy savings. Left partial bar for Wheat I: Credit for gluten; PE = Primary energy

IFEU Heidelberg 55
Greenhouse effect-4.3
-4.7
-5.9
-5.8
-14.1
-14.2
-14.5
-14.5
-33.0
-4.3
-4.7
-5.9
-5.8
-14.1
-14.3
-14.5
-14.5
-17.6
-8.6
-8.6
-8.4
-8.3
-8.6
-8.7
-8.3
-8.4
-25,0
-25,1
-24,8
-24,7
-25,0
-25,0
-24,8
-24,7
-50 -40 -30 -20 -10 0
Ethanol (EtOH)
BtL
Electricity
Electricity & heat (cogeneration)
Grain: EtOH / Straw: EtOH
Grain: EtOH / Straw: BtL
Grain: EtOH / Straw: Electricity
Grain: EtOH / Straw: Cogeneration
Grain: EtOH / Straw: EtOH
Grain: EtOH / Straw: BtL
Grain: EtOH / Straw: Electricity
Grain: EtOH / Straw: Cogeneration
Ethanol
t CO2 equiv. / (ha*a)
← Advantage
Sugar beet
Beet pulp vs barley
Beet pulp vs beet pulp
Sugar beet
Triticale
Wheat I
Wheat II
Triticale
Wheat I
Wheat II
Fig. 7-16 Results from all selected life cycle comparisons for the expanded "Barley" and
"Beet pulp" scenarios for the greenhouse effect. Left partial bar for Wheat I: Credit for gluten