biodiversity for business - international union for ... · and opportunities for business by...
TRANSCRIPT

Biodiversity for BusinessA guide to using knowledge products deliveredthrough IUCN
International Union for Conservation of Nature
INTERNATIONAL UNIONFOR CONSERVATION OF NATURE
WORLD HEADQUARTERSRue Mauverney 281196 Gland, SwitzerlandTel: +41 22 999 0000Fax: +41 22 999 0002www.iucn.org

Biodiversity for BusinessA guide to using knowledge products delivered through IUCN

The designation of geographical entities in this book, and the presentation of the material, do not imply the expression of any opinion whatsoever on the part of IUCN and WBCSD concerning the legal status of any country, territory, or area, or of its authorities, or concerning the delimitation of its frontiers or boundaries.
The views expressed in this publication do not necessarily reflect those of IUCN and WBCSD.
This publication has been made possible by funding from the WBCSD, the IUCN Business and Biodiversity Programme, and the IUCN Biodiversity Conservation Group. This Report has been coordinated and compiled by Diego Juffe-Bignoli (IUCN) with support from Giulia Carbone (IUCN), Violaine Berger (WBCSD), Jane Smart (IUCN), and Tom Brooks (IUCN).
Published by: IUCN, Gland, Switzerland
Copyright: © 2014 International Union for Conservation of Nature and Natural Resources
Reproduction of this publication for educational or other non-commercial purposes is authorized without prior written permission from the copyright holder provided the source is fully acknowledged.
Reproduction of this publication for resale or other commercial purposes is prohibited without prior written permission of the copyright holder.
Citation: IUCN (2014). Biodiversity for Business: A guide to using knowledge products delivered through IUCN. Gland, Switzerland: IUCN. 48pp.
ISBN: 978-2-8317-1649-7
Reading & corrections: Christopher Tribe
Layout by: Chadi Abi Faraj - www.chadiabi.com
Printed by: Solprint - Mijas - Malaga (Spain)
Available from: IUCN (International Union for Conservation of Nature) Global Business and Biodiversity Programme Rue Mauverney 28 1196 Gland Switzerland Tel +41 22 999 0000 Fax +41 22 999 0020 [email protected] www.iucn.org/business
The text of this book is printed on 130gsm CyclusPrint FSC® recycled certified paper.

iii
Acknowledgements ........................................................................................................................................................................................ vi
Executive summary ........................................................................................................................................................................................ vii
Part 1 - The knowledge products ................................................................................................................................................................... 01
1.1. Introduction ........................................................................................................................................................................................ 0 � 1
1.2. The IUCN Red List of Threatened Species � TM .......................................................................................................................... 06
1.3. Protected Planet (powered by the World Database on Protected Areas) ............................................................ 09 �
1.4. Key Biodiversity Areas ................................................................................................................................................................... 1 � 2
1.5. The Red List of Ecosystems .............................................................................................................................................. 15 �
1.6. Tools to support access to and use of the knowledge products ............................................................ 18 �
Part 2 - How have companies been using these knowledge products? ............................................................ 20
2.1. Introduction ........................................................................................................................................................................................ 20 �
2. � 2. Single-sector examples ................................................................................................................................................................... 21
2.3. Cross-sector examples ................................................................................................................................................................... 32 �
Key definitions and acronyms ................................................................................................................................................................... 38
References ............................................................................................................................................................................................................. 39
Table of Contents

iv

v
IUCN, International Union for Conservation of Na-ture, helps the world find pragmatic solutions to our most pressing environment and development challenges.
IUCN’s work focuses on valuing and conserving na-ture, ensuring effective and equitable governance of its use, and deploying nature-based solutions to global challenges in climate, food and develop-ment. IUCN supports scientific research, manages field projects all over the world, and brings govern-
ments, NGOs, the UN and companies together to develop policy, laws and best practice.
IUCN is the world’s oldest and largest global envi-ronmental organization, with more than 1,200 government and NGO Members and almost 11,000 volunteer experts in some 160 countries. IUCN’s work is supported by over 1,000 staff in 50 offices and hundreds of partners in public, NGO and pri-vate sectors around the world.
The World Business Council for Sustainable Devel-opment (WBCSD) is a CEO-led organization of for-ward-thinking companies that galvanizes the global business community to create a sustainable future for business, society and the environment. Together with its members, the Council applies its respected thought leadership and effective advocacy to gen-erate constructive solutions and take shared action. Leveraging its strong relationships with stakehold-ers as the leading advocate for business, the Coun-cil helps drive debate and policy change in favour of sustainable development solutions.
The WBCSD provides a forum for its 200 member companies—who represent all business sectors, all continents and a combined revenue of more than US$ 7 trillion—to share best practices on sustaina-ble development issues and to develop innovative tools that change the status quo. The Council also benefits from a network of 60 national and regional business councils and partner organizations, a ma-jority of which are based in developing countries.
After decades of working together, in 2013 the WBCSD became a Member of IUCN. This was a mile-stone in terms of enhanced collaboration and business engagement, allowing for scaled-up solutions on the way to achieving IUCN’s Vision: a just world that values and conserves nature.
About IUCN
About WBCSD
www.iucn.org
www.wbcsd.org

vi
Biodiversity for Business: A guide to using knowledge products delivered through IUCN
AcknowledgementsThis guide was developed by the International Union for Conservation of Nature (IUCN) in close collaboration with the World Business Council for Sustainable Development (WBCSD) and its member companies. We are very grateful to the following people for their time, advice and help in completing this work:
Deviah Aima (IUCN), Violeta Barrios (IUCN), Ed Barrow (IUCN), Mathew Bateson (Rio Tinto), Leon Bennun (BirdLife International), Violaine Berger (WBCSD), Maria Ana Borges (IUCN), Thomas Brooks (IUCN), Ellen Brown (Proforest), Gerard Bos (IUCN), Kaia Boe (IUCN), Stuart Butchart (BirdLife International), Florence Clap (IUCN France), Annabelle Cuttelod (IUCN), Giulia Carbone (IUCN), Roberto Crotti (WEF), Frances Douglas (GE), Nigel Dudley (Equilibrium), Stephen Edwards (IUCN), Lincoln Fishpool (BirdLife International), Laura Fox (Fauna & Flora International), Ana González de Aledo (Votorantim), Bernhard Grunauer (Eon),
Paula Guimarães (Portucel Soporcel Group), Frank Hawkins (IUCN), Craig Hilton-Taylor (IUCN), Mike Hoffmann (IUCN), Jon Hutton (UNEP-WCMC), David Hughell (Rainforest Alliance), Richard Jenkins (IUCN), Matt Jones (UNEP-WCMC), Mikkel Kallesoe (Shell), Rashila Kerai (Holcim), Naomi Kingston (UNEP-WCMC), Katja Kriege (GRI), Penny Langhammer (Arizona State University), Anna Lyons (Fauna & Flora International), Nadine McCormick (IUCN), Jeff Milder (Rainforest Alliance), Rebecca Miller (IUCN), Tina Miranda-Oliveira (Provita), Maria Estela Nucci (Eni), John Pilgrim (The Biodiversity Consultancy), Duncan Pollard (Nestle), Hugo Rainey (The Biodiversity Consultancy), Dawn Rittenhouse (DuPont), Jon Paul Rodriguez (Instituto Venezolano de Investigaciones Cientificas), Conrad Savy (International Finance Corporation), Jane Smart (IUCN), Martin Sneary (IUCN), Melissa Tolley (UNEP-WCMC), Stephen Woodley (IUCN), Eva Zabey (WBCSD).

vii
Executive SummaryKnowledge products for businessBiodiversity—which includes all life on earth—un-derpins ecosystem services, provides natural re-sources and constitutes our natural capital. No matter how complex a supply chain or production process is, biodiversity always supports it. If there is no biodiversity, there is no business. Conversely, companies are major players in the wider land-scape and as such are responsible for their impact on biodiversity and ecosystem services and how this impact might affect local actors. How can businesses manage these complex interactions and make investments and operations less risky and more efficient?
The first requirement is to know where these biodi-versity impact-related risks and opportunities lie. For more than five decades, Members, Commis-sions, the Secretariat and partners of the Interna-tional Union for Conservation of Nature (IUCN) have been making this information available through what are termed ‘knowledge products’. These are platforms or baskets of knowledge that comprise assessments of authoritative biodiversity informa-tion supported by standards, guidelines, data, tools, capacity building and tangible products (see sec-tion 1.1. for a definition). Knowledge products will not provide businesses with all solutions at all lev-els but, when combined with other ecological data and surveys, will play a fundamental role in doing so. Knowledge products provided through IUCN are easily accessible but are subject to strict terms and conditions of use (see sections 1.1 and 1.6 for more information). Two examples of globally re-nowned knowledge products are The IUCN Red List of Threatened Species™ and Protected Planet, powered by its underlying database, the World Da-tabase on Protected Areas.
Although knowledge products are widely recog-nized and leveraged by conservation organizations, they could also be used more extensively by the private sector, to support sustainability strategies. IUCN has thus chosen to join forces with the World Business Council for Sustainable Development (WBCSD) to develop this manual that is specifically targeted at companies, and aims to expand busi-
ness awareness and understanding on the use of these knowledge platforms.
What this guide doesThe main goal of this guide is to improve under-standing and promote more and better use of these knowledge products to inform environmen-tal risks and opportunities in business operations. The aim is to show how knowledge products can help in assessing, valuing, managing and reporting on businesses’ impacts and dependencies on bio-diversity, and in achieving compliance with envi-ronmental standards and certification schemes. The guide focuses on four knowledge products:
The IUCN Red List of Threatened Species � TM which assesses the risk that species will be-come extinct;Protected Planet (powered by the World �Database on Protected Areas) which docu-ments the extent, quality and diversity of pro-tected areas;Key Biodiversity Areas � which identifies areas of global significance for biodiversity;The Red List of Ecosystems � which assesses the risk that ecosystems will collapse.
The first three in this list are already included in nu-merous environmental standards, safeguard poli-cies and certification schemes, and are used by businesses to inform a range of decisions and to report on their environmental performance (see Part 2 of this guide). The identification of Key Biodi-versity Areas, led by many IUCN Members and part-ner organizations, dates back nearly four decades but is only now being consolidated as a knowledge product. The Red List of Ecosystems is proposed as a new knowledge product, and is as yet under-pinned only by pilot datasets.
This guide has been developed for business man-agers, environment department managers and en-vironmental consultants. It will also be useful to a broader audience interested in the knowledge products available through IUCN. It is divided into two parts:

viii
Biodiversity for Business: A guide to using knowledge products delivered through IUCN
Part 1 - The knowledge productsIntroduction to knowledge products: what �they are and why they are relevant to busi-ness.Description of each knowledge product �through answers to five questions:
What does it do?1. Defines terms, explains the purpose of the knowledge product.How does it work?2. Describes the framework, the scope and the processes underpinning the knowledge product.What does it produce?3. Describes the outputs (tools, data, etc.).How can it be used?4. Summarizes applica-tions for businesses.How can the data be accessed?5. Provides guidance on where and how to access the information.
Part 2 - How have companies been using these knowledge products? Short examples of how the knowledge products have been and are being used by companies in dif-ferent contexts and sectors.
What this guide does not doThis guide is not a detailed account of the techni-cal and complex stakeholder processes behind each knowledge product, nor is it a step-by-step technical guide on how to integrate information contained in the knowledge products into compa-nies’ operations. Rather it aims to provide a general overview of how using these products can assist businesses in their operations.
In order to assess and manage the risks and opportunities associated with biodiversity �management and impact, companies need access to a wide range of ecological data, in-cluding geographically referenced biodiversity datasets combined with site surveys.
Knowledge products delivered through IUCN play an important role in informing risks �and opportunities for business by providing authoritative biodiversity information sup-ported by standards, guidelines, geographically referenced data, and tools.
The individual sections for each of the four knowledge products in Part 1 of this guide �and the 14 specific examples in Part 2 suggest numerous applications of these knowledge products for the private sector. Some of these are:
Identification of sensitive areas during screening processes and baseline sur-•veys, which will highlight areas of high biodiversity value and inform Environmental and Social Impact Assessments (ESIAs);
Support in implementing the mitigation hierarchy• (avoidance, minimization, restoration and rehabilitation, and offsets), especially the avoidance phase and the initial stages of offset design;
Compliance with environmental standards, certification schemes and biodi-•versity safeguard policies, such as identification of critical habitats and sustainable production standards (e.g. International Finance Corporation Performance Standard 6, or the Forest Stewardship Council standard);
Support for the implementation of companies’ biodiversity management sys-•tems;
Providing key information for reporting company’s environmental footprint• , by following, for example, the Global Reporting Initiative’s sustainability reporting guidelines.
Developing, producing, maintaining and updating knowledge products through a sustain- �able financing model is essential, not only to ensure the quality and increase the geographi-cal coverage of the information, but also to keep it up to date and to avoid misinformed decisions that could adversely affect both business and biodiversity.
Knowledge products are easily accessible through a number of access points although �use by companies is subject to strict terms and conditions (section 1.1. and 1.6).
Key
Mes
sage
s

1
Part 1 - The Knowledge Products
Part 1 - The Knowledge Products
What are knowledge products? The International Union for Conservation of Nature (IUCN) is unique in that it brings together govern-ments, non-governmental organizations and scien-tists to work towards a common vision and mission (figure 1), in partnership with businesses and com-munities. As a science-based organization, IUCN provides a wide range of knowledge to inform so-ciety’s decisions on how to value and conserve na-ture equitably. It is through this union, under the mandate of the IUCN 2013–2016 Programme1, that
knowledge products are developed, maintained, updated and disseminated.
Knowledge products are platforms or baskets of knowledge that comprise assessments of authori-tative biodiversity information supported by stand-ards, guidelines, data, tools, capacity-building and tangible products (box 1). They are mobilized by IUCN’s Members, Commissions, Secretariat and partners, using networks of experts and strict vali-dation processes.
VISION A just world that values and conserves nature
MISSION To influence, encourage and assist societies through-out the world to conserve the integrity and diver-sity of nature and to ensure that any use of natural resources is equitable and ecologically sustainable.
IUCN2013–2016
PROGRAMME
Providing knowledge
products
Delivering results on
the ground
Engaging and leveraging the
union
Strengthening policy and
governance
Figure 1 – IUCN’s Programme delivers a vision and mission shared by Members, Commissions and Secretariat.
MEMBERS(1,226 members)
90 States �119 Government �> 1,000 NGOs & �affiliates
COMMISSIONS (11,000 EXPERTS)Commission on Ecosystem Management �(CEM)Commission on Education and �Communication (CEC)Commission on Environmental, Economic, and �Social Policy (CEESP)World Commission on Environmental Law �(WCEL)Species Survival Commission (SSC) �World Commission on Protected Areas (WCPA) �
SECRETARIAT(>1,000 staff)Around 50 National �and Regional Offices, and Specialist Centres
1 https://cmsdata.iucn.org/downloads/iucn_programme_2013_2016.pdf.
Introduction1.1
Four Business Lines

2
Developing, producing, maintaining and updating knowledge products requires considerable resourc-es. Currently, these are provided by governments, non-profit organizations, foundations, the private sector and a large network of volunteers. Despite these contributions, the maintenance of these knowledge products is not yet fully resourced. The long-term sustainable financing model for main-taining the knowledge products is fundamentally important, not only to ensure the quality and in-crease the geographical coverage of the informa-tion, but also to keep it up to date and to avoid misinformed decisions that could adversely affect both business and biodiversity.
Knowledge products in this guide This guide focuses on four knowledge products that are particularly relevant for business:
The IUCN Red List of Threatened Species � TM which assesses the risk that species will be-come extinct;Protected Planet � (powered by the World Database on Protected Areas) which docu-ments the extent, quality and diversity of pro-tected areas;Key Biodiversity Areas (KBAs) � which identify areas of global significance for biodiversity;The Red List of Ecosystems � which assesses the risk that ecosystems will collapse.
The first three products are already included in nu-merous environmental standards, safeguard poli-cies and certification schemes, and are used by businesses to inform a range of decisions and to report on their environmental performance (see Part 2 of this guide). The identification of Key Bio-diversity Areas, led by many IUCN Members and partner organizations, dates back nearly four dec-ades but is only now being consolidated as a knowledge product through IUCN (section 1.4). The Red List of Ecosystems is proposed as a new knowledge product, as yet underpinned only by pilot datasets, but when complete it will contain assessments of the risk that particular ecosystems will collapse (section 1.5). As the 2013–2016 IUCN Programme states, in addition to these four knowl-edge products, IUCN is in the early stages of devel-oping two more: a Human Dependency on Nature Framework and a Natural Resource Governance Framework. Other notable examples of tools al-ready available through IUCN are the environmen-tal law database ECOLEX (www.ecolex.org) and the Global Invasive Species Database (www.issg.org/database/welcome), which is being linked to The IUCN Red List of Threatened SpeciesTM.
Information from the four knowledge products dealt with in this guide can help businesses to manage the risks and opportunities associated with their impact on biodiversity (table 1). In most cases,
Six common components of knowledge products delivered through IUCN
Standards: � developed through inclusive international participatory processes involving IUCN Members, Commissions, Secretariat and partners. The standards must meet a recognised conservation need and be scientifically driven, transparent and repeatable.
Guidelines: � on how to apply the methodology, submit data, or understand the governance processes that underpin each knowledge product.
Data: � underpinning the information provided by knowledge products, including maps, population estimates, threats to species or ecosystems, boundaries of protected areas, etc.
Tools: � such as online databases and online mapping tools, to assist a range of users in handling the data delivered by the knowledge products.
Capacity building: � to promote and ensure more and better use of the products and to avoid risks resulting from misuse.
Products: � in the form of reports, scientific papers, websites, factsheets, booklets and policy briefs.
Box
1

3
Part 1 - The Knowledge Products
knowledge products alone will not provide all the answers at all levels. Especially at site level, they will need to be combined either with additional eco-logical data and tools or with other knowledge products. For example, The IUCN Red List of Threat-ened SpeciesTM will provide information about threatened species that might be found in the area where a company is operating or plans to operate. However, surveys at site scale, usually carried out by local biodiversity experts, will be needed to con-
firm the presence and abundance of those particu-lar species at the site.
Use of the knowledge products by businessesAs with any kind of publicly available biodiversity information, use of these knowledge products is governed by strict terms and conditions. Use by or on behalf of companies is classed as commercial use (see definition) which means that to use the in-formation previous agreement with data providers
Table 1 - How knowledge products can help businesses manage risks (R) and opportunities (O)?2
OperationalDay-to-day company activities, spending and processes
R- Biodiversity information can inform operational risks related to biodiversity impact (e.g. through Environmental and Social Impact Assessments or Biodiversity Action Plans).
O- Mainstreaming biodiversity information and monitoring biodiversity impacts across company operations can reduce overall project costs.
Regulatory and LegalInfluence of government policies and laws
R- Knowledge products can raise early warning flags about the potential presence of threatened species, protected areas or areas of high biodiversity value near or within a proposed project area.
O- Companies can improve their legal and regulatory compliance by adopting different practices in or near protected areas and areas of high biodiversity value.
ReputationalCompany brand, image and relationships with stakeholders
R- Companies can avoid risks to their reputations by considering potential harmful impacts on species, protected areas, ecosystems and areas of high biodiversity value when screening projects.
O- Companies can improve their reputations and secure licences to operate by putting in place mechanisms to minimize biodiversity impact or by playing an active role in nature conservation activities and projects.
Market and ProductProduct and service offerings, customer preferences and other market factors
R- Companies can anticipate changes in consumer preferences and forestall damage to their brand image by considering their potential impacts on species, protected areas, ecosystems and areas of high biodiversity value.
O- New markets for sustainably sourced products and environmentally friendly production can open up to companies that take on board the information provided by knowledge products in order to comply with certification schemes and standards.
FinancingCost and availability of capital to companies
R- Use of knowledge products is fundamental for ensuring compliance with banks’ safeguard policies for project financing, which explicitly mention them.
O- Companies can secure more favourable loan terms by reporting their impacts and dependencies on biodiversity and ecosystems, and integrating that information into company policies and procedures.
2 Hanson et al., 2012.

4
Biodiversity for Business: A guide to using knowledge products delivered through IUCN
is required. Section 1.6 provides guidance on how to access the data and information delivered by knowledge products.
Knowledge products delivered through IUCN can be and in fact have been used by the private sec-tor in a number of important contexts related to environmental risk and biodiversity impact man-agement (box 2). The mitigation hierarchy is per-haps one the most accepted frameworks and is considered a best-practice approach to biodiversi-ty risk management. It focuses on management for specific outcomes rather than on generic proc-esses. However, the mitigation hierarchy does not include other important business activities such as global reporting or compliance with standards, certification schemes and safeguard policies. Due to its relevance and uptake in the sector, the miti-gation hierarchy is explained in detail in box 3 and examples included in this guide also feature one or more of the mitigation hierarchy phases.
What is commercial use?The definition of commercial use with respect to the knowledge products is: a) use by any individual or non-profit entity for the purposes of revenue gen-eration or b) any use by, on behalf of, or to inform or assist the activities of an entity that operates ‘for profit’. This definition is consistent with the classi-fication of knowledge products as glo-bal public goods. Global public goods are non-rival (use by one party does not reduce their availability to others) and non-excludable (their use is available to all globally).3 Knowledge products delivered through IUCN are regarded as global public goods.
Defi
nitio
n
Key applications of knowledge products
Identification of sensitive areas during screening processes and baseline surveys: � Knowl-edge products provide fundamental information for conducting Environmental and Social Im-pact Assessments (ESIAs) and identifying areas of potential biodiversity impact.
Application of the mitigation hierarchy: � Knowledge products support the implementation of the mitigation hierarchy (avoidance, minimization, restoration and rehabilitation, and off-sets), especially the avoidance phase and the initial stages of offset design.
Compliance with environmental standards, certification schemes and biodiversity safe- �guard policies: Knowledge products support and ensure compliance in situations that some-times explicitly require their use (e.g. in the identification of critical habitats).
Implementation of companies’ biodiversity management systems: � Knowledge products can be used to inform biodiversity strategies and monitor and improve resource allocation for Biodiversity Action Plans or Catchment Management Plans.
Valuation of ecosystem services: � Knowledge products can be used to place a value on the services that may be lost if species or ecosystems are adversely affected, or on the benefits that may accrue from biodiversity and ecosystems management. Valuation can also help in natural capital accounting to evaluate trade-offs in biodiversity management scenarios.
Communications and biodiversity awareness raising: � Knowledge products enhance knowl-edge of biodiversity issues through capacity building at specific sites or corporate levels.
Box
2
3 Kaul et al., 1999.

5
Part 1 - The Knowledge Products
The Mitigation Hierarchy
The mitigation hierarchy is a framework that enables businesses to manage environmental impacts across different phases of a particular project cycle. The mitigation hierarchy includes the following sequential actions:
Avoidance: � measures taken to avoid creating impacts from the outset, such as careful spatial or temporal placement of infrastructure elements to prevent any impact on certain components of biodiversity;
Minimization: � measures taken to reduce the duration, intensity and/or extent of impacts (includ-ing direct, indirect and cumulative impacts, as appropriate) that cannot be completely avoided, as far as is practically feasible;
Rehabilitation/restoration: � measures taken to rehabilitate degraded ecosystems or restore cleared ecosystems following exposure to impacts that cannot be completely avoided or mini-mized, in order to achieve no net loss or a net gain of biodiversity;
Offset: � measures taken to compensate, in a like-for-like (or better) fashion, for any residual sig-nificant adverse impacts that cannot be avoided or minimized, in order to achieve no net loss or a net gain of biodiversity.
The steps in the mitigation hierarchy are likely to overlap during the life of a project. For example, restoration and rehabilitation efforts might occur while offsetting activities are being implemented. In any case, rehabilitation/restoration and biodiversity offsets should only be considered as a last option after a company has implemented the other steps in the mitigation hierarchy. In addition, it is critical to be aware that rehabilitation/restoration and biodiversity offsets are not always possible. Not all impacts on biodiversity can be compensated for and some biodiversity features, because of their high value either for biodiversity or for people (or both), are simply not offsetable.4
The mitigation hierarchy is a valid framework for companies to adopt to achieve No Net Loss (NNL) or Net Positive Impact (NPI) at the end of a project cycle. NNL implies no biodiversity losses whereas NPI corresponds to a gain in biodiversity. Notable examples of endeavours to implement the NPI framework are two pioneering projects by Rio Tinto in Madagascar and Mongolia, which are de-scribed in example 7, page 27.
Supporting Conservation Actions (SCAs): Compensation actions that cannot be counted as off-sets may be considered supporting conservation actions or additional conservation actions. They cannot be included in metrics to assess offsets or measure progress towards NNL or NPI, although they can still be beneficial for biodiversity. Examples might be environmental education or support for research on data-deficient ecosystems.
Box
3
4 For more information about offset definitions and design and key challenges when implementing offsets, see ICMM & IUCN, 2012; Gardner et al., 2013; Pilgrim et al., 2013; and BBOP case studies (http://bbop.forest-trends.org/pages/pilot_projects).
Sour
ce: A
dapt
ed fr
om IC
MM
& IU
CN, 2
012

6
Biodiversity for Business: A guide to using knowledge products delivered through IUCN
What does it do? The IUCN Red List of Threatened SpeciesTM provides assessments of the risk that species will become extinct in order to inform and catalyse action for biodiversity conservation.
How does it work?The risk of extinction of a particular species is as-sessed through the application of a standardized risk assessment methodology.5 Five criteria (A to E - figure 2) are applied to each species and at a specific scale. Species are then assigned to one of eight Red List categories according to whether they meet the quantitative thresholds under at least one of the five criteria. Assessments are undertaken by a wide network of experts and scientists around the world, convened through the IUCN’s Species Survival Commission or engaged through IUCN’s partner organizations, who compile the best avail-able information to assess the extinction risk of a species. An independent review process precedes
What are threatened species according to IUCN?These are species categorized as Critically Endangered, Endangered or Vulnerable by The IUCN Red List of Threatened SpeciesTM. Not all species on the list are threatened: some may be common (e.g. some of those listed as Least Concern), while others may al-ready be Extinct. Inclusion of a species on The IUCN Red List of Threatened SpeciesTM does not necessarily mean that it should be a priority for any par-ticular kind of conservation action, or that legal regulations automatically apply to it in any country or region. Setting priorities and introducing reg-ulations are subsequent stakeholder decisions, which should be informed by an understanding of extinction risk along with other factors.
Defi
nitio
n
Figure 2 - Assessment criteria and risk categories used by The IUCN Red List of Threatened SpeciesTM
5 IUCN, 2012 and Mace et al., 2008.
A. Population reduction
B. Restricted geographic range and decline
D. Very small or restricted population
C. Small population size and decline
E. Quantitative risk analysis
Criteria
Thre
shol
ds
Categories
The IUCN Red List of Threatened SpeciesTM1.2

7
Part 1 - The Knowledge Products
publication on The IUCN Red List of Threatened SpeciesTM.
The IUCN Red List of Threatened SpeciesTM focuses on global assessments of the extinction risk for ani-mal, plant and fungi species. The methodology can also be applied at regional or national levels (sub-global scale). This means that a species may not be threatened at a global level but may be highly threatened at a national level, or (unusually) vice versa. IUCN provides guidelines in support of such sub-global assessments, but does not usually en-dorse them. The IUCN Red List of Threatened Spe-
ciesTM is a joint effort between IUCN and a number of Red List Partners: currently BirdLife International; Botanic Gardens Conservation International; Con-servation International; Microsoft; NatureServe; the Royal Botanic Gardens, Kew; Sapienza University of Rome; Texas A&M University; Wildscreen; and the Zoological Society of London.
What does it produce? The key outputs from any IUCN Red List assessment are an assigned Red List Category, a georeferenced map of the species’ distribution, and supporting in-formation on the species’ population, ecology,
Understanding The IUCN Red List of Threatened SpeciesTM distribution mapsEach species assessment includes a map showing the known distribution range of the species. However, depending on the information available, maps can vary greatly in their resolution and accuracy. For this reason, maps cannot be used to confirm the presence of a species at a particular site unless the distribution range of the species falls entirely within the site or is confirmed by the existence of a Key Biodiversity Area for which the species has qualified (section 1.4).
Info
Background: The Venezuelan Fish-eating Rat (Neusticomys venezuelae) is listed as Vulnerable by the IUCN Red List of Threatened SpeciesTM due to population decline and restricted populations. It is a habitat specialist (dependent on clear streams), known only from Venezuela and Guyana, and is estimated to be declining rapidly due to over-exploitation, shrinkage in distribution, and habitat destruction and degradation.6
6 Ochoa and Rivas 2008.

8
Biodiversity for Business: A guide to using knowledge products delivered through IUCN
threats and conservation actions that need to be put in place to reduce this risk of extinction. All these are available at: www.iucnredlist.org.
How can it be used? Identification of sensitive areas during screen- �ing processes and baseline surveys: The Red List highlights species that are potentially present and require confirmation during baseline surveys for Environmental and Social Impact Assessments (ESIAs). Shell has used the data for this purpose, as example 6 (page 26) shows.Application of the mitigation hierarchy: � When species are confirmed to occur at a site and im-pacts cannot be avoided, information in the species assessments can be used to identify key threats to be minimized or to decide which species may require Biodiversity Action Plans or habitat restoration plans. For offset design, the distribution ranges of species can contribute to biodiversity offset measurement. Example 7 (page 27) describes how Rio Tinto has used The IUCN Red List of Threatened SpeciesTM to inform application of the mitigation hierarchy.Supporting conservation actions (SCAs): � IUCN Red List assessments provide information on the conservation actions needed, including options for SCAs such as research on Data Deficient spe-cies to assess their extinction risk.
Compliance with environmental standards, �certification schemes and biodiversity safe-guard policies: The Forest Stewardship Council or the Responsible Jewellery Council standards (example 12, page 32, and example 14, page 36), for instance, require consideration of threatened species for compliance. The IUCN Red List is also relevant for the implementation of safeguard policies—to identify critical habitats (example 8, page 28).Valuation of ecosystem services: � By focusing on assessed species (for which supporting docu-mentation is available on use, livelihoods and ec-osystem services), companies can place a value on the services that may be lost if the species in question becomes extinct, or on the benefits that may accrue from good species management.Reporting a company’s environmental foot- �print: The Global Reporting Initiative biodiversity indicator G4-EN14 is based on The IUCN Red List of Threatened SpeciesTM (example 13, page 34).
How can the data be accessed?The IUCN Red List of Threatened SpeciesTM is sub-ject to terms and conditions of use (www.iucnredlist.org/info/terms-of-use). For commercial use it can be accessed directly through the Integrated Biodiversity Assessment Tool (IBAT) at www.ibatforbusiness.org.
© Jo
aqui
m P
edro
Fer
reira
, Por
tuce
l Sop
orce
l Gro
up

9
Part 1 - The Knowledge Products
What does it do? Protected Planet is an initiative that documents the status, extent, diversity and quality of the world’s protected areas. Its underlying database is the World Database on Protected Areas (WDPA), which is the only global inventory of protected areas; it in-cludes the United Nations List of Protected Areas, which is mandated by the United Nations.
How does it work?Protected Planet, a joint initiative between IUCN and UNEP, is managed by the UNEP World Conser-vation Monitoring Centre (UNEP-WCMC). Govern-ments collect and submit information to WDPA managers to maintain the accuracy of the UN List of Protected Areas dataset. Additional data provid-
What is a protected area?IUCN defines a protected area as ‘A clearly defined geographical space, recognised, dedicated and man-aged, through legal or other effec-tive means, to achieve the long-term conservation of nature with associ-ated ecosystem services and cultural values’.7 All protected areas submitted to the World Database on Protected Areas should comply with this defini-tion. The Convention on Biological Di-versity (CBD) also uses a definition of protected areas which is equivalent to IUCN’s definition.8
Defi
nitio
nFigure 3 - Sources of information and key requirements for Protected Planet
7 Dudley, 2008.
8 Lopoukhine and Ferreira de Souza Dias, 2012: https://cmsdata.iucn.org/downloads/editorial_18_1.pdf.
Data ProvidersNon-governmental organizationsRegional data providersInternational secretariats
Local authorities and expertsNational data providersWorld Commission on Protected Areas
Key requirements for data providers(compulsory)
Protected areas should fit the IUCN �definition.Georeferenced information of the protected �area’s location should be given. Data must comply with the WDPA data �standard and include the minimum required attributes. Source of information for the data must be �provided.
IUCN Protected Area Management Categories (recommended but not compulsory)
Ia Strict nature reserveIb Wilderness areaII National parkIII Natural monument or featureIV Habitat/species management areaV Protected landscape/seascapeVI Protected area with sustainable use of
natural resources
Word Database on Protected Areas
Val
idat
ion
Protected Planet (powered by the World Database on Protected Areas)1.3

10
Biodiversity for Business: A guide to using knowledge products delivered through IUCN
ed by non-governmental organizations form part of the WDPA dataset, although they are not included on the UN List of Protected Areas. Data providers must comply with a number of key requirements that ensure the consistency and accuracy of the data in the WDPA (figure 3). Finally, the WDPA data can be accessed through the Protected Planet web-site (www.protectedplanet.net).
Protected Planet has global coverage. It includes areas protected nationally (e.g. national parks) and regionally (e.g. Natura 2000 sites), as well as areas designated by countries under international con-ventions and agreements (e.g. UNESCO World Heritage Natural sites and Ramsar Wetlands of In-ternational Importance). For some areas, Protected
Planet also includes their classification under the IUCN protected area management categories (fig-ure 3). These class protected areas according to their management objectives. Although it is best practice to do so, countries or territories are not obliged to use the IUCN categories. There are six categories, from I (strict nature reserve) to VI (pro-tected area with sustainable use of natural re-sources). Since this scale reflects management and not conservation priorities, Category I areas are more strictly protected than Category VI, but not necessarily more important for biodiversity.9
What does it produce?Protected Planet produces www.protectedplanet.net, which is a tool for displaying, mapping and
Understanding Protected Planet mapsThe map shows the protected area boundaries as submitted by the data provider so business and other users can see where their current or planned activities lie in relation to protected areas. If there are no boundaries available for a particular protected area, a geographically referenced point is provided. Each mapped protected area has a unique WDPA identifier that links the georefer-enced maps with the tabular information required by the WDPA data standard (figure 3).
Info
9 For more information on IUCN Protected Area Management Categories, see Dudley et al., 2008.
10 IUCN and UNEP-WCMC 2014.
Background: Canaima National Park is a World Heritage site of over 3 million hectares located in south eastern Venezuela. It is classed as Category II – National Park - according to the IUCN Protected Area Management catego-ries.10

11
Part 1 - The Knowledge Products
contributing information on protected areas. It presents spatial data and descriptive information from the WDPA as well as images and information overlays from other external sources. More impor-tantly, the Protected Planet initiative also produces reports on the status and global trends of protect-ed areas.11
How can it be used?Identification of sensitive areas during screen- �ing processes and baseline surveys: This knowl-edge product can be used to show where project sites, operations and supply chains are located in relation to protected areas; as legal entities, pro-tected areas are socially and politically sensitive. Design of offsets: � Biodiversity offsets could read-ress shortfalls in the management of many pro-tected areas. However, this may be seen as failing to provide additionality and thus not fulfilling the requirement that offsets deliver No Net Loss/Net Positive Impact on biodiversity (box 3, page 5).Supporting conservation actions: � it can inform measures to enhance the management of pro-tected areas, promote the sustainable use of natural resources and environmentally friendly, locally managed businesses in or near protected areas. Example 2 (page 22) in this guide shows how The Rainforest Alliance has incorporated protected area boundaries in GPS-enabled mo-
bile devices to promote sustainable agriculture near protected areas.Compliance with environmental standards, �certification schemes and biodiversity safe-guard policies: Compliance with most standards and certification schemes requires businesses to consider and evaluate their impacts on pro-tected areas. Protected areas information is used to identify critical habitats in most financial insti-tutions’ safeguard policies (example 8, page 28; example 12, page 32; and example 14, page 36).Valuation of ecosystem services: � A value can be placed on the services that the establishment and management of protected areas provides to local and neighbouring communities.Reporting a company’s environmental foot- �print: The Global Reporting Initiative biodiversity indicators G4-EN11, G4-EN12 and G4-EN13 use this knowledge product (example 13, page 34).
How can the data be accessed?Protected Planet data are subject to terms and con-ditions of use (www.protectedplanet.net/termsandconditions). For commercial use Protect-ed Planet can be accessed directly through the In-tegrated Biodiversity Assessment Tool (IBAT) at www.ibatforbusiness.org or by joining the Proteus Partnership at www.proteuspartners.org. For more information see section 1.6 in this report.
11 Bertzky et al., 2012.
© D
iego
Juffe
-Big
noli

12
Biodiversity for Business: A guide to using knowledge products delivered through IUCN
What does it do? The Key Biodiversity Areas standard supports the identification, delineation and documentation of sites of global significance for biodiversity.
How does it work?KBAs are identified at a national level by applying a set of scientific criteria and numerical thresholds (figure 4). The biodiversity features that meet (or trigger) the criteria have to be confirmed in the area, and the site boundaries have to be clearly de-fined. The biodiversity features meeting KBA criteria are not necessarily under threat as the KBA criteria do not only take threatened biodiversity into ac-count (figure 4). The Key Biodiversity Areas method-ology looks at all levels of biodiversity (ecosystems,
What are Key Biodiversity Areas?Key Biodiversity Areas (KBAs) are sites that contribute significantly to the global persistence of biodiversity. These are sites with geographically defined boundaries that hold biodi-versity (ecosystems, species or genes) of international significance. KBAs are endorsed by conservation organiza-tions but do not necessarily have legal designation for any particular kind of land use (e.g. they are not necessarily Protected Areas).
Defi
nitio
n
Figure 4 - How are Key Biodiversity Areas identified?
Threatened biodiversityA.
Geographically restricted biodiversityB.
Outstanding ecological integrityC.
Outstanding biological processesD.
Example of meeting the KBA criteriaThe Javan Rhinoceros , Rhinoceros sondaicus, is a globally threatened species listed by IUCN as Critically Endangered. Its last population is found in Indonesia in the Ujung Kulon National park on Java Island. Its presence will qualify that site as a KBA under criterion A.
Examples of delineationA KBA contained within a legally �protected area may adopt the protected areas’ boundaries.
Mount Nimba, which is intersected by �Guinea, Côte d’Ivoire, and Liberia, was identified as three separate KBAs, one per country, to allow for management by each nation.
Some examples of already identified KBAsImportant Bird and Biodiversity Areas �(IBAs) Identified by BirdLife International (www.birdlife.org).
Alliance for Zero Extinction (AZE) sites identified by �the AZE partnership (www.zeroextinction.org).
Freshwater Key Biodiversity Areas identified by IUCN �(www.iucn.org/species/freshwater).
Key Biodiversity Areas (KBAs)
KBA boundaries are delineated through consultation involving local experts in a two step process:
the biological features that meet the criteria are mapped;1.
relevant aspects of the socio-economic context (e.g. land 2. tenure, political boundaries) may be taken into account to improve potential manageability
Apply the criteria and thresholds
Set the boundaries
Key Biodiversity Areas1.4

13
Part 1 - The Knowledge Products
12 Langhammer et al 2007.
13 To know more about the development of the new KBA standard please see: www.iucn.org/key_biodiversity_areas
14 BirdLife International 2013
15 BirdLife International 2014
species and genes) and is applicable across biomes (freshwater, terrestrial and marine). Although mainly applied through national-level processes, the stand-ard identifies sites of global importance.
Key Biodiversity Areas are an overarching frame-work.12 Starting over three decades ago, BirdLife In-ternational pioneered the identification of KBAs for birds in the Important Bird and Biodiversity Areas (IBAs) programme. Other significant sets of KBAs have been identified by the Alliance for Zero Extinc-
tion (focusing on sites which hold the last remain-ing populations of highly threatened species), and by IUCN for freshwater sites. The KBA standard pro-vides a common framework to harmonize these and other similar approaches globally and to sup-port the identification of KBAs under a globally agreed methodology.13
What does it produce?In addition to spatial data (in the georeferenced map of the site), the Key Biodiversity Areas approach
Understanding Key Biodiversity Area mapsA KBA map shows the boundaries of a site that makes a significant contribution to the global persistence of biodiversity. There is no minimum size for a KBA as boundaries are delineated in consultation with relevant stakeholders by using ecological criteria and are refined for manage-ability by using data on land tenure and land use. In some cases, KBA boundaries may overlap or coincide with protected area boundaries.
Businesses can use KBAs maps to identify areas of high risk of biodiversity impact or to select po-tential sites for implementing the mitigation hierarchy (box 3).
Info
Background: Caruachi is a Key Biodiversity Area—classified as an Important Bird and Biodiversity Area and an Alli-ance for Zero Extinction site—located in south eastern Venezuela.14 It meets the criteria A (Threatened Biodiversity) as it holds at least 95% of the known population of Carrizal Seedeater (Amaurospiza carrizalensis), a Critically Endan-gered species according to the IUCN Categories and Criteria. This KBA does not overlap with any protected area. 15

14
Biodiversity for Business: A guide to using knowledge products delivered through IUCN
16 Peh et al., 2013.
provides associated information such as the name of the site, a list of the ecosystem, species or genetic biodiversity for which the site was identified as im-portant, and the rationale for its delineation.
How can it be used?Identification of sensitive areas during screen- �ing processes and baseline surveys: This knowledge product can be used to show where existing or future project sites, operations and supply chains are located in relation to Key Bio-diversity Areas (example 4, page 24).Minimization of impacts on biodiversity: � Meas-ures and plans may be designed to minimize im-pacts on KBAs in or near a concession or across a supply chain by focusing on specific biodiversity features for which that KBA was identified. Rehabilitation and restoration programmes: � This information may be used to prioritize actions or design programmes in or near a KBA, focusing on specific biodiversity features for which the KBA was identified.Design of offsets: � Potential locations for offsets could be identified by weighing the biodiver-sity features that could be safeguarded in a KBA against the biodiversity features to be impacted by a given development.Supporting conservation actions: � KBAs could be valuable targets for activities such as environ-mental education, while candidate KBAs would
benefit greatly from additional conservation ac-tions in the form of scientific research.Compliance with environmental standards, cer- �tification schemes and biodiversity safeguard policies: Compliance with these, require consid-eration of impacts on areas of high biodiversity value such as KBAs. KBAs also provide relevant input for the identification of critical habitats in most financial institutions’ safeguard policies (ex-amples 9, 12 and 14 in pages 29, 32 and 36).Valuation of ecosystem services: � Companies can place a value on the ecosystem services that may be lost if the biodiversity value of a site is ad-versely affected by their operations. Tools such as TESSA,16 which enables the identification of which ecosystem services may be important at a site, are particularly appropriate for supporting such valuation. Reporting a company’s environmental foot- �print: KBAs can inform reporting on Global Re-porting Initiative biodiversity indicators G4-EN11 and G4-EN12 (example 13, page 34).
How can the data be accessed?Key Biodiversity Areas are subject to terms and conditions of use available from the data provid-ers’ websites. For commercial use the data can be accessed through the Integrated Biodiversity As-sessment Tool (IBAT) at www.ibatforbusiness.org (section 1.6).
© D
iego
Juffe
-Big
noli

15
Part 1 - The Knowledge Products
What does it do? The Red List of Ecosystems is a knowledge product under development. It is designed to be a global standard for assessing the status of the world’s eco-systems by quantifying their risk of collapse. By 2025, IUCN aims to have documented the status of and measured the risks to all the world’s terrestrial, freshwater, marine and subterranean ecosystems, but partial results focusing on specific regions will gradually be made available from 2015 onwards.
How does it work?Collapse is the ecosystem analogue to species ex-tinction and occurs when an ecosystem loses its defining features and is transformed into a novel ecosystem that is no longer able to support the same ecological processes or its characteristic bio-diversity. The risk of collapse of ecosystems is meas-ured through the application of a standardized risk assessment methodology.17 The procedure evalu-ates whether ecosystems are not currently facing significant risk of collapse (Least Concern), whether
What are threatened ecosys-tems?Threatened ecosystems are those categorized as Critically Endangered, Endangered or Vulnerable by The Red List of Ecosystems. Not all ecosys-tems on The Red List of Ecosystems will be threatened; some may be in a healthy state or relatively widespread (Least Concern or LC). An ecosystem listed on The Red List of Ecosystems is not necessarily a priority for any particular kind of conservation action or automatically protected by regu-lations. Setting priorities and intro-ducing regulations are subsequent stakeholder decisions, which should be informed by an understanding of the risk of collapse along with other factors.
Defi
nitio
n
17 Keith et al., 2013.
Figure 5 - Assessment criteria and risk categories used by The Red List of Ecosystems
A. Declining distribution
B. Restricted distribution
D. Altered biotic processes & interactions
C. Degradation of abiotic environment
E. Quantitative risk analysis
Criteria
Thre
shol
ds
Categories
The Red List of Ecosystems1.5

16
Biodiversity for Business: A guide to using knowledge products delivered through IUCN
they are threatened at Vulnerable, Endangered or Critically Endangered levels, or if they have reached the final stage of degradation and are therefore in a state of Collapse. Similarly to The IUCN Red List of Threatened SpeciesTM, The Red List of Ecosystems examines five criteria (A to E, see figure 5) that span varying levels of risk and loss of function. The key indicators of collapse are losses in area, degrada-tion of abiotic components, disruption of biotic processes, or other major changes such as large-scale land conversion. Ecosystems are then as-signed to one of eight categories of threat based
on whether they meet quantitative thresholds un-der each of the five criteria.
What does it produce?As with The IUCN Red List of Threatened SpeciesTM, The Red List of Ecosystems will produce georefer-enced maps of assessed ecosystems and associat-ed documentation that will include an assigned threat category, a detailed description of the eco-system and its characteristic biotic and abiotic processes, its current and historical extent, the threats it faces and potential conservation meas-
Understanding The Red List of Ecosystems mapsThe Red List of Ecosystems maps show the status of ecosystems (i.e. their risk of collapse) within a given region, as assessed through application of the categories and criteria.
When interpreting a map, it is important to understand the scale at which The Red List of Ecosys-tems methodology has been applied, as this will have important implications for priority setting. For example, a factor that is not considered important at regional level could be crucial at national or subnational level.
Info
Background: The Southern Montane Forest of Venezuela is listed as Vulnerable18 due to disruption of biological functions. Located in the states of Amazonas and Bolívar, it is present between 800–1500 metres above sea level and covers around 48,200 square kilometres. The main threat to this ecosystem is illegal mining, which takes place over relatively small areas along rivers but is widespread across its extension.
18 Oliveira-Miranda 2013

17
Part 1 - The Knowledge Products
ures needed to improve the ecosystem’s conserva-tion status. Guides, guidelines and tools for applica-tion of the criteria and use of the outputs will be available by 2015, and an online repository of eco-system threat data is under development, with glo-bal data to be available by 2025.
How can it be used?Identification of sensitive areas during screen- �ing processes and baseline surveys: The pres-ence of threatened ecosystems is a criterion for identifying internationally recognised areas of high biodiversity value, such as Key Biodiversity Areas (section 1.4).Application of the mitigation hierarchy: � The Red List of Ecosystems could potentially be used to inform several stages of the mitigation hierar-chy. In the avoidance phase, for example, it could indicate the potential presence of ecosystems of conservation concern or inform decisions on resource allocation. It could also inform restora-tion and rehabilitation plans and provide candi-date lists and metrics for offset design (example 7, page 27).Supporting conservation actions (SCA): � Red List assessments provide information on the con-servation actions needed, including options for SCAs such as research on Data Deficient ecosys-tems to assess their risk of collapse.
Compliance with environmental standards, �certification schemes and biodiversity safe-guard policies: Compliance with standards and certification schemes requires consideration and evaluation of impacts on ecosystems (examples 12 and 14 in pages 32 and 36).Valuation of ecosystem services: � Companies can place a value on the services that may be lost by collapsed ecosystems or on the benefits accruing from good management of non-threat-ened ecosystems.Reporting on a company’s environmental foot- �print: The Red List of Ecosystems could potential-ly be used to report on Global Reporting Initiative ecosystem indicators (example 13, page 34).
How can the data be accessed?Ecosystem risk assessments will be available to download from an online database subject to terms and conditions of use. This database will be developed by 2015. Several national and regional ecosystem Red Lists have already been produced and can be accessed through The Red List of Eco-systems website: www.iucnredlistofecosystems.org. These have their own terms and conditions of use, may or may not have applied the latest Red List of Ecosystems methodology and are not en-dorsed by IUCN.
© D
iego
Juffe
-Big
noli

18
Biodiversity for Business: A guide to using knowledge products delivered through IUCN
To fulfil IUCN’s vision and mission (figure 1) and in order to avoid and minimize negative impacts on nature, IUCN and its partners are committed to making biodiversity information available to busi-nesses and, wherever possible, to providing appro-priate decision support tools that comply with the terms and conditions of use of the information. Two direct points of access to knowledge products are the Integrated Biodiversity Assessment Tool and the Proteus Partnership (table 2).
Integrated Biodiversity Assessment Tool – IBAT (www.ibatforbusiness.org)IBAT is a partnership between Birdlife International, Conservation International, IUCN and the United Nations Environment Programme World Conserva-tion Monitoring Centre (UNEP-WCMC). It is an on-line tool designed to facilitate access to currently identified KBAs, the WDPA and The IUCN Red List of Threatened SpeciesTM, combined with other rele-vant ecological datasets. All information can be ac-cessed through a simple user interface that allows users to display dynamic georeferenced maps and
submit specific queries. IBAT helps businesses incor-porate biodiversity considerations into key project planning and management decisions, including screening potential investments, siting an operation in a given region, developing action plans to man-age biodiversity impacts, assessing risks associated with potential sourcing regions and reporting on corporate biodiversity performance. See examples 7 and 8 in section 2.2. to see how companies have used IBAT.
Proteus Partnership (www.proteuspartners.org)Proteus is a collaboration between major extractive companies and UNEP-WCMC. Its purpose is to improve the development and dissemination of global data and information on biodiversity and support the inclusion and interpretation of biodiversity in corporate decision making. Access to IBAT is provided for all Proteus Partners, as well as additional biodiversity data layers, information on developments in biodiversity science and policy, and specialized technical support from UNEP-WCMC.
Tools to support access to and use of the knowledge products 1.6
Access for commercial use
NotesIntegrated Biodiversity
Assessment Tool (IBAT)
Proteus(UNEP-WCMC)
Know
ledg
e Pr
oduc
t
The IUCN Red List of Threatened SpeciesTM
✔ ✔(through IBAT)
National and Regional Red Lists: Each national Red List will have its own terms and conditions of use. A compilation of national Red Lists is available at www.nationalredlist.org
Protected Planet ✔ ✔Protected Planet’s underlying database is the World Database on Protected Areas.
Key Biodiversity Areas ✔ ✔
(through IBAT)
The Red List of Ecosystems ✗ ✗
The Red List of Ecosystems is under development; for further information see: www.iucnredlistofecosystems.org
Table 2 - Access to knowledge products through IBAT and Proteus

19
Part 1 - The Knowledge Products
WBCSD tools and knowledge productsIn addition to these specific decision support tools for use with the knowledge products provided through IUCN, Eco4Biz (Ecosystem services and bi-odiversity tools to support business decision mak-ing) provides a structured overview of existing tools and approaches that are available to help companies assess and manage their ecosystem im-pacts and dependencies at different scales and for different purposes, including scoring, quantifying and mapping. IBAT, which is an online tool used to access knowledge products, is of the tools included in this compilation.
Other valuable WBCSD resources are the Corpo-rate Ecosystem Services Review (ESR) and the
Guide to Corporate Ecosystem Valuation (CEV). ESR is a structured methodology that helps man-agers proactively develop strategies to manage business risks and opportunities arising from their companies’ dependence and impact on ecosys-tems. CEV can be defined as a procedure for mak-ing better-informed business decisions by placing an explicit value on both the costs of ecosystem degradation and the benefits provided by ecosys-tem services. Knowledge products delivered through IUCN can inform CEV and ESR by provid-ing information on areas of high biodiversity value (Key Biodiversity Areas) and the risk of biodiversity loss (ecosystems and species). More specifically, the knowledge products delivered through IUCN are important in collecting baseline information.
© 2
010
Rio
Tint
o

20
Biodiversity for Business: A guide to using knowledge products delivered through IUCN
Part 2 - How have companies been using these knowledge products?
The examples included in this section seek to pro-vide short, non-technical guidance on how the knowledge products have been or might be used by the private sector. Examples include separate and combined uses of the data, and range from specific sectors (agriculture, forestry, mining, etc.) to cross-sectoral uses (High Conservation Value Re-source Network, Global Reporting Initiative, and standards and certification schemes). These are
short briefs and not detailed accounts of the use of the data. More detailed case studies on how busi-nesses have managed their biodiversity impacts are publicly available, including pilot projects on offsets,19 although none of these specifically cover the use of the knowledge products delivered through IUCN. Nonetheless, most of them contain abundant references to these knowledge prod-ucts.
Introduction2.1
Sector Organizations involved a b c d Page
Example 1 Agriculture Nestlé ✔ ✔ 21
Example 2 Agriculture Rainforest Alliance and partners ✔ ✔ 22
Example 3 Energy Eni ✔ ✔ 23
Example 4 Extractive (cement and aggregates) CEMEX ✔ ✔ ✔ 24
Example 5 Extractive (cement and aggregates) Holcim ✔ ✔ ✔ 25
Example 6 Extractive (oil and gas) Shell ✔ ✔ ✔ 26
Example 7 Extractive (mining) Rio Tinto ✔ ✔ ✔ 27
Example 8 Finance International Finance Corporation ✔ ✔ ✔ 28
Example 9 Forestry (oil palm and timber)
Oil palm and logging companies in Indonesia ✔ ✔ ✔ 29
Example 10 Forestry (paper) Portucel-Soporcel Group ✔ ✔ ✔ 30
Example 11 Tourism World Economic Forum ✔ ✔ 31
Example 12 Cross-sector High Conservation Value Resource Network ✔ ✔ ✔ ✔ 32
Example 13 Cross-sector Global Reporting Initiative (GRI) ✔ ✔ ✔ 34
Example 14 Cross-sector 37 standards and certification schemes ✔ ✔ ✔ 36
Table 3 - Summary of examples of how the knowledge products featuring in this guide have been used. a)The IUCN Red List of Threatened SpeciesTM; b)Protected Planet; c)Key Biodiversity Areas; d)The Red List of Ecosystems.
19 ICMM, 2010; WBCSD, 2012; and http://bbop.forest-trends.org/pages/pilot_projects.

21
Part 2 - How have companies been using these knowledge products?
Nestlé is a nutrition, health and wellness company with a portfolio of more than 2,000 global and local brands. It is one of the largest food companies in the world with 468 factories in 86 countries and around 330,000 employees. Nestlé has made a commitment to operate in a manner that safe-guards natural capital, and two elements of natural capital in particular—biodiversity and ecosystem services. It is already implementing a comprehen-sive approach to responsible sourcing as well as measures to improve biodiversity management and conservation at farm level. However, the com-pany needed an approach for its factories. With such a large geographical range and so many fac-tories it needed a framework within which it could logically and consistently select the factories to be targeted with measures to safeguard natural capi-tal and choose the type of interventions to be un-dertaken. UNEP-WCMC developed an approach for Nestlé which allowed different components of bio-diversity sensitivity to be assessed based on global-ly available data, so as to inform potential priority sites for further investigation and action.
The approach made use of two of the knowledge products, combined with other data on biodiversi-ty and overlaid with spatial data on Nestlé factory locations, to produce a profile for each factory. The analysis allowed for a composite assessment proc-ess tailored to company-specific criteria. Factories were ranked and prioritized on the basis of ‘Pro-tected Biodiversity’ and ‘Threatened Biodiversity’. Central to the assessment of Protected Biodiversity was the World Database on Protected Areas, while the metric for Threatened Biodiversity included in-formation from The IUCN Red List of Threatened SpeciesTM. By viewing each factory through these two lenses, the approach allowed Nestlé to select a priority group of factories for immediate attention and further study. Nestlé staff used the outcomes of the ranking exercise to investigate the data fur-ther and determine appropriate responses.
More information:http://www.nestle.com/csv/environmental-sustain-ability/biodiversity
Single-sector examples2.2
Organizations involved: NestléSector: Agriculture Mitigation hierarchy: Avoidance and minimization
Nestlé’s commitment to safeguarding natural capitalEXAMPLE 1
© D
iego
Juffe
-Big
noli

22
Biodiversity for Business: A guide to using knowledge products delivered through IUCN
The production of food and forest products exerts tremendous pressure on biodiversity and natural ecosystems. However, judicious use of biodiversity data as part of supply chain sustainability initia-tives can help mitigate these impacts and risks. The Rainforest Alliance is an international non-prof-it organization that helps improve the sustainabili-ty of agriculture and forestry-based supply chains through its work with producers, companies and consumers in over 100 countries. The organization implements voluntary sustainability standards and trains producers to support the adoption of more sustainable land-use practices, leading to im-proved conservation and livelihood outcomes. As part of this work, the Rainforest Alliance uses knowledge products in project design and geo-graphic prioritization, impact evaluation and field-level implementation. Project design and geographic prioritization ef-forts use data on biodiversity and protected area locations to identify where sustainability stand-ards and certification hold the greatest potential to improve conservation value and mitigate key biodiversity threats. These may include locations in close proximity to protected areas where con-servation-friendly land use could help buffer or extend the functional size of core habitats, as well as biological corridors where agricultural manage-ment practices influence conservation value of the landscape.Impact evaluation is a high priority for assessing on-the-ground results associated with sustainability standards and certification. The Rainforest Alliance uses knowledge products to assess certification im-pacts on broader patterns of land use, habitat con-servation and deforestation. For instance, Newsom and Hughell (2011) used World Heritage Sites (ex-tracted from the WDPA) spatial data to investigate the adjacency of FSC sites with World Heritage Sites
and to analyse the effects of FSC certification on mitigating potential threats to such sites—for in-stance by protecting adjacent high conservation value forests and preventing forest fires. In both cases, knowledge products enabled the investiga-tion to go beyond site-level effects of certification to consider impacts on broader drivers and threats for biodiversity loss.Finally, implementation of training and sustainabil-ity standards at the field level can benefit strongly from access to accurate spatial data about biodiver-sity, protected areas and other locations where pro-duction activities are prohibited or ill advised. For instance, where smallholder agriculture occurs near protected areas, farmers, trainers and commodity traders are often uncertain of the location of key land boundaries. This can create multiple problems, including risk of encroachment into high-value hab-itats and risk that traders will not buy products from farmers who meet sustainability standards yet are unable to demonstrate that their farms lie outside protected areas. To address such challenges, the Rainforest Alliance has begun using GPS-enabled mobile devices pre-loaded with satellite imagery and protected area boundaries to enable farmers, trainers and cooperative managers to promote sus-tainable agriculture near protected areas while en-suring that farming does not encroach where it is prohibited. This approach provides a scalable mech-anism for ground-based verification of sustainability outcomes. Although spatial resolution and accuracy of regional and global datasets remain a limitation, knowledge products have already demonstrated great value for understanding and improving con-servation outcomes of sustainability standards and certification.
More information:http://www.rainforest-alliance.org/work/impact
Organizations involved: Rainforest Alliance Sector: Agriculture Mitigation hierarchy: Avoidance and minimization
The Rainforest Alliance’s use of biodiversity data to support sustainable supply chains20EXAMPLE 2
20 Jeffrey C. Milder and David Hughell (Rainforest Alliance, Evaluation & Research Program).

23
Part 2 - How have companies been using these knowledge products?
Eni is an integrated company that operates across the entire energy chain, employing some 78,000 people in 90 countries around the world. Eni’s op-erations include oil and gas exploration, energy and gas provision, and refining and marketing. Eni has used the knowledge products to map and as-sess the biodiversity risk of its exploration and pro-duction sites by using their proximity to different categories of legally protected areas and other glo-bally important areas for biodiversity conservation in order to differentiate its operations. These cate-gories (e.g. Key Biodiversity Areas such as Important Bird and Biodiversity Areas) are identified from the World Database on Protected Areas and Key Biodi-versity Areas data. The IUCN Red List of Threatened SpeciesTM is used by Eni’s exploration and produc-tion division in the preliminary identification of sensitivities during Environmental, Social and Health Impact Assessments (ESHIAs). The informa-tion acquired through The Red List is later coupled with primary data collected on the ground, as ap-propriate.
This global screening has allowed Eni to focus re-sources on implementing biodiversity and ecosys-tem service assessments and targeted Action Plans at existing and new priority sites. Eni has been a UNEP-WCMC Proteus partner since 2008 (section 1.6). This initiative aims to improve the quantity, quality and accessibility of the data, both terrestrial and marine, in the World Database on Protected Areas. Besides significantly contributing to biodi-versity conservation globally through the provision of better data, the business benefits that derive from being a part of this initiative are related to the availability of complete, up-to-date quality informa-tion, critical for the implementation of screening companywide.
More information:http://www.eni.com/en_IT/sustainability/environ-ment/biodiversity-and-ecosystems/biodiversity-ecosystems.shtml
Organizations involved: EniSector: Energy Mitigation hierarchy: Avoidance and minimization
Managing biodiversity impacts across the energy supply chainEXAMPLE 3
© 2
010
Rio
Tint
o

24
Biodiversity for Business: A guide to using knowledge products delivered through IUCN
CEMEX is one of the world’s largest cement, aggre-gates and ready-mix concrete companies, with headquarters in Mexico. It has operations in over 50 countries. In 2007, CEMEX and BirdLife Interna-tional commenced a long-term, 10-year strategic partnership intended to help drive CEMEX’s im-provement of its biodiversity management at a lo-cal level by fostering collaborations with BirdLife’s national partners. As a first step in assessing the biodiversity risks and opportunities associated with CEMEX’s global op-erations, CEMEX and BirdLife International carried out a biodiversity scoping study, in which knowl-edge products played a key role. The study mapped CEMEX’s quarry sites and assessed their proximity to areas of high biodiversity value, such as interna-tional and national protected areas (e.g. Natura 2000 sites) and Important Bird Areas (a specific type of Key Biodiversity Area). As figure 6 shows, out of the 543 CEMEX sites as-sessed worldwide, 131 overlapped with an area of high biodiversity value. Of the overlapping sites, 70
had the potential to enhance biodiversity manage-ment and required further investigation to ensure that impacts on biodiversity were appropriately taken into consideration. Of these 70 sites, 12 were of global importance and became an immediate priority for the CEMEX–BirdLife Global Programme. With BirdLife’s help, CEMEX started developing a standard Biodiversity Action Plan to guide the de-velopment and implementation of site-specific Bio-diversity Action Plans at these 12 priority sites. The target was to have Biodiversity Action Plans estab-lished for all sites that overlapped with areas of high biodiversity value by 2015. Among other prac-tical outputs of the study were maps and databases that provided detailed information on the biodiver-sity features associated with CEMEX’s global opera-tions.
More information:http://www.birdlife.org/datazone/sowb/casestudy/228
Organizations involved: CEMEXSector: Extractive (cement and aggregates)Mitigation hierarchy: Avoidance and minimization
CEMEX’s global biodiversity scoping studyEXAMPLE 4
Figure 6 - Phases of CEMEX’s biodiversity scoping study

25
Part 2 - How have companies been using these knowledge products?
Holcim is one of the world’s leading suppliers of cement and aggregates with approximately 500 active extraction sites around the world. In order to manage the risks and opportunities associated with their biodiversity impact Holcim, working closely with IUCN, has adopted an integrated Bio-diversity Management System (BMS). The aim is to make biodiversity conservation considerations an integral part of the company’s environmental management strategy and to ensure that the com-pany is meeting high standards of responsible en-vironmental stewardship.A fundamental element of the BMS is knowing the biodiversity risk of a particular site, which compris-es its biodiversity importance category and the potential impact on that biodiversity caused by operations. To achieve this, a matrix was used to categorize the risk of each site and set priorities for detailed evaluation and action, as well as Go/No-Go decisions (figure 7). Holcim assessed the biodiversity importance cate-gory of each of their sites in a desk study, drawing on information from the knowledge products
among other sources. The Integrated Biodiversity Assessment Tool (IBAT) was used to assess the overlap of Holcim’s sites with globally threatened species ranges (from The IUCN Red List of Threat-ened SpeciesTM), protected areas (from The World Database on Protected Areas) and sites of global significance for biodiversity (from Key Biodiversity Areas). Managers of the most sensitive sites con-tracted local specialists to conduct targeted surveys to confirm the presence of biodiversity features identified in the desk study, such as globally threat-ened species in or near the sites. The biodiversity importance of the site was then combined with an estimate of the potential impacts on biodiversity and the potential for mitigating these impacts. By following this risk-based methodology, Holcim was able to determine what level of management was needed for each site and develop appropriate targets and actions, including biodiversity action plans.
More information:http://www.holcim.com/biodiversity
Organizations involved: HolcimSector: Extractive (cement and aggregates) Mitigation hierarchy: Avoidance and minimization
Implementing a Biodiversity Management SystemEXAMPLE 5
Biodiversity Importance
Potential impact of operations on biodiversity
Very High High Moderate Low
Global Sensitive Sensitive Sensitive Medium
National Sensitive Sensitive Sensitive Medium
Local Medium Medium Minimum Minimum
Low Minimum Minimum Minimum Minimum
Figure 7 - Holcim’s biodiversity risk matrix

26
Biodiversity for Business: A guide to using knowledge products delivered through IUCN
Shell is a global energy and petrochemicals group with around 87,000 employees in more than 70 countries. Protecting biodiversity is an important factor for Shell when considering any major new project. Shell works in partnership with leading conservation groups, including Wetlands Interna-tional, IUCN, The Nature Conservancy, Earthwatch and UNEP-WCMC to address challenges and man-age issues relating to impacts on biodiversity and ecosystem services. If an area is rich in biodiversity and Shell projects could have an impact, Shell engages with interna-tional and local experts and with local communi-ties and develops biodiversity action plans. Possible impacts on ecosystem services, such as fresh water, food and air regulation are also considered. In addi-tion to this, the research Shell supports includes, for example, helping to identify threatened species in the regions around projects and increasing knowledge of interactions between human activi-ties and biodiversity (e.g. the Sound and Marine Life Joint Industry Programme). Shell uses the knowledge products for:
Early project screening of biodiversity and habi- �tat sensitivities: Shell leverages the information in IBAT, which includes Key Biodiversity Areas, The IUCN Red List of Threatened SpeciesTM and the World Database on Protected Areas. This type of information is used to prioritize/deprioritize potential new leases and locations for new facili-ties. Assessment of potential critical habitats: This �specific application of the previous point uses the IFC definition, which links to Key Biodiversity Areas, The IUCN Red List of Threatened SpeciesTM, and Protected Areas. Critical habitat is used to identify areas that need to be avoided or where upgraded operational practices need to be ap-plied. Input into impact assessment baselines: Threat- �ened species, unique ecosystems and protected
areas are identified and documented in all im-pact assessments. The knowledge products are an important global information source and help in prioritizing conservation efforts, but also need to be backed up by local knowledge (e.g. base-line surveys, local experts and local traditional knowledge).Sustainability reporting: Shell uses knowledge �products to report on biodiversity indicators, specifically for Shell activities in protected areas in IUCN management categories I-IV.
More information: http://www.shell.com/global/environment-socie-ty/environment/biodiversity.html
Organizations involved: Shell Sector: Extractive (oil and gas)Mitigation hierarchy: Avoidance and minimization
Shell’s approach to biodiversity managementEXAMPLE 6
© S
hell
Inte
rnat
iona
l Ltd

27
Part 2 - How have companies been using these knowledge products?
Rio Tinto is a mining group with 71,000 employees in around 40 countries. Its major products are alu-minium, copper, diamonds, thermal and metallur-gical coal, uranium, gold, industrial minerals (borax, titanium dioxide and salt) and iron ore.At the IUCN World Congress in 2004, Rio Tinto launched a strategy for achieving net positive im-pact (NPI), which was further reinforced in 2008 with the Rio Tinto Biodiversity Strategy (Rio Tinto, 2008). NPI implies that at the end of the company’s project cycle there is an overall positive impact on biodiversity. Application of the mitigation hierar-chy is fundamental for systematically achieving NPI. Working closely with IUCN and The Biodiversi-ty Consultancy, Rio Tinto pioneered an approach to forecast NPI through the application of the four phases of the mitigation hierarchy (avoidance, minimization, rehabilitation/restoration, and off-sets – figure 8) at the Rio Tinto ilmenite mine in southeastern Madagascar (Temple et al., 2012). This approach has since been applied to other sites, including the Oyu Tolgoi project located in the southern Gobi desert in Mongolia (TBC & FFI, 2012). In all cases Rio Tinto has been able to dem-onstrate that NPI is theoretically possible at the end of the project cycle, based on a number of predictions and assumptions detailed in the docu-mentation associated with both projects.Knowledge products have been used for several steps in Rio Tinto’s NPI framework. For example, The IUCN Red List of Threatened SpeciesTM, Key Biodiver-sity Areas and protected areas play a role in the identification of critical habitats, which is important in the avoidance phase. Knowledge products can also help in developing lists of options for offsetting and thereby aid offset design. They can also inform the identification of other important areas for biodi-versity that may not qualify as critical habitat but may still be important for offset options. The most common metrics for measuring NPI are based on habitat extent and habitat condition (or quality). Rio Tinto has pioneered the calculation of ‘quality hec-tares’ (QH) to measure progress towards NPI. QH is a
measure of habitat extent (for example defined by vegetation maps) and quality (either from on-the-ground measures or remote sensing). Measuring and quantifying for NPI is a complex process and so-lutions vary depending on the context of each site. They draw on expert opinion, site surveys and a range of different ecological data, which may in-clude information provided by knowledge products.
More information:http://www.riotinto.com/sustainabledevelop-ment2012/environment/biodiversity.html
Organizations involved: Rio TintoSector: Extractive (mining) Mitigation hierarchy: All phases
Forecasting and measuring net positive impact on biodiversityEXAMPLE 7
Figure 8 - How Rio Tinto forecasts net positive impact
Net Positive Impact Steps
Step 1: Select which biodiversity to include in NPI accounting
Step 2: Select a metric or metrics
Step 3: Decide time period over which to measure losses and gains
Step 4: Quantify residual losses once the mitigation hierarchy has been followed
Step 5: Quantify gains generated through offsets
Step 6: Determine whether no net loss has been achieved

28
Biodiversity for Business: A guide to using knowledge products delivered through IUCN
Finance corporations have a responsibility to ensure responsible lending to companies and countries. The aim should be to promote sustainable develop-ment while avoiding serious impact on biodiversity and natural resources and enhancing local liveli-hoods. This example focuses on the International Finance Corporation’s Performance Standard 6 – Bi-odiversity Conservation and Sustainable Manage-ment of Living Natural Resources, or IFC PS621. IFC PS6 has been praised in the sector and is probably one of best drivers of corporate biodiversity man-agement. Critical habitat and natural habitats as defined in IFC PS6 are terms used by many other safeguard poli-
cies to describe habitats that are either especially sensitive to impacts or of high biodiversity signifi-cance and should therefore be taken into consider-ation. Table 4 shows how knowledge products have to be used to implement IFC PS6 and, by extension, to ensure compliance with other, similar financial institution safeguard policies that also require the use of information contained in knowledge prod-ucts (example 14, page 36).
More information:http://www.ifc.org (type IFC PS6 in the search box on the website)
Organizations involved: International Finance Corporation (IFC) of The World BankSector: Finance Mitigation hierarchy: Avoidance and minimization
Using knowledge products to identify critical habitatEXAMPLE 8
Selected references in IFC PS6 requiring the use of knowledge products
Knowledge products informing these requirements
12. ... areas of modified habitat that include significant biodiversity value ... The client should minimize impacts on such biodiversity and implement mitigation measures as appropriate ...
The IUCN Red List of Threatened SpeciesTM
15. In areas of natural habitat, mitigation measures will be designed to achieve no net loss of biodiversity where feasible ...
The IUCN Red List of Threatened SpeciesTM
17. ... not lead to measurable adverse impacts on those biodiversity values for which the critical habitat was designated ...
The IUCN Red List of Threatened SpeciesTM
Key Biodiversity Areas
16. Critical habitats are areas with high biodiversity value, including (i) habitat of significant importance to Critically Endangered and/or Endangered species; (ii) habitat of significant importance to endemic and/or restricted-range species; (iii) habitat supporting globally significant concentrations of migratory species and/or congregatory species; (iv) highly threatened and/or unique ecosystems; and/or (v) areas associated with key evolutionary processes.
The IUCN Red List of Threatened SpeciesTM Key Biodiversity Areas
20. In circumstances where a proposed project is located within a legally protected area or an internationally recognized area, the client will meet the requirements of paragraphs 13 through 19 of this Performance Standard, as applicable. In addition, the client will ...
Protected PlanetKey Biodiversity Areas
Table 4 - Use of knowledge products to inform IFC PS6
21 IFC, 2012

29
Part 2 - How have companies been using these knowledge products?
Since 2008 Fauna & Flora International (FFI) have worked with companies, communities and district governments to assess and manage high conser-vation values in two districts in West Kalimantan, Indonesian Borneo. Within these districts, Gunung Palung National Park (IUCN Category II), the coastal peat and lowland forests of Sungai Putri Forest Block, and Sentarum Lake National Park (a Ramsar Wetland of International Importance) are sur-rounded by oil-palm, logging and mining conces-sions. However, a relatively intact corridor of forest exists outside the protected areas, which provides important habitat for orangutans and other wild-life, contains vast carbon stocks and delivers essen-tial ecosystem services. HCV assessments use information on species, eco-systems and protected areas to support the cate-gorization of values (example 12, page 32). In this particular example, species data from The IUCN Red List of Threatened SpeciesTM were used to identify the extinction risk for species surveyed at the sites (birds, mammals, reptiles, amphibians and plants). The data used on protected areas were from the Ministry of Forestry of the Republic of In-donesia. The assessments were at the concession, landscape and district level. At the concession lev-el, FFI worked with a number of companies inter-
ested in meeting the Roundtable on Sustainable Palm Oil commitments to protect HCV within and around concession areas. These included Cargill’s business unit PT Indo Sawit Kekal, PT Cipta Usaha Sejati and PT Jalin Vaneo, PT Kayong Agro Lestari, and technical inputs to two subsidiaries of PT SMART (PT Kartika Prima Citra and PT Primanusa Mi-tra Serasi). Five logging concessions were also as-sessed: PT Sari Bumi Kusuma-Delang, PT Sari Bumi Kusuma-Tontang, PT Sukajaya Makmur, PT Wana-sokan Hasilindo and PT Wana Kayu Batu Putih. At the district level the HCV assessment and result-ant maps were used successfully as a tool along-side extensive stakeholder consultation to ensure that recommendations for biodiversity conserva-tion and habitat protection were incorporated into the government’s district and provincial spatial plans. Efforts are ongoing to create an enabling policy environment for HCV management and con-nectivity, and solutions to incentivize HCV protec-tion are being piloted.
More information:http://www.cargill.com/corporate-responsibility/pov/palm-oil/endangered-animals-habitats/index.jsp
Organizations involved: Oil palm and logging companies in IndonesiaSector: Forestry (oil palm and timber) Mitigation hierarchy: All phases
Managing impacts of palm oil and logging in IndonesiaEXAMPLE 9
© B
raen
dan
Yong
| D
ream
stim
e.co
m

30
Biodiversity for Business: A guide to using knowledge products delivered through IUCN
The Portucel Soporcel Group manages approxi-mately 120,000 hectares of forest comprising Euca-lyptus globulus plantations and other temperate woodlands, as well as several patches of natural and semi-natural habitat throughout Portugal. The diversity and significance of natural values in these areas meant that Portucel Soporcel needed a strat-egy that would systematically evaluate, plan and monitor the conservation value and ecosystem in-tegrity of its forests and plantations.With the support of environmental non-govern-mental organizations and the engagement of multiple stakeholders, the group has been imple-menting its strategy through afforestation and re-forestation projects. The process began with an assessment of the natural values of the forests. This included a pre-evaluation of potential impacts and a continuous survey of habitats, flora and fauna. In this process, Portucel Soporcel ran stakeholder consultations and defined mitigation and conser-vation measures using The World Database on Protected Areas (specifically Ramsar sites) and Key Biodiversity Areas (in this case Important Bird and Biodiversity Areas), alongside the Portuguese na-
tional lists of threatened species and habitats, in or-der to situate their operations in relation to protect-ed areas and identify areas of high biodiversity value that overlapped the company’s estate. The use of these knowledge products formed the basis of a conservation strategy that has been integrated into the group’s forest management model, as they pro-vide crucial information for developing Environ-mental and Social Impact Assessments as part of pre-project restriction analyses and for supporting annual conservation and restoration programmes.The result of this effort was the complete mapping of zones of particular conservation value. Based on this mapping exercise, and taking the conservation status of the various habitats and species into ac-count, Portucel Soporcel then defined action plans to guide the forest project team and ground staff through the implementation phase and to support the subsequent establishment of monitoring pro-grammes.
More information:See WBCSD, 2012 and http://www.portucelsopor-cel.com/en/group/biodiversity.php
Organizations involved: Portucel Soporcel groupSector: Forestry (paper) Mitigation hierarchy: Avoidance and minimization
Sustainable management of forests in PortugalEXAMPLE 10
© P
ortu
cel S
opor
cel i
mag
e ba
nk

31
Part 2 - How have companies been using these knowledge products?
The travel and tourism (T&T) industry plays an im-portant role in economic development: a strong T&T sector supports job creation, raises national in-come and can act as an incentive for a country to develop its general national competitiveness, through improvements in hard and soft infrastruc-ture. The natural environment is a key tourist attrac-tion; hence, it is crucial to develop the T&T sector in a sustainable way to ensure that the country will continue to be an attractive destination in the fu-ture. For this reason the World Economic Forum, with its Industry and Data Partners,22 regularly pro-duces the Travel & Tourism Competitiveness Report, which includes the Travel and Tourism Competitive-ness Index (TTCI).The TTCI aims to ‘measure the factors and policies that make it attractive to develop the T&T sector in different countries’. The index’s methodology is based on 14 pillars, which include 79 indicators de-rived from the Forum’s Executive Opinion Survey data and ‘hard’ data from WEF partners and other international organizations. Indicators derived from The IUCN Red List of Threat-ened SpeciesTM and the World Database on Protect-ed Areas are fundamental in the TTCI for assessing a country’s natural resource endowment and the sta-tus of its environment and biodiversity over time. The indicators used in the latest edition (2013) in-clude: a) the percentage of threatened species in the country, to proxy the loss of natural biodiversity; b) the total number of known species; and c) the percentage of nationally protected areas, to assess the richness of the fauna and the extent of national parks as resources to attract tourists. Although the Index’s assessment of environmental aspects is fairly sound, data constraints currently prevent a more thorough evaluation of sustainabili-ty. New indicators will be included as better envi-
ronmental sustainability measures become availa-ble. In this respect, the measurement of national biodiversity is perhaps one of the most important areas for improvement in the T&T context. Rich bio-diversity is a driver to attract tourists, while assess-ing the status of biodiversity changes over time provides a benchmark for environmental sustaina-bility policies. Key Biodiversity Areas and The Red List of Ecosystems may therefore be included in fu-ture updates of the Index.
More information:http://www.weforum.org/issues/travel-and-tourism-competitiveness
Organizations involved: World Economic Forum (WEF) and partnersSector: Tourism
The Travel and Tourism Competitiveness IndexEXAMPLE 11
22 Booz & Company, Deloitte, the International Air Transport Association (IATA), the International Union for Conservation of Nature (IUCN), the UNWTO and the World Travel & Tourism Council (WTTC). The WEF has also received feedback and support from Airbus/EADS, BAE Systems, the Bahrain Economic Development Board, Bombardier, Delta, Deutsche Lufthansa/Swiss, Embraer, Etihad Airways, Hilton, Jet Airways, Lockheed Martin, Marriott, Safran, Starwood Hotels & Resorts and VISA.
© D
iego
Juffe
-Big
noli

32
Biodiversity for Business: A guide to using knowledge products delivered through IUCN
The High Conservation Value (HCV) approach was initially developed by the Forest Stewardship Coun-cil (FSC) in 1999 for identifying and managing envi-ronmental and social values within a sustainable forest management context. It is now used by many sustainability schemes for forestry, agriculture and aquatic systems and has become an important tool for responsible resource management and sourc-ing. The HCV approach aims to identify biological, eco-logical, social or cultural values considered out-standingly significant or critically important, either for local users or at the national, regional or global level. It does this by focusing on six values to be evaluated in a given area (figure 9). A number of sustainability schemes require identification, main-tenance and enhancement of HCVs in certified are-as. Examples of these are forests certified under the FSC standards, fisheries managed under the Aquac-ulture Stewardship Council standards and planta-tions and mills in compliance with the Roundtable on Sustainable Palm Oil. Knowledge products are a valuable source of infor-mation for HCV identification. This is acknowledged in the HCV common guidance, which aims to achieve standardization in the application of the HCV approach at a global level.23 The use of infor-mation from The IUCN Red List of Threatened Spe-ciesTM, the World Database on Protected Areas and Key Biodiversity Areas is recommended in the pre-liminary data-gathering phase during the early stages of an HCV assessment. For example, existing protected areas can serve as a proxy for HCVs. This is because protected areas are likely to contain high levels of biodiversity, hold significant cultural values or provide important ecosystem services to local communities. Knowledge products are also a
fundamental resource for identifying HCVs in a par-ticular area. For example, UNESCO World Heritage sites and Ramsar sites are likely to harbour HCV 1, HCV 3 and/or HCV 4 depending on the specific context. The presence of species assessed as glo-bally threatened by IUCN would be enough to re-quire further investigation to decide if the area qualifies for HCV 1, and to determine the location of the habitats needed to protect these species. In the absence of detailed information on species sta-tus and distribution, the land manager can take a precautionary approach and conserve good-quality
Organizations involved: High Conservation Value Resource NetworkSector: Cross-sector
High Conservation Values and knowledge productsEXAMPLE 12
Cross-sector examples2.3
23 Brown et al., 2013.
© P
rofo
rest

33
Part 2 - How have companies been using these knowledge products?
The six High Conservation Values *
HCV1. Concentrations of biological diversity including endemic species, and rare, threatened or endangered species, that are significant at global, regional or national levels.
E.g. the presence of several globally threatened bird species.
HCV2. Large landscape-level ecosystems and ecosystem mosaics that are significant at global, regional or national levels, and that contain viable populations of the great majority of the naturally occurring species in natural patterns of distribution and abundance.
E.g. a large tract of Mesoamerican flooded grasslands and gallery forests with healthy populations of Hyacinth Macaw, Jaguar, Maned Wolf, and Giant Otter, as well as most smaller species.
HCV3. Rare, threatened, or endangered ecosystems, habitats or refugia. E.g. patches of a regionally rare type of freshwater swamp.
HCV4. Basic ecosystem services in critical situations, including protection of water catchments and control of erosion of vulnerable soils and slopes.
E.g. forest on steep slopes with avalanche risk above a town.
HCV5. Sites and resources fundamental for satisfying the basic necessities of local communities or indigenous peoples (for livelihoods, health, nutrition, water, etc.), identified through engagement with these communities or indigenous peoples.
E.g. key hunting areas for communities living at subsistence level.
HCV6. Sites, resources, habitats and landscapes of global or national cultural, archaeological or historical significance, and/or of critical cultural, ecological, economic or religious/sacred importance for the traditional cultures of local communities or indigenous peoples, identified through engagement with these local communities or indigenous peoples.
E.g. sacred burial grounds within a forest management area or new agricultural plantation.
Figure 9 - High Conservation Values
habitat that may harbour significant concentrations of HCV 1 species. That area would need to be man-aged to ensure that those particular species and their habitats survive. Similarly, a Key Biodiversity Area could also qualify for HCV 1 and HCV 3, as KBAs harbour not only threatened biodiversity but also significant congregations, unique species as-semblages or outstanding biological processes and are endorsed by international NGOs (section 1.4). The Red List of Ecosystems, when available, will be a useful data source for evaluating HCV 3 because it can help identify priority ecosystems, especially in countries with limited data sets. Knowledge products are important for identifying HCVs in a given area, but the identification process must also draw on other data sources as required,
such as stakeholder and expert consultations, desk studies and even new field surveys if necessary. The reason is that the knowledge products may contain little or no information on an assessment area, or the resolution provided by the knowledge products may be insufficient to determine whether an HCV is present or absent. For example, a species listed glo-bally as Least Concern (LC) by The IUCN Red List of Threatened SpeciesTM but classed as locally rare or threatened by a National Red List could still qualify as an HCV. Examples 2 and 9 in this guide show how knowledge products have supported identifi-cation and management decisions in HCV areas.
More information:http://www.hcvnetwork.org
* Source: http://www.hcvnetwork.org/about-hcvf/the-six-high-conservation-values

34
Biodiversity for Business: A guide to using knowledge products delivered through IUCN
The Global Reporting Initiative (GRI) is a non-profit organization that promotes the use of sustainability reporting as a way for organizations to become more sustainable and thereby contribute to sus-tainable development. A sustainability report is a report published by a company or organization about the economic, environmental and social im-pacts caused by its everyday activities.
* Figures for ‘Partially’ and ‘Not’ reported may reflect the fact that GRI reporting organizations need not report on these Indicators if they are not applicable or not material. Total number of reports: 717 (including G3 and G3.1. reporting). Source: Sustainability Disclosure Database - http://database.globalreporting.org (accessed on 28/11/2013).
GRI has pioneered and developed a comprehensive Sustainability Reporting Framework that is widely used around the world. The Framework includes the Reporting Guidelines, Sector Guidance and oth-er resources, and results in greater organizational transparency and accountability. Thousands of or-ganizations of all sizes and in all sectors use GRI’s Framework to understand and communicate their sustainability performance.
Organizations involved: Global Reporting Initiative
Knowledge products and the Global Reporting InitiativeEXAMPLE 13
Indicator AspectKnowledge product
recommended by G4Number of times
reported*
G4-EN9: Water sources significantly affected by withdrawal of water
Water The IUCN Red List of Threatened SpeciesTM
Fully: 37% (264)
Partially: 5% (26)
Not: 58% (412)
G4-EN26: Identity, size, protected status, and biodiversity value of water bodies and related habitats signifi-cantly affected by the organization’s discharges of water and runoff
Effluents and Waste
Protected Planet;
The IUCN Red List of Threatened SpeciesTM
Fully: 64% (429)
Partially: 14% (102)
Not: 21% (151)
G4-EN11: Operational sites owned, leased, managed in, or adjacent to, protected areas and areas of high bio-diversity value outside protected areas
Biodiversity Protected Planet;
Key Biodiversity Areas
Fully: 40% (282)
Partially: 9% (61)
Not: 52% (369)
G4-EN12: Description of significant impacts of activities, products, and services on biodiversity in protected areas and areas of high biodiversity value outside protected areas
Biodiversity Protected Planet;
Key Biodiversity Areas
Fully: 41% (293)
Partially: 7% (50)
Not: 52% (369)
G4-EN13: Habitats protected or re-stored
Biodiversity Protected Planet Fully: 32% (228)
Partially: 7% (47)
Not: 61% (437)
G4-EN14: Total number of IUCN Red List species and national conserva-tion list species with habitats in areas affected by operations, by level of extinction risk
Biodiversity The IUCN Red List of Threatened SpeciesTM
Fully: 34% (244)
Partially: 10% (70)
Not: 56% (398)
Table 5 - Use of knowledge products in the Global Reporting Initiative G4 Guidelines
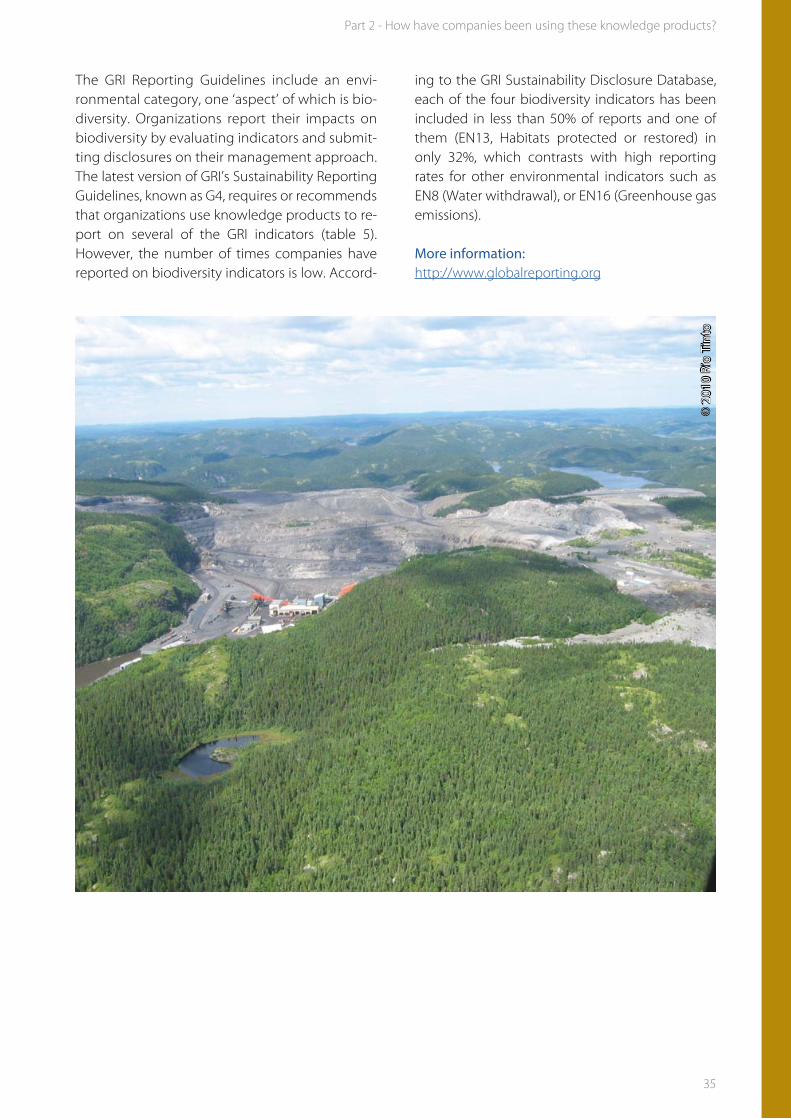
35
Part 2 - How have companies been using these knowledge products?
The GRI Reporting Guidelines include an envi-ronmental category, one ‘aspect’ of which is bio-diversity. Organizations report their impacts on biodiversity by evaluating indicators and submit-ting disclosures on their management approach. The latest version of GRI’s Sustainability Reporting Guidelines, known as G4, requires or recommends that organizations use knowledge products to re-port on several of the GRI indicators (table 5). However, the number of times companies have reported on biodiversity indicators is low. Accord-
ing to the GRI Sustainability Disclosure Database, each of the four biodiversity indicators has been included in less than 50% of reports and one of them (EN13, Habitats protected or restored) in only 32%, which contrasts with high reporting rates for other environmental indicators such as EN8 (Water withdrawal), or EN16 (Greenhouse gas emissions).
More information:http://www.globalreporting.org
© 2
010
Rio
Tint
o

36
Biodiversity for Business: A guide to using knowledge products delivered through IUCN
In recent years the number of standards and certifi-cation schemes has been increasing in response to a demand from consumers and regulators for more sustainable and more environmentally friendly pro-duction processes and a smaller ecological foot-print associated with infrastructure development. Most of these standards and schemes specifically require or recommend the use of information pro-vided by the knowledge products to achieve com-pliance.A review was carried out for this guide which looked specifically at how the use of the knowledge prod-ucts was relevant for achieving compliance with 37 standards and certification schemes in eight differ-ent sectors. Thirty-six of them had been the subject of a 2011 review of their biodiversity requirements (UNEP-WCMC, 2011). These were re-examined with a particular focus on the knowledge products, and the Global Reporting Initiative was added as a cross-sector standard on sustainability reporting, making a final total of 37. These 37 standards were grouped
into eight sectors, including forestry (e.g. the Forest Stewardship Council – FSC), mining (e.g. the Re-sponsible Jewellery Council – RJC), lending (e.g. the Asian Development Bank Safeguard) and fisheries and aquaculture (e.g. the Aquaculture Stewardship Council). A complete list of the standards is availa-ble in UNEP-WCMC (2011).Direct and indirect references to knowledge prod-ucts were taken into account. In some cases the use of knowledge products was specifically re-quired in order to comply fully with the standard (direct reference). In other cases knowledge prod-ucts were not mentioned but would need to be used to address the requirements (indirect refer-ence). For example, the requirement to avoid or mitigate impacts to High Conservation Value areas (HCVs) was common to many standards; since the information contained in knowledge products is needed to complete a comprehensive HCV assess-ment, as example 12 (page 32) shows, this was tak-en to be an indirect reference.
Organizations involved: 37 standards and certification schemes
Knowledge products in sustainability standards and certification schemesEXAMPLE 14
Figure 10 - Proportion of standards that require input from knowledge products
Direct reference: the knowledge product is explicitly mentioned.Indirect reference: use of the knowledge product is not explicitly mentioned but is potentially required or would be useful for compliance.

37
Part 2 - How have companies been using these knowledge products?
Use of The IUCN Red List of Threatened SpeciesTM and the World Database on Protected Areas is re-quired in almost all the standards and schemes reviewed, with direct references in 78% of them (figure 10). Although direct references to KBAs are not very common (22%), KBAs are potentially important for informing compliance due to the correlation between HCVs and KBAs. If HCVs were regarded as an indirect reference to KBAs, total references to KBA use would rise to 81%. The IUCN Red List of Threatened SpeciesTM and Pro-tected Planet are referred to in most sectors (figure 11), unlike Key Biodiversity Areas. Direct references to KBAs are lacking in Biotrade, Fisheries and Aqua-
culture and are very less common in Finance, Agri-culture, and Forestry although once again the com-plementarity between KBAs and HCVs might fill this gap in the last two,This review shows that the information provided by knowledge products is widely required by standards and certification schemes. However, re-gardless of whether there is a direct or indirect reference or requirement to use a particular knowledge product to comply with the stand-ards, it is important to stress that the terms and conditions of use of the knowledge products pro-vided through IUCN apply in all cases.
Figure 11 - Direct references to knowledge products in 37 standards and certification schemes, by sector
© D
iego
Juffe
-Big
noli

38
Biodiversity for Business: A guide to using knowledge products delivered through IUCN
KEY DEFINITIONS24
Additionality: A property of a biodiversity offset, where the conservation outcomes it delivers are demonstrably new and additional and would not have resulted without the offset (BBOP, 2012).
Biodiversity: The variability among living organ-isms from all sources including, inter alia, terrestrial, marine and other aquatic ecosystems and the eco-logical complexes of which they are a part; this in-cludes diversity within species, between species and of ecosystems (UNEP, 1992).
Biodiversity feature: A feature of biodiversity, such as a species, an ecological system, or an ecological process that planners can use to focus their plan-ning efforts (Ervin et al, 2010).
Ecosystem: Complexes of organisms and their as-sociated physical environment, within an area. They have four essential elements: a biotic complex; an abiotic environment or complex; the interactions within and between them; and a physical space in which these operate (Keith et al., 2013).
Ecosystem services: The suite of benefits that eco-systems provide to humanity (Cardinale et al., 2012).
Like-for-like: In the offsets context, conservation (through the biodiversity offset) of the same type of biodiversity as that affected by the project. Sometimes referred to as in-kind (BBOP, 2012).
Mitigation hierarchy: See box 3 on page 5 of this guide.
ACRONYMS AZE: Alliance for Zero Extinction
ESIA: Environmental and Social Impact Assessment
HCV: High Conservation Value
IBAT: Integrated Biodiversity Assessment Tool
IUCN: International Union for Conservation of Na-ture
IFC: International Finance Corporation
IBA: Important Bird and Biodiversity Area
KBA: Key Biodiversity Area
NNL: No Net Loss
NPI: Net Positive Impact
SCA: Supporting Conservation Action
UNESCO: United Nations Educational, Scientific and Cultural Organization
UNEP-WCMC: United Nations Environment Pro-gramme World Conservation Monitoring Centre
WBCSD: World Business Council on Sustainable Development
Key Definitions & Acronyms
24 This list of key terms has been developed from selected publications and does not necessarily reflect IUCN’s views and policies. For more definitions: http://www.biodiversitya-z.org

39
Bertzky, B., Corrigan, C., Kemsey, J., Kenney, S., Ravil-ious, C., Besançon, C. and Burgess, N. (2012). Protected Planet Report 2012: Tracking progress towards global targets for protected areas. Gland, Switzerland: IUCN and Cambridge, UK: UNEP-WCMC.
BirdLife International (2013). Amaurospiza carrizalen-sis. In: IUCN 2013. IUCN Red List of Threatened Speci-esTM. Version 2013.2. www.iucnredlist.org. Downloaded on 22 March 2014.
BirdLife International (2014) Important Bird Areas factsheet: Caruachi. Downloaded from http://www.birdlife.org on 22/03/2014
Brown, E., Dudley, N., Lindhe, A., Muhtaman, D.R., Stewart, C. and Synnott T. (eds) (2013). ‘Common guidance for the identification of High Conservation Values’. HCV Resource Network. www.hcvnetwork.org/resources/folder.2006-09-29.6584228415/2013_commonguidancev5 [Accessed 12 February 2014].
BBOP (2012). Standard on biodiversity offsets. Wash-ington, D.C.: Business and Biodiversity Offsets Pro-gramme.
Cardinale, B.J., Duffy, J.E., Gonzalez, A., Hooper, D.U., Perrings, C., Venail, P., Narwani, A., Mace, G.M., Tilman, D., Wardle, D.A., Kinzig, A.P., Daily, G.C., Loreau, M., Grace, J.B., Larigauderie, A., Srivastava, D.S. and Naeem, S. (2012). ‘Biodiversity loss and its impact on humanity’. Nature 486:59–67.
Dudley, N. (ed.) (2008). Guidelines for Applying Protect-ed Area Management Categories. Gland, Switzerland: IUCN.
Ervin, J., K. J. Mulongoy, K. Lawrence, E. Game, D. Shep-pard, P. Bridgewater, G. Bennett, S.B. Gidda and P. Bos. (2010). Making Protected Areas Relevant: A guide to integrating protected areas into wider landscapes, seascapes and sectoral plans and strategies. CBD Tech-nical Series No. 44. Montreal, Canada: Convention on Biological Diversity, 94pp.
Gardner, T.A., Von Hase, A., Brownlie, S., Ekstrom, J.M.M., Pilgrim, J.D., Savy, C.E., Stephens, R.T.T, Treweek,
J., Ussher, G.T., Ward, G. and ten Kate, K. (2013). ‘Biodi-versity offsets and the challenge of achieving no net loss’. Conservation Biology 27(6):1254–1264.
GRI (2013). G4 Sustainability Reporting Guidelines. Implementation Manual. Amsterdam, The Netherlands: Global Reporting Initiative. Available at: https://www.globalreporting.org/resourcelibrary/GRIG4-Part2-Implementation-Manual.pdf.
Hanson, C., Ranganathan, J., Iceland, C. and Finisdore, J. (2012). The Corporate Ecosystem Services Review: Guidelines for identifying business risks and opportuni-ties arising from ecosystem change. Version 2.0. Wash-ington, D.C.: World Resources Institute, in association with WBCSD and Meridian Institute. Available at www.wbcsd.org/pages/edocument/edocumentdetails.aspx?id=28&nosearchcontextkey=true.
ICMM (2010). Mining and Biodiversity. A collection of case studies—2010 edition. London, UK: International Council on Mining & Metals.
ICMM and IUCN (2012). Independent report on biodi-versity offsets. Prepared by The Biodiversity Consultancy. London, UK: International Council on Mining & Met-als, and Gland, Switzerland: IUCN. Available at: www.icmm.com/biodiversity-offsets.
IFC (2012). Guidance Note 6. Biodiversity Conservation and Sustainable Management of Living Natural Resourc-es. January 1, 2012. Washington, D.C.: International Fi-nance Corporation.
IUCN (2012). IUCN Red List Categories and Criteria: Ver-sion 3.1. Second edition. Gland, Switzerland and Cam-bridge, UK: IUCN.
IUCN and UNEP-WCMC (2014), The World Database on Protected Areas (WDPA) [On-line]. Cambridge, UK: UNEP- WCMC. Available at: www.protectedplanet.net [Accessed 19/03/2014].
Kaul, I., Grunberg, I. and Stern. M. A. (1999). Global Pub-lic Goods: International Cooperation in the 21st Century. New York, NY: Oxford University Press for the United Nations Development Programme.
References

40
Biodiversity for Business: A guide to using knowledge products delivered through IUCN
Keith, D.A., Rodríguez, J.P., Rodríguez-Clark, K.M., Ni-cholson, E., Aapala, K., et al. (2013). ‘Scientific founda-tions for an IUCN Red List of Ecosystems’. PLoS ONE 8(5):e62111.
Langhammer, P.F., Bakarr, M.I., Bennun, L.A., Brooks, T.M., Clay, R.P., Darwall, W., Silva, N.D., Edgar, G.J., Fish-pool, L.D.C., Foster, M.N., Knox, D.H., Matiku, P., Radford, E.A., Rodrigues, A.S.L., Salaman, P., Sechrest, W., Tordoff, A.W. (2007). Identification and gap analysis of Key Biodi-versity Areas. Gland, Switzerland: IUCN.
Lopoukhine, N. and Ferreira de Souza Dias, B. (2012). ‘What does Target 11 really mean?’ PARKS Journal 18(1):5–8. Available at: https://cmsdata.iucn.org/downloads/editorial_18_1.pdf.
Mace, G.M., Collar, N.J., Gaston, K.J., Hilton-Taylor, C., Akçakaya, H.R., Leader-Williams, N., Milner-Gulland, E.J. and Stuart, S.N. (2008). ‘Quantification of extinction risk: IUCN’s system for classifying threatened species’. Conservation Biology 22(6):1424–1442.
Newsom, D. and Hughell, D. (2011). ‘The contribution of Rainforest Alliance/Forest Stewardship Council certification to the conservation of World Heritage Sites’. Available at: http://www.rainforest-alliance.org/publications/unesco-world-heritage-sites.
Oliveira-Miranda, M.A. (2013). Riesgo de Colapso de los ecosistemas terrestres de Venezuela y su relación con el riesgo de extinción de mamíferos y aves. PhD Dissertation. Universidad Simón Bolívar, Caracas, Ven-ezuela. 194 pp.
Ochoa, J. & Rivas, B. (2008). Neusticomys venezuelae. In: IUCN 2013. IUCN Red List of Threatened SpeciesTM. Version 2013.2. www.iucnredlist.org. Downloaded on 22 March 2014.
Peh, K.S.-H., Balmford, A., Bradbury, R.B., Brown, C., Butchart, S.H.M., Hughes, F.M.R., Stattersfield, A., Tho-mas, D.H.L., Walpole, M., Bayliss, J., Gowing, D., Jones, J.P.G. , Lewis, S.L., Mulligan, M., Pandeya, B., Stratford, C., Thompson, J.R., Turner, K., Vira, B., Willcock, S. and Birch, J.C. (2013). ‘TESSA: A toolkit for rapid assessment of ecosystem services at sites of biodiversity conserva-tion importance’, Ecosystem Services 5:51–57.
Pilgrim, J.D., Brownlie, S., Ekstrom, J.M.M., Gardner, T.A., von Hase, A., Kate, K.t., Savy, C.E., Stephens, R.T.T., Tem-ple, H.J., Treweek, J., Ussher, G.T. and Ward, G. (2013).
A process for assessing the offsetability of biodiversity impacts. Conservation Letters 6(5):376–384.
Rio Tinto (2008). Rio Tinto and biodiversity: Achieving results on the ground. London, UK and Melbourne, Australia: Rio Tinto. Available at: www.riotinto.com/documents/Repor tsPublications/RTBidoversitystrategyfinal.pdf.
Temple, H.J., Anstee, S., Ekstrom, J., Pilgrim, J.D., Rab-enantoandro, J., Ramanamanjato, J.-B., Randriatafika, F. and Vincelette, M. (2012). Forecasting the path towards a Net Positive Impact on biodiversity for Rio Tinto QMM. Gland, Switzerland: IUCN.
TBC and FFI (2012). Net Positive Impact Forecast for the Oyu Tolgoi project. Cambridge, UK: The Biodiversity Consultancy Ltd and Fauna & Flora International, unpublished draft report, May 2012. Available at: ot.mn/sites/default/files/documents/ESIA_BA5_Net_Positive_Impact_Forecast_for_the_Oyu_Tolgoi_Project.pdf.
UNEP (1992). Convention on Biological Diversity. Mon-tréal, Canada: Secretariat of the Convention on Bio-logical Diversity.
UNEP-WCMC (2011). Review of the biodiversity require-ments of standards and certification schemes: A snap-shot of current practice. CBD Technical Series No 63. Montréal, Canada: Secretariat of the Convention on Biological Diversity.
WBCSD (2011). Guide to Corporate Ecosystem Valuation. A framework for improving corporate decision-making. Geneva, Switzerland: World Business Council for Sus-tainable Development. Available at www.wbcsd.org/Pages/EDocument/EDocumentDetails.aspx?ID=104&NoSearchContextKey=true.
WBCSD (2012). ‘Integrating biodiversity conservation into the forest management model’. In: Biodiversity and ecosystem services: Scaling up business solutions, pp. 32–33. Geneva, Switzerland: World Business Coun-cil for Sustainable Development.
WBCSD (2013). Eco4Biz—Ecosystem services and bio-diversity tools to support business decision-making. Geneva, Switzerland: World Business Council for Sus-tainable Development. Available at www.wbcsd.org/eco4biz2013.aspx.

Biodiversity for BusinessA guide to using knowledge products deliveredthrough IUCN
International Union for Conservation of Nature
INTERNATIONAL UNIONFOR CONSERVATION OF NATURE
WORLD HEADQUARTERSRue Mauverney 281196 Gland, SwitzerlandTel: +41 22 999 0000Fax: +41 22 999 0002www.iucn.org