biodegradable municipal waste management in europe gerry carty the parliamentary sustainable waste...
TRANSCRIPT
Biodegradable Municipal Waste Management in Europe
Gerry Carty
The Parliamentary Sustainable Waste Group and Environmental Services Association 28th January 2003
Terrace Marquee, House of Commons, Westminster
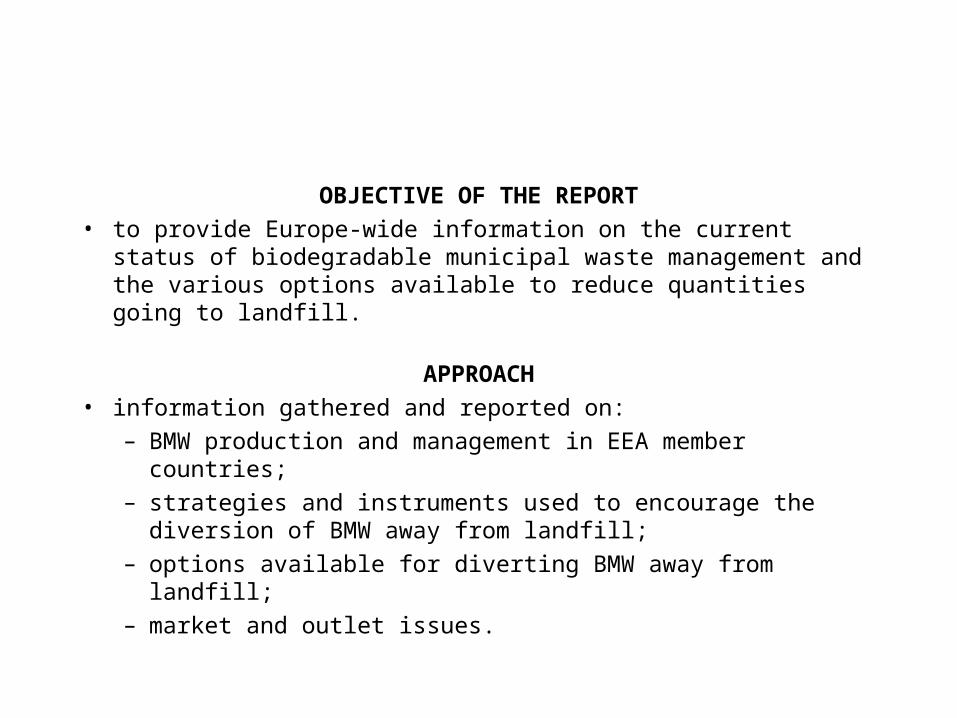
OBJECTIVE OF THE REPORT
• to provide Europe-wide information on the current status of biodegradable municipal waste management and the various options available to reduce quantities going to landfill.
APPROACH
• information gathered and reported on:
– BMW production and management in EEA member countries;
– strategies and instruments used to encourage the diversion of BMW away from landfill;
– options available for diverting BMW away from landfill;
– market and outlet issues.

Biodegradable Municipal Waste (BMW)
• what is it?
• how much is generated in the European Community?
• what happens to it?
• how do different countries manage it?
• what are the implications of the Landfill Directive for it?
• what steps are needed to maximise diversion of BMW away from landfill and its subsequent recovery?
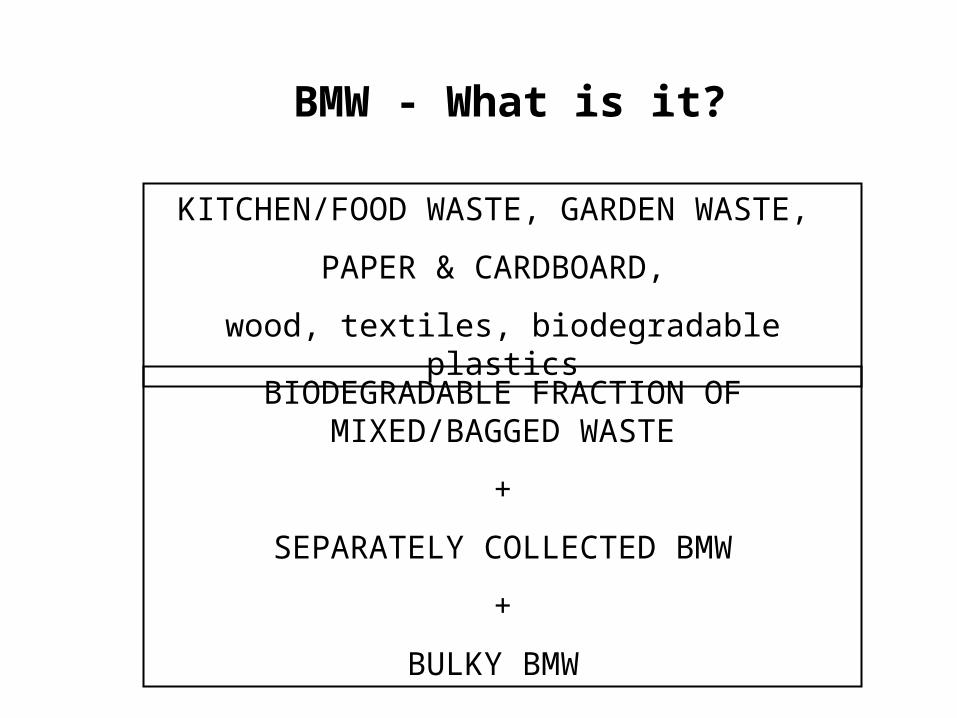
BMW - What is it?
KITCHEN/FOOD WASTE, GARDEN WASTE,
PAPER & CARDBOARD,
wood, textiles, biodegradable plastics
BIODEGRADABLE FRACTION OF MIXED/BAGGED WASTE
+
SEPARATELY COLLECTED BMW
+
BULKY BMW

Biodegradable Municipal Waste (BMW)How much is produced?
MEAN PER CAPITA PRODUCTION
0.30 +/- 0.06 tonnes/annum
POPULATION (EU15)
375,346,000
ESTIMATED TOTAL PRODUCTION (EU15)
113,000,000 tonnes
[90,000,000 - 135,000,000 TONNES]

Biodegradable Municipal Waste (BMW)What happens to it?
Incineration (ER)17%
Incineration (NoER)2%
Composting11%
Other Recovery0%
Recycling11%
Unspecified4%
Landfill54%

0
10
20
30
40
50
60
70
80
90
100
Belg
ium
(Fla
nd
ers
)
Au
str
ia
Th
e N
eth
erl
an
ds
Den
mark
Bad
en
-Wⁿr
ttem
bu
rg
Norw
ay
Fin
lan
d
UK
(E
ng
lan
d &
Wale
s)
Fra
nce
Italy
Irela
nd
Cata
lon
ia
Separately Collected
Bagged Waste
Collection Practice in Countries and Regions Surveyed

0%
20%
40%
60%
80%
100%
Den
mar
k
Net
herl
ands
Bel
gium
Aus
tria
Bad
en-W
ⁿrtt
embu
rg
Fran
ce
Nor
way
Finl
and
Ital
y
Cat
alon
ia
UK
(Eng
land
& W
ales
)
Irel
and
Unspecified
Mechanical-Biological Pre-Treatment
Anaerobic Digestion
Recycling
Central Composting
Incineration without EnergyRecovery
Incineration with EnergyRecovery
Landfill
Management of BMW in Countries and Regions Surveyed

BMW: What happens to it?LANDFILL
0
10
20
30
40
50
60
70
80
90
100
Irelan
d
UK (Eng
land
& Wale
s)
Catalo
nia Italy
Finlan
d
Norway
Franc
e
Baden
-Wür
ttem
burg
Austri
a
Belgium
(Flan
ders
)
The N
ethe
rland
s
Denm
ark
%

BMW: What happens to it?INCINERATION
0
5
10
15
20
25
30
35
40
45
50
%
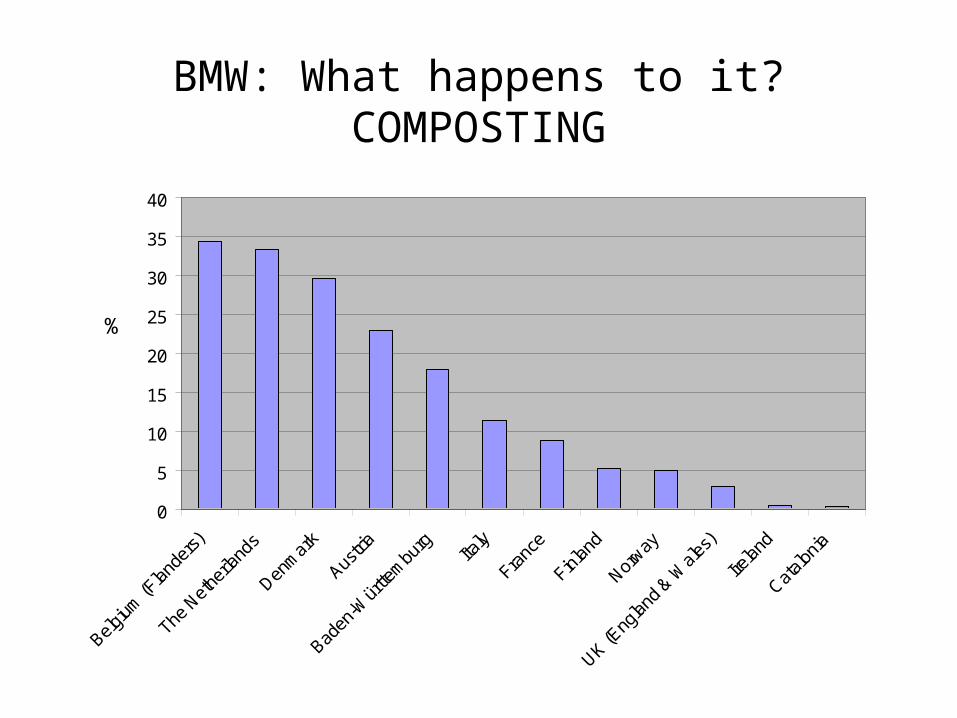
BMW: What happens to it?COMPOSTING
0
5
10
15
20
25
30
35
40
Belgium
(Flan
ders
)
The N
ethe
rland
s
Denm
ark
Austri
a
Baden
-Wür
ttem
burg
Italy
Franc
e
Finlan
d
Norway
UK (Eng
land
& Wale
s)
Irelan
d
Catalo
nia
%

BMW: What happens to it?MATERIAL RECYCLING
0
5
10
15
20
25
30
35
40
Baden
-Wür
ttem
burg
Austri
a
Belgium
(Flan
ders
)
Finlan
d
Norway
The N
ethe
rland
s
Denm
ark
Irelan
dIta
ly
UK (Eng
land
& Wale
s)
Catalo
nia
Franc
e
%
Separate Collection and Diversion from Landfill
GENERAL FINDING
COUNTRIES WITH HIGH LEVELS OF DIVERSION AWAY FROM LANDFILL HAVE HIGH RATES OF SEPARATE COLLECTION

05
101520253035404550556065707580859095
100
19
93
19
94
19
95
19
96
19
97
19
98
19
99
20
00
20
01
20
02
20
03
20
04
20
05
20
06
20
07
20
08
20
09
20
10
20
11
20
12
20
13
20
14
20
15
20
16
20
17
20
18
Year
% o
f B
MW
Pro
du
ce
d i
n 1
99
5
Th
at
Ca
n b
e C
on
sig
ne
d t
o L
an
dfi
ll
Target 1 - 2006/2010
Target 2 - 2009/2013
Target 3 - 2016/2020
LANDFILL DIRECTIVE TARGETS FOR BMW
BASELINE - BMW PRODUCED IN 1995
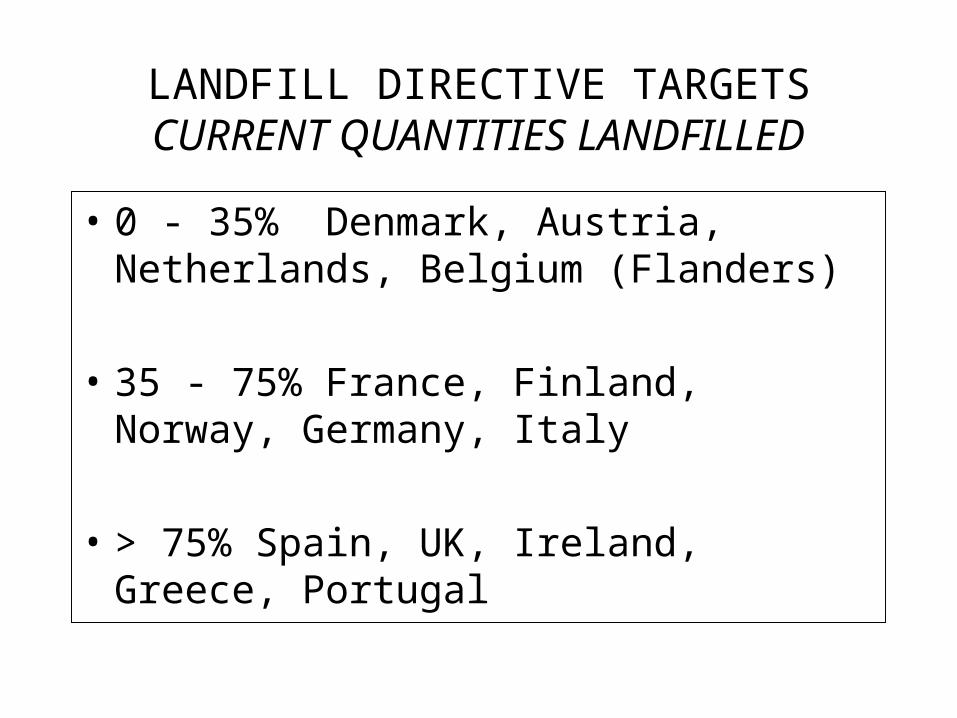
LANDFILL DIRECTIVE TARGETSCURRENT QUANTITIES LANDFILLED
• 0 - 35% Denmark, Austria, Netherlands, Belgium (Flanders)
• 35 - 75% France, Finland, Norway, Germany, Italy
• > 75% Spain, UK, Ireland, Greece, Portugal

NETHERLANDS
Future Scenarios
0
1
2
3
4
5
6
7
8
9
10
19
95
19
96
19
97
19
98
19
99
20
00
20
01
20
02
20
03
20
04
20
05
20
06
20
07
20
08
20
09
20
10
20
11
20
12
20
13
20
14
20
15
20
16
20
17
20
18
Year
BM
W (
Mil
lio
n T
on
ne
s)
Landfill DirectiveTargets
Scenario 1 (1%growth)
Scenario 2 (2%growth)
Scenario 3 (3%growth)
Scenario 4 (GDP)
Scenario 5 (PrivateConsumption)

NETHERLANDS
Treatment Routes
0
5
10
15
20
25
30
35
40
% o
f each
Ma
na
gem
en
t R
ou
te
1995 1998
Landfill
Incineration withEnergy Recovery
Composting
Recycling
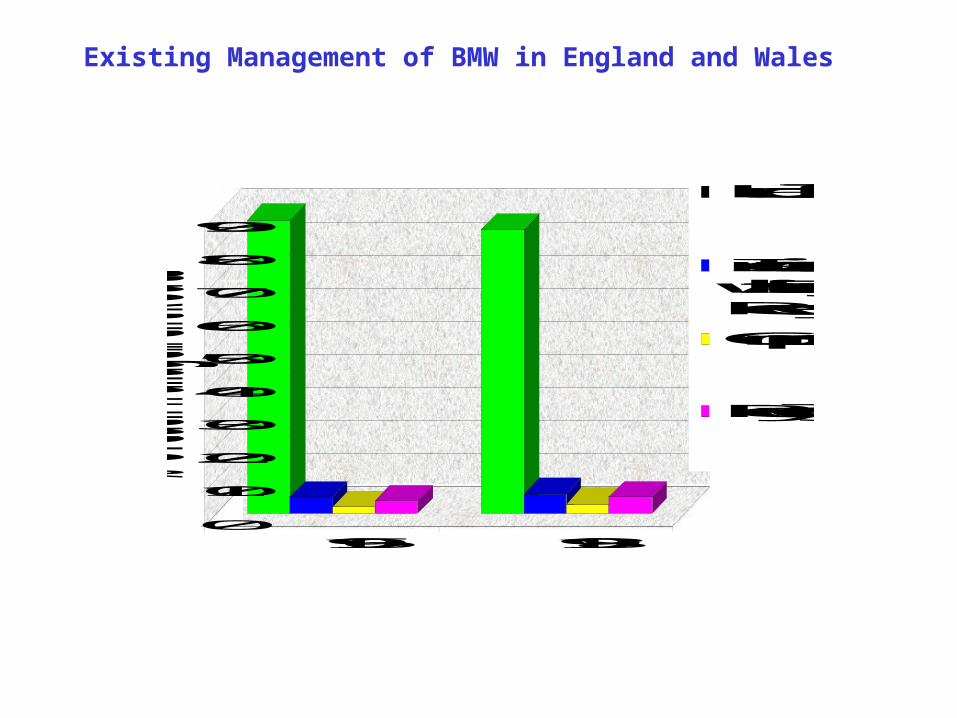
0
10
20
30
40
50
60
70
80
90
% of each Management Route
1996 1998
Landfill
Incinerationwith EnergyRecovery
Composting
Recycling
Existing Management of BMW in England and Wales

Future Projections
0
5
10
15
20
25
30
35
40
45
19
95
19
96
19
97
19
98
19
99
20
00
20
01
20
02
20
03
20
04
20
05
20
06
20
07
20
08
20
09
20
10
20
112
01
22
01
32
01
42
01
52
01
62
01
72
01
82
01
92
02
02
02
12
02
2
Year
BM
W (
Mil
lio
n T
on
ne
s)
Landfill Directive Targets
Landfill Directive Targets(4 Year extension)
Scenario 1 (1% growth)
Scenario 2 (3% growth)
Scenario 3 (GDP)
Scenario 4 (PrivateConsumption)

0
10
20
30
40
50
60
70
80
90
100
Denm
ark
9520
00
Nethe
rland
96
2000
Sweden
200
0
Austri
a 95
1999
Belgium
95
1999
Luxe
mbu
rg 9
519
99
Franc
e 95
2000
Norway
95
2000
Germ
any
9619
98
Spain
2000
United
King
dom
95
1999
%
Recovery Disposal
Figure 7. 7 Municipal waste management in selected countriesof Western Europe, CEEC 1995 and latest year available

0
5
10
15
20
25
30
35
40%
of
ea
ch
Ma
na
ge
me
nt
Ro
ute
1995 1998
Landfill
Incinerationwith EnergyRecovery
Composting
Recycling
Reuse
BELGIUM (Flemish Region) Treatment Routes

BELGIUM (Flemish Region) Future Scenarios
0
0.2
0.4
0.6
0.8
1
1.2
1.4
1.6
1.8
2
2.2
2.4
2.6
2.8
3
3.2
3.4
1995
1996
1997
1998
1999
2000
2001
2002
2003
2004
2005
2006
2007
2008
2009
2010
2011
2012
2013
2014
2015
2016
2017
2018
Year
BM
W (
Mil
lio
n T
on
nes)
Landfill DirectiveTargets
Scenario 1 (1%growth)
Scenario 2 (2%growth)
Scenario 3 (3%growth)
Scenario 4 (GDP)
Scenario 5 (PrivateConsumption)
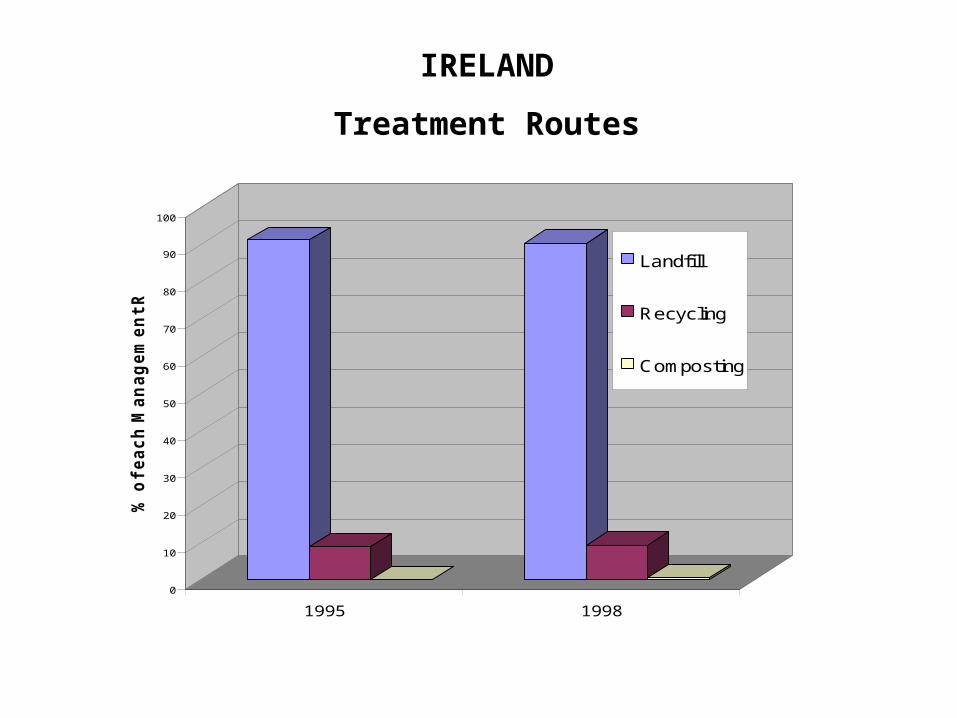
IRELAND
Treatment Routes
0
10
20
30
40
50
60
70
80
90
100
% o
f e
ac
h M
an
ag
em
en
t R
ou
te
1995 1998
Landfill
Recycling
Composting

IRELAND
Future Scenarios
0
0.2
0.4
0.6
0.8
1
1.2
1.4
1.6
1.8
2
2.21
99
51
99
61
99
71
99
81
99
92
00
02
00
12
00
22
00
32
00
42
00
52
00
62
00
72
00
82
00
92
01
02
01
12
01
22
01
32
01
42
01
52
01
62
01
72
01
82
01
92
02
02
02
12
02
2
Year
BM
W (
Milli
on
To
nn
es)
Landfill Directive Targets
Landfill Directive Targets(4 Year extension)
Scenario 1 (1% growth)
Scenario 2 (2% growth)
Scenario 3 (3% growth)
Scenario 4 (GDP)
Scenario 5 (PrivateConsumption)

Biodegradable Municipal Waste (BMW)Maximising diversion from landfill
Phase 1 - Production
Phase 2 - Presentation, Collection and Transfer
Phase 3 - Treatment
Phase 4 - Final Destination (Disposal or Beneficial Use)

Typical Strategies and Instruments Used
INSTRUMENT/PHASE
PHASE 1
PRODUCTION
PHASE 2
PRESENTATION,COLLECTION,TRANSFER &TREATMENT
PHASE 3
TREATMENT
PHASE 4
FINALDESTINATION(DISPOSAL OR
BENEFICIALUSE)
WASTE PREVENTION ANDMINIMISATION
“GREENER” SHOPPING
HOME COMPOSTING
PUBLIC EDUCATION
FISCAL MEASURES
PRODUCERRESPONSIBILITYINITIATIVES AND
USE OF PRESENTATIONBY-LAWS
REQUIREMENT FORSEPARATE COLLECTION
SIGNIFICANT QUANTITIESINCINERATED
BAN ON LANDFILLING OFBMW
BAN ON LANDFILLING OFSPECIFIC BMW FRACTIONS
WASTE TAXES
IDENTIFICATION ANDDEVELOPMENT OF ENDMARKETS

NETHERLANDSKey Diversion Strategies
• High level of separate collection• Ban on landfilling of organic wastes• Landfill and incineration taxes to encourage
diversion to recycling and composting• Waste prevention and minimisation policies• Producer responsibility initiatives for paper sector• Public education

FLANDERSKey Diversion Strategies
• Ban on landfilling of certain separately collected waste streams• Ban on incineration of certain separately collected waste streams• Taxes on landfilling and incineration• Higher collection charges for mixed waste than separately
collected waste• Maximising separate collection and treatment of ‘green’ waste
and VFG waste• Encouraging home composting• Development of central composting capacity• Public education

Conclusions• To achieve the following objectives
– high rates of diversion of BMW away from landfill– high rates of material recovery (material recycling, composting etc.) of BMW
diverted away from landfill
• Actions required– an integrated package of measures from production to final destination– public education programmes– high levels of separate collection– financial instruments to encourage separate collection, discourage landfilling and
encourage recovery– adequate infrastructure for treating wastes collected (eg: organic wastes and
paper wastes)– adequate and reliable outlets for materials diverted from landfill and products
such as compost made from these materials.