bioclimatic design strategies recommendations for …
TRANSCRIPT

Faculty of Urban & Regional Planning, Cairo University Journal of Urban Research, Vol. 39, Jan 2021
Received 14 August 2020; accepted 3 January 2021.
Available online 9 January 2021
Bioclimatic Design Strategies Recommendations for Thermal
Comfort Using Mahoney Tables
Dr. Ghada Elshafei
Assistant Professor, Department of Architectural Engineering, Faculty of Engineering, Minia
University
ABSTRACT
Thermal comfort is the result of a balanced of building frameworks adjusted to both the area of
the structure just as the kind of air move performed inside the structure or the room of the
structure. The aim of this research is to represent the Minia city as a case study based on the
Mahoney tables method to validate the best design strategy in the hot desert bioclimatic region.
Mahoney tables are a collection of referenced tables utilized in construction as a climate-
appropriate design manager coupled with the meteorological data to include the right design
recommendations. So, the Mahoney tables can assess the climate to be more accurately reflect
the environmental conditions in the summer. Also, it can beware of the passive heating
technique as natural ventilation used in the construction of energy-efficient buildings. The
research proceeds with a set of conclusions and recommendations that be gotten from Mahoney
tables climatic characteristics, then the design strategies were recommended. These
recommendations can help architects bring forward a set of bioclimatic design strategies for
buildings in Minia's environment to conduct thermal comfort with the help of the climate
consultant tool.
KEYWORDS: Bioclimatic Design; Climate Consultant; Hot-Desert climate; Mahoney
Tables; Thermal comfort.
ماهوني جداولتوصيات استراتيجيات للراحة الحرارية باستخدام
ملخص البحث
مثل نوع الهواء مبنىغرف الو مبنىالبن ء المعدلة لكل من مسمم حة ال تصمممام توازن من الراحة الحرارية تنتج
للتحقق من ماهونى جداول ح لة ب سمتددا مدينة المنا يدراسمة دراسمة للترياعللىهذه ال وتهدف. هالمتحرك داخل
ه م مولة ل م هونى جداووتعتبر تصمما ض المنققة المن خاة الصمحراوية الح ر . للصمحة فضلمل اسمتراتا اة
تصمممما من سممما للمن ن مقترنا ببا ن اارصممم د ال وية لت ممممل لمن ال داول المرجعاة المسمممتددمة ض البن ء
يم يتلح من ضحص النت ئج الت ت الحصول للاه من الدص ئص المن خاة ل دول ، التصما الصحاحةتوصا
المهندسمان المعم ريان ض تقدي يمكن فن تسم لد المن سمبة والتى التوصماة ب سمتراتا ا التصمما تضقد تم. م هون
الراحة الحرارية. لذلك يمكن تحقاقالمنا لم مولة من اسمممتراتا ا التصمممما المن خ الحاوا للمب ن ض با ة
تقنامة يرالى ل مداول م هون تقاا المنم ن لاكون فيثر د ة لتعكا الوروف البا امة ض الصمممما . فيلمممم يمكن فن
.التهوية القباعاة المستددمة ض ت ااد المب ن الموضر للق ة
مم هون جمداولحم رالصممممحراوا المنم ن ال Climate Consultantتصممممما المنم ن الحاوا :دالاةالكلماات الا
.الراحة الحرارية
1. INTRODUCTION
The Architectural Association's Department of Architecture and Tropical Studies
(AADATS) in London developed a climate-conscious building architecture approach [
BIOCLIMATIC DESIGN STRATEGIES RECOMMENDATIONS FOR THERMAL COMFORT Ghada Elshafei, P59-74
60
Sayigh, et al. 1998]. The approach that is suggested is built on three strategy phases,
the strategy stage of the concept, the planning stage of the proposal, and the design
stage of the components [Givoni, 1992]. They developed the Mahoney tables, which
work on thermal comfort utilizing Standard Effective Temperature (SET) for
systematic study during the three phases. The tables are used to evaluate the features of
the environment, since that architecture indicators are attained. Then an initial image
of the design, shape, orientation, and construction of the environment can be gained
from such indicators. However, these indicators differ from climatic region to another
regarding its bioclimatic characteristics. On the other hand, this study focuses on one
of the cities in Egypt, which has a hot- desert climate.
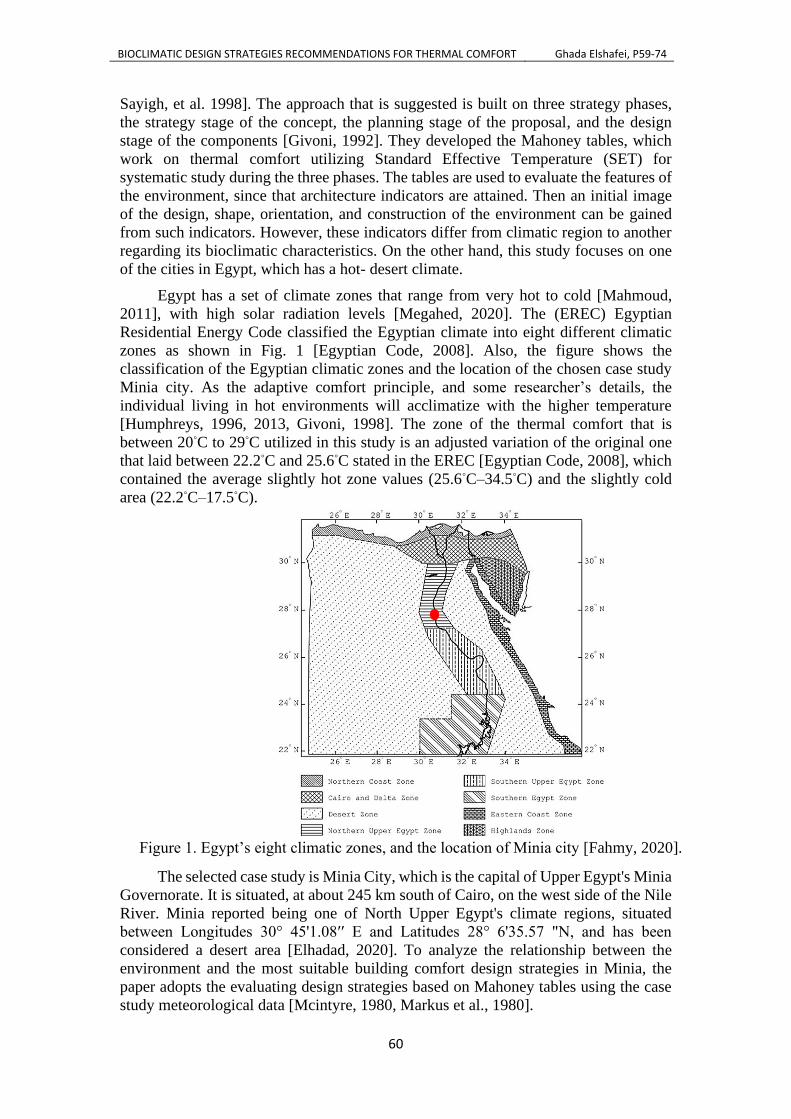
Egypt has a set of climate zones that range from very hot to cold [Mahmoud,
2011], with high solar radiation levels [Megahed, 2020]. The (EREC) Egyptian
Residential Energy Code classified the Egyptian climate into eight different climatic
zones as shown in Fig. 1 [Egyptian Code, 2008]. Also, the figure shows the
classification of the Egyptian climatic zones and the location of the chosen case study
Minia city. As the adaptive comfort principle, and some researcher’s details, the
individual living in hot environments will acclimatize with the higher temperature
[Humphreys, 1996, 2013, Givoni, 1998]. The zone of the thermal comfort that is
between 20◦C to 29◦C utilized in this study is an adjusted variation of the original one
that laid between 22.2◦C and 25.6◦C stated in the EREC [Egyptian Code, 2008], which
contained the average slightly hot zone values (25.6◦C–34.5◦C) and the slightly cold
area (22.2◦C–17.5◦C).
Figure 1. Egypt’s eight climatic zones, and the location of Minia city [Fahmy, 2020].
The selected case study is Minia City, which is the capital of Upper Egypt's Minia
Governorate. It is situated, at about 245 km south of Cairo, on the west side of the Nile
River. Minia reported being one of North Upper Egypt's climate regions, situated
between Longitudes 30° 45'1.08′′ E and Latitudes 28° 6'35.57 "N, and has been
considered a desert area [Elhadad, 2020]. To analyze the relationship between the
environment and the most suitable building comfort design strategies in Minia, the
paper adopts the evaluating design strategies based on Mahoney tables using the case
study meteorological data [Mcintyre, 1980, Markus et al., 1980].

Faculty of Urban & Regional Planning, Cairo University Journal of Urban Research, Vol. 39, Jan 2021
61
This study seeks to improve accommodation construction assistance processes
for building designers in the hot desert region in a more suitable manner for the
collaborative application of vernacular tools. The vernacular structures have various
strategies that are built for their modification to its general climate. The atmosphere
responsive methodologies actualized in vernacular design from many different areas
have the potential for being additionally evolved and adjusted in response to current
needs. The paper is made up of six items. The first segment describes the subject matter
and mentions the objectives. In the second section, the analysis of the literature was
defined. The third section is about describing the methodology, which covers the
vernacular strategies extracted from the findings of the bioclimatic study to be
incorporated and adapted in the architecture of the city, taking into consideration the
occupant's thermal comfort aspects and the process established in this study. The results
of the city object's bioclimatic analysis are presented in Part Four. Section Fifth deals
with outcomes and discussions. The aim is to adjust the housing architecture of the
vernacular solutions and offer different recommendations for building design in Minia,
Egypt. Finally, the sixth section should consist of a conclusion explaining and
synthesizing the collected findings.
2. LITERATURE REVIEW
Defining the principles of bioclimatic construction and making them systematically
applicable is not easy, since this construction is intimately linked to its environment by
nature. By depending on strictly architectural techniques, this style of architecture is
vernacular architecture, while taking into account the local context. Analysis and
evaluation of vernacular design strategies involve methods that account for the inputs
to the thermal equations, the envelope of the building, that allow design strategies effect
assessment for the vernacular envelope. These strategies assessed using three tools
adapted to the hot climates: the bioclimatic graph [Olgyay et al., 1963], the
psychrometric diagram [Szokolay, 2008, Givoni, 1969], and the Mahoney tables
[Givoni, 1978]. Many studies during the last decade focus on the climatic surrounded
environment using these different strategies, where Mahoney tables are one of these
strategies that this study focuses on it.
Aashi et al. 2020, studied in depth the relation between site vernacular
architecture, Mahoney tables, Bioclimatic diagram, and Psychometric chart to frame
the bioclimatic building design guidelines for a hot and dry environment considering
Jaipur City, India situation. They've been framed all-year-round regarding the
environment. They have been summarized the strategies that achieve thermal comfort
by listing the recommendations. The results related to the classified heads are; open
areas must be built for sufficient airflow; however, the living room must be granted due
consideration; Window-to-Wall Ratio (WWR): in the Northern and South walls, 20-
40%, windows should be supported along wind side. Openings should also be given on
the internal walls. Clear sunshine may be left out; Indoor and outdoor walls of high
thermal density, thick roofs with a time lag of 8 hours. Outdoor sleeping and seating
room offered. Appropriate steps should be taken to guard against rain, and irrigation
should be well made.
Mouatassim et al. 2019, interested in the suitable designing of climatic structures
as it is a key for smart energy-saving to deal inactively with undesirable out-of-doors
circumstances. So, they used three bioclimatic design methods, namely Mahoney
tables, Predicted Percentage Dissatisfied (PPD) with the Predicted Mean Vote (PMV)
method, and Givoni’s Building Bioclimatic Chart (BBCC) approach. The study

BIOCLIMATIC DESIGN STRATEGIES RECOMMENDATIONS FOR THERMAL COMFORT Ghada Elshafei, P59-74
62
conducted to evaluate the annual thermal comfort and develop appropriate building
design strategies for east Moroccan environment buildings based on a 10-year weather
file. Their analysis reveals that the Oujda City in Morocco environment offers just 20%
thermal comfort through the normal climatic year, indicating the need for better
construction design to increase the degree of thermal comfort. The research findings
showed that utilizing appropriate bioclimatic architecture will minimize heating and
cooling loads of 45.6% and 9.5% of residential buildings, respectively. They concluded
that the buildings situated in Oujda City have to be aligned from east to west alliance
on Mahoney tables. These buildings have a consolidated design with rigid walls,
medium-sized opening, and without built-in spaces. The most effective passive
architecture techniques used in Oujda City are robust envelopes for thermal mass
construction, solar heating, and natural ventilation at night.
Belkacem et al. 2019, proposed a methodology for building design by combining
vaults and mezzanines as vernacular tools to increase buildings' energy efficiency in
arid areas, and achieve comfort conditions. So, bioclimatic analysis was carried out in
Algeria, Biskra City based on the study of climate characteristics on thermo-isopleths,
psychrometric charts, and Mahoney tables. This analysis helps to identify the city's
comfort zone, which is the first phase in deciding the techniques to be followed to solve
thermal discomfort problems. The results showed a higher thermal load reduction of up
to 20.84% in the energy ratio. The methodology for the building's architectural style in
Biskra has been built and applied to achieve these reductions in energy needs. That
design takes into consideration both the occupants' comfort aspects and the need for
lower energy consumption.
Farheen et al. 2017, sought to investigate techniques unique to contemporary
Lucknow buildings in India for thermal comfort and energy efficiency architecture.
Bioclimatic Map, Degree Days, Psychometric Graph, and Mahoney's Tables are used
for evaluating Lucknow's environment to recommend the criteria for building
architecture. At the project design point, these recommendations should include enough
knowledge to help architects make efficient use of natural resources, minimize
operating costs, and preserve internal thermal comfort through the application of
inactive solar technologies. The results indicated that: the design recommendations for
the Lucknow City as the orientation of the building should be in the north-south
direction, the layout design should be the compact planning around the medium-sized
courtyard, along with shades will be the windows opening on the road to the court,
where the window-to-wall ratio to be 15-20%. In Jun., Jul., Aug., and Sept., dense walls
and roofs with high temperatures, humidity, and 80 percent of the average annual
rainfall are recommended for ventilation. In the cold months of Jan., Feb., Nov., and
Dec., the findings also suggest using passive solar heating. Finally, with the right
drainage scheme, windows can be covered by projections and roofs.
Santy et al. 2017, investigated the Indonesian climate characteristics using the
Olgyay Bioclimatic Map, the Mahoney tables, and the Givoni – Milne Bioclimatic Map
as the predesign step for the growth of a residential inactive home design benchmark.
Jakarta was the city selected for research, in terms of relative humidity, and
temperature. The Olgyay Bioclimatic map shows that the atmosphere needs wind speed
to overcome the air pressure and shade to decrease the solar increase. Natural
ventilation and shading plans are proposed in the Givoni Bioclimatic Map, while the
Mahoney table indorses open places to protect against warm wind, single-packed
rooms, and everlasting air drive. Also, the Mahoney table recommended the opening
composite size at body tallness for allowing the wind to tackle the strong humidity and

Faculty of Urban & Regional Planning, Cairo University Journal of Urban Research, Vol. 39, Jan 2021
63
temperature levels. It suggests heavy walls and roofs, as well as providing safe facilities
with heavy rainfall.
Abdollah et al. 2019, Provided bioclimatic architecture techniques to improve the
indoor thermal comfort of humans in sticky weather zones based on the Köppen
weather category with measuring of temperature. The town of Rasht, Iran, has been
specifically investigated as an issue of research. The first step was to analyze the
climate data relating to the Mahoney table and the Givoni Bioclimatic Map to identify
the suitable bioclimatic architecture techniques to provide the design recommendations.
The findings obtained from Mahoney tables showed that; in Nov., Dec., Jan., Feb.,
Mar., and Apr., the thermal condition is suggested to be maintained with techniques
such as expanded east-west alliance, Single-packed air vent, Wide openings (40–80%
of the wall sector), lightweight walls with little temperature roofs, and warm protected
ground. However, construction approaches against heavy rain are advised for in any
event three months every year. From the test results, Relative Humidity (RH) can be
considered as the main factor and climate indicators of these cities. They also suggested
using the existing construction techniques as natural and night ventilation.
Maria et al. 2016, analyzed the environmentally friendly architecture approaches
implemented in vernacular dwellings for various climatic regions in Cyprus, Greece.
They integrated bioclimatic design features with rural settlement designs, building
typology, the layout of semi-open and open areas, construction materials and
techniques, as well as scale and location of openings in their study. Then the bioclimatic
design features are recorded in comparison with the Mahoney table methodology
recommendations, to examine to what degree the particularly designed structures have
a sustainable architecture pattern, and for a clear approach to local climate and
landscape aspects. They illustrated that building architecture, structure design, and
building construction should take into account the local environment, topography, and
geology. Accordingly, the concepts of architecture are discriminated between the
various climatic regions of Cyprus to achieve optimum thermal adaptation. According
to their recommendation, the passive approaches are widespread in mountainous areas
for optimum solar utilization during winter, as well as defense against frost.
Khalid et al. 2018, studied how to control energy consumption by using the
passive concepts of bioclimatic, and solar building. The case study chosen was (new
Moroccan home, located in Midelt, and Villa in Marrakech), both were situated in
severe climate conditions. Their methodology was based on the building architecture
relationship with climate, thermal comfort, and energy performance. The researchers
utilized multi-tools to investigate climate situations: Mahoney tables, Szokolay
Bioclimatic chart, Olgyay method, and the Givoni Bioclimatic charts. Their results
indicated that regarding the layout, the best orientation is North-South with tight yard
planning, but, in the case of the size of openings, they suggested medium 25-40 %
while, thick walls with thick roofs are recommended. Finally, the external feature
suggested that the spaces for outdoor sleeping are required.
Accordingly, to the analysis for the previous literature studies, it is clear that all
the researchers agreed with each other in the concept. The findings allowed us deduce
that the bioclimatic architecture techniques in different cities and countries could have
comparable environments. However, these strategies achieved the increasing of human
thermal comfort indoors.

BIOCLIMATIC DESIGN STRATEGIES RECOMMENDATIONS FOR THERMAL COMFORT Ghada Elshafei, P59-74
64
3. METHODOLOGY
This research aims to investigate the interaction of the vernacular strategies on
influencing the passive ambient comfort in hot desert zones. To achieve that goal the
study followed the following methodology:
The first step is to study the bioclimatic features of the studied city using the
climate consultant tool. The purpose is to define the effect of the vernacular approaches
arising from this last bioclimatic study on the research target, which incorporates the
essential characteristics as cofactors (indicators) that assess the habitat's energy change.
The results of the bioclimatic study would be then used as a database for the second
step, to formulate the architectural suggestions.
The second step is to examine the vernacular techniques that can be incorporated
into the structure of the design. The Mahoney tables are used to indicate the various
architectural design approaches that can be implemented by the planners based on the
bioclimatic data collected from the climatic consultant tool. That allows for the use of
passive technologies to increase the building's thermal efficiency. Then it is up to the
designers to choose the solution(s) offering the best alternative in optimizing the
metrics, in consideration of the results obtained.
4. BIOCLIMATIC ANALYSIS
4.1. Case Study Analysis
Climate Consultant 6.0 App is one of the tools that allow us to test the features selected
for the case study. It is 'easy-to-use, collaborative programming that displays climatic
information in hundreds of ways that are useful to architects and users. At every hour
of the year, this system provides temperatures, wind direction, humidity, solar radiation,
sundials, and sky cover [Kumar, 2018].
The climate consultant offers the psychrometric chart review that demonstrates
the most effective passive architecture techniques. Whereas, the wind wheel given in
the program combines the wind direction and velocity with parallel temperature and
humidity, which can be shown weekly, regular, or monthly [Murray et al., 2007].
Climate Consultant software [Kumar, 2018] reads the climatic data in the
EnergyPlus Weather File (EPW) format, which the Department of Energy offers.
Climate Consultancy Program has been studying many factors that impact climate
change. Such conditions are discussed in the following.
4.1.1 Temperature analysis
Figure 2 shows Minia City's temperature variation over the year, suggesting a dry
atmosphere in Minia with a balm summer and a quietly cold winter. Where the typical
temperatures vary from high 36.6oC in July and too low 19.4oC in January; also,
precipitation varies from 52% to 25% in January, air velocity falls from 4.2 to 3.4 in
August. The study concluded from the analysis of the various climatic parameters
throughout the year, that August and July are considered the critical months needed to
be considered to achieve thermal comfort.
The hourly average temperature is seen in Fig. 3; Where, on the abscissa and the
ordinate, the side temperature is showing the monthly variability. The position,
longitude/latitude, elevation, and other information is viewed in the Map's top-right
corner, which brings focus to August as a significant month to review. Fig. 4 displays

Faculty of Urban & Regional Planning, Cairo University Journal of Urban Research, Vol. 39, Jan 2021
65
Figure 2. Minia City weather data summary [Climate Consultant tool].
Figure 3. Minia City Hourly Average temperature [Climate Consultant tool].
the temperature variability and adaptive comfort as the gray part; the bar chart also
shows the average temperature above and below the mean value, whereas the yellow
portion shows the standard high and low temperature at 23-30°C and 22-15°C
respectively. High-temperature architecture and low-temperature construction fall
within the spectrum of respectively 29-39°C and 15-1°C.
4.1.2. Wind speed analysis
Variation of wind speeds is caused by air passing from the high to the low level, that
moving due to the temperature changes. Where the number of degrees that are measured
from the north with the clockwise direction is referred to as the wind direction.
The Climate Data Analysis reveals the month-to-month dedication, where, the
additions between lines are measured at 10 degrees. After being enrolled 12 mph
maximum, the estimated breeze speed is natural as 1-5 mph. The wind rose, defines
the prevailing frequency, direction, and intensity of the weather in the city, as seen in
Fig. 5. The Red shading displays temperature ranges between 27-38°C, and deep red
shading indicates temperatures over 38°C. Medium green shading shows a relative
humidity of 30-70 percent. The triangle shape in the light orange shading of the pencil
nib reflects low wind speed, while the dark orange line indicates high velocity.

BIOCLIMATIC DESIGN STRATEGIES RECOMMENDATIONS FOR THERMAL COMFORT Ghada Elshafei, P59-74
66
4.2. Mahony Tables Analysis for Minia City
Mahoney Tables are a compilation of reference tables for measuring heat and cold
indicators, wet and dry conditions for each month using monthly temperature, relative
humidity, and precipitation. The synthesis of these metrics can be translated into easy
architecture recommendations: reduction/increase of sun exposure, the arrangement of
spaces by activity and functionality, and many other recommendations [Sealey, 1979].
Such bioclimatic analysis and thermal indicators allow the measurement of
thermal comfort to be on a global scale, hence the integration of knowledge will gain
general feedback for the initial stages in the design process. Even if these indicators are
gained from datasets or measurements, these shouldn’t be converted directly into
energy-efficient designs [Sellem et al., 2007]. However, this analysis provides a
framework for designers 'How to Design' to help them to understand the techniques like
these indicators [Kemajou, 2011]. Also, the design process in some climatic regions
(hot, arid, and desert) needs assistance tools to achieve thermal comfort or to decrease
energy consumption which is from the concepts of green construction [Susanne et al.,
2014].
Figure 4. Minia City temperature ranges and the adaptive comfort [Climate Consultant tool].
Figure 5. Minia city’s wind wheel [Climate Consultant tool].

Faculty of Urban & Regional Planning, Cairo University Journal of Urban Research, Vol. 39, Jan 2021
67
The Mahoney tables analyze the meteorological parameters such as the monthly
lowest temperature, average monthly high temperature, mean monthly range, relative
humidity, and precipitation. These parameters are gotten from the analysis in Sec 4.1
as input data for the Mahoney tables to get a suitable strategy for designing in Minia
City to complete the Minia climate analysis. Where Table 1 Indicates the humidity
group as mentioned in Mahoney tables to classify the mean relative humidity ranges
between groups 2, and 3 in Minia City.
The first step to get the strategies for the design in Minia is to analyze the climatic
data, so, Table 2 summarizes the climatic data for the location. However, we can
calculate the Annual Mean Temperature (AMT) using Eq. (1). Table 3 gives the
monthly mean max., min., a range for the relative humidity in Minia City. However,
we can observe that the highest monthly mean humidity is 67 in December and the
lowest monthly mean is 36 in May; Also, we can calculate the Annual Mean Range of
humidity (AMR) using Eq. (2). Also, the annual average rainfall for Minia City is 0.5
mm.
AMT = (Highest + Lowest)/2 = 21.3 oC Eq. (1)
AMR = Highest – Lowest = 31 % Eq. (2)
Table 1. The Classification of Mean Relative Humidity Regarding the Humidity
Group.
Mean Relative Humidity Humidity Group (HG)
Below 30% 1
30-50% 2
51-70% 3
Above 70% 4
Table 2. Minia Climatic Data Analysis.
Month J F M A M J J A S O N D AMT
Monthly mean max(oC) 21 22 26 31 35 35 37 36 33 32 27 22.5 21.3 Day comfort upper (oC) 29 29 29 31 31 31 29 29 29 29 29 29 Day comfort lower (oC) 23 23 23 25 25 25 23 23 23 23 23 23 Monthly mean min (oC) 4 5 8 12 16 18 20 20 18 15 11 7.5 Night comfort upper (oC) 23 23 23 24 24 24 23 23 23 23 23 23 Night comfort lower (oC) 17 17 17 17 17 17 17 17 17 17 17 17 Thermal stress day C C N N H H H H H H N C Thermal stress night C C C C C N N N N C C C
* Where, C: below comfort limit; N: within comfort limit; H: above comfort limit.
Table 3. Monthly Relative Humidity Means Max, Min., Range in Minia City.
Month J F M A M J J A S O N D AMR
Monthly mean max. (%) 60.5 54 54 47.5 41 47 47 54 60 60 59 67* 31
Monthly mean min. (%) 56 51 49 41 36# 41 45 50 56 54 59 61
Monthly mean range (%) 58 52.5 51.5 44 38.5 44 46 52 58 57 59 64

BIOCLIMATIC DESIGN STRATEGIES RECOMMENDATIONS FOR THERMAL COMFORT Ghada Elshafei, P59-74
68
RH 17 17 18 19 19 17 17 16 15 17 16 15
HG 3 3 3 2 2 2 2 3 3 3 3 3
* Highest monthly mean; #Lowest monthly mean; HG: Humidity Group; RH: Relative Humidity.
4.2.1. The thermal comfort limits in Mahoney tables
The Mahoney tables evaluate the citizen's climate adaptability in various climatic
regions to assess thermal comfort limits and split the comfort zones into three
temperatures. Ranges of the AMT level are: ≥ 20°C, 15 ~ 20°C and <15oC. Also, the
tables take into consideration people's variations in day and night clothing patterns,
behaviors and reduce the gap between day and night thermal comforts, as shown in
Table 4.
4.2.2. The analysis of comfort limits in every month
The monthly mean maximum and minimum of the site concerned are correlated with
the comfort limits during daytime and nighttime for each particular month, based on
the annual average scopes specified in Table 4 (maxima with a limit of day comfort and
minimal with a limit of night comfort). The classifications of humidity and comfort
levels are correlated to humidity and dry indicators for each month, as indicated in
Table 5.
Table 6 calculates the total indicators based on the data that indicated in Table 5;
however, we can direct the indicators for each month using the HG, thermal stress, and
monthly mean temperature range that given in Table 2. Where these indicators From
H1 to A3 indicated in the previous tables can be defined as the following [Xia, 2013]:
H1 means that there is substantial air circulation. It happens when high
temperatures "day thermal stress= H" are merged with high humidity equal to 4, or
when high temperatures are combined with humidity (HG = 2 or 3) with minimal
diurnal variance (< 10 ° C). H2 shows the desirability of air motion. It happens when
the temperature is coupled with high humidity (HG = 4) beyond the comfort range “day
thermal stress = N”. H3, indicates safeguards are required in contradiction of rain
dissemination. Difficulties may occur with only small precipitation, but as rainfall
reaches 200 mm per month, it would be unavoidable. A1 needs thermal energy.
Happens where a broad diurnal spectrum correlates with high to low humidity (HG =1,
2, or 3) (10oC or more). A2 indicates whose outdoor living area is ideal. If the nightly
temperature is elevated “night thermal stress = H”, and (HG =1 or 2), then it is
necessary. Even when nights are cold outdoors yet hot indoors related to massive
thermal storage “day = H, night = N, HG=1or 2”, and when the day temperature is
overhead 10°C, it might be required. A3 refers to the issue of winter or cold season,
which arises throughout the day while there is thermal stress = C. That total of the
monthly indicator can help to recommend design strategies, which will be discussed in
the following section.
Table 4. The Comfort limits.
Comfort
Range
Average RH
HG AMT over 20℃ AMT 15-20℃ AMT under
15℃
Day Night Day Night Day Night
Below 30% 1 26-34 27-25 23-32 14-23 21-30 12-21
30-50% 2 25-31 17-24 22-30 14-22 20-27 12-20
51-70% 3 23-29 17-23 21-28 14-21 19-26 12-19
Above 70% 4 22-27 17-21 20-25 14-20 18-24 12-18

Faculty of Urban & Regional Planning, Cairo University Journal of Urban Research, Vol. 39, Jan 2021
69
Table 5. Marking of Humid and Arid Indicators.
indicator Thermal stress Monthly
Rainfall
HG Monthly
Mean Tem.
Range Day Night
H1 (Air movement essential)
H 4
H 2,3 >10oC
H2 (Air movement desirable) N 4
H3 (Rain Protection) <200 mm/month
A1 (Thermal storage) 1,2,3 <10oC
A2 (Outdoor sleeping) H 1,2
H N 1,2 <10oC
A3 (Cold season problem) C *Where H, Hot; N, Comfortable; C, Cold.
Table 6. The Indicators for Each Month.
Month / Indicator J F M A M J J A S O N D Total
Hu
mid
H1 Air movement essential 0
H2 Air movement desirable 0
H3 Rain Protection 0
Ari
d A1 Thermal storage O O O O O O O O O O O O 12
A2 Outdoor sleeping O O 2
A3 Cold season problem O O O 3
Table 7. Urban and Design Recommendations for Minia City.
Recommendations
The total indicators from Table 6.
Arid Humid
A3 A2 A1 H3 H2 H1
3 2 12 0 0 0
Layout
Building oriented on the east to the west axis to reduce exposure to the sun
1 0-10
5-12 11,12
Compact courtyard planning 2 ★ 0-4
Spacing
Open spacing for breeze penetration 3 11,12
As 3, but protect from cold/hot wind 4 2-10
Compact planning 5 ★ 0,1
Air movement
Rooms single banked. Permanent provision for air movement 6 1-12
0-5 1,2
Double banked rooms with temporary provision for air movement 7 6-12
2,12
No air movement required 8 ★ 0,1
Openings
Large openings, 40-80% of N and S 9 0 0,1
Very small openings,10-20% Any other conditions 10 ★ 0,1 11,12
Medium openings,20-40% 11 Any other conditions
Walls
Light walls; short time lag 12 0-2
Heavy external and internal walls 13 ★ 3-12
Roofs
Lightly insulated roofs 14 0-5
Heavy roofs; over 8 hours’ time lag 15 ★ 6-12
Outdoor sleeping
Space for outdoor sleeping required 16 ★ 2-12
Rain protection
Protection from heavy rain needed 17 -- 3-12
BIOCLIMATIC DESIGN STRATEGIES RECOMMENDATIONS FOR THERMAL COMFORT Ghada Elshafei, P59-74
70
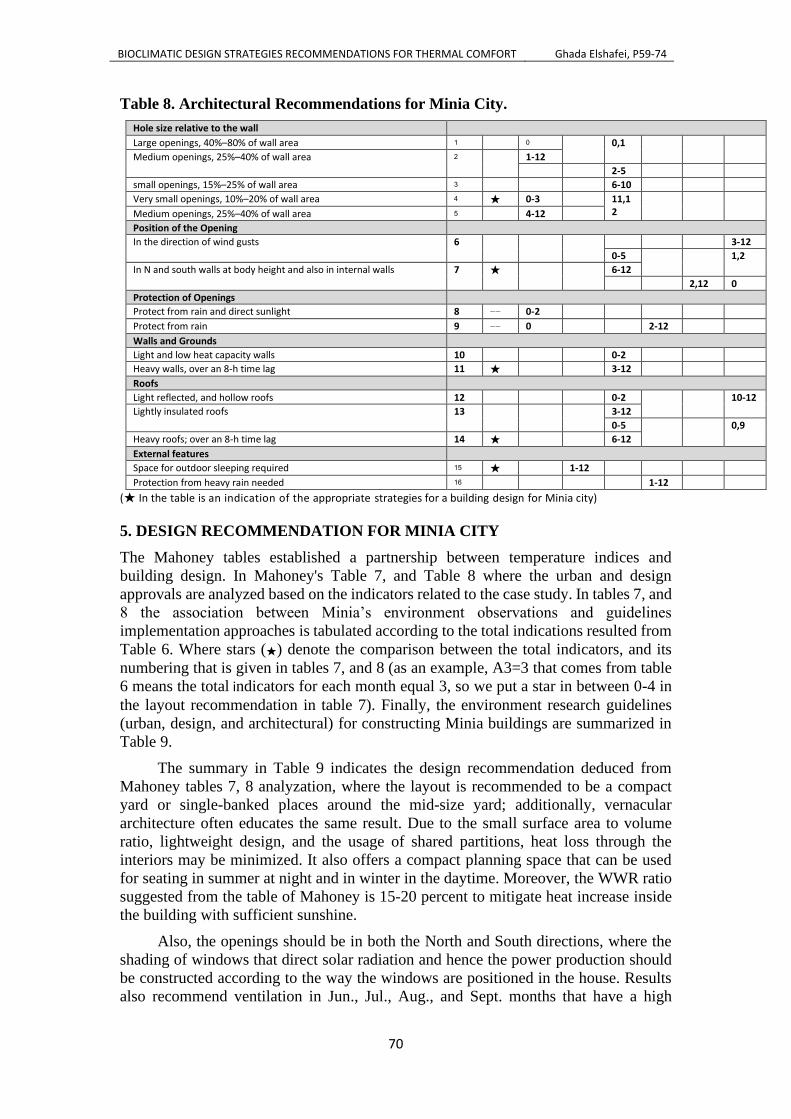
Table 8. Architectural Recommendations for Minia City.
Hole size relative to the wall
Large openings, 40%–80% of wall area 1 0 0,1
Medium openings, 25%–40% of wall area 2
1-12
2-5
small openings, 15%–25% of wall area 3 6-10
Very small openings, 10%–20% of wall area 4 ★ 0-3 11,12
Medium openings, 25%–40% of wall area 5 4-12
Position of the Opening
In the direction of wind gusts 6 3-12
0-5 1,2
In N and south walls at body height and also in internal walls 7 ★ 6-12
2,12 0
Protection of Openings
Protect from rain and direct sunlight 8 -- 0-2
Protect from rain 9 -- 0 2-12
Walls and Grounds
Light and low heat capacity walls 10 0-2
Heavy walls, over an 8-h time lag 11 ★ 3-12
Roofs
Light reflected, and hollow roofs 12 0-2 10-12
Lightly insulated roofs 13 3-12
0-5 0,9
Heavy roofs; over an 8-h time lag 14 ★ 6-12
External features
Space for outdoor sleeping required 15 ★ 1-12
Protection from heavy rain needed 16 1-12
(★ In the table is an indication of the appropriate strategies for a building design for Minia city)
5. DESIGN RECOMMENDATION FOR MINIA CITY
The Mahoney tables established a partnership between temperature indices and
building design. In Mahoney's Table 7, and Table 8 where the urban and design
approvals are analyzed based on the indicators related to the case study. In tables 7, and
8 the association between Minia’s environment observations and guidelines
implementation approaches is tabulated according to the total indications resulted from
Table 6. Where stars (★) denote the comparison between the total indicators, and its
numbering that is given in tables 7, and 8 (as an example, A3=3 that comes from table
6 means the total indicators for each month equal 3, so we put a star in between 0-4 in
the layout recommendation in table 7). Finally, the environment research guidelines
(urban, design, and architectural) for constructing Minia buildings are summarized in
Table 9.
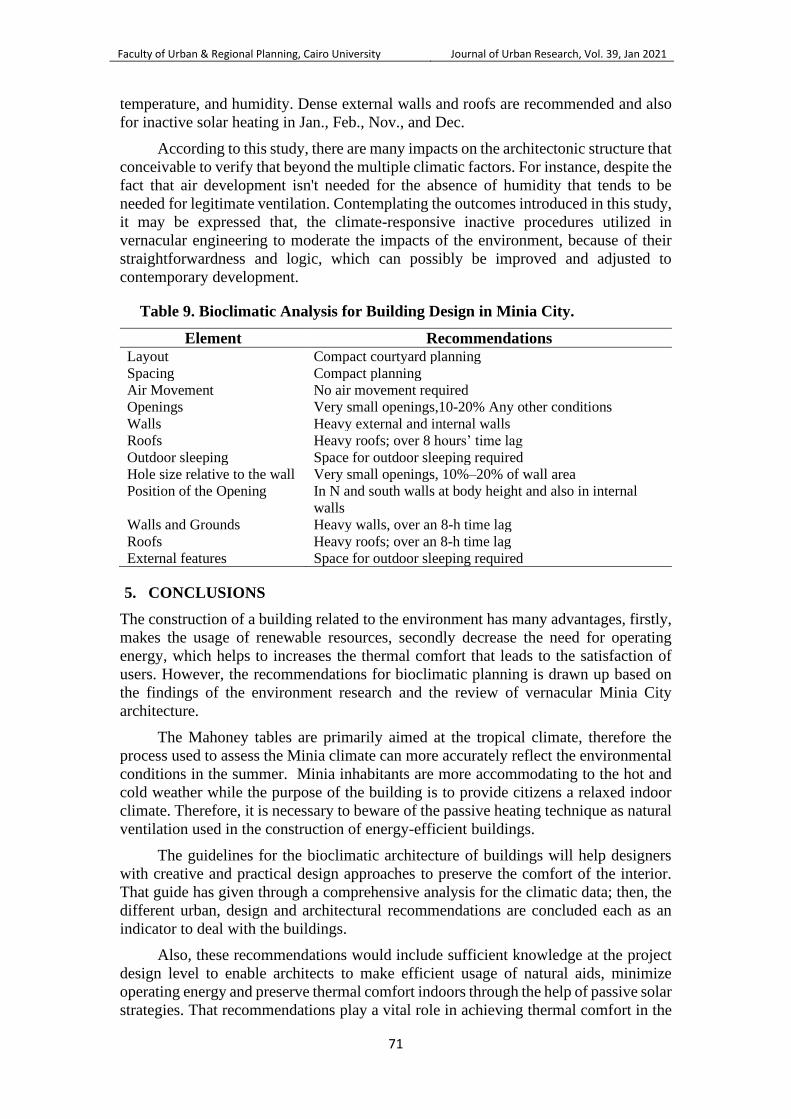
The summary in Table 9 indicates the design recommendation deduced from
Mahoney tables 7, 8 analyzation, where the layout is recommended to be a compact
yard or single-banked places around the mid-size yard; additionally, vernacular
architecture often educates the same result. Due to the small surface area to volume
ratio, lightweight design, and the usage of shared partitions, heat loss through the
interiors may be minimized. It also offers a compact planning space that can be used
for seating in summer at night and in winter in the daytime. Moreover, the WWR ratio
suggested from the table of Mahoney is 15-20 percent to mitigate heat increase inside
the building with sufficient sunshine.
Also, the openings should be in both the North and South directions, where the
shading of windows that direct solar radiation and hence the power production should
be constructed according to the way the windows are positioned in the house. Results
also recommend ventilation in Jun., Jul., Aug., and Sept. months that have a high
Faculty of Urban & Regional Planning, Cairo University Journal of Urban Research, Vol. 39, Jan 2021
71
temperature, and humidity. Dense external walls and roofs are recommended and also
for inactive solar heating in Jan., Feb., Nov., and Dec.
According to this study, there are many impacts on the architectonic structure that
conceivable to verify that beyond the multiple climatic factors. For instance, despite the
fact that air development isn't needed for the absence of humidity that tends to be
needed for legitimate ventilation. Contemplating the outcomes introduced in this study,
it may be expressed that, the climate-responsive inactive procedures utilized in
vernacular engineering to moderate the impacts of the environment, because of their
straightforwardness and logic, which can possibly be improved and adjusted to
contemporary development.
Table 9. Bioclimatic Analysis for Building Design in Minia City.
Element Recommendations Layout Compact courtyard planning
Spacing Compact planning
Air Movement No air movement required
Openings Very small openings,10-20% Any other conditions
Walls Heavy external and internal walls
Roofs Heavy roofs; over 8 hours’ time lag
Outdoor sleeping Space for outdoor sleeping required
Hole size relative to the wall Very small openings, 10%–20% of wall area
Position of the Opening In N and south walls at body height and also in internal
walls
Walls and Grounds Heavy walls, over an 8-h time lag
Roofs Heavy roofs; over an 8-h time lag
External features Space for outdoor sleeping required
5. CONCLUSIONS
The construction of a building related to the environment has many advantages, firstly,
makes the usage of renewable resources, secondly decrease the need for operating
energy, which helps to increases the thermal comfort that leads to the satisfaction of
users. However, the recommendations for bioclimatic planning is drawn up based on
the findings of the environment research and the review of vernacular Minia City
architecture.
The Mahoney tables are primarily aimed at the tropical climate, therefore the
process used to assess the Minia climate can more accurately reflect the environmental
conditions in the summer. Minia inhabitants are more accommodating to the hot and
cold weather while the purpose of the building is to provide citizens a relaxed indoor
climate. Therefore, it is necessary to beware of the passive heating technique as natural
ventilation used in the construction of energy-efficient buildings.
The guidelines for the bioclimatic architecture of buildings will help designers
with creative and practical design approaches to preserve the comfort of the interior.
That guide has given through a comprehensive analysis for the climatic data; then, the
different urban, design and architectural recommendations are concluded each as an
indicator to deal with the buildings.
Also, these recommendations would include sufficient knowledge at the project
design level to enable architects to make efficient usage of natural aids, minimize
operating energy and preserve thermal comfort indoors through the help of passive solar
strategies. That recommendations play a vital role in achieving thermal comfort in the

BIOCLIMATIC DESIGN STRATEGIES RECOMMENDATIONS FOR THERMAL COMFORT Ghada Elshafei, P59-74
72
structure located inside the Minia climate zone. However, thermal comfort is one of the
concepts of green building. The approach used in this paper will allow students of
architecture to know how to integrate their design into the surrounding environment.
REFERENCES
Aashi K., et al. (2020). Framing Bioclimatic Building Design Guidelines for Hot and Dry
Climate: Case of Jaipur City. International Journal for Research in Applied Science &
Engineering Technology (IJRASET), ISSN: 2321-9653; IC Value: 45.98; SJ Impact
Factor: 7.429, Volume 8, Issue 4.
Abdollah B., et al. (2019). Bioclimatic design strategies: A guideline to enhance human thermal
comfort in Cfa climate zones. Journal of Building Engineering 25, 100758.
Mahmoud A. (2011). An analysis of bioclimatic zones and implications for design of outdoor
built environments in Egypt. Build Environ, 46 (3) 605–620.
Ali S., and Hamid A. (1998). Thermal comfort and the development of bioclimatic concept in
building design. Renewable and Sustainable Energy Reviews, vol.2, no.1-2, pp.3-24.
Ashwani K., et al. (2018). Climate Consultant: A Software for Designing Energy Efficient
Building. International Journal for Research in Applied Science & Engineering
Technology (IJRASET), ISSN: 2321-9653; IC Value: 45.98; SJ Impact Factor: 6.887,
Volume 6, Issue 9.
Baruch G. (1992). Comfort, climate analysis and building design guidelines. Energy and
Buildings, vol.18, no.1, pp.11-23.
Belkacem B., and Daniel F. (2019). Passive ambient comfort and the interaction of vernacular
strategies and devices in arid zone habitat design: case of Biskra, Algeria. Advances in
Building Energy Research, DOI: 10.1080/17512549.2019.1607775.
Bo X. (2013). Thermal comfort and the Mahoney tables in Shanghai building bioclimatic
design”, Advances in Information Sciences and Service Sciences (AISS), Volume 5, Issue
9, May, DOI: 10.4156/AISS.
Givoni B. (1998). Climate considerations in building and urban design, John Wiley & Sons,
New York.
Charai M., et al. (2019). Bioclimatic Building Design Analysis. Case Study: Oujda, Morocco.
7th IEEE International Renewable and Sustainable Energy Conference (IRSEC), pp. 1-6.
McIntyre, D.A. (1980). Indoor Climate. Applied Science Publishers LTD, London.
Ministry of Housing, Cairo, Egypt. (2008). Housing, and Building National Research Centre,
Report, Egyptian Code for Improving the Efficiency of Energy Use in Buildings, Part 1:
Residential Buildings (306/1). ECP 305.
Farheen B., and Mohammad T. (2017). Bioclimatic Building Design Guidelines for Lucknow
City: Use of Various Climate Analysis Methods. International Journal for Research in
Applied Science & Engineering Technology (IJRASET), ISSN: 2321-9653; IC Value:
45.98; SJ Impact Factor:6.887, Volume 5, Issue 11.
Givoni B. (1969). Man, climate, and architecture. London: Elsevier Publishing Company
Limited.

Faculty of Urban & Regional Planning, Cairo University Journal of Urban Research, Vol. 39, Jan 2021
73
Givoni, B. (1978). L’homme, l’architecture et le climat. Paris : Éditions du Moniteur.
Megahed T., and Radwan A., (2020). Performance investigation of zero-building integrated
photovoltaic roof system : A case study in Egypt. Alexandria Engineering Journal, 59(6),
pp.5053-5067.
Elhadad S., et al. (2020). Model Simplification on Energy and Comfort Simulation Analysis
for Residential Building Design in Hot and Arid Climate. Energies, 13(8), p.1876.
Kemajou A., and Mba L. (2011). Matériaux de construction et confort thermique en zone
chaude Application au cas des régions climatiques camerounaises. ‘ENSET’. Revue des
Energies Renouvelables, 14(2), 239–248.
Khalid E., et al. (2018). Energy Efficient Houses Meeting Both Bioclimatic Architecture
Principles and Moroccan Thermal Regulation, IEEE.
Humphreys M. (1996). Thermal comfort temperatures world-wide - the current position,
Renew Energy 8 (1–4) 139–144.
Humphreys M., et al. (2013). Updating the adaptive relation between climate and comfort
indoors; new insights and an extended database, Build Environ 63, 40–55.
Milne M., et al. (2007). Climate consultant 3.0: A tool for visualizing building energy
implications of climates. In proceedings of the Solar Conference, American Solar Energy
Society; American Institute of Architects, vol. 1, p. 466.
Fahmy M., et al. (2020). Influence of urban canopy green coverage and future climate change
scenarios on energy consumption of new suburban residential developments using coupled
simulation techniques: A case study in Alexandria, Egypt, Energy Reports,
https://doi.org/10.1016/j.egyr.2019.09.042.
Sellem H., and Alkama D. (2009). Le confort thermique entre perception et évaluation par les
techniques d’analyse bioclimatique- Cas des lieux de travail dans les milieux arides à
climat chaud et sec. Revue des Energies Renouvelables, 12(3), 471–488.
Olgyay V., and Olgyay A. (1963). Design with Climate: Bioclimatic approach to architectural
regionalism. Some chapters based on cooperative research with Aladar Olgyay. Princeton,
NJ: Princeton University Press.
Philokyprou M., et al. (2016). Environmentally responsive design in Eastern Mediterranean.
The case of vernacular architecture in the coastal, lowland, and mountainous regions of
Cyprus, Building and Environment, DOI: 10.1016/j.buildenv.2016.10.010.
Santy, et al. (2017). Bioclimatic Analysis in Pre-Design Stage of Passive House in Indonesia,
Buildings, 7, 24; DOI:10.3390/buildings7010024.
Sealey A. (1979). Introduction to Building Climatology—Chapter 10—The Mahoney
Tables.pdf. An Introduction to Building Climatology; Commonwealth Association of
Architects: London, UK.
Susanne B., et al. (2014). Climate responsive building design strategies of vernacular
architecture in Nepal. Energy and Buildings, 81, 227–242.

BIOCLIMATIC DESIGN STRATEGIES RECOMMENDATIONS FOR THERMAL COMFORT Ghada Elshafei, P59-74
74
Szokolay S. (2008). Introduction to architectural science: The basis of sustainable design.
London: Architectural Press (1st and 2nd ed.).
Markus T., and Edwin N. (1980). Building, Climate and Energy, Pitman Publishing Ltd, USA.