biochemical effects of ethanol on …shodhganga.inflibnet.ac.in/bitstream/10603/7990/20/20_chapter...
TRANSCRIPT

(@4562/‘wé
EFFECT OF ETHANOL UN BBC
MEMBRANE STABILITY
6.1 IN-l/ITRO BBC Membrane stability studiesfi.1A Introduction6.1B Materials and Methods
6.18.1 /n-vitro studies
6.1 B.l .l Isolation of red blood cells
6.1 B.2 Estimation of RBC membrane stability l/n-virro condition)
6.16 Results6.1 D Discussion
6.lA Introduction
An inherent property of cells is their ability to maintain the structural and
functional integrity of their membranes under changing environmental conditions.
Simple components ofbiological systems, such as cells, biomolecules and artificial
membranes were used in in virro studies since they allow the reduction of the
biological variables and more precisely helps in defining and controlling the
exposure parameters, compared with in vii-'0 exposure. Fish erythrocytes were used
to study adaptive responses to ethanol induced changes at the membrane level within
short time spans as these cells are nucleated and express many functions as that of
somatic cells. Unlike anucleated mammalian RBCs the nucleated RBCs of lower
vertebrates preserve both nucleus and mitochondria and can provide an attractive
“stripped down” model to study the effect of organic pollutants on cellular
compartments (Dey er al., 1993). In vitro studies would contribute to clarify the
fundamental mechanisms of biological effects brought about by ethanol induced
toxicity. By using In vitro studies, it was shown that ethanol brings about chaotropic
effects on membrane and cytoskeleton proteins denaturation. lt is a well known
95_[fizct of ‘fitfianof on QBC S-l4cm6rane StafiilityChaprero ._ ~~ . adenaturating agent that can promote the exposure of polar groups in the protein
unfolding processes. For this reason it has been stated that, incorporation of ethanol
to the membrane environment is associated with the promotion of exposure of polar
groups resulting in a membrane denaturation. Furthermore, there is evidence stating
that alcohol causes membrane deformity, and brings about modification in the
osmotic fragility of different cell types (Sozmen er al., 1994). Freshly drawn blood
samples mixed with an anticoagulant were used for erythrocyte membrane analysis.
Erythrocyte membrane is often used as a model membrane in investigating, the
structure and the functions of the biological membranes as well as in studying the
influence of different physical and chemical factors on the membranes. Incubation
of normal erythrocytes with ethanol facilitates hemolysis and increases the
percentage of cells that were hemolysed at maximal rate. There is an especially great
need for studies on the impact of these compounds on the properties of blood and
other tissues which results in their distribution to other sites in the body. The present
study describes the damaging effects of ethanol and their metabolites on the
erythrocyte membrane. Cunha ct al. (2007) has stated that erythrocytes suffer lysis
depending upon the concentrations of ethanol. Previous reports are not available on
the effect of ethanol on erythrocyte membrane of the fresh water teleost,
O. mossambicus. Therefore this study was designed to investigate the effect of
ethanol on the stability of erythrocyte membrane. The direct study of ethanol on
membrane in vitro can show the basic aspects of its effects on cellular metabolism.
This study was designed to investigate the alterations in the membrane stability after
in virro exposure of fish erythrocytes to different concentrations of ethanol.
6.lB Materials and Methods
Collection, maintenance, acclimatization of fish and determination of LC 50,
was the same as that described in chapter lB, Section l.2B.l to l.2B.5.
6.1B1 In-vitro studies.
For conducting RBC membrane stability studies in In-virro conditions,
O. mossambicus of 10 i 2 g were taken. Fishes were sacrificed by a blow to the head
and blood was drawn from the common cardinal vein using lml sterile plastic
__.

‘Effect qfft/ianofon \R§B(,’ Si/lemfirane .$‘ta6z'li'tyChapter 6 asinsulin syringe (Smith er al., l952) (26mm gauge size) containing sodium citrate as
an anticoagulant (5mg/ml) (115 dilution) (Oser, 1976).
6.lBl.1 Isolation of red blood cells
Erythrocytes were used within one hour of collection, and with each
experiment lasting no longer than 4 hour. Erythrocytes were isolated by centrifuging
at 3000 rpm for 5 minutes. After removal of plasma and buffy coat, the red blood
cells were further washed three times with three volumes in the same isotonic
medium and were concentrated by centrifugation under the same conditions. In
order to study the effect of ethanol on erythrocyte membrane, 0.5 ml of ethanol was
directly added in the tubes in which the final ethanol concentrations in the tubes
were 0.65 g/l, 1.3 g/l and 2.6 g/l respectively. Hemolysis was determined by
measuring the absorbance of hemoglobin in the supernatant at 540 nm. Hemolysis
was expressed by measuring the hemoglobin concentration. Erythrocyte membrane
was often used as a model membrane in investigating the structure and the functions
of the biological membranes as well as in studying the influence of ethanol on the
membranes.
6.lB2 Estimation of RBC membrane stability (In vitro condition)
Reagents Needed
1. Tri sodium citrate (500 mg%)
2. 154 mM lsotonic NaCl in 10 mM Sodium phosphate buffer, pH 7.4
3. 85.47 mM Hypotonic NaCl in 10 mM Sodium phosphate buffer, pH 7.4
Procedure
Stock RBC suspensions were prepared after washing the cells thrice with
isotonic saline. Different volumes of the suspension were mixed with distilled water
of known volume to hemolyse the cells. It was then centrifuged at 1000g for 5
minutes. The absorbance of the supernatant was read at 540 nm against distilled
water as blank. The dilution giving a suitable absorbance for 100% hemolysis was
selected. Also a suitable volume of blood giving an absorbance for l00% hemolysis
was noted.E ......... as

Effect Qf‘Etfiano[rm @936‘ Sltemfinzne .S‘ta5z'[iryChapter 6 .. .. WeThe experiment was carried out with each of the three concentrations of
ethanol as described below.
To 0.1 ml ofthe stock RBC suspension in a centrifuge tube, 5 ml ofisotonic
saline was added and incubated for 30 minutes at room temperature. lt was
then centrifuged at lO00g for 5 minutes. The absorbance of the supernatant
was read at 540 inn. This gave the absorbance of the “blank” (B).
To 0.1 ml of the stock RBC suspension in three centrifuge tubes, 4.5 ml of
distilled water was added and incubated for 30 minutes at room temperature.
To this 0.5 ml of ethanol stock solution was added (in which the final
concentration of ethanol in each ofthe tubes were 0.65 g/l, l.3 g/l and 2.6 g/l
respectively). It was then centrifuged at l000g for 5 minutes and the
absorbance of the supematant was read at 540nm. This gave the absorbance
corresponding to 100% hemolysis (H).
To 0.l ml of the stock RBC suspension in three centrifuge tubes, 4.5 ml of
hypotonic saline was added and incubated for 30 minutes at room
temperature. To this 0.5 ml of the ethanol stock solution was added (in which
the final concentration of ethanol in each of the tubes were 0.65 g/l, 1.3 g./l
and 2.6 g/l respectively). lt was then centrifuged at l000g for 5 minutes and
the absorbance of the supernatant was read at 540 nm. This gave the
absorbance ofthe control (C).
To 0.1 ml of the stock RBC suspension in three centrifuge tubes, 4.5 ml oi
hypotonie saline followed by 0.5 ml of the ethanol stock solution(such that
the final concentration of ethanol in each of the tubes were 0.65 gfl, l.3 g./l
and 2.6 g/l respectively) was added. It was then incubated for 30 minutes at
room temperature. It was then centrifuged at l000g for 5 minutes and the
absorbance of the supematant obtained was read at 540 nm. This gave the
absorbance corresponding to the “test” (T).
6 1C Results
Effect of 0.65 g/l, 1.3 g/l and 2.6 g/l of ethanol on erythrocyte membrane
stability in O. mossambicus was given in Table 6.1.1 to 6.1.4 and in Figure 6.1.2.
\
Q

Effect offtfianofon QBC Memfirane Stafiility
Chapter 6 f ~»e---------e e ------—» - e- -~ ~--~ The results obtained were analyzed statistically using One-Way ANOVA of the raw
data, followed by Dunnett’s method. In-vitro studies conducted on the RBC
membrane stability revealed that ethanol had a labilising effect on the erythrocyte
membrane. 2.6 g/I exhibited maximum percentage of hemolysis (82.5l%) followed
by 1.3 g/I and 0.65 g/l which gave percentage hemolysis of (71.29%) and (54.84%)
respectively.
Table 6. l.l Percentage hemolysis in O. mossambicus on exposure to different
concentrations of ethanol (In - vitro conditions)
Groups % HemolysisControl 0[l.65gll 54.a4¢1.92s51.3gll 71.29¢3.10252.6911 32.51 $2.462?
Average of six values in each group i SD of six observations
Figure 6.1.2 Percentage hemolysis in O. mossambicus on exposure to different
concentrations of ethanol (In - vitro conditions)
i Determination of RBC membrane stability ( In-vitro)
T BUB0.659/| _ 1.39/| 2.6g/I
Concentrations of etha nol
% of hemo ys s
E3C)
RBC membrane exhibited an increase in hemolysis (Table 6.1.1 and Figure
6.1.2) in in-vitro conditions, and was found to be depended upon dosage. This was
continued by using ANOVA (Table 6.1.3) and the result is depicted below.

‘I:;;jFect offlfitfianofon \R(BC S-Wemfirane Sta6z'£i't_yChaprerri e e 4 4 4 4 u 4 ~ e e e e e e e eTable 6.1.221 ANOVA Table for RBC (In-vitro)
Source of Variation sum of rlf Mean Square F Sig.Squares
B°“"'°°" . 2324.344 2 1162.172 179102 0.000Concentrations 1
Error 97.008 l5 6.467Total H 2421.352 17
E-degreesoftreedoni l S S S S S 1Statistical analysis by using One Way- ANOVA revealed that there was an
overall significant change (P<0.00l) between concentrations in the RBC membrane
stability levels during in-wrro conditions.
6.1.3 Multiple Comparison Test
A subsequent comparison between different concentrations of ethanol was
done by Dunnett's method and the results were depicted in the Table 6.1.3
Groups BBC (In-vitral
0.6591! Vs 1.3g!l 0.000“Dunnett
0.65911 Vs 2.6911 0.0001The values are significant at a =P < 0.001.
ln the case of RBC membrane stability studies in in-virro conditions
significant difference (P<0.00l) was observed at 1.3 g/l and 2.6 g/l when being
compared with 0.651;./l.
6.lD Discussion
The result from this experiment indicated that erythrocyte membrane was
maximally damaged and has spilled its haemoglobin content depending upon the
concentration of ethanol. The levels of released hemoglobin sen/es as an indicator of
hemolysis, caused by increased membrane fragility. Fragility is referred to as a

‘Effect qfqizfianofon 9393C Sltemfirane .S‘ta6i'(itjyChapter 6 ~x A . ___membrane associated phenomenon which reflects the susceptibility of red cells to
lysis. This in turn explains that RBC membrane has become more fragile when
treated with ethanol. Also the change in cation concentration brings about increased
fragility. This results in the increased leakage of cations from the cells resulting in
swelling of the cell, thus ultimately leading to lysis. Niranjan and Krishnakantha.
(2000) observed similar increase in the osmotic fragility of erythrocytes in rats fed
with oxidized ghee, supports the present finding. The present data confirm that,
ethanol brings about an increased disintegration of erythrocytes. An increase in the
RBC hemolysis was observed when O. mossambicus was subjected to different
concentrations of ethanol in in-virro conditions. ln the present study as the
concentration of ethanol increased hemolysis of RBCs also increased (Table 6.1.1
and Figure 6.1.2). Chi and Wu (1991) observed similar state of increased rate ot
hemolysis of red blood cells when mediated by ethanol. The hemolysis rate
increased depending upon the increased concentration of ethanol. Changes in the ion
transport and in the osmotic fragility are considered as indicators of alterations in the
erythrocyte membrane (Baranski er al., 1974; Kovacs at al., 1997). Similar
observations in hemolysis were made by Cleary er al. (1982) on rabbit erythrocytes
subjected to micro waves in in-vitro condition. Another reason for the labilising
effect is the membrane damage brought about by the direct effect of lipid
peroxidation products. The observations cited by Das and Vasudevan (2005)
supported the present finding. Erythrocytes arc prone to oxidative damage due to
presence of polyunsaturated fatty acids, heme, iron and oxygen (Kameda er 01.,
1985). Red blood cell membrane being rich in polyunsaturated fatty acids are very
susceptible to free radical mediated peroxidation. Lipid peroxidation mediated by
free oxygen radicals, is believed to be an important cause of destruction and damage
to cell membranes, since polyunsaturated fatty acids of the cellular membranes are
degraded by this process with consequent dismption of membrane integrity. From
these results it can be concluded that RBC hemolysis and lipid peroxidation by
ethanol can be one of the molecular mechanisms involved in ethanol induced
toxicity studies (Armutcu er.al., 2005). Thus, the elevated lipid peroxide
concentration in the erythrocytes probably reflects a higher production of peroxyl
radicals, which ultimately leads to the peroxidation of PUFA in these cells. This in
\
‘Ejfict offitlianofon ‘1{<B(," Memfirarze Stafiifity
Chapter 6 as **** fei ~ ff ~tum leads to increased fragility of the cell membranes which ultimately brings about
lysis of the cells (Muduuli et al., 1982). The present investigation points out that
ethanol brings about maximum damage to the RBCs when subjected to different
concentrations of ethanol in in-vitro conditions.

‘E_/jfect of ‘lizfzanof on 9103C £Mem6rane 5ta6r'[1't_yChapter 6 a **_ L6.2 Ill/-l/ll/0 RBC MEMBRANE STABILITY STUDIES
6.2A Introductionfi.2B Materials and Methods
6.28.1 Estimaiton of RBC membrane stability (/n-viva Condition)
6.28 Results6.20 Discussion
6.2A Introduction
Red blood cells possess a much simple structure. It is composed of a single
membrane surrounding a solution of haemoglobin (this protein forms about 95% of
the intracellular protein of the red cell) (Robert er 01., 2000). The erythrocyte
membrane has long been served as a convenient model system employed for
studying the chemical and physical properties of cell membrane due to its relative
simplicity (Salil and Shyamali, 1999). Lipids are crucial structural components oi
biomembranes which dictate the integrity of the membranes (Hummel, I993).
Membrane lipid composition directly reflects the membrane properties (Yeagle,
1985). Cholesterol, one of the major components of the membranes, plays a central
role in membrane biosynthesis, integrity and cell growth. lt also regulates membrane
fluidity. The functions of membrane are therefore determined by membrane
composition and organization (Levin er al., l99O). Erythrocytes (RBCs) are
frequently used to evaluate oxidative stress. The RBC membrane is rich in
polyunsaturated fatty acids, a primary target for reactions involving free radicals,
which seems to be very susceptible to lipid peroxidation (Devasena ct al., 200i).
Lipid peroxidation is an autocatalytic process, which ultimately results in cell death
(Dsouza and Dsouza 2002). An oxidative cellular defect in the red blood cell (RBC)
can accentuate oxygen radical formation and risk damage to cellular components
(Flynn er a/., "1985; Scott 1993). Ethanol disrupts the physical structure of cell
membranes (Goldstein, 1986), and thus brings about oxidative damage. Oxidativc
damage alters membrane permeability and eventually lead to hemolysis (Lubin and
Q
I

‘Effect Qf-ft/i£1?t0[ on QBC Sltemtirane .S'ta6z'[iTzy
Chapter 6 W c
Chiu, 1992). Erythrocytes are exposed to continuous oxidative stress due to continuous
generation of free radicals brought about by the oxidation of haemoglobin. ln
addition, oxidative damage causes immune recognition of RBC (Low et al., 1985).
The most commonly used method of erythrocyte ghost preparation is to
hemolyse RBC in hypotonic solutions to remove hemoglobin. Even though this
technique is widely used, certain important variables, namely pH and ionic strength
of the hemolyzing solutions, appear partially responsible for conflicting reports on
the composition and function of RBC membrane (Stubbs and smith, l984). While
these studies have identified oxidative damage as a major determinant of RBC
survival, the detailed mechanism of these damages to RBC brought about by ethanol
remains largely ill-defined. Membrane lipids are susceptible to peroxidation induced
damage as they are largely composed of polyunsaturated fatty acids. Peroxidative
reactions involving free radicals in lipid domains results in damage to integral
membrane proteins, leading to alteration of membrane dynamics and function
(Scvanian and Hochstein, 1985). The accumulation of activated oxygen causes
hemolysis (Hebbel, 1986; Shinar and Rachmilewltz, I990 and Saltman, 1989).
However, the chemical composition of the red blood cell (RBC) membrane may
vary depending on the methods used to isolate the membrane (Dodge er a1., l963;
Ponder, 196] and Weed and Lacelle, 1969). For the present study, fish red blood
cells (RBCS) has been used as a model system to delineate the effects of oxidative
damage brought about by ethanol on red blood cells of O. mossambicus. The cellular
membrane is a lipid bilayer essentially constituted by phospholipids, cholesterol and
glycolipids. Small variations in percentage composition and molar ratio of the
different classes of phospholipids and glycolipids, as modifications in the composition
in fatty acid and cholesterol amount, result in changes of the physical-chemical status
(with implications on membrane’s fluidity and permeability) of enzyme’s activity
and/or of channels and ionic pumps constituted by intrinsic membrane proteins.
Moreover, in these molecules, a difference in composition in the fatty acids can
result in a greater sensibility to peroxidative stress, with a consequent increase in
membrane fragility (Angela er al., 2007).
.............. _ .........

Ijjfect Qfftfianofon R(B(,’ fltemfirane .§ta6i'[ityChapter 6 A ~ " W. A6.2 B Materials and Methods
Collection, maintenance, acclimatization of fish, determination of LC50,
bioassay method and experimental design was the same as that described in chapter
l, section l.2B.l to l.2B.5. Isolation of red blood cells remains the same asdescribed in 6.l.Bl.l.
6.28.1 Estimation of RBC membrane stability (In vivo condition)
Reagents Needed
1. Tri sodium citrate — 500 mg%
2. I54 mlvl isotonic NaCl in l0 ml\/l sodium phosphate buffer, pH 7.4
3. 85.47 ml\/1 hypotonic NaCl in 10 mM sodium phosphate buffer, pH 7.4
Procedure
Blood containing citrate as an anticoagulant was employed for membrane
stability studies. lt was then centrifuged at 40 C in a rcfhgerated centrifuge at 3000
rpm for 30 minutes. The pellet obtained contains erythrocytes. lt was then washed
thrice with isotonic saline solution. Different volumes of erythrocyte suspensions
were prepared by mixing with distilled water. This hemolyses the cells which were
then centrifuged at l0O0g for 5 minutes. The supernatant obtained was taken. It was
then read at 540 nm against distilled water as blank. The RBC suspension which
gives a suitable absorbance for lO0% hemolysis was selected and this was used as
stock. Also a suitable volume of blood giving a suitable absorbance for 100%
hemolysis was noted.
To 0.lml of the stock RBC suspension, 5 ml ofisotonic saline was added. lt
was then incubated for 30 min at room temperature. After incubation it was
centrifuged at 1000g for 5 min. The supcmatant which contains haemoglobin was
read at 540 nm. This serves as the ‘blank’ (B). Similarly 5 ml of distilled water was
added to 0.1 ml of the stock RBC suspension taken in a centrifuge tube. It was then
incubated for 30 min at room temperature. After incubation it was centrifuged at
l000g for 5 min and the absorbance of the clear supernatant was measured at
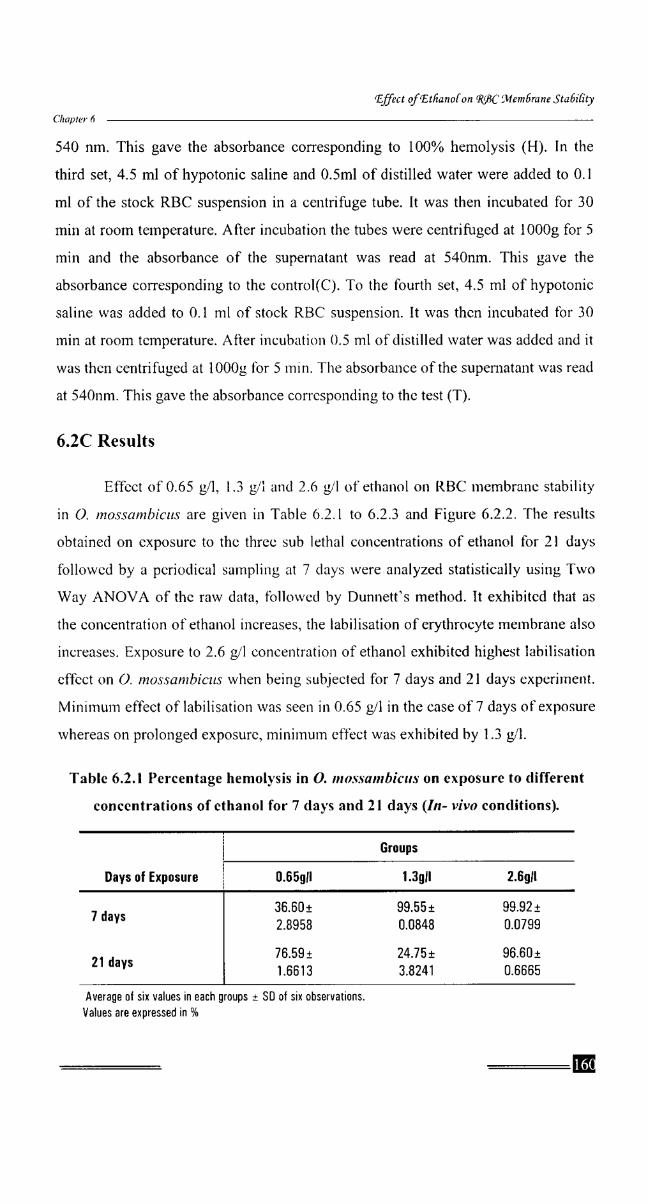
’E_;]Z'ct qffitfianofon R936‘ 5-Memfirane 5ta6:'[ityChapter 6 6 -- - 6- 540 nm. This gave the absorbance corresponding to 100% hemolysis (H). ln the
third set, 4.5 ml of hypotonic saline and 0.5ml of distilled water were added to 0.1
ml of the stock RBC suspension in a centrifuge tube. lt was then incubated for 30
min at room temperature. After incubation the tubes were centrifuged at l000g for 5
min and the absorbance of the supernatant was read at 540nm. This gave the
absorbance corresponding to the control(C). To the fourth set, 4.5 ml of hypotonic
saline was added to 0.1 ml of stock RBC suspension. It was then incubated for 30
min at room temperature. After incubation 0.5 ml of distilled water was added and it
was thcn centrifuged at l000g for 5 min. The absorbance of the supernatant was read
at 540nm. This gave the absorbance corresponding to the test (T).
6.2C Results
Effect of 0.65 g/l, l.3 gfl and 2.6 gfl of ethanol on RBC membrane stability
in O. mossambicus are given in Table 6.2.1 to 6.2.3 and Figure 6.2.2. The results
obtained on exposure to the three sub lethal concentrations of ethanol for 21 days
followed by a periodical sampling at 7 days wereanalyzed statistically using Two
Way ANOVA of the raw data, followed by Dunnett’s method. lt exhibited that as
the concentration of ethanol increases, the labilisation of erythrocyte membrane also
increases. Exposure to 2.6 gill concentration of ethanol exhibited highest labilisation
effect on 0. m0s.s'ambz'cus when being subjected for 7 days and 21 days experiment.
l\/linimum effect of labilisation was seen in 0.65 g/l in the case of 7 days of exposure
whereas on prolonged exposure, minimum effect was exhibited by l.3 g/l.
Table 6.2.] Percentage hemolysis in O. mossambicus on exposure to different
concentrations of ethanol for 7 days and 21 days (In- viva conditions).
GroupsDays of Exposure l].65gll 1.3gll 2.6gll
7 days36.60:2.8958
76.59 i
99.55 1
0.0848
24.75:
99.92 1
0.0799
96.60:
2' “"3 1.6613 3.6241 0.6666Average of six values in each groups 1 SD of six observations.
Values are expressed in %

‘Effect of €Etfzano[ on 02{B(,‘ 514em6nme StafiilityChapler 6 . e e e a a _ aFigure 6.2.2 Levels of RBC Membrane stability (In-Viva) in the blood of
O. mossambicus exposed for 7 days and 21 days to differentconcentrations of ethanol.
l Determination of RBC membrane stability (In-vivo)
Q
" 5O"|
% of hemo ys
3o
"s
‘ 0.659/I 1.3g/I 2.6g/IConce ntrations of etha nol‘ |I
Determination of RBC membrane stability (In-vivo)II m I'6 150 ¥ 2 H50 K]
0.659/l 1.3g/I 2.6g/IConcentrations of ethanol
% of hemo_LOo
I iElDay21'A significant difference (P<0.00l) in RBC membrane stability was observed
in O. mossambicus when treated with various sub lethal concentrations of ethanol
with respect to control during 7 and 21 days of exposure period (Table 6.2.1 and
Figure 6.2.2). This was statistically supported by employing ANOVA and the results
obtained is shown below (Table 6.2.2a).

Eflect qf‘Et5an0[on 9'\{fB(,‘ 5l’lem5rane Sta6z'fz'ty
Chapter 6 -._._._____.. ~ we ~~-~—e
Table 6.2.221 ANOVA Table for RBC (In-viva)
Source of VariationSum of
Squareser Mean Square r Sig.
Between Days ofExposure
BetweenConcentrations
Days of Exposure xConcentration
Error
Total
1453.389
12284.809
20161551
131.137
34030.886
1453.389 332.489 0.000
6142.404 1405.185 0.000
10080776 2305.159 0.000
4.371
df - degrees ol freedom
Statistical analysis done by using Two Factor ANOVA indicated that RBC
membrane stability levels varied significantly between days (P<0.0()l). There was a
significant difference (P<0.001) between concentrations. While comparing both the
days as well as concentrations (Interaction) effect together, significant difference
(P<0.00l) was noted.
Table 6.2.3 Multiple Comparison Test
Groups BBC (In-viva]
0.65911 Vs 1.391! ooooaDunnett
0.55911 Vs 2.6911 0.000’The values are significant at a = P < 0.001.
6.2D Discussion
The ability of organic solvent such as ethanol to destabilize the membrane as
well as the membrane proteins correlates to their eytotoxicity. The present
experimental data indicated that erythrocyte membrane was maximally damaged and
exhibited increased rate of hemolysis when treated with ethanol. This is due to the
direct effect of lipid peroxidation products. Membrane peroxidation lead to changes
in membrane fluidity, permeability and also results in the enhanced rates of protein

fflizct of Etfirmof on RFBC Sl1.em6rane Sta 6z'[z't_yChaprerri 1 . ._- Mdegradation, which will eventually lead to cell lysis. The deformity of destructed
RBC and increased rate of RBC hemolysis results in the increased production of free
radicals. High levels of polyunsaturated fatty acids (PUFA), continual exposure to
high concentrations of oxygen or the presence of iron, a powerful transition-metal
catalyst, render erythrocytes highly susceptible to peroxidative damage (Clemens
and Waller, 1987). Also ethanol exhibits a denaturating effect on erythrocyte
membrane which is also been associated with abnomial RBC morphology resulting in
an increased susceptibility to hemolysis (Prokopieva at al., 2000; Chi er al., 1990).
In the present study an increase in RBC hemolysis (Figure 6.2.2) was
observed when O. mossambicus was exposed to ethanol for 7 days. This increase in
RBC hemolysis is due to the increased activities of serum specific enzymes. lvanov
(200!) observed increase in RBC destruction and hemolysis when treated with
ethanol, supports the present finding. Another reason for the increase in RBC
hemolysis is due to membrane lipid peroxidation. RBC membranes arc prone to
peroxidative damage because they are rich in unsaturated fatty acids and are exposed
to high oxygen concentration in the blood. The findings by Niki er a1. (I988) and
Hayam er al. (1993) supports the above observation. Xenobiotics are oxidized to
free radicals within RBCs and induce hemolysis of the RBC membrane (Armutcu
er al., 2005), which results in the release of hemoglobin thereby inducing a
multitude of toxic effects. The findings of Everse and Hsia (I997) supports the
present study. lvanov (2001) observed similar destruction of RBCs and hemolysis
on the membrane when treated with organic solvents.
RBC membranes are prone to peroxidative damage because they are rich in
unsaturated fatty acids and are exposed to high oxygen concentration in the blood
(Hayam ct al., 1993). Membrane lipid composition determines membrane fluidity.
Any alteration in the concentration of cholesterol is known to affect the transport
functions and activity of membrane enzyme (Stubbs, 1983). lt has been suggested
that cholesterol regulates the lipid mobility in the membrane in physiological
situations (Chailley er aI., 1981). The decrease in hemolysis observed at 1.3g/l when
O. mossambicus was exposed for 21 days indicates that RBC membrane has become
rigid. This can be due to the slight increase in the cholesterol/phospholipid ratio. The

‘Eflizct qfftfianofon WYBC S-l4.em6rane .$"ta6i.'[it_yChapter 6 _.. . . .9 . g .observations made by Yeagle er al. (1990) and Kuypers er al. (1996) supports the
above finding. Another possible reason for rigidity can be due to the decrease in
unsaturated fatty acids in the erythrocyte membrane followed by an increase in
saturated fatty acids, as the saturated fatty acid residues, because of their linear
hydrocarbon residues and hydrophobicity, interact very strongly with each other.
Oxidative damage has been shown to change a number of RBC properties. A fall in
PUFA followed by an elevation of cholesterol increases the rigidity of the
phospholipid bilayer. The findings made by Dobrestov er a/. (1977) supports the
present observation. Lipid peroxidation is known to cause polymerization of
membrane components, thus decreasing cell deformability (Pfafferott er a/., 1.962).
Bourel er al. (1987) suggested that alcohol, or one of its metabolites, induces
erythrocyte morphological alterations that correlates with some alterations in the
lipid content of the erythrocyte membrane (such as increased cholesterol!phospholipid ratio). Increased membrane rigidity and decreased RBC deformability
can also be induced by oxidative cross-linking of membrane protein.
Bcauge at al. (1994) observed that alcohol induces rigidification ofred blood
cell membrane, supports the above observation. Levin er al. (I990) have proposed
that the oxidation of membrane lipids results in the formation of peroxidation
degradation products (such as for e.g. Malondialdehyde, MDA) which leads to the
cross linking reactions of the lipid-lipid and lipid-protein type thereby making the
membrane more rigid and hence less fluid. Similarly the increase in hemolysis
observed at 0.65 g/l and 2.6 g/l on prolonged exposure can be due to the decrease in
Hb and PCV values which arises due to the increased fragility of the erythrocytes.
Observations made by Patra at al. (2001) supports this finding.
It can be concluded that ethanol brings about maximum damage to the RBCs
when subjected to different concentrations of ethanol in in-viva conditions.
\