bioaccumulation of polychlorinated - drum
TRANSCRIPT
BIOACCUMULATION OF POLYCHLORINATED BIPHENYLS IN THE
DELAWARE RIVER ESTUARY
by
Megan L. Toaspern
Thesis submitted to the Faculty of the Graduate School of the
University of Maryland, College Park in partial fulfillment of the requirements for the degree of
Master of Science 2003
Advisory Committee:
Professor Joel E. Baker, Chair Assistant Professor Chris Rowe Associate Professor David H. Secor


ABSTRACT
Title of Thesis: BIOACCUMULATION OF POLYCHLORINATED BIPHENYLS IN THE DELAWARE RIVER ESTUARY
Megan L. Toaspern, Master of Science, 2003 Thesis directed by: Professor Joel E. Baker
Chesapeake Biological Laboratory
Composite collections of channel catfish (Ictalurus punctatus), white perch
(Morone americana), their prey items (forage fish and epibenthos), and surficial sediment
were collected in the Delaware River estuary in Fall 2001 and Spring 2002 to quantify
polychlorinated biphenyl (PCB) accumulation and to examine the mechanisms of
bioaccumulation and trophic transfer. Samples were collected from four zones in a
section of the Delaware River from Trenton, NJ to Liston Point, DE, and analyzed for
lipid content and the hydrophobic organic contaminants PCBs. Our results indicate PCB
levels and congener distributions in biota reflect spatial and temporal trends in ambient
PCB concentrations. PCB congener patterns vary among sampling zones, with higher
homologue groups enriched in lower zones. Demersal species have similar congener
accumulation patterns. The presence of highly chlorinated congeners in lower zones does
not reflect commercial Aroclor mixtures, indicating a possible point source of PCB
contamination in the region downstream of Philadelphia, Pennsylvania. The relationships
between total PCB levels in biota and those in water and sediment was constant over the
study area based on bioaccumulation parameters. Ambient water quality criteria

calculated for the Delaware River with estuarine-specific values derived from this study
indicates a major reduction in PCB point and non-point loadings is necessary to reduce
PCB contamination in fish, thereby meeting acceptable risk levels for human
consumption.

BIOACCUMULATION OF POLYCHLORINATED BIPHENYLS IN THE
DELAWARE RIVER ESTUARY
by
Megan L. Toaspern
Thesis submitted to the Faculty of the Graduate School of the
University of Maryland, College Park in partial fulfillment of the requirements for the degree of
Master of Science 2003
Advisory Committee:
Professor Joel E. Baker, Chair Assistant Professor Chris Rowe Associate Professor David H. Secor

ii
DEDICATION
I dedicate this work to my parents Keith and Annette Toaspern for their
unyielding support, guidance, and love. I owe all of my accomplishments to the two
greatest people in my life and am extremely fortunate to have them both.

iii
ACKNOWLEDGEMENTS
I would like to thank my advisor Joel E. Baker for his endless support and
extreme patience throughout my graduate career. The opportunities made available to me
through working with his lab made this endeavor a fulfilling and rewarding experience.
Many thanks to my other committee members: Dr. David Secor and Dr. Chris Rowe for
their insight and perspective towards this project.
Assistance from the Delaware River Basin Commission and the Delaware
Department of Natural Resources and Environmental Control made this work possible.
The teamwork and cooperation provided by all parties was such a positive experience for
me. Specifically, I was overwhelmed with the support from Dr. Tom Fisklin and Rick
Greene who were incredibly helpful in sharing information, insight, and their wonderful
senses of humor. Their dedication to improving the environmental quality of the
Delaware River is inspiring.
This work is a collaborative effort of so many talented and supportive people.
The dedication and hard work of Dr. Jeff Ashley and Matt Wilhelm from the Academy of
Natural Sciences made it possible not only to amass such a work, but also to provide
feedback on a project where even the sampling design proves a perplexing puzzle. I
greatly appreciate the help of Scott McGuire and David Secor not only in sample
collection and analysis, but also in answering all of my fishy questions. Thank you also
to Elgin Perry for his help with statistical applications.
To my friends and colleagues in the Baker Lab past and present: Jeff Ashley,
Holly Bamford, Eileen Beard, Travis Burrell, Andrew Chang, Abby Cohen, Bernie
Crimmins, Susan Klosterhaus, Fung Chi Ko, Dan Liebert, Amy Merten, and Heather

iv
Stapleton, thank you for your support and friendship but mainly for helping me keep my
sanity. Thanks to Dan Liebert, Scott McGuire, and Matt Wilhelm for their help with the
“thunderbird”; now I am adept at filleting fish, although I will never again use a food
processor. Profuse thanks to Susan Klosterhaus for her unending supply of insight and
patience in dealing with me running to her desk every ten minutes with a new question. I
could never have completed this work without my mentor, Heather Stapleton, who has
been such an amazing symbol of integrity, intelligence, and compassion throughout our
friendship.
Lastly, to all of my friends, colleagues, and family at the Chesapeake Biological
Laboratory, thank you.

v
TABLE OF CONTENTS
List of Tables . . . . . . . . . . . . . . . . . . . . . . . . . . . . . . . . . . . . . . . . . . . . . . . . . . . . . . . . . . . viList of Figures . . . . . . . . . . . . . . . . . . . . . . . . . . . . . . . . . . . . . . . . . . . . . . . . . . . . . . . . . . vii
Chapter 1 INTRODUCTION
Background . . . . . . . . . . . . . . . . . . . . . . . . . . . . . . . . . . . . . . . . . . . . . . . . . . . . . . . 1Objectives . . . . . . . . . . . . . . . . . . . . . . . . . . . . . . . . . . . . . . . . . . . . . . . . . . . . . . . . 3Strategy . . . . . . . . . . . . . . . . . . . . . . . . . . . . . . . . . . . . . . . . . . . . . . . . . . . . . . . . . . 3
Chapter 2 MATERIALS AND METHODS
Sample Collection . . . . . . . . . . . . . . . . . . . . . . . . . . . . . . . . . . . . . . . . . . . . . . . . . . 6Extraction and Analysis . . . . . . . . . . . . . . . . . . . . . . . . . . . . . . . . . . . . . . . . . . . . . . 9Quality Assurance . . . . . . . . . . . . . . . . . . . . . . . . . . . . . . . . . . . . . . . . . . . . . . . . . 15
Chapter 3 ACCUMULATION OF POLYCHLORINATED BIPHENYLS IN SEDIMENT AND BIOTA
Introduction . . . . . . . . . . . . . . . . . . . . . . . . . . . . . . . . . . . . . . . . . . . . . . . . . . . . . . 32Results and Discussion
PCB Spatial Patterns . . . . . . . . . . . . . . . . . . . . . . . . . . . . . . . . . . . . . . . . . 33PCB Congener Patterns . . . . . . . . . . . . . . . . . . . . . . . . . . . . . . . . . . . . . . . 40Conclusions . . . . . . . . . . . . . . . . . . . . . . . . . . . . . . . . . . . . . . . . . . . . . . . . 52
Chapter 4 MECHANISMS OF BIOACCUMULATION AND TROPHIC TRANSFER OF POLYCHLORINATED BIPHENYL CONGENERS
Introduction . . . . . . . . . . . . . . . . . . . . . . . . . . . . . . . . . . . . . . . . . . . . . . . . . . . . . . 54Results and Discussion
BCF . . . . . . . . . . . . . . . . . . . . . . . . . . . . . . . . . . . . . . . . . . . . . . . . . . . . . 56BSAF . . . . . . . . . . . . . . . . . . . . . . . . . . . . . . . . . . . . . . . . . . . . . . . . . . . . 63Predator/Prey Ratios . . . . . . . . . . . . . . . . . . . . . . . . . . . . . . . . . . . . . . . . . 70Ambient Water Quality Criteria . . . . . . . . . . . . . . . . . . . . . . . . . . . . . . . . . 76Conclusions . . . . . . . . . . . . . . . . . . . . . . . . . . . . . . . . . . . . . . . . . . . . . . . . 78
AppendicesAppendix A: Sample Collection . . . . . . . . . . . . . . . . . . . . . . . . . . . . . . . . . . . . . . . 82Appendix B: PCB Concentrations in Biota . . . . . . . . . . . . . . . . . . . . . . . . . . . . . . . 95Appendix C: PCB Concentration in Sediment . . . . . . . . . . . . . . . . . . . . . . . . . . . . 123Appendix D: Quality Assurance . . . . . . . . . . . . . . . . . . . . . . . . . . . . . . . . . . . . . . 131
References . . . . . . . . . . . . . . . . . . . . . . . . . . . . . . . . . . . . . . . . . . . . . . . . . . . . . . . . . . 144

vi
LIST OF TABLES
Table Title Page
Table 2.1 PCB concentrations within channel catfish and white 10 perch
Table 2.2. PCB concentrations observed within prey fish and invertebrates 11 Table 2.3 Comparison of PCB congeners quantified by laboratory 17 Table 2.4 PCB concentrations within channel catfish and white perch 21
variability studies Table 4.1 Bioconcentration (BCF) factors and biota-sediment accumulation 61
(BSAF) factors for total PCB concentrations in biota Table 4.2 Predator/prey ratios of total PCBs from biota 74 Table 4.3 Ambient Water Quality Criteria for total PCBs 78

vii
LIST OF FIGURES
Figure Title Page
Figure 1.1 Map of Delaware River estuary displaying sampling zones 5 Figure 2.1 Total PCBs in channel catfish and white perch fillets vs.
whole fish 16 Figure 2.2 Total PCBs for individual white perch variability study 1 23 Figure 2.3 Total PCBs for individual white perch variability study 2 24 Figure 2.4 Total PCBs for individual white perch variability study 3 25 Figure 2.5 Total PCBs for individual channel catfish fall variability study 26 in zone 2 Figure 2.6 Total PCBs for individual channel catfish fall variability study 27 in zone 4 Figure 2.7 Total PCBs for individual channel catfish fall variability study 28 in zone 5 Figure 2.8 Total PCBs for individual channel catfish spring variability study 29 in zone 2 Figure 2.9 Total PCBs for individual channel catfish spring variability study 30 in zone 4 Figure 2.10 Total PCBs for individual channel catfish spring variability study 31 in zone 5 Figure 3.1 Sediment total PCB concentrations 34 Figure 3.2 Biota total PCB concentrations (ng/g wet weight) 37 Figure 3.3 Percent lipid in biota 38 Figure 3.4 Biota total PCB concentrations (ng/g lipid) 39 Figure 3.5 Homologue profiles for channel catfish among sites 41 Figure 3.6 Homologue profiles for white perch among sites 42
viii
Figure Title Page Figure 3.7 Homologue profiles for prey fish among sites 43 Figure 3.8 Homologue profiles for invertebrates among sites 44 Figure 3.9 Homologue profiles for sediment among sites 45 Figure 3.10 Principal Component Analysis of biota congener patterns 47 Figure 3.11 Principal Component Analysis of biota congener patterns 49
excluding white perch Figure 3.12 Proportion of PCB 209 in biota 50 Figure 3.13 Proportion of PCB 209 in channel catfish and white perch 51 Figure 4.1 Bioconcentration factors (BCF) vs. log Kow for PCB congeners 58
in channel catfish Figure 4.2 Bioconcentration factors (BCF) vs. log Kow for PCB congeners 59
in white perch Figure 4.3 Bioconcentration factors (BCF) vs. log Kow for PCB congeners 60
in prey fish Figure 4.4 Bioconcentration factors (BCF) vs. log Kow for PCB congeners 61
in invertebrates Figure 4.5 Biota-sediment accumulation factors (BSAFs) vs. log Kow 64
for PCB congeners in channel catfish Figure 4.6 Biota-sediment accumulation factors (BSAFs) vs. log Kow 65
for PCB congeners in white perch Figure 4.7 Biota-sediment accumulation factors (BSAFs) vs. log Kow 66
for PCB congeners in prey fish Figure 4.8 Biota-sediment accumulation factors (BSAFs) vs. log Kow 67
for PCB congeners in invertebrates Figure 4.9 Total biota-sediment accumulation factors (BSAF) for biota 68 Figure 4.10 Predator/prey ratios vs. log Kow for PCB congeners for channel 72
catfish/prey fish

ix
Figure Title Page Figure 4.11 Predator/prey ratios vs. log Kow for PCB congeners for channel 73
catfish/invertebrates Figure 4.12 Predator/prey ratios vs. log Kow for PCB congeners for white 74
perch/invertebrates

1
Chapter One
INTRODUCTION
Background
Polychlorinated biphenyls (PCBs) are a class of chemicals consisting of 209
possible congeners containing varying numbers of chlorine atoms substituted on one
biphenyl molecule. Approximately 130 PCB congeners were found in commercial
mixtures and released into the environment. First produced commercially in 1929, PCBs
function in a variety of capacities due to their high thermal stability and insulating
properties such as heat transfer fluid in electrical capacitors and transformers, fire
retardants, plasticizers, hydraulic and lubricating fluids. Monsanto was principal US
manufacturer until production ended in 1977 (Connell et al. 1997).
In the 1960’s it was found that polychlorinated biphenyls pose a threat to human
and ecosystem health (Shifrin and Toole 1998). Adverse biological effects attributed to
PCB contamination have been reported at the biochemical and cellular level (van der
Oost et al. 2003). PCBs are extremely hydrophobic, lipophilic compounds with a
tendency to bioaccumulate in organisms among all trophic levels (Oliver and Niimi 1988;
Harding et al. 1997; Kucklick and Baker 1998). Because of the persistence of these
contaminants and the resulting harmful effects to organisms and human health, we must
continue to monitor their presence in the environment.
The Delaware River estuary is an urbanized area receiving contaminant inputs
from a variety of point and non-point sources. Due to these high levels of contamination
the Delaware River is currently classified as “impaired” under the Clean Water Act

2
section 303(d). PCB contaminant poses a threat to human and wildlife health, therefore
long-standing advisories currently restrict consumption of fish from the river.
A consortium of state and federal agencies known as the Delaware River Basin
Commission (DRBC) was created to manage the river system through planning,
development, and regulation. Gathering knowledge of current PCB concentrations in the
river will contribute to the Delaware River Basin Commission’s effort to assess the
sources and extent of PCB loadings. The DRBC is formulating a bioaccumulation model
to help in the development of a PCB Total Maximum Daily Load (TMDL) as required by
the Clean Water Act 303(d) for impaired bodies of water. Adequately characterizing
loadings in the Delaware River estuary increases predictive capabilities and directs future
regulatory efforts. By exploring trophic transfer of PCB congeners within an estuarine
food web over a contaminant concentration gradient, we may also gain insight to PCB
accumulation patterns and the relation between abiotic and biotic compartments.
In the fall of 2001, groups from the University of Maryland, Rutgers University,
and the Academy of Natural Sciences undertook a project supported by the DRBC and
the Delaware Department of Natural Resources and Environmental Control. The main
objective was to produce a data set quantifying PCB concentrations in biota and
sediments within the Delaware River estuary. To address food web dynamics in the
Delaware River estuary, two representative predators, channel catfish (Ictalurus
punctatus) and white perch (Morone americana), were chosen based on their abundance,
and their commercial and recreational importance (Dove and Nyman 1995). Differences
in life histories and feeding patterns have been shown to affect PCB accumulation
(Madenjian et al. 1993; Ashley et al. 2000; Feldman and Titus 2001). These two

3
demersal predators have different migration behaviors within the Delaware River estuary.
White perch are a semi anadromous species, migrating within the Delaware River estuary
while channel catfish have a small spatial range, and therefore are more closely coupled
to local benthos (Dove and Nyman 1995). These two species allow us to compare and
contrast the transfer of PCB contaminants based on life histories, and how feeding
behavior influences bioaccumulation.
Objectives
Through quantifying PCB concentration in sediment and biota samples in the
Delaware River estuary, we may:
(1) Examine the variation of PCB congener patterns spatially and among species of
different trophic levels
(2) Observe the effect of life history and migratory patterns on PCB congener
accumulation in fish
(3) Evaluate relationships among abiotic and biotic compartments used in modeling
PCB accumulation
(4) Compare PCB contaminant levels in fish measured in the Delaware to those
predicted by the EPA national guidelines.
Strategy
Sediments and prey items of channel catfish and white perch including epibenthic
invertebrates, macrobenthic invertebrates, and small fish were analyzed to compare PCB
congener pattern accumulation and transfer across the estuary. Collaborators from the
University of Maryland, Academy of Natural Sciences, and Rutgers University collected
samples in Fall 2001 and Spring 2002 in four zones of the Delaware River estuary

4
(Figure1.1). Samples were analyzed for 82 individual congeners, which were summed to
determine total polychlorinated biphenyl content. Chapter 2 details the methods and
materials associated with collection and analysis. Chapter 3 addresses the accumulation
of PCBs in biota and sediment, with consideration of spatial variability. Also, PCB
congener profiles in biota are considered for relationships among species. Chapter 4
applies PCB data to bioaccumulation parameters to study mechanisms of transfer and
accumulation in the estuary. Specifically, bioconcentration factors, biota-sediment
accumulation factors and trophic transfer ratios are determined. PCB concentrations in
water used in calculating bioconcentration factors were obtained from the Delaware
River Basin Commission from ambient water sampling conducted in September 2001 and
March 2002 (DRBC 2003). Further application of this bioconcentration factor may be
used to determine ambient water quality criteria as set forth by the US Environmental
Protection Agency (2000b).
5
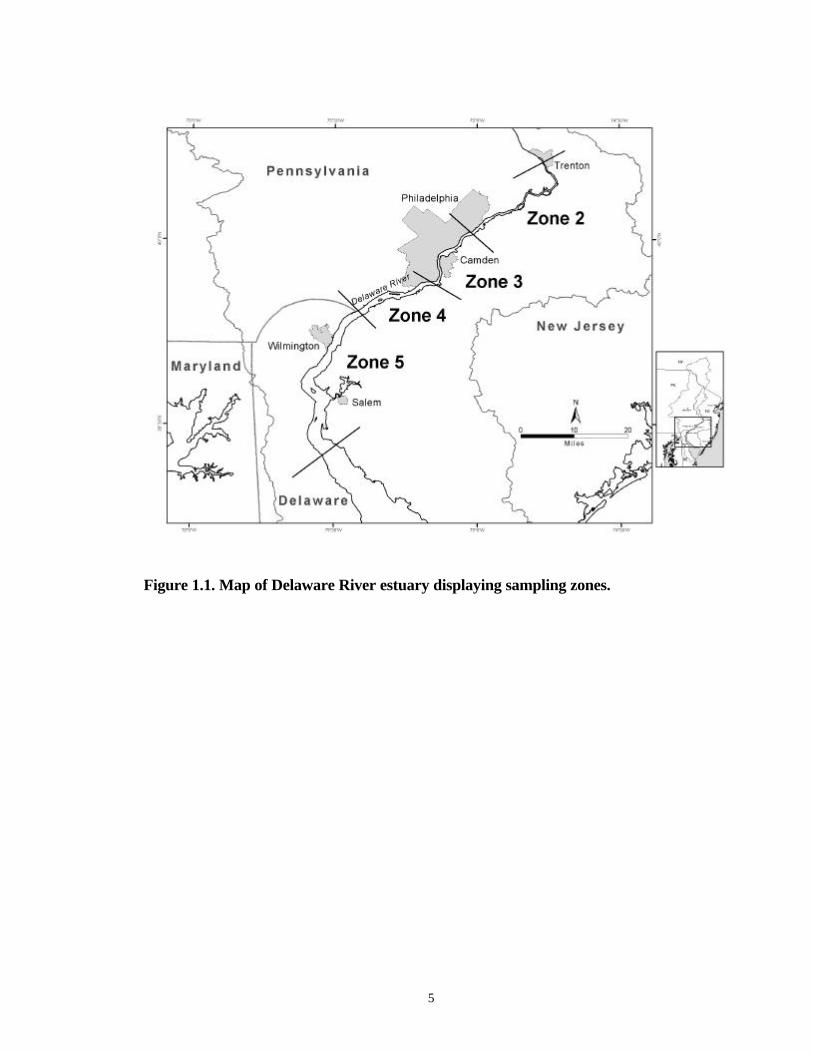
Figure 1.1. Map of Delaware River estuary displaying sampling zones.

6
Chapter Two
MATERIALS AND METHODS Sample Collection
Collection Sites: This study was conducted in four zones along a 130-km stretch of the
Delaware River from Trenton, New Jersey to Liston Point, Delaware (Figure 1.1). The
latitude and longitude of each sampling location were recorded using a handheld Trimble
Geoexplorer Global Positioning System (GPS) as well as the shipboard GPS. The
location, date, time of collection, and descriptive sample identifications are listed for fall
and spring collections. (Appendix A)
Spatial strata were sampled during the fall of 2001 and spring of 2002. While
sampling was intended to encompass low and high flow conditions, drought conditions
lowered the average flow rate by 60-70% relative to the long-term mean. The flow rate
at the northernmost point of our study area in Trenton, New Jersey for November 2001
was 2,850 CFS (cubic feet per second) while the average for this month is 9,480 CFS.
The flow rate for March 2002 sampling was 8,380 CFS as compared to the average
18,120 CFS (DRBC Monthly flow data from website
http://www.state.nj.us/drbc/data_summaries).
To accomplish the objectives of the study, a “core study” and two “variability
studies” were performed. The core study included composite collections of fish, prey
items, and surficial sediment at 2-3 random sites selected within each of the 4 zones. A
channel catfish variability study was conducted for both fall and spring sampling
campaigns, focusing on three specific locations chosen to reflect suspected low
(Bulkhead Shoals, Zone 5), moderate (Tinicum Shoals, Zone 4), and high (Dredge
Harbor, Zone 2) PCB contamination. This variability study focused on contaminant

7
transfer through the food web in localized areas to determine if contaminant transfer
varied at different exposure levels of contaminants. Individual channel catfish, respective
prey items, and surficial sediments were collected at the three sites, and individual
channel catfish fillets were analyzed as well as a composite of the fillets to assess
whether composites were representative of contaminant levels at a given site. Samples
from the channel catfish variability study were labeled as CC by zone. The second
“variability study” for white perch was conducted in Zone 5 during the fall campaign.
This study focused on spatial variability within a zone and examined whether sites for the
core study were representative of the entire zone. Three separate tows were conducted,
with 5 fish sampled from each tow. Individual white perch fillets and the composite
fillets from each tow were analyzed for PCB content. These samples are labeled as VAR
for variability study. The Zone 5 white perch fillet CORE composite was taken from one
of the variability tows, hence the CORE/VAR label in the sampling overview (Appendix
A).
Sediment Collection: Ekman sediment grabs were collected aboard the University of
Maryland’s R/V Aquarius following published guidelines (U.S. EPA 2001). Three or
more grabs were taken within a 5-10 m radius at each sediment site. The top 5 cm of
sediment from each grab was collected using a pre-rinsed stainless steel spoon and
transferred to a stainless steel bowl. The samples were homogenized and transferred to
pre-cleaned glass jars. Samples were placed on ice whilst aboard the ship and transferred
to -20º C freezers for storage prior to analysis.
All locations of sediment samples were determined using navigational maps,
shore-based observations, handheld GPS (accurate to < 5 m), and shipboard GPS.
8
Samples were collected outside of the dredged channel, except for transects across the
river that were sampled to quantify spatial variability. Criteria for acceptability of grab
samples included intact samples with sufficient depth penetration (>10 cm) and a
relatively undisturbed sediment surface.
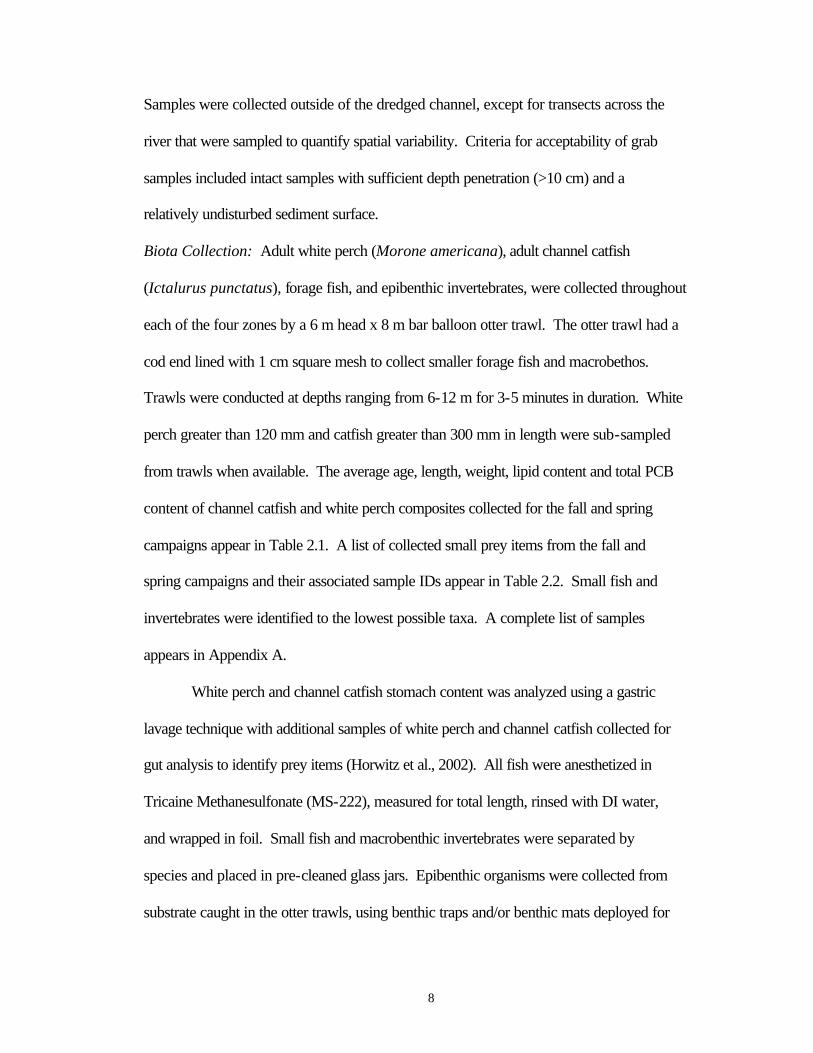
Biota Collection: Adult white perch (Morone americana), adult channel catfish
(Ictalurus punctatus), forage fish, and epibenthic invertebrates, were collected throughout
each of the four zones by a 6 m head x 8 m bar balloon otter trawl. The otter trawl had a
cod end lined with 1 cm square mesh to collect smaller forage fish and macrobethos.
Trawls were conducted at depths ranging from 6-12 m for 3-5 minutes in duration. White
perch greater than 120 mm and catfish greater than 300 mm in length were sub-sampled
from trawls when available. The average age, length, weight, lipid content and total PCB
content of channel catfish and white perch composites collected for the fall and spring
campaigns appear in Table 2.1. A list of collected small prey items from the fall and
spring campaigns and their associated sample IDs appear in Table 2.2. Small fish and
invertebrates were identified to the lowest possible taxa. A complete list of samples
appears in Appendix A.
White perch and channel catfish stomach content was analyzed using a gastric
lavage technique with additional samples of white perch and channel catfish collected for
gut analysis to identify prey items (Horwitz et al., 2002). All fish were anesthetized in
Tricaine Methanesulfonate (MS-222), measured for total length, rinsed with DI water,
and wrapped in foil. Small fish and macrobenthic invertebrates were separated by
species and placed in pre-cleaned glass jars. Epibenthic organisms were collected from
substrate caught in the otter trawls, using benthic traps and/or benthic mats deployed for

9
numerous days or from sediment grabs. Invertebrates, mainly the amphipod Gammarus
duebeni, were picked from substrate using pre-cleaned forceps and depurated for 6 hours
or more. Organisms were identified at the lowest visually identifiable taxa level. Biota
samples were placed on ice aboard the ship and transferred to -20º C freezers prior to
analysis. Additional sampling was necessary for Zone 2 both in fall and spring sampling
campaigns, as benthic trawls were unusable due to bottom topography. Further samples
were collected by the Academy of Natural Sciences in Zone 2 using gill netting and/or
electroshocking, and fish were processed in the manner described above (Horwitz et al.
2002).
Extraction and Analysis
Sample preparation: Channel catfish and white perch were prepared for extraction
according to standard methods following Environmental Protection Agency protocols
(EPA 2000). Fillets and remains were homogenized using an industrial strength food
grinder. For the core study, equal measures were taken from each of the fish and
thoroughly mixed to form composites of fillet and remains. For the variability studies,
individual fillets were homogenized for analysis as well as a composite of the fillets.
During processing, otoliths were removed for subsequent age determination. Small fish
and macro invertebrates were sorted by species and size and homogenized whole using a
pre-cleaned food processor. Most fish samples were filleted, homogenized and
subsampled at the Chesapeake Biological Laboratory (CBL), samples were divided
between CBL and the Academy of Natural Sciences (ANS) for analysis. Channel catfish,
prey fish, and invertebrates were analyzed at CBL while white perch and sediments were
measured at ANS. Both laboratories used identical preparatory and analytical methods as

10
Table 2.1. PCB concentrations observed channel catfish (Ictalurus punctatus) and white perch (Morone americana) collected from the Delaware River estuary in Fall 2001 and Spring 2002 (N=number of organisms in composite ±standard deviation (SD), NA= Not Available, *based on fillet/whole fish ratio). Organism Zone Date N Average Length (cm)
± SD Average Weight (g)
± SD Average Age
± SD %Lipid Total PCBs
(ng/g ww) Ictalurus punctatus 2 11/8/2001 6 48 ± 7 1023 ± 585 12 ± 4 9.2 1040
3 11/9/2001 6 42 ± 4 667 ± 223 9 ± 1 10.1 1990
4 11/8/2001 6 37 ± 2 368 ± 90 6 ± 1 8.6 1220
5 11/8/2001 5 41 ± 7 636 ± 449 7 ± 2 5.9 610
2 4/2/2002 5 52 ± 2 1415 ± 270 10 ± 1 4.8 480
3 3/20/2002 5 44 ± 5 833 ± 392 8 ± 1 7.4 1490
4 3/20/2002 5 37 ± 29 433 ± 124 7 ± 1 9.0 1620
5 3/20/2002 5 42 ± 4 654 ± 216 9 ± 1 10.1 1450
Morone americana 2 11/8/2001 6 20 ± 1 105 ± 39 6 ± 2 6.0 650
3 11/9/2001 6 17 ± 1 68 ± 11 3 ± 1 7.7 1260
4 11/8/2001 6 17 ± 11 70 ± 13 3 ± 1 7.3 1370*
5 11/8/2001 5 20 ± 2 122 ± 27 6 ± 2 10.3 320
2 6/21/2002 5 16 ± 2 64 ± 2 3 ± 1 6.0 620*
3 3/20/2002 5 18 ± 1 85 ±15 4 ± 1 7.1 1020
4 3/20/2002 5 18 ± 1 92 ±19 4 ± 0 7.1 1090
5 3/20/2002 5 21 ± 1 171 ±38 7 ± 2 4.3 1060

11
Table 2.2. PCB concentrations observed within prey fish and invertebrates collected from the Delaware River estuary in Fall 2001 and Spring 2002 (N=number of organisms in composite, YOY=young of the year).Organism Zone Date N %Lipid Total PCBs (ng/g ww) Ictalurus punctatus YOY Channel Catfish 3 11/8/2001 4 4.5 780 Trinectes maculatus Hogchoker 3 11/8/2001 1 0.9 90 Ictalurus punctatus YOY Catfish 3 11/8/2001 1 2.5 540 Micropogonias undulatus Croaker 4 11/8/2001 16 2.0 180 Micropogonias undulatus Croaker 4 11/8/2001 15 1.1 100 Trinectes maculatus Hogchoker 4 11/8/2001 5 3.2 550 Ictalurus punctatus YOY Channel Catfish 4 11/8/2001 10 5.5 640 Notropis hudsonius Spottailed Shiner 4 11/8/2001 1 5.7 950 Etheostoma olmstedi Tesselated Darter 4 11/8/2001 1 0.3 310 Morone americana Juvenile White Perch 4 11/8/2001 4 2.4 340 Anguilla rostrata American Eel 5 11/8/2001 3 2.7 340 Trinectes maculatus Hogchoker 5 11/8/2001 4 3.8 40 Notropis hudsonius Spot-tailed Shiners 2 4/2/2002 11 3.2 100 Etheostoma olmstedi Tessalated Darter 2 4/2/2002 8 2.7 90 Fundulus diaphanus Banded Killifish 2 4/2/2002 7 2.2 150 Ictalurus punctatus YOY Channel Catfish 3 3/20/2002 5 1.5 660 Morone americana Juvenile White Perch 3 3/20/2002 6 2.5 500 Morone americana Juvenile White Perch 4 3/20/2002 8 2.7 600 Ictalurus punctatus YOY Channel Catfish 4 3/20/2002 7 1.8 580 Notropis hudsonius Spottail shiner 4 3/20/2002 1 5.0 730 Morone americana Juvenile White Perch 5 3/20/2002 2 2.4 140 Ictalurus punctatus YOY Channel Catfish 5 3/20/2002 3 1.9 220 Gammarus spp. Amphipods 2 11/8/2001 0.6 40 Gammarus spp. Amphipods 3 11/8/2001 0.4 110 Gammarus spp. Amphipods 4 11/8/2001 0.8 150 Gammarus spp. Amphipods 5 11/8/2001 0.6 50 Palaemonetes spp. Grass shrimp 5 11/8/2001 1.1 40 Gammarus spp. Amphipods 2 4/3/2002 1.7 240 Gammarus spp. Amphipods 3 3/20/2002 2.2 150 Gammarus spp. Amphipods 3 3/20/2002 0.9 80 Gammarus spp. Amphipods 3 3/20/2002 1.6 30 Decopoda Crayfish 4 3/20/2002 1.8 50 Gammarus spp. Amphipods 4 3/20/2002 1.3 30 Decopoda Crayfish 4 3/20/2002 1.1 50 Gammarus spp. Amphipods 5 3/20/2002 1.2 100

12
detailed below.
Laboratory methods: Whole individual forage fish, invertebrates, fish fillet and remains
homogenates were ground with granular Na2SO4 using a pre-cleaned mortar and pestle to
dry the sample. This mixture was placed in pre-baked and cleaned Soxhlet extractor with
glass wool plugs, spiked with PCB surrogate standards 3,5-dichlorobiphenyl (congener
14) and 2,3,4,4’,5,6-hexachlorobiphenyl (congener 166). In addition, ANS analyzed
2,3,5,6-tetrachlorobiphenyl (congener 65). Sediment analysis performed by the Academy
of Natural Sciences is detailed in Ashley and Baker (1999). Briefly, sub-samples were
taken to determine water content; sediment was then dried with sodium sulfate. Pre-
cleaned activated elemental copper wool was added to round bottom flasks to remove
elemental sulfur. Elemental sulfur has been shown to interfere with PCB congener
detection when using an electron capture detector (Ashley and Baker 1999). All samples
were extracted for at least 18 hours with dichloromethane. Samples were then
concentrated and dichloromethane was exchanged with hexane by rotary evaporation.
Biota extracts were sub-sampled for lipid content with an aliquot of extract
removed and placed in a pre-tared aluminum tray, dried overnight at 60° C and weighed
the next day to determine gravimetric lipid content. Lipid in the remaining extract was
removed by gel permeation chromatography (GPC) using a 250-mm x 22.5-mm inner
diameter Phenomenex Phenogel column (10µm particles with a 100-Å pore size) and
dichloromethane as the mobile phase at 5ml/min. Samples were then concentrated and
dichloromethane was exchanged with hexane by rotary evaporation. Samples were
further cleaned using Florisil and the PCB fraction was separated. Florisil was pre-

13
cleaned with a hexane: acetone mixture (1:1 v/v) for 24 hours, activated at 550 ºC for 4
hours, and deactivated using 2% deionized water. The Florisil was placed in a glass
column with a pre-cleaned glass wool plug and a 1g cap of Na2SO4 was added.
Petroleum ether (35ml) was used to elute the first fraction (F1) of the sample containing
PCBs. The second fraction (F2) was eluted using petroleum ether: dichloromethane
(50ml, 1:1 v/v) to collect organochlorine pesticides. Both F1 and F2 fractions were
concentrated and transferred to hexane using rotary evaporation. Samples were
transferred to auto sampler vials with further concentration under a nitrogen stream. The
F2 fraction was archived for future analysis. PCB internal standards 2,3,6-
trichlorobiphenyl (congener 30) and 2,2',3,4,4',5,6,6'-octachlorobiphenyl (congener 204)
were added to F1 samples and calibration standards for analysis on the GC-ECD.
PCB congeners were analyzed using a Hewlett Packard 5890 gas chromatograph
equipped with a 63Ni electron capture detector. A 60 meter 5% phenylmethyl silicon
capillary column with a 0.25-mm internal diameter and 0.25-µm stationary phase film
thickness was used (DB-5, J&W Scientific, Folsom, CA, USA). The carrier and make-
up gases were nitrogen (CBL) or hydrogen and argon/methane (ANS) with a flow rate of
30 ml/min. The inlet pressure was 100 kPa. The temperature program began with 100
degrees C for 2 min, 100-170 degrees C at 4 degrees C/min, 170-280 degrees C at 3
degrees C/min, and 5 min at 280 degrees C. The injector and detector temperatures were
225 degrees C and 285 degrees C, respectively. 2-µl samples were injected with an auto
sampler (HP 7673) in the splitless injection mode. Both an HP3393A integrator and
Chemstation computer software were used to acquire data (Hewlett Packard, Palo Alto,
CA, USA).

14
PCB congeners were identified and quantified based on previously reported
methods (Mullin et al. 1984). Congener identification was based on chromatographic
retention times in relation to the internal standards added. The relationship between
congeners and the corresponding calibration standard allowed for quantification of PCBs.
If co eluting congeners were unable to be resolved, combined values were reported.
Congener specific results were totaled to determine “total PCB”. To report as PCB
homologue groups, co eluting congeners were separated based on percent contribution to
commercial Aroclor mixtures (Frame et al. 1996).
Determination of whole fish values: Whole fish total PCB concentrations were calculated
using the weight of fillet/ weight of the whole fish ratio and the weight of remains/
weight of whole fish ratio to determine the percent contribution of each to a whole fish
PCB value. Fillet vs. whole fish ng/g ww and lipid values are presented in Figure 2.2.
The fillet vs. whole ratio for wet weight PCBs on average is 1:3. When values are lipid
normalized, the fillet to whole fish ratio shows a consistent 1:1 ratio. In the event of a
sample loss, the average ratio of PCBs in fillet/ PCBs in whole fish was calculated and
applied to fillet values to determine whole fish. In the case of Spring Zone 5 channel
catfish, surrogate recovery was low. For this sample, individual congeners were
transformed based on the percent surrogate recovery to meet the average surrogate
recovery of 90% from all samples.
Water samples: PCB data from water samples taken during fall and spring cruises was
unavailable at the time of publication, therefore BCF values were calculated using
dissolved PCB concentrations obtained from the Delaware River Basin Commission from
ambient water sampling conducted in September 2001 and March 2002 (DRBC 2003).

15
Only those congeners analyzed in both data sets were used for individual congener
bioconcentration factors (Table 2.3).
Quality Assurance
Comparison of PBC Congener Analysis: Similar quantification methods were used by
ANS and CBL as detailed previously, although reporting styles differed for a few
congeners. ANS reported individual concentrations for the commonly co-eluting
congeners of 47+48, 66+95 and 82+151 where CBL reported them as the sum of
congeners. CBL reported individual concentrations for co-eluting congeners 172+197
whereas ANS reported the co-eluting pair. To merge the data sets, individual
concentrations were added to produce one concentration in such cases. ANS does not
report congeners 89 and 119 due to low levels in calibration standards. The same is true
for congener 131 for CBL, therefore a data qualifier of “NA” (not analyzed) is listed for
these congeners. A complete list of congeners analyzed by ANS and CBL is shown in
Table 2.3. To measure analytical precision and accuracy quality assurance methods
were employed using laboratory matrix blanks, surrogate materials, standard reference
materials, and replicate analysis (Appendix D).
Detection limits: To address possible laboratory contamination and calculate detection
limits for each congener, matrix blanks of ~30g of clean Na2SO4 spiked with PCB
surrogates were analyzed following the procedure used for biota and sediment samples.
The blank detection limit for each congener was estimated as three times the peak area of
the signal produced in the matrix blank. CBL detection limits of t-PCB ranged from to 16
ng to 24 ng; ANS t-PCB detection limits ranged from to 12 ng to 34 ng. The method
detection limit is defined as three times the blank signal concentration corrected for

16
Fillet tPCBs (ng/g ww)
0 500 1000 1500 2000 2500
Wh
ole
Fis
h t
PC
Bs
(ng
/g w
w)
0
500
1000
1500
2000
2500
CC
CC
C C
CC
CC
CC
CC
W P
WP
WP
W P
W PW P
W P
Fillet tPCBs (ng/g lipid)
0 5000 10000 15000 20000 25000 30000
Wh
ole
Fis
h (n
g/g
lip
id)
0
5000
10000
15000
20000
25000
30000
CC
CC
CC
CCCC
CC
CC
W P
W P
W P
W P
W PW P
W P
Figure 2.1. Total PCBs in fillet vs. whole fish in ng/g wet weight and ng/g lipid (CC=channel catfish, WP=white perch).

17
Congeners Congeners Congeners Congeners Detected by CBL and ANS Detected by DRBC Detected by CBL and ANS Detected by DRBC
1* 1* 77,110 77,110 3* 3* 82, 151 82
4,10 4+10 135,144 135 7,9 7 107 107 6 6 123,149 123
8,5 8 118 118 19 19 134 134
12,13 12 146 146 18* 18* 132,153,105 132+153+105 17 17 141 141 24 24 137,130,176 137+130+176
16,32 16+32 158* 158* 26 26 129,178 129+178 25 25 187,182 187
31, 28 31 183 183 33,21,53 21 128 128
22 22 174 174 45 45 177 177 46 46 202,171,156 202+171+156 52 52 172,197 172+197
49* 49* 180 180 47,48* 48 191 191
44 44 170,190 170+190 37,42 37 198 198
41,64,71 64 201* 201* 40 40 203,196 203+196
63* 63* 189 189 74 74 208,195 208+195
66,95 66 207 207 56,60/92,84 56+60/92+84 194 194
89* NA* 205 205 83 83 206 206 85 85 209 209
136 136
Table 2.3. Comparison of PCB Congeners Quantified by Chesapeake Biological Laboratory (CBL) and the Academy of Natural Sciences (ANS) with Delaware River Basin Commission (DRBC). Highlighted congeners indicate discrepancy in data sets. *Congeners eliminated from analysis based on suspected co-elution problems.

18
concentration (detection limit mass divided by the sample mass extracted).
Concentrations falling below the method detection limit are denoted as “ND” (non-
detect).
Surrogate recoveries: Due to matrix interferences, the recovery of congener 14 was
problematical and was not used to assess analyte loss. Mean recoveries of PCB congeners
for 65 and 166 for all samples extracted and analyzed by ANS were 86 ± 16% and 90 ±
18%, respectively. Mean recoveries of PCB congener 166 extracted and analyzed by
CBL was 76 ± 18 %. Surrogate recoveries were relatively high with low standard
deviations; therefore all reported values for PCBs were not corrected for analyte loss.
Congener selection: Certain congeners were eliminated from the data set based on
suspected co-elution problems (1, 3, 18, 47+48, 49, 51, 63, 89, 119, 158, 199, 201). Most
of these congeners contribute less than 1% to the total PCB concentration. The complete
data set is presented in Appendices B and C, although analysis of the data set for this
paper is based on the abbreviated congener list.
Standard Reference Materials: To evaluate extraction efficiency and analytical accuracy,
standard reference materials from the National Institute for Standards and Technology
(NIST) were used. Lake Superior Fish Tissue (1946) was analyzed by both CBL and
ANS with measured values of 77 ± 34% and 87 ± 35% on average of their certified
values. Four congeners were excluded from this average for CBL (18, 63, 195, 201) due
to recoveries well over 100%, leaving a total of 37 congeners compared between data
sets. In addition, CBL’s measured values of Organics in Mussel Tissue (1974a) to
compare recoveries in samples with low contaminant concentrations. The measured

19
values were 52 ± 24% of the certified value. ANS analyzed Organics in Sediment (1944)
measured values were 61 ± 32% of the certified value.
Replicates: To assess precision of analytical techniques, CBL and ANS both performed
replicate analysis on randomly selected samples. Replicate sampling was attempted for
biota and sediment for both seasons providing sufficient sample mass was available.
Relative percent differences of replicates ranged between 1-31% of the total PCBs for
CBL. ANS replicates ranged from 0-23%, with one sediment sample at 100% due to
very low concentrations of total PCB of 4 ng/g dw and 13 ng/g dw for the replicate. This
use of relative percent difference may be misleading. Heterogeneity exists among
samples and those with very low concentrations of total PCB such as invertebrates had
high relative percent differences.
Interlaboratory comparison: To assess comparability between CBL and ANS
laboratories, six fish samples were exchanged between the two participating laboratories
and analyzed. The relative percent differences (RPDs) of total PCBs were between 22-
43% for interlab comparison.
Analytical Variability: Due to limited sampling capabilities, one composite sample per
zone was analyzed for sediment and biota groups. Separate variability studies were
undertaken to address variability within a zone, and determine if sampling adequately
represented PCB concentrations. Lack of replicates did not allow conventional statistical
analysis with such a data set.
The average recovery of surrogate 65 was 86 ± 16% while the average recovery
of CBL and ANS for surrogate 166 was 81 ± 19%. We may calculate the method
precision based on these recoveries using the relative standard deviation of the surrogate

20
recoveries from the average surrogate recovery. This measure of analytical precision was
calculated to be 21%. As stated previously, CBL’s recovery of surrogate 14 was
problematic due to matrix interferences and was therefore disregarded in analysis.
Variability Study: Individual white perch and channel catfish fillets were analyzed to
investigate PCB variability among fish collected within a zone. Overall, the white perch
and channel catfish showed considerable variation among fillet PCB content (Table 2.4).
Lipid normalizing the wet weight values explains some, but not all of the variability
among individual fish within a zone (Figures 2.3-2.11). This variation within fish
collected from the same site leads to concerns with predictive capabilities, specifically if
we may adequately address the range of PCB concentrations in fish samples through the
sampling design. The limited sample size in this study limits statistical power to show
differences or similarities. In considering the benefits of compositing samples against the
cost of the ability to conduct rigorous inferential statistics, we find the mathematical
average of individual fillet PCB values equals the PCB concentration in composited
individual fillets. This demonstrates the efficiency and cost effectiveness of compositing
tissue samples.
PCB variability among fish collected within a zone may be addressed through the
white perch and channel catfish variability studies. For the white perch variability study,
ANOVA (P<0.05) shows no significant differences among tows. Evidence exists for
violation of normality assumption of ANOVA with residuals skewed to the high end,
therefore white perch data may be log-normal in distribution. It is difficult to produce a
standard error for the composite means, therefore we will continue under the assumption
of normality. Levene’s test shows no evidence for violation of homogeneous variance

21
assumption of ANOVA. Based on these statistics we may assume variability is
consistent across tows. The standard error of the mean for the white perch variability
study (n=5) is 154 ng/g ww total PCBs.
Channel catfish collected at the suspected high contamination site Tinicum Shoals
(Zone 4) had concentrations for fall and spring of 15,250 ng/g lipid and 33,460 ng/g lipid
respectively; the catfish at the moderate contamination site Mud Island Shoals or Dredge
Harbor (Zone 2) had fall and spring concentrations of 11,200 ng/g lipid and 25,450 ng/g
lipid; channel catfish at Bulkhead Shoals (Zone 5), the least likely PCB contaminated
site, had PCB values of 10,080 ng/g lipid and 7,320 ng/g lipid. ANOVA showed
significant differences among zones (P=0.028), but no significant difference between
seasons. There was no evidence for violation of normality assumption of ANOVA.
Using Levene’s test there was no evidence for violation of homogeneous variance
assumption of ANOVA. The standard error of the mean for the channel catfish
variability study (n=5) is 94 ng/g ww total PCBs.

22
Sample Zone Season N Total PCB (ng/g ww)
Standard Deviation
Coefficient of Variation
White Perch 5 Fall 5 361 225 0.62
5 Fall 5 376 378 1.00
5 Fall 5 606 437 0.72
Channel Catfish 2 Fall 5 513 203 0.40
4 Fall 5 486 159 0.32
5 Fall 5 375 298 0.80
2 Spring 5 767 243 0.32
4 Spring 5 574 137 0.24
5 Spring 5 337 168 0.50
Table 2.4. Total PCB (ng/g ww) concentrations in white perch and channel catfish variability studies (N=number of organisms)

23
To
tal P
CB
(n
g/g
ww
)
0
200
400
600
800
WP1 WP2 WP3 WP4 WP5 Average WP Composite
White Perch Variability 1T
ota
l PC
B (
ng
/g li
pid
)
0
5000
10000
15000
20000
25000
30000
WP1 WP2 WP3 WP4 WP5 Average WP Composi te
White Perch Variability 1
Figure 2.2. Total PCBs (ng/g ww) for individual white perch (WP1-WP5), the mathematical average and white perch composite for Fall 2001 variability study 1 in zone 5.

24
To
tal P
CB
(n
g/g
ww
)
0
200
400
600
800
1000
1200
1400
WP1 WP2 WP3 WP4 WP5 WP6 Average WP Composi te
White Perch Variability 2T
ota
l PC
B (n
g/g
lip
id)
0
5000
10000
15000
20000
25000
30000
WP1 WP2 WP3 WP4 WP5 WP6 Average WP Composi te
White Perch Variability 2
Figure 2.3. Total PCBs (ng/g ww) for individual white perch (WP1-WP6), the mathematical average and white perch composite for Fall 2001 variability study 2 in zone 5.

25
To
tal P
CB
(n
g/g
ww
)
0
200
400
600
800
1000
WP1 WP2 WP3 WP4 WP5 Average WP Composite
White Perch Variability 3T
ota
l PC
B (n
g/g
lip
id)
0
10000
20000
30000
40000
WP1 WP2 WP3 WP4 WP5 Average WP Composite
White Perch Variability 3
Figure 2.4. Total PCBs (ng/g ww) for individual white perch (WP1-WP5), the mathematical average and white perch composite for Fall 2001 variability study 3 in zone 5 (WP 3 lipid value not available).

26
Catfish Variability Fall Zone 2
To
tal P
CB
(n
g/g
ww
)
0
200
400
600
800
1000
CC1 CC2 CC3 CC4 CC5 Average Fillet Composite
Catfish Variability Fall Zone 2
To
tal P
CB
(ng
/g li
pid
)
0
5000
10000
15000
20000
25000
30000
CC1 CC2 CC3 CC4 CC5 Average Fillet Composite
Figure 2.5. Total PCBs (ng/g ww) for individual channel catfish (CC1-CC5), the mathematical average and channel catfish composite for Fall 2001 variability study in zone 2.

27
Catfish Variability Fall Zone 4
To
tal P
CB
(ng
/g w
w)
0
200
400
600
800
1000
CC1 CC2 CC3 CC4 CC5 Average Fillet Composite
Catfish Variability Fall Zone 4
To
tal P
CB
(n
g/g
lip
id)
0
10000
20000
30000
CC1 CC2 CC3 CC4 CC5 Average Fillet Composite
Figure 2.6. Total PCBs (ng/g ww) for individual channel catfish (CC1-CC5), the mathematical average and channel catfish composite for Fall 2001 variability study in zone 4.

28
Catfish Variability Fall Zone 5
To
tal P
CB
(n
g/g
ww
)
0
200
400
600
800
1000
CC1 CC2 CC3 CC4 CC5 Average Fillet Composite
Catfish Variability Fall Zone 5
To
tal P
CB
(n
g/g
lip
id)
0
5000
10000
15000
20000
25000
30000
CC1 CC2 CC3 CC4 CC5 Average Fillet Composite
Figure 2.7. Total PCBs (ng/g ww) for individual channel catfish (CC1-CC5), the mathematical average and channel catfish composite for Fall 2001 variability study in zone 5.

29
Catfish Variability Spring Zone 2
To
tal P
CB
(n
g/g
ww
)
0
200
400
600
800
1000
1200
1400
CC1 CC2 CC3 CC4 CC5 CC6 Average Fillet Composite
Catfish Variability Spring Zone 2
To
tal P
CB
(n
g/g
lip
id)
0
10000
20000
30000
40000
50000
60000
CC1 CC2 CC3 CC4 CC5 CC6 Average Fillet Composite
Figure 2.8. Total PCBs (ng/g ww) for individual channel catfish (CC1-CC6), the mathematical average and channel catfish composite for Spring 2002 variability study in zone 2.

30
Catfish Variability Spring Zone 4
To
tal P
CB
(n
g/g
ww
)
0
200
400
600
800
1000
1200
CC1 CC2 CC3 CC4 CC5 Average Fillet Composite
Catfish Variability Spring Zone 4
To
tal P
CB
(ng
/g li
pid
)
0
10000
20000
30000
40000
50000
CC1 CC2 CC3 CC4 CC5 Average Fillet Composite
Figure 2.9. Total PCBs (ng/g ww) for individual channel catfish (CC1-CC5), the mathematical average and channel catfish composite for Spring 2002 variability study in zone 4.

31
Catfish Variability Spring Zone 5
To
tal P
CB
(n
g/g
ww
)
0
100
200
300
400
500
600
700
CC1 CC2 CC3 CC4 CC5 Average Fillet Composite
Catfish Variability Spring Zone 5
To
tal P
CB
(n
g/g
lip
id)
0
5000
10000
15000
20000
25000
30000
CC1 CC2 CC3 CC4 CC5 Average Fillet Composite
Figure 2.10. Total PCBs (ng/g ww) for individual channel catfish (CC1-CC5), the mathematical average and channel catfish composite for Spring 2002 variability study in zone 5.

32
Chapter Three
ACCUMULATION OF POLYCHLORINATED BIPHENYLS IN SEDIMENT AND BIOTA
Introduction
Estuaries are dynamic systems with great spatial, temporal, and chemical
variability. Point and non-point sources of hydrophobic organic contaminants
such as polychlorinated biphenyls (PCBs) are often located along or adjacent to
estuaries, resulting in contaminant concentration gradients within urban waters.
Residence times of these hydrophobic organic contaminants in sediments can be
long enough that exposure can lead to significant bioaccumulation in resident
organisms (Mackay and Fraser 2000; van der Oost et al. 2003). The partitioning
of PCBs between sediment and biota depends on chemical properties such as the
octanol/water partition coefficient, Kow (Shaw and Connell 1984; Mackay and
Fraser 2000). Accumulation within biota is affected by many processes including
uptake, egestion, metabolism, growth and reproduction (Mackay and Fraser
2000).
The Delaware River is characterized by significant spatial gradients in
PCB levels due to elevated urban loadings (DRBC 1998). We may hypothesize
that ambient PCB levels in the river may correspond to areas of high urbanization.
The relationship between ambient PCB levels and levels of PCB accumulation in
biota may be examined over the spatial gradient. Modeling PCB transfer
throughout an estuarine food web requires extensive data that describe physical
and biological variability. Analysis of contaminant concentrations in top
predators and their respective prey items gives an overall view of food web

33
dynamics and the transport and accumulation of PCBs (Thomann et al. 1992;
DiPinto and Coull 1997; Harding et al. 1997). Extensive data on predator/prey
dynamics and bioenergetics information is required to accurately represent
contaminant transfer in a system.
The objectives of this study are to determine the PCB levels in the
Delaware River estuary with emphasis on spatial/temporal variability and
accumulation in the food web to address the following points:
(1) Examine the variation of PCB congener patterns spatially and among species of
different trophic levels
(2) Observe the effect of life history and migratory patterns on PCB congener
accumulation in fish
Results and Discussion
PCB Spatial Patterns:
The values presented in Figure 3.1 are average concentrations of PCB levels in
the sediment within zones. PCB concentrations in individual sediment samples prior to
compositing range from 0-400 ng/g dw over an evident spatial gradient of PCB
distribution with low concentrations in zone 2 (70 and 20 ng/g dw for fall and spring
zonal averages) and the highest concentrations in Zone 3 (180-220 ng/g dw for fall and
spring zonal averages) with levels decreasing downstream (Figure 3.1). The sampling
design was not sufficient to estimate zonal variation, as 1-3 samples were collected in
each zone. ANOVA (P<0.05) showed no significant difference between fall and spring
samples, the relative rank of PCB concentrations in sediments did not change seasonally.

34
ZONE
2 3 4 5
To
tal P
CB
s (n
g/g
dw
)
0
50
100
150
200
250FALLSPRING
Figure 3.1 Total PCB concentration in surficial sediments by zone in the Delaware River estuary during Fall 2001 and Spring 2002.
35
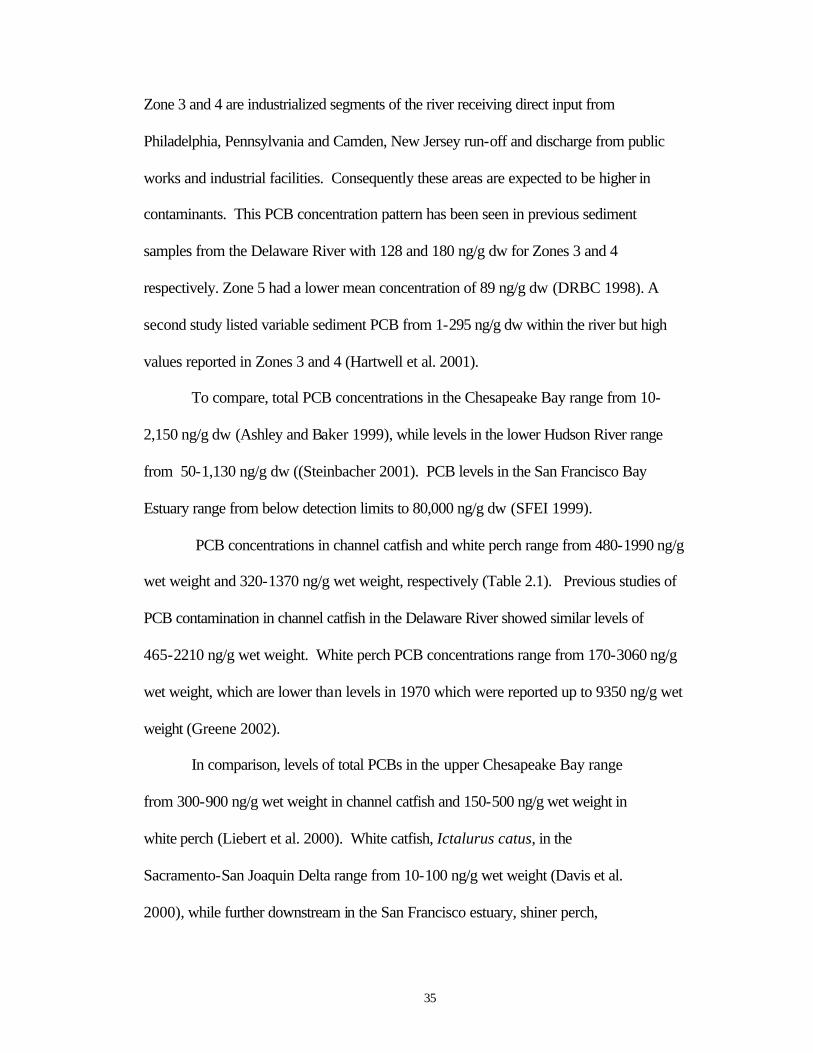
Zone 3 and 4 are industrialized segments of the river receiving direct input from
Philadelphia, Pennsylvania and Camden, New Jersey run-off and discharge from public
works and industrial facilities. Consequently these areas are expected to be higher in
contaminants. This PCB concentration pattern has been seen in previous sediment
samples from the Delaware River with 128 and 180 ng/g dw for Zones 3 and 4
respectively. Zone 5 had a lower mean concentration of 89 ng/g dw (DRBC 1998). A
second study listed variable sediment PCB from 1-295 ng/g dw within the river but high
values reported in Zones 3 and 4 (Hartwell et al. 2001).
To compare, total PCB concentrations in the Chesapeake Bay range from 10-
2,150 ng/g dw (Ashley and Baker 1999), while levels in the lower Hudson River range
from 50-1,130 ng/g dw ((Steinbacher 2001). PCB levels in the San Francisco Bay
Estuary range from below detection limits to 80,000 ng/g dw (SFEI 1999).
PCB concentrations in channel catfish and white perch range from 480-1990 ng/g
wet weight and 320-1370 ng/g wet weight, respectively (Table 2.1). Previous studies of
PCB contamination in channel catfish in the Delaware River showed similar levels of
465-2210 ng/g wet weight. White perch PCB concentrations range from 170-3060 ng/g
wet weight, which are lower than levels in 1970 which were reported up to 9350 ng/g wet
weight (Greene 2002).
In comparison, levels of total PCBs in the upper Chesapeake Bay range
from 300-900 ng/g wet weight in channel catfish and 150-500 ng/g wet weight in
white perch (Liebert et al. 2000). White catfish, Ictalurus catus, in the
Sacramento-San Joaquin Delta range from 10-100 ng/g wet weight (Davis et al.
2000), while further downstream in the San Francisco estuary, shiner perch,

36
Cymatogaster aggregata, range from 45-490 ng/g wet weight (Greenfield et al.
2003).
Prey fish total PCB concentrations range from 40-950 ng/g wet weight and
invertebrates range from 30-240 ng/g wet weight (Table 2.2). PCB levels in biota from
fall collections reflect spatial and temporal trends in sediment PCB concentrations.
ANOVA (P<0.05) showed no seasonal differences for channel catfish, white perch, and
invertebrates while a significant difference was seen in prey fish. Once again, the limited
sample size (N=4 for channel catfish, white perch and invertebrates, N=3 for prey fish)
gives limited power for predicting similarities or differences among samples. Elevated
concentrations are seen for channel catfish, white perch, prey fish and invertebrates in
zone 3 and 4 with lower concentrations in zone 2 and 5 (Figure 3.2). Spring PCB levels
in channel catfish and prey fish follow similar spatial trends reflective of sediment
concentrations, while white perch and invertebrates vary considerably.
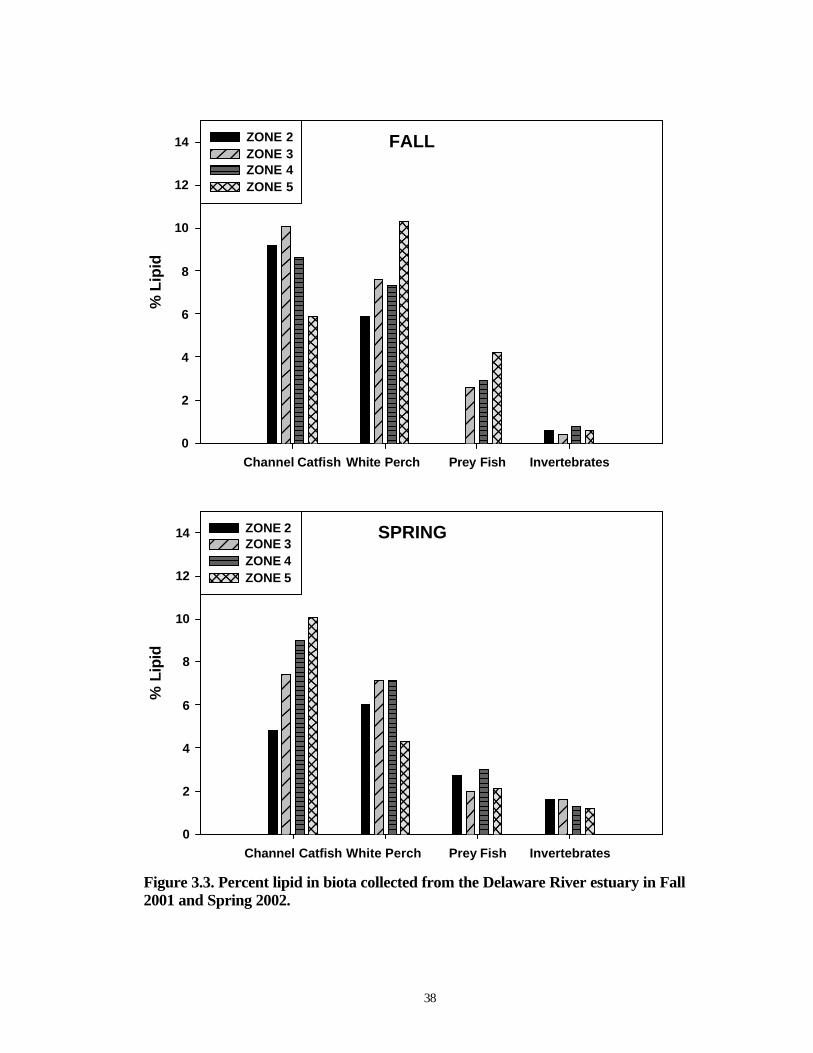
Channel catfish and white perch show variable lipid content throughout the river
(Figure 3.3), likely due to spawning dynamics and feeding behaviors. As lipid content
affects contaminant levels, normalizing for lipid content (Figure 3.4) should reduce
variability in organism chemical concentration (Thomann 1989). Comparing lipid
normalized total PCB values of trophic levels indicates PCB concentrations do not
increase with trophic position as discussed further in Chapter 4.
White perch PCB levels are consistent with the sediment spatial PCB gradient in
the fall, while PCB concentrations in white perch are similar throughout the estuary in
spring. White perch have limited movement downstream to deeper waters in the fall, and
extensive movement within the estuary during the spring spawn (Mansueti 1961). This

37
SPRING
Channel Catfish White Perch Prey Fish Invertebrates
To
tal P
CB
(n
g/g
wet
)
0
500
1000
1500
2000
2500ZONE 2ZONE 3ZONE 4ZONE 5
FALL
Channel Catfish White Perch Prey Fish Invertebrates
To
tal P
CB
(n
g/g
wet
)
0
500
1000
1500
2000
2500ZONE 2ZONE 3ZONE 4ZONE 5
Figure 3.2. Total PCB concentrations (ng/g wet weight) in biota collected from the Delaware River estuary in Fall 2001 and Spring 2002.
38
FALL
Channel Catfish White Perch Prey Fish Invertebrates
% L
ipid
0
2
4
6
8
10
12
14 ZONE 2ZONE 3ZONE 4ZONE 5
SPRING
Channel Catfish White Perch Prey Fish Invertebrates
% L
ipid
0
2
4
6
8
10
12
14 ZONE 2ZONE 3ZONE 4ZONE 5
Figure 3.3. Percent lipid in biota collected from the Delaware River estuary in Fall 2001 and Spring 2002.

39
FALL
Channel Catfish White Perch Prey Fish Invertebrates
To
tal P
CB
(ng
/g li
pid
)
0
10000
20000
30000
40000ZONE 2ZONE 3ZONE 4ZONE 5
SPRING
Channel Catfish White Perch Prey Fish Invertebrates
To
tal P
CB
(ng
/g li
pid
)
0
10000
20000
30000
40000ZONE 2ZONE 3ZONE 4ZONE 5
Figure 3.4. Total PCB concentrations (ng/g lipid) in biota collected from the Delaware River estuary in Fall 2001 and Spring 2002.

40
seasonal habitat change alters exposure to contaminants. Peak spawning occurs in late
March to April (Jackson and Sullivan 1995), during the time of our spring sampling
events. Changes in whole body lipid content from 10% in the fall to 4% in the spring
influence the lipid normalized total PCB content (Table 2.1). Previous studies have
shown a loss of contaminants resulting from spawning and coincident lowered lipid
content (Larsson et al. 1993).
Although lipid content in amphipods is similar among zones for each season
(Figure 3.3), amphipods undergo seasonal lipid fluctuation with an increase in average
lipid content among zones from 0.6% in fall to 1.5% in the spring. Gammarus sp were
the dominant epi-benthic invertebrates collected during this study. Gammarus sp. are
epi-faunal organisms defined as deposit or scavenger feeders with reproduction occurring
from spring to fall (DeWitt et al. 1992). The reproductive life cycle of Gammarus
lacustris greatly affects lipid dynamics in females with a 10% drop in lipid levels with
release of young (Wilhelm 2002).
PCB Congener Patterns:
PCB congener composition varies spatially in both sediment and biota with the
more heavily chlorinated homologue fraction increasing downriver. Enrichment of octa-,
nona-, and deca-chlorinated biphenyl groups is seen throughout all sediment and biota
samples in zones 4 and 5 (Figures 3.5-3.9). The presence of heavier chlorinated
congeners was observed for both seasons, indicating little temporal variability in
congener distribution. A high concentration of the nona-chlorinated biphenyl group may
be seen in fall sediment sample collected from zone 5, as well as a high concentration of
the octa-chlorinated biphenyl group in the spring sediment sample from zone 4

41
Homologue Groupdi tri tetra penta hexa hepta octa nona deca
Fra
ctio
nal
Co
ntr
ibu
tio
n o
f Ho
mo
log
ue
Gro
up
0.0
0.1
0.2
0.3
0.4ZONE 2ZONE 3ZONE 4ZONE 5
CHANNEL CATFISHFALL
Homologue Groupdi tri tetra penta hexa hepta octa nona deca
Fra
ctio
nal
Co
ntr
ibu
tio
n o
f H
om
olo
gu
e G
rou
p
0.0
0.1
0.2
0.3
0.4ZONE 2ZONE 3ZONE 4ZONE 5
CHANNEL CATFISHSPRING
Figure 3.5. Fractional contribution of PCB homologue groups in channel catfish collected from the Delaware River estuary in Fall 2001 and Spring 2002.

42
Homologue Group
di tri tetra penta hexa hepta octa nona deca
Fra
ctio
nal
Co
ntr
ibu
tio
n o
f Ho
mo
log
ue
Gro
up
0.0
0.1
0.2
0.3
0.4ZONE 2ZONE 3ZONE 4ZONE 5
WHITE PERCHSPRING
Homologue Group
di tri tetra penta hexa hepta octa nona deca
Fra
ctio
nal
Co
ntr
ibu
tio
n o
f Ho
mo
log
ue
Gro
up
0.0
0.1
0.2
0.3
0.4ZONE 2 ZONE 3 ZONE 4 ZONE 5
WHITE PERCH FALL
Figure 3.6. Fractional contribution of PCB homologue groups in white perch collected from the Delaware River estuary in Fall 2001 and Spring 2002.

43
PREY FISHSPRING
Homologue Group
di tri tetra penta hexa hepta octa nona deca
Fra
ctio
nal
Co
ntr
ibu
tio
n o
f Ho
mo
log
ue
Gro
up
0.0
0.1
0.2
0.3
0.4
0.5ZONE 2ZONE 3ZONE 4ZONE 5
Homologue Group
di tri tetra penta hexa hepta octa nona deca
Fra
ctio
nal
Co
ntr
ibu
tio
n o
f H
om
olo
gu
e G
rou
p
0.0
0.1
0.2
0.3
0.4
0.5ZONE 3 ZONE 4 ZONE 5
PREY FISHFALL
Figure 3.7. Fractional contribution of PCB homologue groups in prey fish collected from the Delaware River estuary in Fall 2001 and Spring 2002. (No sample available for Fall Zone 2)

44
Homologue Group
di tri tetra penta hexa hepta octa nona deca
Fra
ctio
nal
Co
ntr
ibu
tio
n o
f H
om
olo
gu
e G
rou
p
0.0
0.1
0.2
0.3
0.4
0.5ZONE 2ZONE 3ZONE 4ZONE 5
INVERTEBRATESSPRING
Homologue Group
di tri tetra penta hexa hepta octa nona deca
Fra
ctio
nal
Co
ntr
ibu
tio
n o
f H
om
olo
gu
e G
rou
p
0.0
0.1
0.2
0.3
0.4
0.5ZONE 2ZONE 3ZONE 4ZONE 5
INVERTEBRATESFALL
Figure 3.8. Fractional contribution of PCB homologue groups in invertebrates collected from the Delaware River estuary in Fall 2001 and Spring 2002.

45
Homologue Group
di tri tetra penta hexa hepta octa nona deca
Fra
ctio
nal
Co
ntr
ibu
tio
n o
f H
om
olo
gu
e G
rou
p
0.0
0.2
0.4
0.6
0.8ZONE 2ZONE 3ZONE 4ZONE 5
SEDIMENTFALL
Homologue Group
di tri tetra penta hexa hepta octa nona deca
Fra
ctio
nal
Co
ntr
ibu
tio
n o
f H
om
olo
gu
e G
rou
p
0.0
0.2
0.4
0.6
0.8ZONE 2ZONE 3ZONE 4ZONE 5
SEDIMENTSPRING
Figure 3.9. Fractional contribution of PCB homologue groups in sediment collected from the Delaware River estuary in Fall 2001 and Spring 2002.

46
(Figure 3.9). This increase in specific PCB congeners may be a factor of spatial
heterogeneity of PCB contaminants in the river, influenced by a point source of
contamination in the river.
Original commercial Aroclor mixtures, produced by the Monsanto Corporation,
St. Louis, MO, have an extremely small contributions of nona and deca-chlorobiphenyl
congeners (Anderson 1991; Frame et al. 1996). This pattern is not consistent with
profiles in the Delaware River. In systems dominated by Aroclor 1268 contamination,
the congener composition is predominately octa-chlorobiphenyls followed by hexa-,
hepta-, and nona-chlorinated biphenyl groups. (Kannan et al. 1997; Maruya and Lee
1998). The high concentration of deca-chlorobiphenyl in the lower Delaware River
estuary indicates a potential source of highly chlorinated biphenyls.
PCA Analysis: To explore PCB congener patterns among biota, principal
component analysis (PCA) was performed. PCA effectively separates white perch from
channel catfish, prey fish, and invertebrates (Figure 3.10). Congeners 66+95, 110+77,
193, and 163+138 drive PC 1 that accounts for 37% of variability. PC 2 accounts for
15% of variability and is driven by 82+151 and 56,60/92,84. White perch clearly
separate out from channel catfish and respective prey items. Using eigenvalues from PC
2 for ANOVA (P<0.05) to look at species comparisons based on PCB congener pattern,
all species patterns differ significantly except for those of white perch and invertebrates.
This may be attributed to the fact the white perch’s diet is mainly comprised of
invertebrates. PC 1 shows a significant zone effect, with zone 5 differing significantly

47
Figure 3.10. Principal Component Analysis results from biota collected from the Delaware River estuary, [Number indicates Zone, CC=channel catfish (Ictalurus punctatus);WP=white perch (Morone americana); PF=prey fish; IN=invertebrates; F indicates fall collection; S indicates spring collection].
Principal Component 1 (37% Variability)
-100 -50 0 50 100 150 200
Pri
nci
pal
Co
mp
on
ent
2 (1
5% V
aria
bili
ty)
-60
-40
-20
0
20
40
60
2CCF
3CCF
4CCF5CCF
2CCS
3CCS
4CCS
5CCS
3SFF4SFF
5SFF
2INF
3INF
4INF
5INF
2SFS
3SFS
4SFS
5SFS
2INS
3INS
4INS
5INS
2WPF3WPF
4WPF5WPF
2WPS
3WPS4WPS
5WPS

48
from all other zones. To further investigate zonal differences, a of white perch samples, a
separation by zone is more easily discernable. PC 1 is separate principal component
analysis was performed excluding white perch congener profiles (Figure 3.11). With the
removal the driving factor accounting for 47% of variability with 66+95, 89, 193, and
110+77 as dominant congeners. This indicates congener patterns vary spatially rather
than by species. With the removal of white perch, the remaining groups are in close
proximity to a common benthic environment for extended periods of time and these
localized PCB concentrations affect contaminant burdens and congener patterns.
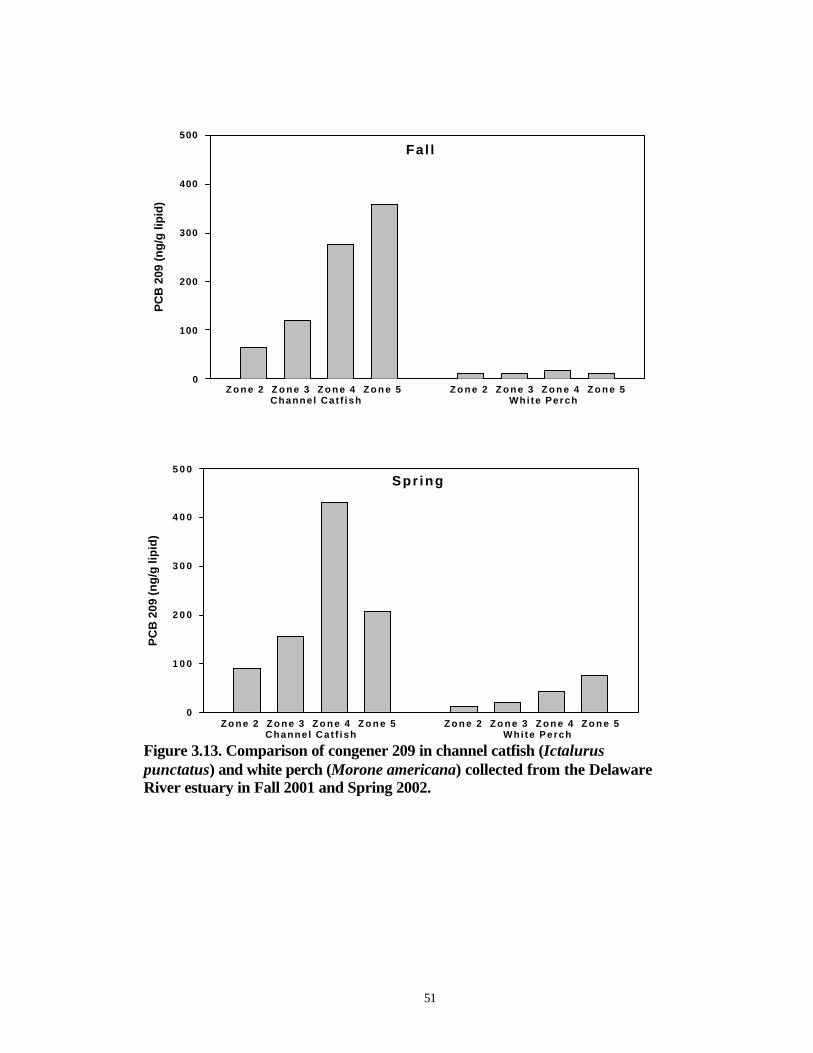
Congener tracers: Elevated levels of deca-chlorinated biphenyl congeners are observed
in all biota samples (Figure 3.12), but the magnitude of accumulation varies among
species. For that reason, congener 209 may act as a unique indicator of transfer and
accumulation in the lower Delaware River estuary. Habitat exposure and ingestion of
contaminated prey may affect a predator’s contaminant congener pattern (Lake et al.
1995). Channel catfish and white perch are demersal predators with differing feeding and
migration patterns. As benthic omnivores, channel catfish have closer contact with
localized contaminated sediments whereas white perch migrate throughout the estuary
(Dove and Nyman 1995). DiPinto and Coull (1997) found that bottom feeding fish,
which were closely coupled with sediment, displayed increased accumulation of PCBs.
The bioturbation and ingestion of sediment by the channel catfish could lead to a higher
proportion of hydrophobic PCBs. Figure 3.13 shows the percent contribution of PCB
209, which increases downstream for channel catfish while it remains relatively
consistent throughout the zones for white perch. The high octanol/water partition

49
Principal Component 1 (47% Variability)
-150 -100 -50 0 50 100
Pri
nci
pal
Co
mp
on
ent
2 (1
9% V
aria
bili
ty)
-100
-80
-60
-40
-20
0
20
40
60
2CCF
3CCF
4CCF
5CCF
2CCS
3CCS
4CCS
5CCS3PFF4PFF5PFF
2INF
3INF
4INF
5INF
2PFS
3PFS
4PFS5PFS
2INS 3INS4INS
5INS
Figure 3.11. Principal Component Analysis results from biota collected from the Delaware River estuary excluding white perch. [Number indicates Zone, CC=channel catfish (Ictalurus punctatus); PF=prey fish; IN=invertebrates; F indicates fall collection; S indicates spring collection].

50
ZONE2 3 4 5
Fra
ctio
nal
Co
ntr
ibu
tio
n o
f Co
ng
ener
209
0.00
0.02
0.04
0.06
0.08
0.10
0.12
0.14 SedimentInvertebratesPrey FishWhite PerchChannel Catfish
FALL
ZONE2 3 4 5
Fra
ctio
nal
Co
ntr
ibu
tio
n o
f C
on
gen
er 2
09
0.00
0.02
0.04
0.06
0.08
0.10
0.12
0.14 Sediment Invertebrates Prey Fish White Perch Channel Catfish
SPRING
Figure 3.12. Comparison of fractional contribution of congener 209 in biota collected from the Delaware River estuary in Fall 2001 and Spring 2002.
51
Spr ing
PC
B 2
09 (n
g/g
lip
id)
0
1 0 0
2 0 0
3 0 0
4 0 0
5 0 0
Z o n e 2 Z o n e 3 Z o n e 4 Z o n e 5 Z o n e 2 Z o n e 3 Z o n e 4 Z o n e 5Channe l Cat f ish Whi te Perch
Fal lP
CB
209
(n
g/g
lip
id)
0
100
200
300
400
500
Z o n e 2 Z o n e 3 Z o n e 4 Z o n e 5 Z o n e 2 Z o n e 3 Z o n e 4 Z o n e 5Channe l Cat f ish Whi te Perch
Figure 3.13. Comparison of congener 209 in channel catfish (Ictalurus punctatus) and white perch (Morone americana) collected from the Delaware River estuary in Fall 2001 and Spring 2002.

52
coefficient [log Kow] >8.18-9.60 for congener 209 (Woodburn et al. 1984; Hawker and
Connell 1988) indicates close association with sediments as highly chlorinated biphenyls
are extremely hydrophobic and have greater adsorption to particles. Previous studies
have shown lower assimilation efficiency of highly chlorinated, hydrophobic PCBs
through the food web (Gobas et al. 1988; Fisk et al. 1998). Maruya and Lee (1998)
reported a negative linear relationship between biota sediment accumulation factor
(BSAF) and log Kow for extremely hydrophobic PCBs.
Life histories and feeding patterns for channel catfish and white perch dictate
magnitude of accumulation as well as congener pattern of PCB contaminants. The
congener profiles of sediment and biota point to increased exposure of highly chlorinated
biphenyls due to enrichment of octa-, nona-, and deca-chlorinated biphenyl groups in the
lower Delaware River.
Conclusions
PCB concentrations vary spatially in the Delaware River estuary, with increased
contaminant levels downstream of Philadelphia, PA and Camden, NJ. This industrialized
portion of the estuary has had continued high contaminant loadings as previously detailed
by the Delaware River Basin Commission (1998). One report on PCB loadings from
tributaries and point sources discharge cited wastewater treatment plants and combined
sewer overflows as significant sources. The Commission recommended conducting
monitoring at municipal and industrial point sources at both dry and wet weather periods
(1998). PCBs pose a current threat to the ecosystem from improperly disposed electrical
equipment, as well as discharge from public works and industrial facilities. Current

53
efforts to model PCB fate and transport within the estuary focus on processes of external
loading, internal transport and transfer within food webs.
In addition to the spatial variability of PCB concentration, congener patterns
showed increased presence of highly chlorinated congeners, specifically nona- and deca-
polychlorinated biphenyls in Zone 4 and 5 for all sediment and biota samples. This trend
indicates the presence of a non-Aroclor source of PCB contamination to the Delaware
River.
While elevated levels of extremely hydrophobic biphenyls are seen throughout the
food web, contrasting life history and migratory patterns result in varying accumulation
of PCB congeners. Organisms closely associated with contaminated sediment have
greater accumulation of hydrophobic PCB congeners than do migratory species such as
white perch. These distinctions should be addressed when modeling the transfer of
contaminants in an estuarine system such as the Delaware River.

54
Chapter Four
MECHANISMS OF BIOACCUMULATION AND TROPHIC TRANSFER OF POLYCHLORINATED BIPHENYL CONGENERS
Introduction
Although banned in the 1970’s, polychlorinated biphenyls (PCBs) persist in
aquatic ecosystems, causing concern for human and environmental health. The
Environmental Protection Agency (EPA) has placed various advisories on the
consumption of fish based on their accumulation of these hydrophobic organic
contaminants (HOCs). To address ecological and human health risks, PCB
concentrations must be accurately described and models developed to quantify PCB
transfer from abiotic to biotic components.
Modeling the movement of hydrophobic organic contaminants such as PCBs
through an estuary requires extensive information on the physical, chemical and
biological parameters of the estuary. Bioconcentration factors (BCFs), biota-sediment
accumulation factors (BSAFs), and trophic transfer factors (TTFs) are often used to
quantify bioaccumulation to set criteria for health advisories (Thomann 1989; Maruya
and Lee 1998; Mackay and Fraser 2000). Chemical exchange across abiotic-biotic
interfaces is governed by several parameters, such as the octanol-water partition
coefficient (Kow), chemical bioavailability, and toxicokinetics. (Hawker and Connell
1988; Thomann 1989; Thomann et al. 1992; Mackay and Fraser 2000; van der Oost et al.
2003). Intra and inter-biotic contaminant transfers involving efficiency of uptake,
elimination, and metabolism also vary as a function of physiochemical properties (Gobas
et al. 1988; Sijm et al. 1992). Parameters such as Kow are used to determine the

55
movement of PCBs in food webs. In the Delaware River estuary, modeling PCB
dynamics using a simplified food web should utilize top predators such as white perch
(Morone americana) and channel catfish (Ictalurus punctatus), their respective prey
items of fish and invertebrates, as well as sediment and water. By modeling
contaminants, we may accurately represent PCB concentrations in the estuary, which
enhances predictive capabilities and further supports regulatory efforts.
Currently three states bordering the Delaware River estuary have issued fish
consumption advisories due to elevated PCB levels. Regulating contaminants in higher
trophic levels to protect human and wildlife health by setting criteria based on water and
sediment contamination levels requires that the relationships between PCB levels in the
abiotic and biotic compartments be known. As part of the Clean Water Act, Section
303(d), the Environmental Protection Agency (EPA) requires states to establish Total
Maximum Daily Loads (TMDLs), which provide the basis for states to set water quality-
based controls in order to meet acceptable water quality standards. Lacking site-specific
data, water quality criteria are set using national averages of water and biota information.
To improve this assessment and focus in on the area of concern, site-specific values for
the Delaware River estuary may be applied to water and sediment quality criteria. In
doing so, we may explore the feasibility of applying water and sediment quality criteria
values to an estuarine system with great temporal, spatial, and chemical variability.
An urbanized waterway with varying contaminant concentrations, the Delaware
River estuary serves as a model to explore partitioning of PCBs from abiotic to biotic
compartments. Using PCB values in water, sediment and biota, we investigated the

56
transfer of contaminants over spatial and chemical concentration gradients. In doing so,
we may:
(1) Evaluate relationships among abiotic and biotic compartments used in modeling
PCB accumulation
(2) Compare PCB contaminant levels in fish measured in the Delaware to those
predicted by the EPA national guidelines.
Results and Discussion
BCFs
Individual congener BCFs (bioconcentration factors) were calculated using the
ratio of PCB content in tissue normalized to lipid, CB, to the dissolved PCB concentration
in the water, CWT . The units for biota samples of mg/kg lipid divided by mg/L in water
samples gives the BCF units of L/kg (Mackay and Fraser 2000).
BCF= CB/CWD (1)
The BCF for total PCBs is calculated using the congeners common to the fish
tissue and water analysis.
Total BCF = ∑ (congener specific CB)/ ∑ (congener specific CWD) (2)
Bioconcentration factors increased with Kow for all biota samples (Figures 4.1-
4.4). The average log BCF for total PCBs was similar throughout the estuary for all biota
groups (Table 4.1).
Using filtrate PCB concentrations presents a source of bias as actual dissolved
concentrations may be overestimated due to the contribution of non-filterable colloids in
total dissolved PCB values, thereby underestimating the bioconcentration factor (Baker

57
and Eisenreich 1990). The contribution of the colloidal fraction to total dissolved PCBs
was calculated using:
Cd/Ct= 1/1+((Kow *DOC)/106) (3)
where DOC is the dissolved organic carbon concentration (kg carbon/ L water) in the
Delaware River. The truly dissolved phase is on average ~18% of the filtrate
concentration, resulting in a BCF underestimation. Most BCF calculations in the
literature do not correct for the colloid fraction contribution, and for that reason BCF
values presented in this paper are based on filtrate PCB concentrations.
With increasing hydrophobicity contaminants may adsorb more strongly to
particulate matter. Therefore chemicals with large octanol-water partitioning coefficients
will not be as readily bioavailable (Mackay and Fraser 2000). Regression analysis
showed a positive relationship between bioconcentration and Kow for all biota groups
(Figures 4.1-4.4), for channel catfish, white perch, prey fish, and invertebrates (P>0.001).
Although bioconcentration factors vary based on Kow, the average log BCF value
for biota throughout the study area remains relatively constant, indicating it is possible to
apply a universal log BCF value of 7 to the Delaware system.

58
Channel Catfish
Log Kow
4 5 6 7 8 9
BC
F
1e+3
1e+4
1e+5
1e+6
1e+7
1e+8
1e+9
1e+10
Figure 4.1. Bioconcentration factors (BCF) vs. log Kow for individual PCB congeners in channel catfish collected from the Delaware River estuary, USA in Fall 2001 and Spring 2002. Regression analysis of BCF values vs. log Kow values gave a linear regression of log BCF = 0.34*log Kow + 4.81 (R = 0.49, P<0.0001). �=Zone 2, �=Zone 3, q=Zone 4,s=Zone 5.

59
White Perch
Log Kow
4 5 6 7 8 9
BC
F
1e+3
1e+4
1e+5
1e+6
1e+7
1e+8
1e+9
1e+10
Figure 4.2. Bioconcentration factors (BCF) vs. log Kow for individual PCB congeners in white perch collected from the Delaware River estuary, USA in Fall 2001 and Spring 2002. Regression analysis of BCF values vs. log Kow values gave a linear regression of log BCF = 0.25*log Kow + 5.24 (R = 0.35, P<0.0001). �=Zone 2, �=Zone 3, q=Zone 4,s=Zone 5.

60
Prey Fish
Log Kow
4 5 6 7 8 9
BC
F
1e+3
1e+4
1e+5
1e+6
1e+7
1e+8
1e+9
1e+10
Figure 4.3. Bioconcentration factors (BCF) vs. log Kow for individual PCB congeners in prey fish collected from the Delaware River estuary, USA in Fall 2001 and Spring 2002. Regression analysis of BCF values vs. log Kow values gave a PCB linear regression of log BCF = 0.31*log Kow + 4.88 (R = 0.44, P<0.0001). �=Zone 2, �=Zone 3, q=Zone 4,s=Zone 5.

61
Invertebrates
Log Kow
4 5 6 7 8 9
BC
F
1e+3
1e+4
1e+5
1e+6
1e+7
1e+8
1e+9
1e+10
Figure 4.4. Bioconcentration factors (BCF) vs. log Kow for individual PCB congeners in invertebrates collected from the Delaware River estuary, USA in Fall 2001 and Spring 2002. Regression analysis of BCF values vs. log Kow values a PCB linear regression of log BCF = 0.14*log Kow + 5.92 (R = 0.20, P=0.0001). �=Zone 2, �=Zone 3, q=Zone 4,s=Zone 5.

62
Organism Total BCF
Total Log BCF
Average Log BCF±SD
Total BSAF
Average BSAF±SD
Channel Catfish
Fall Zone 2 10,700,000 7.0 7.0 ± 0.1 6.5 6.3 ± 3.1
Zone 3 9,900,000 7.0 5.6
Zone 4 12,000,000 7.1 9.2
Zone 5 17,000,000 7.2 2.1
Spring Zone 2 8,500,000 6.9 10.0 Zone 3 10,900,000 7.0 5.2
Zone 4 11,900,000 7.1 2.2
Zone 5 9,800,000 7.0 9.4
White Perch
Fall Zone 2 10,300,000 6.9 7.0 ± 0.2 6.2 6.1 ± 5.0
Zone 3 8,200,000 6.8 4.6
Zone 4 6,700,000 6.7 5.2
Zone 5 5,000,000 6.9 0.6
Spring Zone 2 8,700,000 6.9 10.4
Zone 3 7,700,000 7.0 3.7
Zone 4 10,200,000 7.2 1.9
Zone 5 17,000,000 7.2 16.2
Prey Fish
Fall Zone 2 NS 7.0 ± 0.2 NS 5.3 ± 3.0
Zone 3 10,200,000 7.0 5.8
Zone 4 12,700,000 7.1 9.8
Zone 5 7,500,000 6.9 0.9
Spring Zone 2 3,700,000 6.6 4.4
Zone 3 16,000,000 7.2 7.6
Zone 4 14,200,000 7.2 2.7
Zone 5 6,000,000 6.8 5.7
Invertebrates
Fall Zone 2 6,200,000 6.8 6.9 ± 0.3 3.7 5.8 ± 5.1
Zone 3 12,200,000 7.1 6.9 Zone 4 15,200,000 7.2 11.7 Zone 5 13,000,000 7.1 1.6
Spring Zone 2 12,700,000 7.1 14.8 Zone 3 4,100,000 6.6 2.0 Zone 4 2,500,000 6.4 0.5 Zone 5 5,700,000 6.8 5.4
NS = Not Sampled
Table 4.1. Bioconcentration (BCF) factors and biota-sediment accumulation (BSAF) factors for total PCB concentrations in biota collected in the Delaware River estuary in Fall 2001 and Spring 2002. Average log BCFs and BSAFs are reported with standard deviations, SD.

63
BSAFs
Individual congener BSAFs (biota sediment accumulation factors) were calculated using
the ratio of PCB content in tissue normalized to lipid, CB, to the PCB concentration in
sediment normalized to carbon, CS, for biota samples.
BSAF= CB/CS (4)
BSAF values were calculated for zones and using biota samples compared with their
respective sediment sites for both seasons. In order to evaluate the influence of
hydrophobicity on bioaccumulation, BSAF values were plotted against log Kow and both
linear and quadratic regression analyses were performed for each group of biota, with all
zones and seasons included (Figures 4.5-4.8). The parabolic function (P<0.0001 for
channel catfish and white perch) better explained the relationship than the linear function,
indicating that the bioavailability of chlorinated biphenyls to organisms initially increased
and then decreased with increasing hydrophobicity. To address variation among trophic
level, BSAF values based on total PCBs for all species are close to the mean of species-
specific median BSAF values of 5.1 as shown in a box and whisker plot (Figure 4.9),
exhibiting similarity in BSAFs between species with comparable habitats. Previous
studies have shown that similarity in chemical exposure for benthic species may allow for
the application of sediment quality criteria for habitat groups (Tracey and Hansen 1996).
The observed trends in biota BSAF factors are similar to previously reported
declines in bioavailability with increasing Kow (Shaw and Connell 1984; Tracey and
Hansen 1996; Maruya and Lee 1998). PCBs with Kows >7 have been shown to have
reduced bioavailability, possibly due to problems with membrane permeability or

64
Channel Catfish
Log Kow
5 6 7 8
BS
AF
0.001
0.01
0.1
1
10
100
1000
Figure 4.5. Biota-sediment accumulation factors (BSAFs) vs. log Kow for individual PCB congeners in channel catfish collected from the Delaware River estuary, USA in Fall 2001 and Spring 2002. PCB linear regression: BSAF = 1.06*log Kow + 3.23 (R = 0.08, P=0.08); PCB quadratic regression: BSAF = -2.83*log Kow
2 + 37.98*log Kow –115.22 (R = 0.20, P<0.0001). �=Fall Zone 2, �= Fall Zone 3, q= Fall Zone 4,s= Fall Zone 5, ¢=Spring Zone 2, £=Spring Zone 3,¿=Spring Zone 4, ¯=Spring Zone 5.
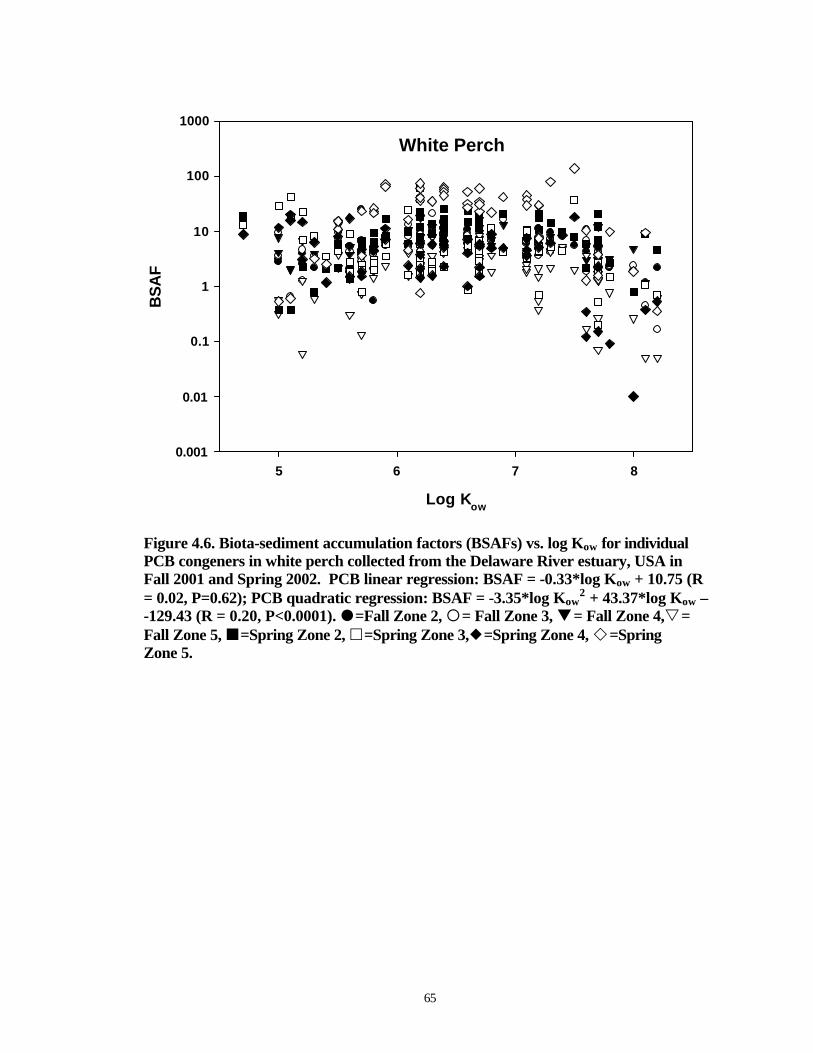
65
White Perch
Log Kow
5 6 7 8
BS
AF
0.001
0.01
0.1
1
10
100
1000
Figure 4.6. Biota-sediment accumulation factors (BSAFs) vs. log Kow for individual PCB congeners in white perch collected from the Delaware River estuary, USA in Fall 2001 and Spring 2002. PCB linear regression: BSAF = -0.33*log Kow + 10.75 (R
= 0.02, P=0.62); PCB quadratic regression: BSAF = -3.35*log Kow2 + 43.37*log Kow –
-129.43 (R = 0.20, P<0.0001). �=Fall Zone 2, �= Fall Zone 3, q= Fall Zone 4,s= Fall Zone 5, ¢=Spring Zone 2, £=Spring Zone 3,¿=Spring Zone 4, ¯=Spring Zone 5.

66
Prey Fish
Log Kow
5 6 7 8
BS
AF
0.001
0.01
0.1
1
10
100
1000
Figure 4.7. Biota-sediment accumulation factors (BSAFs) vs. log Kow for individual PCB congeners in prey fish collected from the Delaware River estuary, USA in Fall 2001 and Spring 2002. PCB linear regression: BSAF = -0.17*log Kow + 10.2 (R = 0.01, P=0.83); PCB quadratic regression: BSAF = -2.94*log Kow
2 + 38.20*log Kow –112.82 (R = 0.16, P=0.0021).�=Fall Zone 2, �= Fall Zone 3, q= Fall Zone 4,s= Fall Zone 5, ¢=Spring Zone 2, £=Spring Zone 3,¿=Spring Zone 4, ¯=Spring Zone 5.

67
Invertebrates
Log Kow
5 6 7 8
BS
AF
0.001
0.01
0.1
1
10
100
1000
Figure 4.8. Biota-sediment accumulation factors (BSAFs) vs. log Kow for individual PCB congeners in invertebrates collected from the Delaware River estuary, USA in Fall 2001 and Spring 2002. PCB linear regression: log BSAF = -0.51*log Kow + 12.01 (R = 0.03, P=0.49); PCB quadratic regression: log BSAF = -2.36*log Kow
2 + 30.32*log Kow –86.94 (R = 0.13, P=0.013). �=Fall Zone 2, �= Fall Zone 3, q= Fall Zone 4,s= Fall Zone 5, ¢=Spring Zone 2, £=Spring Zone 3,¿=Spring Zone 4, ¯=Spring Zone 5.
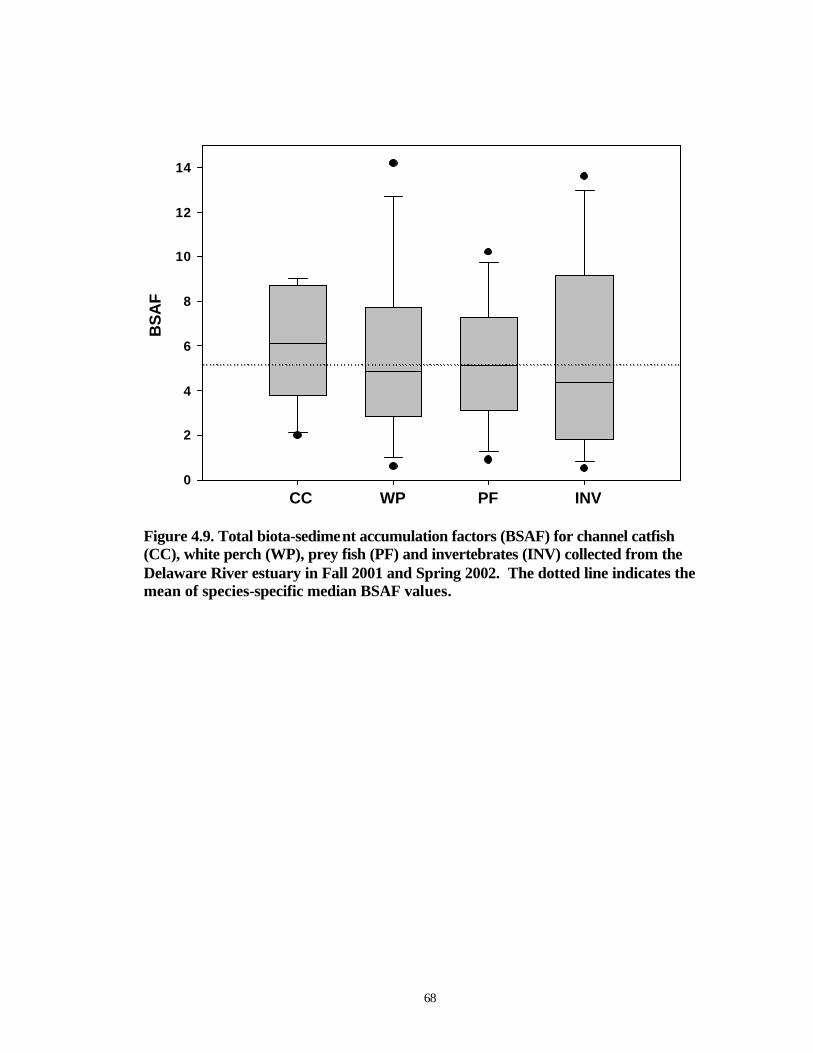
68
CC WP PF INV
BS
AF
0
2
4
6
8
10
12
14
Figure 4.9. Total biota-sediment accumulation factors (BSAF) for channel catfish (CC), white perch (WP), prey fish (PF) and invertebrates (INV) collected from the Delaware River estuary in Fall 2001 and Spring 2002. The dotted line indicates the mean of species-specific median BSAF values.

69
assimilation efficiency (Gobas et al. 1988; Tracey and Hansen 1996; Kannan et al. 1997;
Fisk et al. 1998).
Life history of an organism should be considered when grouping of species with
similar habitats. Although both species are demersal predators, channel catfish and white
perch exhibit a variation in accumulation of extremely hydrophobic PCB congeners
present in the lower zones as seen in Chapter 3. This may be due to migratory patterns as
white perch migrate throughout the estuary while channel catfish remain in a small home
range and have increased contact with the hydrophobic congeners. This is an important
consideration in systems with point sources and sharp pollutant chemical gradients.
However, we found that these variations in congener patterns do not affect the BSAF
values based on total PCBs of these benthic species.
Biota samples from urbanized estuaries have elevated concentrations of PCBs
corresponding to the highly urbanized zone 3 as shown in chapter 3. BSAFs do not vary
with PCB concentration levels (Table 4.1). Although BSAFs vary within the river, the
average BSAF is similar for all species. The spatial heterogeneity of PCB levels in
sediment from the river leads to concerns whether natural variability would adequately be
addressed using these BSAF values.
Tracey and Hansen (1996) calculated BSAF values among habitat groups from
field data with median BSAFs of 2.2 and 1.4 for the benthically-coupled species of
channel catfish and white perch respectively, which are lower than the BSAF of 5.1
found in this study. BSAF values express exposure levels from sediment. The higher
BSAF values obtained in this study, suggest that the organisms are more efficient at
bioaccumulation of PCBs, exposure is originating from some other source than sediment,

70
or that the sediment samples are not representative of the study area. The sediment sites
were randomly selected throughout each of the four zones, with little sampling occurring
in the flanks of the river, and may not adequately represent the spatial heterogeneity in
the river. Organisms may not be feeding in the channels, but possibly closer to shorelines
or in hot spots of contamination the river. Prey items such as small fish and macro
invertebrates may be accumulating high levels of contaminants from tributaries, marsh
areas, or flanks of the river then dispersing throughout the main steam of the river where
they may be preyed upon. It is also possible that organisms are not accumulating a large
proportion of contaminants from sediment, but from dissolved or particulate PCBs in the
water column or ingestion of contaminated prey items as previously mentioned.
Predator/Prey Ratios
Also known as trophic transfer factors, predator/prey ratios (PPR) are the ratio of
lipid normalized PCB content in the predator to lipid normalized PCB content in the prey
and may be used to address magnification.
PPR= [PCB] predator/[PCB] prey (5)
Food web dynamics involve multiple dietary pathways with varying
contributions, while simple predator/prey ratios address single species. Predator/prey
ratios were calculated based on available prey items and knowledge of channel catfish
and white perch diets. All organisms in this food web are benthic species; therefore they
may not be directly comparable to previous work on the kinetics of PCB transport
throughout food webs containing many trophic levels. As omnivorous feeders, the
trophic position of channel catfish is difficult to characterize (VanderZanden and

71
Rasmussen 1996), as demonstrated by gut content analysis which included a variety of
items such as algae and insects. White perch stomach contents were mainly comprised of
the invertebrate Gammarus duebeni (Horwitz et al. 2002). The simple predator/prey ratio
allows us to determine contaminant transfer on a congener level. The resulting ratios
(Figures 4.10-4.12) show no distinct variation with Kow. In addition, no consistent pattern
by season or zone was observed on a congener specific level.
The predator/prey ratio of total PCB concentrations were 1-2 for both fall and
spring channel catfish vs. prey fish and fall white perch vs. invertebrates (Table 4.2). The
predator/prey ratios for spring channel catfish and white perch vs. invertebrates were
higher due to low lipid content in spring invertebrates. Invertebrate spawning dynamics
influence lipid content, thereby altering trophic transfer ratios (Wilhelm 2002).
Our results do not support the theory of increased biomagnification with higher
trophic levels in the Delaware River estuary (Oliver and Niimi 1988; VanderZanden and
Rasmussen 1996). Little magnification occurs between trophic levels as seen with
predator/prey ratios of around 1 for both channel catfish and white perch over the range
of PCB congeners. Previous work suggested that trophic transfer ratios decrease with
increasing Kow due to reduced uptake and assimilation efficiencies of highly chlorinated
congeners (Thomann 1989; Kannan et al. 1997; Maruya and Lee 1998).

72
Channel Catfish/Prey Fish
Log Kow
4 5 6 7 8 9
Lo
g [P
CB
Pre
dat
or/P
CB
Pre
y]
(ng
/g li
pid
/ng
/g li
pid
)
0.01
0.1
1
10
100
Figure 4.10. Lipid normalized predator/prey ratios vs. log Kow for individual PCB congeners for channel catfish/prey fish collected from the Delaware River estuary, USA in Fall 2001 and Spring 2002. The line represents a 1:1 ratio, indicating no bioaccumulation of PCBs from prey to predator. �=Fall Zone 3, �= Fall Zone 4, q= Fall Zone 5,s= Spring Zone 2, ¢=Spring Zone 3, £=Spring Zone 4,¿=Spring Zone 5.
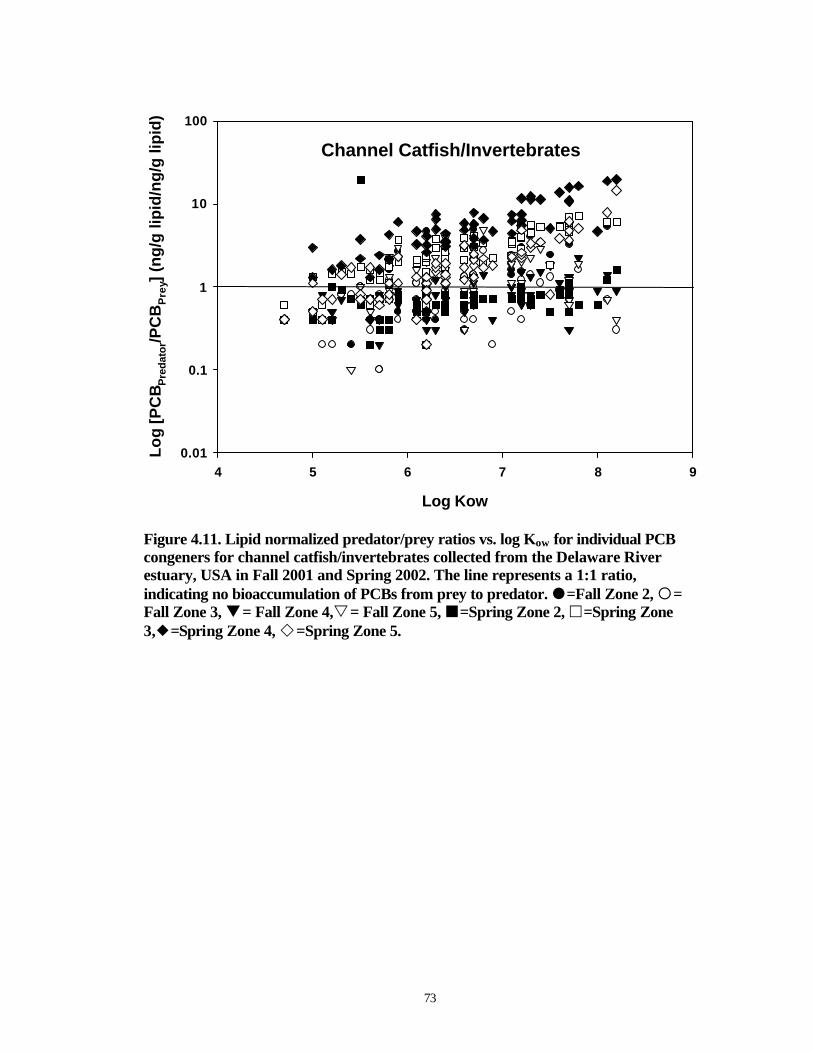
73
Channel Catfish/Invertebrates
Log Kow
4 5 6 7 8 9
Lo
g [P
CB
Pre
dat
or/P
CB
Pre
y] (
ng
/g li
pid
/ng
/g li
pid
)
0.01
0.1
1
10
100
Figure 4.11. Lipid normalized predator/prey ratios vs. log Kow for individual PCB congeners for channel catfish/invertebrates collected from the Delaware River estuary, USA in Fall 2001 and Spring 2002. The line represents a 1:1 ratio, indicating no bioaccumulation of PCBs from prey to predator. �=Fall Zone 2, �= Fall Zone 3, q= Fall Zone 4,s= Fall Zone 5, ¢=Spring Zone 2, £=Spring Zone 3,¿=Spring Zone 4, ¯=Spring Zone 5.

74
White Perch/Invertebrates
Log Kow
4 5 6 7 8 9
Lo
g [P
CB
Pre
dat
or/P
CB
Pre
y] (
ng
/g li
pid
/ng
/g li
pid
)
0.001
0.01
0.1
1
10
100
1000
Figure 4.12. Lipid normalized predator/prey ratios vs. log Kow for individual PCB congeners for white perch/invertebrates collected from the Delaware River estuary, USA in Fall 2001 and Spring 2002. The line represents a 1:1 ratio, indicating no bioaccumulation of PCBs from prey to predator. �=Fall Zone 2, �= Fall Zone 3, q= Fall Zone 4,s= Fall Zone 5, ¢=Spring Zone 2, £=Spring Zone 3,¿=Spring Zone 4, ¯=Spring Zone 5.

75
[PCB] predator/[PCB] prey Fall Spring
Channel Catfish / Prey Fish 1.9 1.3
Channel Catfish / Invertebrates 1.4 2.8
White Perch / Invertebrates 1.0 3.1
Table 4.2. Predator/Prey Ratios of lipid normalized total PCBs from biota collected in the Delaware River estuary in Fall 2001 and Spring 2002.

76
Ambient Water Quality Criteria
Limits on PCB contamination levels for a system are established in hopes of
protecting water quality for human use, and reducing overall PCB body burdens in the
food web. The following calculations are based on methodology the EPA has set forth to
derive ambient water quality criteria as required under the Clean Water Act (EPA 2000).
The first step in creating water quality criteria is determining the amount of PCBs
you may ingest daily for a given risk level. The risk specific dose is determined using
default values provided by the EPA adopting a conservative estimate of cancer risk of
10-6, meaning one additional case in a population of one million, divided by the cancer
potency factor for PCBs of 2 mg/kg-day. Using an average body weight of 70 kg for
adults, we may estimate that humans ingesting a total of 35 ng of PCBs daily will have an
additional one in one million chance of getting cancer. The calculation of water quality
criteria relies on the assumption that PCB exposure comes exclusively from dietary
intake of drinking water and consumed fish fillets. The current level of total PCB in
dissolved water is around 2000 picograms/liter, which would require consuming more
than 17.5 liters of water daily to excede the maximum ingestion of 35 ng of PCBs. Using
the EPA default value of 2 liters/day of water one would consume 4 ng of PCB daily,
leaving 31 ng allowable for consumption from fish. We can disregard the percentage of
total exposure accounted for by drinking water for now, and focus on PCB contamination
from ingested fish. A study of fish consumption patterns of Delaware recreational
fisherman and their households (DNREC 1994) determined fish intake to be 17.5
grams/day, consisting of equal portions of channel catfish (trophic level 4) and white
perch (trophic level 3). Consuming 17.5 g of fish a day with a maximum ingestion of 35

77
ng of PCBs would mean PCB levels in the fish should be 2 ng/g wet weight. This
contaminant level is well below the current PCB concentration in fish from the Delaware
River ranging from 320-1990 ng/g wet weight (Table 2.1), which is why regulators hope
to limit PCB loadings in the river to help reduce PCB body burdens in organisms.
In developing water quality criteria, we need to examine the relationship of PCB
concentration in fish and water. Although there is a difference in terminology BAFs or
bioaccumulation factors are determined using the same formula as bioconcentration
factors (BCFs), using the lipid normalized PCB concentrations in fish tissue divided by
the dissolved PCB concentration in water. The calculations are similar for this exercise,
therefore we will continue with the term BCF, whereas EPA water quality criteria uses
BAF.
Individual BCFs are calculated for each species based on trophic level. Channel
catfish are trophic level four and white perch are trophic level three. We may apply our
individual BCFs for both species using an average of the four zones to create a Delaware
specific BCF, which may also be thought of as a trophic level BCF. Applying our
Delaware Specific BCFs to determine Ambient Water Quality Criterion or AWQC
measured in mg/L:
AWQC = RSD [BW / DI + ∑ (FIi * BCFi)] (6) RSD = Risk Specific Dose in mg/kg-day (10-6/2) BW = Body Weight (default = 70 kg) DI = Drinking water intake per day (default = 2 liters) FIi = Fish intake at trophic level i (channel catfish i = 4, white perch i = 3) BCFi = Bioconcentration factor at trophic level i
There are now two Delaware specific BCFs, one for channel catfish and one for
white perch, based on total PCBs in the consumed fillet. Based on field data collected in

78
this study, the average BCFs for zones and seasons for channel catfish and white perch
are 127,000 and 169,000 respectively. As stated previously, the fish intake is 8.75 g/day
for both channel catfish and white perch. Using default values provided by the EPA for
factors such as risk specific dose, body weight, and drinking water intake, and Delaware
specific fish intake and bioconcentration factors for the AWQC calculation shown above,
we find the freshwater criteria for total PCBs to be 13.5 picograms/liter. As mentioned
previously, the average total PCB concentration in the dissolved fraction of the water is
around 2000 picograms/liter for our study area.
Ambient Water Quality Criteria proposed by the EPA has evolved significantly
since the 1980 methodology with increased information on chemical contaminants as
well as cancer and exposure assessments. Using estuarine-specific values of
bioconcentration factors, percent lipid in fish consumed fish, and accurate consumption
rates relevant for the estuary, we may determine water quality criteria for the Delaware
River (Table 4.3).
Conclusions
Modeling contaminant transfer in estuarine systems requires attention to multiple
parameters. Simplistic models based on factors such as BCFs and BSAFs may apply
blanket values to estuarine systems (Thomann 1989; Thomann et al. 1992; Morrison et al.
1996; Morrison et al. 2002). However, additional inputs of species-specific lipid content,
growth, reproduction, uptake and elimination kinetics are required with increasingly
elaborate models (Barber et al. 1991; Sijm et al. 1992). Factors such as consumption and
such as PCBs readily partition into organisms lipid compartments, consequently

79
Parameter Cancer Potency Factor
BCF/BAF % Lipid of Consumed
Fish
Consumption Rate
(grams/day)
Basis for Rate of
Consumption
Freshwater Criteria
(picograms/liter) Total PCBs 7.70e+00 31200 3.0 6.5 Old default
value 44.4
Total PCBs 2.00e+00 169,000 b 127,000 c
3.8b 4.0c
17.5 (50% for
level 3 & 4)
Estuary-Specific
Data
13.5
Table 4.3. Ambient Water Quality Criteria for the Delaware River Estuary for Total PCBs a-BCF from 1980 Ambient Water Quality Criteria document, b-BAF for trophic level 4 c- BAF for trophic level 3.

80
changes in lipid content affect contaminant levels (Thomann 1989). Considerations of
seasonal variations are applicable to lower trophic species such as invertebrates that
follow boom and bust dynamics and varying lipid contents have great impact on lipid
normalized contaminant concentrations (Gardner et al. 1985). Higher trophic levels do
not follow such extreme fluctuation in lipid content although seasonal spawning does
affect lipid reserves (Larsson et al. 1993).
The approach taken in this study predicts median behavior for contaminants in a
system with broad temporal and spatial variability. These values provide a general look
at PCB contamination in the estuary and do not address the individual variability
associated with sediment and biota samples collected from the river. Removing the
variability associated with an organism’s seasonal and lipid fluctuation does not fully
address variation in PCB contamination within a species. PCB contaminant values
determined from this study may be used to establish water and sediment quality criteria,
setting a goal for acceptable contaminant levels. By reducing loadings in the river, PCB
body burdens in recreational and commercial fisheries should decrease thereby protecting
human and wildlife endpoints from adverse chemical effects. Using median values allows
for a wider range surrounding the acceptable contaminant levels.
Using a universal BCF or BSAF value to calculate allowable PCB concentrations
in water and sediment gives flexibility in an estuarine system and allows for general
applications. Trends in the river may be dampened, possibly leading to a large margin of
error. Underestimating bioconcentration factors results in a higher concentration
threshold for water quality criteria. Subsequently, this would allow for higher PCB
concentrations in biotic compartments. The bioconcentration factors and biota-sediment

81
accumulation factors determined for the Delaware River estuary are higher than reported
in other systems.
The level of complexity for modeling PCB contamination depends on the
application of such models and the accuracy desired. With a contamination gradient, the
efficiency of transport remains consistent throughout the estuary. The observed
bioaccumulation does not vary considerably. Using generalized sediment and water PCB
concentrations from a site in the river, we may broadly predict contaminant burdens in
localized fish populations.
82
APPENDIX A: SAMPLE COLLECTION
A-1. Location of Biota and Sediment Collections for Fall 2001 A-2. Location of Biota and Sediment Collections for Spring 2002 A-3. Summary of Channel Catfish Samples from Fall 2001 Collections/Analyses A-4. Summary of Channel Catfish Samples from Spring 2002 Collections/Analyses A-5. Summary of White Perch Samples from Fall 2001 Collections/Analyses A-6. Summary of White Perch Samples from Spring 2002 Collections/Analyses A-7. Summary of Prey Fish from Fall 2001 Collections/Analyses A-8. Summary of Prey Fish from Spring 2002 Collections/Analyses A-9. Summary of Invertebrate Samples from Fall 2001 Collections/Analyses A-10. Summary of Invertebrate Samples from Spring 2002 Collections/Analyses A-11. Summary of Sediment Samples from Fall 2001 Collections/Analyses A-12. Summary of Sediment Samples from Spring 2002 Collections/Analyses

83
A-1. Location of Biota and Sediment Collections for Fall 2001
Sample Site ID STUDY START START Date Time Latitude Longitude
Sediment Collection
Zone 2 02 SED1 CORE 40.10387 74.83698 11/7/2001 1:53:00
Zone 3 03 SED1 CORE 39.96467 75.09897 11/7/2001 7:55:00
Zone 4 04 SED1 CORE 39.84375 75.28223 11/6/2001 2:17:00 04 SED2 CORE 39.86788 75.20395 11/6/2001 3:00:00 04 CC CC Var 39.85238 75.31213 11/6/2001 12:48:09
Zone 5 05 SED1 CORE 39.58208 75.54306 11/6/2001 10:00:00 05 SED2 CORE 39.68438 75.52755 11/6/2001 11:24:31 05 SED3 CORE 39.75000 75.48330 11/8/2001 ~1:30:00 05 Var1 Variability 39.77995 75.46597 11/9/2001 9:51:00 05 Var2 Variability 39.77687 75.46367 11/9/2001 10:06:00 05 Var3 Variability 39.77574 75.46095 11/9/2001 10:16:00 05 Var4 Variability 39.77487 75.45829 11/9/2001 10:23:00
Biota Collection
Zone 2 02 CC2 CORE 40.0388 74.9881 11/8/2001 7:30:00 02 CC2 CORE/CC 40.0399 74.9880 11/8/2001 7:54:00
Zone 3 03 SED1 CORE 39.5799 75.0697 11/9/2001 6:06:00 03 SED2 CORE 40.0005 75.0556 11/9/2001 6:47:00
Zone 4 04 SED1 CORE 39.8511 75.3016 11/8/2001 3:24:00 04 SED2 CORE 39.8514 75.3018 11/8/2001 3:36:00 04 CC CC Var 39.8509 75.3005 11/8/2001 3:40:00
Zone 5 05 CC CORE/WP Var1 39.6054 75.5773 11/8/2001 12:03:00 05 SED2 CC Var 39.6700 75.5334 11/8/2001 12:42:00 05 SED3 WP Var2 39.7516 75.4778 11/8/2001 1:36:00
05 SED4 WP Var3 39.7854 75.4538 11/8/2001 2:17:18

84
A-2. Location of Biota and Sediment Collections for Spring 2002
Sample Site ID STUDY START START Date Time Latitude Longitude Sediment Collection Zone 2 02 CC CC 40.04087 74.97816 3/19/2002 14:05 02 Sed 1 Core 40.10405 74.83773 3/19/2002 15:02 02 Sed3 Core/Var 40.15044 74.72394 3/19/2002 16:01 02 Var2 Var 40.08987 74.43357 3/19/2002 02 Var3 Var 40.14875 74.72126 3/19/2002 02 Var4 Var 40.14738 74.72089 3/19/2002
Zone 3 03 Sed1 Core 39.96407 75.09901 3/19/2002 10:30 03 Sed2 Core 39.99409 75.05546 3/19/2002 11:27
Zone 4 04 Sed1 Core 39.84375 75.28223 3/18/2002 15:36 04 Sed2 Core 39.86788 75.20395 3/18/2002 16:05 04 CC CC 39.85238 75.31213 3/18/2002
Zone 5 05 Sed1 CC 39.5440 75.54165 3/18/2002 11:52 05 Sed2 Core 39.6700 75.5334 3/18/2002 13:08 05 Sed2 amphipod Core 39.6888 75.52169 3/18/2002 13:20 05 Sed3 Core 39.7537 75.4673 3/18/2002 14:11
Biota Collection
Zone 3
03 SED1 CORE 39.9649 75.1164 3/20/2002 7:03
03 SED2 CORE 40.0000 75.0576 3/20/2002 8:06
Zone 4
04 SED1 CORE 39.8499 75.2748 3/20/2002 11:11
04 SED2 CORE 39.8662 75.2118 3/20/2002 10:30
04 CC CC 39.8555 75.3087 3/20/2002 12:19/18:28
Zone 5
05 SED1 CC 39.5839 75.5532 3/20/2002 14:43/15:23
05 SED2 CORE 39.6824 75.5259 3/20/2002 16:50
05 SED3 CORE 39.7472 75.4780 3/20/2002 17:16
Additional Sampling Trips
Zone 2
2CC CC 40.04 74.97 4/3/2002
2Sed1 Core 40.1 74.84 4/2/2002
2Sed3 Core 40.1 74.84 4/2/2002
2Sed4 Core 40.15 74.72 4/2/2002
2Sed1 Core 40.15 74.16 5/21/2002

85
A-3. Summary of Channel Catfish Samples from Fall 2001 Collections/Analyses
Sample ID Sex Age Length (cm) Weight (g) Fillet Whole (g) Fillet (g) Whole
Remains (g)
Zone 2
110801 02 CC2 CC1 F 9 44.2 761 92.2 69.44 668.8
110801 02 CC2 CC2 F gravid 19 44.8 799.2 109.24 80.23 689.96
*02 CC2 CC3 M 9 40.3 524.2 75.7 25.01 448.5
*02 CC2 CC4 M 11 49.2 1020.4 124.71 25.01 895.69
*02 CC2 CC5 F 13 47.4 863.4 122.53 24.99 740.87
*02 CC2 CC6 F 10 60.2 2170.2 314.71 24.99 1855.49
*Second sampling trip Average 12 1023.07 139.85 883.22
Zone 3 110901 03 Sed1 CC1 M 9 38.2 475.05 58.84 55.65 416.21 110901 03 Sed1 CC2 M 9 38 448.75 55.98 57.68 392.26 110901 03 Sed1 CC3 M 10 46.2 907.9 100.99 57.67 807.3 110901 03 Sed2 CC1 M 8 47.1 892.42 124.52 57.38 767.9 110901 03 Sed2 CC2 M 8 44.5 801.26 127.26 57.75 674 110901 03 Sed2 CC3 M 9 38.4 476.42 58.04 57.72 418.38
110901 03 Core CCF Average 9 666.97 87.61 579.34
110901 03 Core CCR
Zone 4 110801 04 Sed 1 CC1 F 8 37.5 406.54 52.24 34.99 200.02 110801 04 Sed 2 CC1 M 5 35.7 292.81 36.9 35.02 199.55 110801 04 Sed2 CC2 Discarded 110801 04 Sed2 CC3 F 5 34.3 282.14 36.53 35.01 199.23 110801 04 Sed2 CC4 F 5 35.8 358.39 45.72 35.03 199.8 110801 04 Sed2 CC5 M 7 40.6 500.24 63.75 34.99 201.23
110801 04 Core CCF Average 6 368.02 47.03 199.97
110801 04 Core CCR
Variability
110801 04 CC CC1 M 8 33.7 601.9 15
110801 04 CC CC2 M 7 38.8 597.7 14.99
110801 04 CC CC3 M 7 35.3 484.7 15
110801 04 CC CC4 F 5 36 427.5 15.01
110801 04 CC CC5 M 3 26.7 359.7 15.01
110801 04 CC CC1-5F Average 6 71.36
Zone 5 110801 05 CC5 CC1 F 4 33.8 291.07 37.41 35.03 235.98 110801 05 CC5 CC2 F 8 41.7 579.23 79.27 34.97 479.89 110801 05 CC5 CC3 M 9 52 1410.17 146.44 35.02 1151.09 110801 05 CC5 CC4 M 5 40.8 535.62 67.37 35.03 453.48 110801 05 CC5 CC5 F 7 36.6 366.06 40.05 35.03 327.94
110801 05 Core CCF Average 7 636.43 74.11 529.68
110801 05 Core CCR
Variability
110801 05 Sed2 CC1 F 6 40.5 500.76 63.97 19.96
110801 05 Sed2 CC2 M 5 41.9 569.79 68.98 19.97
110801 05 Sed2 CC3 M 8 47.7 963.1 130.16 19.91
110801 05 Sed2 CC4 F 7 39.7 537.63 66.28 19.91
110801 05 Sed2 CC5 F 5 29.5 184.82 45.85 19.98
110801 05 Sed2 CC1-5F Average 6 66.45

86
A-4. Summary of Channel Catfish Samples from Spring 2002 Collections/Analyses
Sample ID Sex Age Length (cm) Weight (g) Fillet Whole
(g) Fillet (g) Whole
Remains (g) Zone 2 040202 02 CC1 M? 9 48.9 995.4 138.97 ~120 856.43 040202 02 CC2 M 12 51.9 1535.5 188.8 ~120 1346.7 040402 02 CC3 M 10 53.5 1375.9 151.28 ~120 1224.62 040402 02 CC4 M 10 52.5 1439.6 182.94 ~120 1256.66 040402 02 CC5 F gravid 11 55.2 1728 230.53 ~120 1497.47 040402 02 Core CCF Average 10.4 1414.88 178.50 1236.38 040402 02 Core CCR Catfish Variability 040302 02 CC1 F gravid 10 47 1132.5 112.13 29.98 040302 02 CC2 M 9 47.4 977.2 116.52 30.02 040302 02 CC3 M 9 48 952 137.98 30.07 040302 02 CC4 F 9 45.8 902.9 137.16 29.99 040302 02 CC5 M 14 51.4 1190.3 117.85 30.05 040302 02 CC6 M 7 41.9 621.7 149.27* 29.99 040302 CC1-6F * 2 fillets Zone 3 032002 03 CC1 M 8 40.5 590.85 78.99 40.02 511.86 032002 03 CC2 M 9 52.1 1505.50 222.87 40.00 1282.63 032002 03 CC3 F 10 43.7 738.80 57.65 40.05 681.15 032002 03 CC4 M 8 44.9 801.10 46.10 40.03 755.00 032002 03 CC5 M 7 40.2 526.85 73.26 40.01 453.59 032002 03 Core CCF Average 8 832.62 95.77 736.85 032002 03 Core CCR Zone 4 032002 04 CC1 F gravid 8 409 642.70 57.70 30.02 585.00 032002 04 CC2 F 6 384 441.56 47.91 30.04 393.65 032002 04 CC6 F gravid 6 353 392.53 42.32 30.03 350.21 032002 04 CC7 M 8 350 361.68 42.06 29.98 319.62 032002 04 CC8 M 8 340 328.30 33.15 30.02 295.15 032002 04 Core CCF Average 7 433.35 44.63 388.73 032002 04 Core CCR Catfish Variability 032002 04 CC1 M 7 385 419.80 40.88 10.03 032002 04 CC2 M 8 375 400.86 42.18 10.04 032002 04 CC3 M 11 338 336.99 35.55 9.99 032002 04 CC4 F 10 362 393.81 35.18 10.03 032002 04 CC5 F 9 365 376.27 31.73 10.00 032002 04 CC1-5F 46.90 Zone 5 032002 05 CC1 F 11 41.5 624.7 58.97 38.78 565.73 032002 05 CC2 F 8 40.5 528.27 50.88 38.47 477.39 032002 05 CC3 F 9 48 1021.6 92.54 38.54 929.06 032002 05 CC4 F 8 41.5 627.1 46.77 38.04 580.33 032002 05 CC5 F 7 38.5 470.46 38.89 38.89 431.57 032002 05 Core CCF Average 9 654.43 57.61 596.82 032002 05 Core CCR Catfish Variability 032002 05 CC1 F 6 385 472.09 56.26 10.03 032002 05 CC2 M 6 360 357.38 49.68 10.02 032002 05 CC3 F 7 387 589.47 54.30 9.99 032002 05 CC4 M 4 275 174.76 20.52 9.98 032002 05 CC5 M 8 390 513.33 56.72 9.98 032002 05 CC1-5F 50.00

87
A-5. Summary of White Perch Samples from Fall 2001 Collections/Analyses Sample ID Sex Age Length (cm) Weight (g)
Fillet Whole (g) Fillet (g)
Whole Remains (g)
Zone 2 110801 02 CC2 WP1 F gravid 6 21.9 171.3 32.39 15.01 138.91 110801 02 CC2 WP2 F gravid 5 19.9 102.7 20.01 14.98 82.69 110801 02 CC2 WP3 Discarded 51.86 51.86 110801 02 CC2 WP4 M ripe 5 18.1 93.26 18.96 15.02 74.3 110801 02 CC2 WP5 M ripe 9 21.2 137.66 27.78 15.01 109.88 110801 02 CC2 WP6 M ripe 5 17.4 79.9 15.61 15.03 64.29 110801 02 CC2 WP7 Discarded 110801 02 CC2 WP8 M ripe 5 18.7 96.23 19.95 14.97 76.28 110801 02 Core WPF Average 6 104.70 22.45 85.46 110801 02 Core WPR Zone 3 110801 03 Sed1 WP1 M 2 16.5 66.66 12.93 10.82 51.57 110801 03 Sed1 WP3 F 3 16.9 65.51 13.84 10.34 50.89 110801 03 Sed1 WP4 M 3 16.6 69.92 13.97 10.68 53.93 110801 03 Sed1 WP5 M 5 18 84.64 18.07 10.78 63.55 110801 03 Sed1 WP6 M 3 16 53.53 10.6 10.6 40.18 110801 03 Sed1 WP2* F 6 23.4 203.62 38.86 37.78 158.57 110801 03 Core WPF Average 3 68.05 13.88 52.02 110801 03 Core WPR Zone 4 110801 04 Sed 1 WP1 F (gravid) 3 18.4 88.75 17.13 10.99 71.62 110801 04 Sed 1 WP2 F 4 17.3 65.74 14.24 10.99 51.5 110801 04 Sed 1 WP3 F 4 17.6 76.98 17.05 10.97 59.93 110801 04 Sed 1 WP4 F 3 15.9 51.66 11.45 11.01 40.21 110801 04 Sed 2 WP1 F (gravid) 3 18 75.13 15.52 10.97 59.61 110801 04 Sed 2 WP2 F 3 16.5 59.74 12.59 11.03 47.15 110801 04 Core WPF Average 3 69.67 14.66 55.00 110801 04 Core WPR Zone 5 110801 05 CC5 WP1 M ripe 6 22.3 161.38 33.61 15 90.41 110801 05 CC5 WP2 M ripe 3 18.6 92.93 18.9 15.01 52.26 110801 05 CC5 WP3 F gravid 7 20.2 129.27 26.22 15.02 71.96 110801 05 CC5 WP4 M ripe 6 19.9 125.26 25.72 15.02 68.3 110801 05 CC5 WP5 M ripe 6 19 100.89 19.72 14.99 55.78 110801 05 Core/Var WPF Average 6 121.95 24.83 67.74 110801 05 Core WPR Variability Study 110801 05 CC5 WP1 M ripe 6 22.3 161.38 31.11 29 110801 05 CC5 WP2 M ripe 3 18.6 92.93 19.82 17.62 110801 05 CC5 WP3 F gravid 7 20.2 129.27 24.55 21.55 110801 05 CC5 WP4 M ripe 6 19.9 125.26 24.45 21.27 110801 05 CC5 WP5 M ripe 6 19 100.89 20.61 17.97 110801 05 Var2 WP1 M 4 18.5 84.27 34.55 5.03 110801 05 Var2 WP2 F 3 17.9 75.03 32.22 5.01 110801 05 Var2 WP3 F 2 16.2 55.79 25.97 5.01 110801 05 Var2 WP4 M 5 17.5 66.25 28.83 4.99 110801 05 Var2 WP5 M 3 15.3 44.88 19.76 5.02 110801 05 Var2 WP6 F 2 13.5 27.39 12.3 5.01 110801 05 Var2 WPF 28.32 110801 05 Var3 WP1 M 5 18.6 91.98 36.62 9 110801 05 Var3 WP2 M 3 17.3 68.24 29.61 9.01 110801 05 Var3 WP3 F 2 16.2 52.24 22.01 9.02 110801 05 Var3 WP4 F 2 15.4 48.56 18.43 8.99 110801 05 Var3 WP5 M 3 15.8 51.11 21.82 9 110801 05 Var3 WP6 F gravid 4 16.3 53.32 21.54 8.97 110801 05 Var3 WPF 41.92
*Individual

88
A-6. Summary of White Perch Samples from Spring 2002 Collections/Analyses
Sample ID Sex Age Length (cm) Weight (g) Fillet Whole
(g) Fillet (g) Whole
Remains (g) Zone 2 062102 02 WP1* M 3 15.5 63.23 18.57 10.01 37.76 062102 02 WP2* F 3 15.2 60.96 14.92 10.03 37.4 062102 02 WP3* M NA 15.4 64.25 19.26 9.99 37.67 062102 02 WP4* M 2 16.3 65.02 18.4 10.03 43.41 062102 02 WP5* F (gravid) 3 16 66.27 19.9 10.01 42.53
062102 02 CORE WPF Average 3 63.95 18.21 39.75
062102 02 CORE WPR *Caught by rod & reel by ANS (near Bordentown, NJ) NA=Not available
Zone 3 032002 03 WP1 F 4 18.3 94.66 21.22 9.98 69.48 032002 03 WP2 F 4 17.2 87.13 18.87 10.02 65.29 032002 03 WP3 M 5 16.7 62.12 22.18 9.97 73.98 032002 03 WP4 M 3 19 99.02 13.95 9.98 45.89 032002 03 WP5 F 3 17.7 79.8 15.02 10.01 58.59
032002 03 Core WPF Average 4 84.55 18.25 62.65
032002 03 Core WPR
Zone 4 032002 04 WP1 F 4 184 90.79 19.34 10.01 71.45 032002 04 WP2 M 4 196 119.81 19.31 10.00 100.50 032002 04 WP3 M 4 183 89.10 15.91 10.03 73.19 032002 04 WP4 M 5 179 90.82 16.76 9.99 74.06 032002 04 WP5 M 4 165 67.34 12.98 10.00 54.36
032002 04 Core WPF Average 4 91.57 16.86 74.71
032002 04 Core WPR
Zone 5 032002 05 WP1 F 9 23.8 220 38.33 25 195 032002 05 WP2 F 9 20.8 183 34.93 24.99 158.01 032002 05 WP4 F 6 20.9 177 33.38 24.98 152.02 032002 05 WP6 M 6 20.8 162 29.68 24.98 137.02 032002 05 WP8 M 5 19.1 115 42.09 24.99 90.01
032002 05 Core WPF Average 7 171.4 35.68 146.41
032002 05 Core WPR

89
A-7. Summary of Prey Fish from Fall 2001 Collections/Analyses
Sample ID Species
Zone 3
110801 03 SED1 SFA 4 YOY Channel Catfish Ictalurus punctatus
110801 03 SED1 SFB 1 Hogchoker Trinectes maculatus
110801 03 SED2 SFA YOY Catfish Ictalurus punctatus
110801 03 SED2 SFB YOY Catfish Ictalurus punctatus
110801 03 SED2 SFC YOY Catfish Ictalurus punctatus
Zone 4
110801 04 CC SFA 4 YOY Channel Catfish Ictalurus punctatus
110801 04 SED1 SFA 16 Croaker Micropogonias undulatus
110801 04 SED1 SFB 15 Croaker Micropogonias undulatus
110801 04 SED1 SFC 5 Hogchoker Trinectes maculatus
110801 04 SD1 SFD 10 YOY Channel Catfish Ictalurus punctatus
110801 04 SD1 SFE 1 Spottailed Shiner Notropis hudsonius
110801 04 SED1 SFF Tesselated Darter Etheostoma olmstedi
110801 04 SED1 SFG 4 White perch Morone americana
Zone 5
110801 05 SED2 SFA 1 YOY Channel Catfish Ictalurus punctatus
110801 05 SED2 SFB Croaker Micropogonias undulatus
110801 05 SED2 SFC Croaker Micropogonias undulatus
110801 05 CC SFA 3 American Eels Anguilla rostrata
110801 05 CC SFB 4 Hogchoker Trinectes maculatus *Individual species analyzed and composited by zone **No Zone 2 SF
***YOY= Young of the Year

90
A-8. Summary of Prey Fish from Spring 2002 Collections/Analyses
Small Fish Species
Zone 2
040202 2CC SFA Gizzard shad Dorosoma cepedianum
040302 02CORE SFA Spot-tailed Shiners Notropis hudsonius
040302 02CORE SFB Tessalated Darter Etheostoma olmstedi
040302 02CORE SFC Banded Killifish Fundulus diaphanus
Zone 3
032002 03 CORE SFA YOY Channel Catfish Ictalurus punctatus
032002 03 CORE SFB Juvenile White Perch Morone americana
Zone 4
032002 04 SED2 SFA1 Juvenile White Perch Morone americana
032002 04 SED2 SFA2 Juvenile White Perch Morone americana
032002 04 SED2 SFA3 Juvenile White Perch Morone americana
032002 04 SED2 SFB YOY Channel Catfish Ictalurus punctatus
032002 04 SED2 SFC Spottail shiner Notropis hudsonius
Zone 5
032002 05 SED1 SFA Juvenile White Perch Morone americana
032002 05 SED1 SFB Hogchoker Trinectes maculatus
032002 05 SED1 SFC YOY Channel Catfish Ictalurus punctatus
032002 05SED3 SFA Juvenile White Perch Morone americana
032002 05SED3 SFB YOY Channel Catfish Ictalurus punctatus *Individual species analyzed and composited by zone
**YOY= Young of the Year
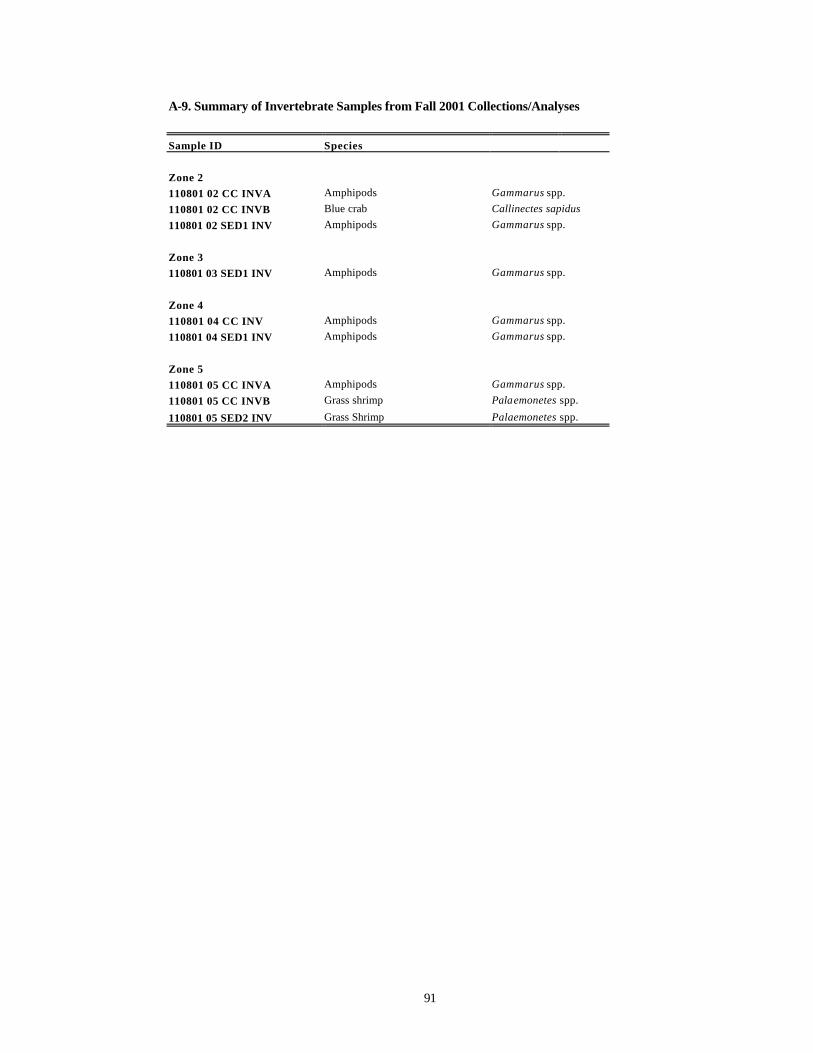
91
A-9. Summary of Invertebrate Samples from Fall 2001 Collections/Analyses
Sample ID Species
Zone 2
110801 02 CC INVA Amphipods Gammarus spp.
110801 02 CC INVB Blue crab Callinectes sapidus
110801 02 SED1 INV Amphipods Gammarus spp.
Zone 3
110801 03 SED1 INV Amphipods Gammarus spp.
Zone 4
110801 04 CC INV Amphipods Gammarus spp.
110801 04 SED1 INV Amphipods Gammarus spp.
Zone 5
110801 05 CC INVA Amphipods Gammarus spp.
110801 05 CC INVB Grass shrimp Palaemonetes spp.
110801 05 SED2 INV Grass Shrimp Palaemonetes spp.

92
A-10. Summary of Invertebrate Samples from Spring 2002 Collections/Analyses
Site Species
Zone 2
040302 02 CC INV Amphipods Gammarus spp.
040302 02 CORE INV Amphipods Gammarus spp.
Zone 3
032002 03 CORE INV Amphipods Gammarus spp.
032002 03 CORE MACRO INV Crayfish Decopoda
Zone 4
032002 04 CORE INV Amphipods Gammarus spp.
032002 04 CORE MACRO Crayfish Decopoda
Zone 5
032002 05 CORE INV Amphipods Gammarus spp.
032002 05 SED1 INV Amphipods Gammarus spp.
032002 05 SED1 MACRO INV White fingered mud crab Rhithropanopeus harrisii
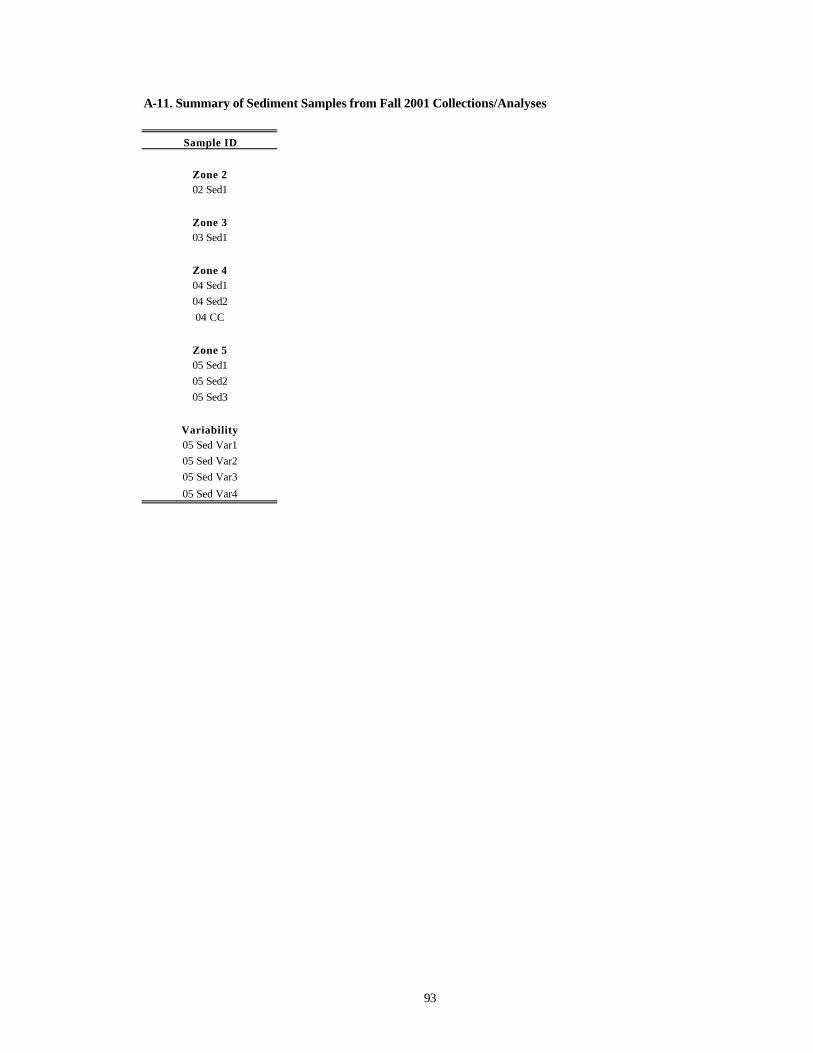
93
A-11. Summary of Sediment Samples from Fall 2001 Collections/Analyses
Sample ID
Zone 2 02 Sed1
Zone 3 03 Sed1
Zone 4 04 Sed1 04 Sed2 04 CC
Zone 5 05 Sed1 05 Sed2 05 Sed3
Variability 05 Sed Var1 05 Sed Var2 05 Sed Var3
05 Sed Var4

94
A-12. Summary of Sediment Samples from Spring 2002 Collections/Analyses
Sample ID
Zone 2 02 CC
02 Sed1 02 Sed3 02 Var2 02 Var3 02 Var4
Zone 3 03 Sed1 03 Sed2
Zone 4 04 Sed1 04 Sed2 04 CC
Zone 5 05 Sed1 05 Sed2
05 Sed2 amphipod
05 Sed3

95
APPENDIX B: PCB CONCENTRATIONS IN BIOTA
B-1. PCB concentrations in Channel Catfish from Fall 2001 Core Study B-2. PCB concentrations in Channel Catfish from Fall 2001 Variability Study B-3. PCB concentrations in Channel Catfish from Spring 2002 Core Study B-4. PCB concentrations in Channel Catfish from Spring 2002 Variability Study B-5. PCB concentrations in White Perch from Fall 2001 Core Study B-6. PCB concentrations in White Perch from Fall 2001 Variability Study 1 B-7. PCB concentrations in White Perch from Fall 2001 Variability Study 2 B-8. PCB concentrations in White Perch from Fall 2001 Variability Study 3 B-9. PCB concentrations in White Perch from Spring 2002 Core Study B-10. PCB concentrations in Prey Fish from Fall 2001 Core Study B-11. PCB concentrations in Prey Fish from Fall 2001 Variability Study B-12. PCB concentrations in Prey Fish from Spring 2002 Core Study B-13. PCB concentrations in Prey Fish from Spring 2002 Variability Study B-14. PCB concentrations in Invertebrates from Fall 2001 Core Study B-15. PCB concentrations in Invertebrates from Fall 2001 Variability Study B-16. PCB concentrations in Invertebrates from Spring 2002 Core Study B-17. PCB concentrations in Invertebrates from Spring 2002 Variability Study

B-1. PCB concentrations in Channel Catfish (ng/g) from Fall 2001 Core Study
Field ID 2 CORE CCF 2 CORE CCR 2 CORE Whole Fish 3 CORE CCFA 3 CORE CCFB 3 CORE CCFC 3 CORE CCRCollected Fall 2001 Fall 2001 Fall 2001 Fall 2001 Fall 2001 Fall 2001 Fall 2001Zone 2 2 2 3 3 3 3Description Fillet Composite Remains Composite Whole Fish Fillet Composite Fillet Composite Fillet Composite Remains CompositeReplicate analysis? rep A rep B rep CAnalyzed by CBL CBL CBL CBL CBL CBL CBLLipid Content (%) 4.6% 9.9% 9.2% 4.2% 4.1% 4.3% 11.0%
1 6.49 3.27 3.69 ND ND ND ND3 14.71 9.00 9.75 8.14 0.70 3.75 15.91
4,10 3.63 6.86 6.43 2.41 2.42 ND 6.367,9 0.24 0.39 0.37 0.35 0.33 0.33 0.656 0.26 0.36 0.34 0.31 0.29 0.26 0.64
8,5 12.64 25.53 23.83 13.21 12.93 14.17 41.3619 ND ND ND ND ND ND ND
12,13 0.22 0.48 0.45 0.41 0.29 0.24 0.4018 4.13 8.94 8.30 6.28 5.77 5.37 11.8517 2.04 4.22 3.93 3.87 3.58 3.52 7.9424 0.24 0.30 0.29 0.25 0.23 0.19 4.21
16,32 2.77 5.74 5.35 5.37 5.03 4.66 11.5429 ND ND ND ND ND ND ND26 0.32 0.53 0.50 0.46 0.31 0.40 1.4425 0.23 0.30 0.29 0.27 0.26 0.23 0.60
31, 28 3.72 8.20 7.61 6.83 6.31 5.91 16.6633,21,53 4.09 8.45 7.87 6.84 6.56 5.80 15.13
51 0.72 1.47 1.37 2.06 1.95 1.78 4.9822 0.62 0.93 0.89 1.09 1.26 1.17 3.3645 3.05 6.22 5.80 3.89 3.89 3.84 10.3446 2.55 6.06 5.60 3.52 3.20 3.14 9.9752 4.07 8.34 7.77 8.50 7.94 7.26 20.1049 7.18 9.09 8.83 7.67 7.26 7.02 16.14
47,48 9.03 14.95 14.17 9.92 9.72 9.52 40.7044 4.55 9.09 8.49 7.97 7.72 6.85 19.67
37,42 4.42 9.58 8.89 5.03 4.99 4.65 16.4341,64,71 7.31 15.54 14.45 12.79 12.26 11.66 29.94
40 1.01 2.16 2.00 1.61 1.57 1.59 4.68100 1.90 4.05 3.77 2.62 2.48 2.85 8.4563 0.99 2.19 2.03 1.27 1.17 1.15 3.6874 5.49 12.09 11.22 7.00 6.64 6.82 21.08
70,76 2.26 4.77 4.44 3.70 3.55 3.22 9.4266,95 20.80 41.01 38.34 33.79 31.98 30.12 84.43
91 2.41 5.36 4.97 3.75 3.49 3.23 9.7056,60/92,84 11.85 25.65 23.83 12.41 11.84 13.39 49.93
89 15.69 36.89 34.09 7.68 24.70 7.92 78.71101 10.35 21.38 19.92 17.20 16.21 16.11 42.1999 8.33 17.98 16.70 10.74 9.91 10.19 26.92119 1.73 4.40 4.04 1.77 1.59 1.60 5.2783 1.77 3.82 3.55 1.83 1.73 2.13 8.2597 17.34 27.81 26.43 19.79 19.19 17.31 48.36
81,87 5.74 20.75 18.76 1.59 1.55 1.39 4.0885 19.23 10.86 11.97 5.74 5.36 5.92 16.08136 0.49 11.86 10.36 1.29 1.25 1.14 3.07
77,110 19.09 41.36 38.41 26.98 26.41 23.77 72.4182, 151 1.40 3.13 2.90 3.28 3.08 3.18 7.00135,144 3.55 7.83 7.27 6.40 6.35 6.48 17.60
107 1.70 3.87 3.58 2.28 2.14 2.22 6.34123,149 16.74 34.70 32.33 28.46 27.15 25.99 69.77
118 19.30 45.09 41.68 22.71 20.65 21.83 62.65134 0.72 1.24 1.17 0.99 0.96 1.17 3.97146 6.64 14.40 13.37 9.18 8.64 9.00 22.93
132,105,153 66.97 148.74 137.93 93.85 89.22 91.10 233.55141 6.27 14.36 13.29 21.23 20.08 22.10 58.19
137,130,176 2.15 4.84 4.49 3.23 3.16 2.91 8.13163,138 46.88 105.41 97.67 72.38 69.31 72.72 186.97
158 1.44 3.05 2.83 2.11 2.19 2.25 5.71129,178 4.55 10.33 9.56 7.28 7.16 7.47 19.76187,182 18.42 40.31 37.41 27.83 26.10 28.00 71.46
183 10.66 24.29 22.49 19.02 17.87 19.72 51.28128 3.76 9.11 8.40 5.23 5.15 4.88 15.36185 1.87 4.37 4.04 3.61 3.42 3.64 10.47174 6.12 13.92 12.89 17.59 16.80 16.91 46.27177 7.38 16.39 15.20 10.40 10.35 8.96 25.96
202,171,156 7.90 18.91 17.45 13.04 12.42 13.35 37.48157,200 2.81 6.97 6.42 4.25 3.99 4.10 11.88172,197 2.77 6.53 6.03 7.17 6.75 7.58 20.63
180 31.15 73.60 67.99 70.23 66.42 73.73 196.09193 9.11 26.05 23.81 11.81 11.37 12.32 43.08191 0.94 2.38 2.19 2.00 1.89 2.11 5.71199 ND ND ND ND ND ND ND
170,190 12.72 32.66 30.02 27.68 33.80 28.98 106.08198 0.75 1.79 1.65 1.30 1.21 1.32 3.53201 6.66 15.90 14.68 14.10 13.22 14.53 39.04
203,196 16.07 39.64 36.52 28.95 27.17 27.76 83.62189 0.38 0.87 0.81 0.95 0.87 1.02 2.83
208,195 5.83 14.32 13.20 6.47 6.25 7.05 32.10207 0.99 2.25 2.08 1.34 1.50 1.47 4.01194 3.60 9.20 8.46 11.03 10.39 12.06 34.46205 0.60 1.10 1.03 1.13 0.68 0.97 2.44206 6.11 15.43 14.20 10.51 9.91 10.51 32.28209 2.56 6.45 5.94 4.75 4.24 4.52 13.15
Total PCBs 583 1238 1151 852 828 825 2396Recovery
14 221% 377% 356% 259% 260% 219% 553%65 NM NM NM NM NM NM NM166 93% 102% 101% 104% 102% 86% 137%
96

B-1. PCB concentrations in Channel Catfish (ng/g) from Fall 2001 Core Study
Field ID 3 CORE Whole Fish 4 CORE CCF 4 CORE CCR 4 CORE Whole Fish 5 CORE CCF 5 CORE CCR 5 CORE Whole FishCollected Fall 2001 Fall 2001 Fall 2001 Fall 2001 Fall 2001 Fall 2001 Fall 2001Zone 3 4 4 4 5 5 5Description Whole Fish Fillet Composite Remains Composite Whole Fish Fillet Composite Remains Composite Whole FishReplicate analysis?Analyzed by CBL CBL CBL CBL CBL CBL CBLLipid Content (%) 10.1% 2.8% 9.5% 8.6% 3.3% 7.9% 5.9%
1 ND ND ND ND ND ND ND3 14.38 0.72 1.43 1.34 1.75 9.49 6.84
4,10 5.85 ND 1.56 ND ND ND ND7,9 0.61 0.27 0.45 0.42 0.19 0.27 0.216 0.59 0.29 0.46 0.44 0.23 0.45 0.34
8,5 37.69 7.13 23.32 21.25 7.09 12.63 9.6519 ND ND ND ND ND ND ND
12,13 0.39 0.27 0.45 0.43 0.21 0.32 0.2518 11.06 4.92 9.51 8.93 3.52 5.05 3.9417 7.38 2.68 5.46 5.11 1.97 2.85 2.2224 3.68 0.21 0.01 0.04 0.13 0.17 0.13
16,32 10.68 3.76 7.43 6.96 2.49 3.64 2.8329 ND ND ND ND ND ND ND26 1.30 0.24 0.65 0.60 0.13 0.63 0.4625 0.55 0.20 0.43 0.40 0.14 0.21 0.16
31, 28 15.31 4.87 13.80 12.66 2.68 4.17 3.2333,21,53 13.98 5.23 11.04 10.30 3.93 5.46 4.27
51 4.58 1.31 3.18 2.94 0.58 0.95 0.7322 3.07 0.81 2.27 2.08 0.45 0.62 0.4945 9.49 3.22 7.20 6.69 2.15 3.38 2.6146 9.10 1.87 5.50 5.03 1.43 2.70 2.0552 18.50 7.46 18.08 16.72 4.38 7.15 5.5049 14.98 5.89 12.19 11.39 6.42 7.26 5.82
47,48 36.63 7.48 13.12 12.40 9.93 8.38 7.0144 18.07 6.35 16.50 15.20 3.79 6.21 4.78
37,42 14.91 4.53 12.00 11.05 3.38 4.87 3.8041,64,71 27.61 9.74 23.50 21.74 7.08 10.80 8.37
40 4.27 1.49 3.89 3.58 1.15 1.80 1.39100 7.69 1.88 4.90 4.51 1.59 2.65 2.0463 3.35 0.93 2.88 2.64 1.04 1.99 1.5174 19.21 4.87 14.00 12.84 4.40 6.21 4.85
70,76 8.64 2.16 7.08 6.45 1.52 2.47 1.9066,95 77.54 25.95 68.06 62.68 18.17 29.53 22.75
91 8.88 3.02 7.84 7.22 2.35 4.05 3.1056,60/92,84 45.02 7.82 24.43 22.31 6.69 12.49 9.51
89 70.14 5.38 19.20 17.44 12.14 8.86 7.60101 38.82 12.20 31.35 28.91 9.73 15.63 12.0599 24.74 8.67 21.88 20.20 8.22 14.04 10.77119 4.79 1.16 4.05 3.68 1.07 2.11 1.6083 7.42 1.47 4.70 4.29 1.13 2.12 1.6197 44.48 8.77 21.65 20.00 8.57 13.44 10.39
81,87 3.75 1.20 46.98 41.13 0.82 1.38 1.0685 14.71 4.54 13.97 12.76 4.08 6.40 4.94136 4.16 0.92 2.25 2.77 0.66 0.98 1.12
77,110 66.28 21.69 58.84 54.09 16.48 27.72 21.2882, 151 6.50 1.83 3.91 3.65 1.40 2.39 1.83135,144 16.13 3.97 10.72 9.86 3.10 5.25 4.03
107 5.80 1.71 5.08 4.65 1.62 2.89 2.21123,149 64.18 17.92 44.89 41.44 13.63 21.43 16.56
118 57.28 16.58 50.12 45.83 13.51 24.61 18.77134 3.58 0.58 1.05 0.99 0.74 1.00 0.79146 21.09 6.05 15.10 13.94 7.13 11.78 9.06
132,105,153 214.88 55.73 93.95 89.06 51.86 84.02 64.74141 53.33 8.81 24.77 22.73 7.66 13.27 10.16
137,130,176 7.47 2.22 5.96 5.48 2.02 3.28 2.53163,138 171.80 39.86 104.39 96.14 35.39 59.21 45.49
158 5.25 1.32 3.09 2.87 1.31 1.86 1.45129,178 18.12 4.34 11.11 10.25 4.79 7.18 5.58187,182 65.66 15.06 38.10 35.16 17.88 29.11 22.42
183 47.02 8.43 23.02 21.16 8.78 14.85 11.40128 14.01 3.35 9.99 9.15 3.13 5.26 4.04185 9.56 1.78 5.22 4.78 1.52 2.61 2.00174 42.44 8.46 21.53 19.86 7.78 12.63 9.73177 23.85 6.38 17.48 16.06 5.27 8.89 6.83
202,171,156 34.25 6.80 19.96 18.28 7.66 7.49 6.13157,200 10.86 3.14 8.98 8.24 4.28 7.42 5.68172,197 18.86 3.44 10.12 9.26 3.99 7.20 5.49
180 179.54 31.31 89.61 82.16 29.82 53.45 40.82193 38.98 6.11 25.62 23.12 4.77 10.12 7.62191 5.22 0.69 2.07 1.89 0.62 1.19 0.91199 ND ND ND ND ND ND ND
170,190 96.10 10.68 34.33 31.31 12.57 17.56 13.74198 3.23 0.94 3.01 2.75 1.23 2.37 1.80201 35.74 9.70 28.32 25.94 13.33 23.93 18.27
203,196 76.31 15.95 48.84 44.64 20.25 37.16 28.32189 2.58 0.42 1.35 1.23 0.39 0.73 0.56
208,195 28.75 3.59 10.64 9.74 17.74 33.02 25.14207 3.67 2.23 5.98 5.50 4.21 7.55 5.77194 31.40 5.26 18.48 16.79 5.19 10.36 7.84205 2.24 0.38 1.31 1.19 0.33 0.64 0.48206 29.39 16.52 53.89 49.11 27.13 52.40 39.77209 12.01 8.54 26.06 23.82 14.84 27.96 21.26
Total PCBs 2191 524 1442 1310 521 871 664Recovery
14 513% 218% 485% 451% 145% 183% 144%65 NM NM NM NM NM NM NM166 132% 82% 92% 91% 86% 75% 63%
97

B-2. PCB concentrations in Channel Catfish (ng/g) from Fall 2001 Variability Study
Field ID 2CC CC1F 2CC CC2F 2CC CC3F 2CC CC4F 2CC CC5F 2CC CC1-5F 4CC CC1F 4CC CC2FCollected Fall 2001 Fall 2001 Fall 2001 Fall 2001 Fall 2001 Fall 2001 Fall 2001 Fall 2001Zone 2 2 2 2 2 2 4 4Description Individual Fillet Individual Fillet Individual Fillet Individual Fillet Individual Fillet Composite fillet Individual Fillet Individual FilletReplicate analysis?Analyzed by CBL CBL CBL CBL CBL CBL CBL CBLFish Mass (g) 761 799.2 524.2 1020.4 863.4 240.31 467.75Fish Length (mm) 442 448 403 492 474 337 388Fish Sex F F M M F M MFish Age (yrs) 9 19 9 11 13 8 7Lipid Content (%) 5.1% 1.7% 6.2% 3.0% 3.5% 4.6% 4.2% 2.3%
1 6.49 ND ND ND ND 6.49 ND ND3 54.23 2.93 6.67 4.30 5.41 14.71 2.84 0.70
4,10 2.36 ND 5.97 2.85 3.34 3.63 ND ND7,9 0.35 0.09 0.28 0.18 0.29 0.24 0.24 0.416 0.53 0.05 0.28 0.16 0.26 0.26 0.26 0.26
8,5 11.20 7.54 21.12 9.34 13.99 12.64 9.99 8.9819 ND ND ND ND ND ND ND ND
12,13 0.15 0.14 0.30 0.19 0.31 0.22 0.24 0.2218 2.56 2.75 6.27 3.60 5.49 4.13 5.25 6.1417 1.04 0.95 3.68 1.79 2.76 2.04 2.99 2.7824 0.66 0.07 0.21 0.12 0.17 0.24 0.24 0.23
16,32 1.82 1.21 4.93 2.24 3.67 2.77 4.61 4.4829 ND ND ND ND ND ND ND ND26 0.26 ND 0.59 0.22 0.20 0.32 0.30 0.6425 0.49 0.08 0.24 0.14 0.22 0.23 0.22 0.46
31, 28 2.55 1.51 6.17 3.38 4.97 3.72 5.46 4.4133,21,53 2.95 2.39 6.21 3.32 5.57 4.09 6.21 4.71
51 0.61 0.30 1.40 0.53 0.76 0.72 1.73 1.6822 0.73 ND 0.68 0.47 0.61 0.62 0.81 0.7945 2.51 2.02 5.11 2.11 3.51 3.05 3.87 2.7646 1.74 1.90 4.23 1.72 3.16 2.55 2.88 1.0252 3.24 1.58 7.40 3.48 4.63 4.07 8.70 8.2349 5.56 3.09 10.63 10.22 6.41 7.18 6.95 15.46
47,48 6.34 5.96 9.13 9.30 14.40 9.03 8.21 13.5744 3.26 1.88 9.68 2.83 5.10 4.55 9.09 6.83
37,42 2.87 1.96 8.53 3.24 5.52 4.42 5.95 5.5341,64,71 5.12 4.05 11.75 5.41 10.24 7.31 13.01 7.53
40 1.34 0.56 1.39 0.57 1.20 1.01 2.27 1.40100 1.65 1.26 2.73 1.36 2.50 1.90 2.28 2.1363 1.08 0.61 1.28 0.60 1.40 0.99 1.35 1.1574 3.63 3.21 8.30 4.23 8.06 5.49 5.93 4.67
70,76 2.17 1.33 3.21 1.92 2.66 2.26 3.48 1.4066,95 14.66 9.93 34.99 13.70 30.71 20.80 34.85 23.13
91 1.52 1.39 4.12 1.73 3.30 2.41 3.96 3.3056,60/92,84 7.78 6.22 23.01 7.84 14.40 11.85 10.95 6.41
89 11.79 8.37 32.34 7.75 18.21 15.69 39.44 16.61101 7.22 5.84 16.88 7.92 13.89 10.35 16.18 13.8499 4.84 6.31 11.63 5.99 12.87 8.33 10.42 8.37
119 0.87 1.58 2.57 1.32 2.31 1.73 1.63 1.1583 1.45 1.03 3.17 1.17 2.01 1.77 2.29 1.3697 12.51 7.17 33.38 14.66 18.95 17.34 20.87 21.70
81,87 0.62 0.67 1.66 0.63 25.14 5.74 1.65 6.8685 71.57 4.53 8.23 3.87 7.96 19.23 5.66 3.80
136 0.32 0.23 0.99 0.34 0.50 0.49 1.52 0.5277,110 11.67 12.10 31.96 12.19 27.51 19.09 31.57 20.2882, 151 1.19 0.92 2.18 1.07 1.66 1.40 2.57 1.72135,144 2.46 2.55 5.80 2.64 4.32 3.55 5.43 3.73
107 1.05 1.27 2.45 1.16 2.57 1.70 2.39 1.33123,149 12.40 11.27 27.44 10.72 21.87 16.74 23.82 20.25
118 10.05 15.02 29.25 13.31 28.89 19.30 21.59 12.21134 0.98 0.24 1.29 0.40 0.68 0.72 0.64 0.50146 4.36 5.02 8.73 4.83 10.28 6.64 8.02 8.20
132,105,153 32.37 54.24 101.53 48.44 98.27 66.97 72.98 58.49141 5.62 4.74 7.84 4.04 9.09 6.27 11.55 11.24
137,130,176 1.47 1.59 3.41 1.27 3.04 2.15 3.27 2.34163,138 28.81 37.67 65.13 33.73 69.08 46.88 52.13 45.15
158 0.96 1.21 1.90 1.15 1.97 1.44 1.52 1.31129,178 3.22 3.35 6.23 3.27 6.70 4.55 5.66 5.26187,182 12.71 14.91 24.93 13.31 26.27 18.42 19.33 21.25
183 7.12 8.96 14.23 7.49 15.49 10.66 11.00 11.10128 2.68 2.83 5.43 2.50 5.36 3.76 4.72 3.55185 1.41 1.58 2.76 1.23 2.35 1.87 2.39 2.08174 5.71 4.87 8.35 3.74 7.92 6.12 11.09 9.75177 5.41 6.57 11.95 2.53 10.44 7.38 9.88 7.73
202,171,156 5.13 6.35 10.87 5.51 11.63 7.90 9.02 6.90157,200 1.95 2.21 3.93 1.76 4.19 2.81 4.09 3.14172,197 2.52 2.10 3.58 1.78 3.87 2.77 4.85 4.16
180 24.03 25.50 43.49 20.08 42.65 31.15 44.82 38.00193 4.35 6.13 15.94 6.04 13.07 9.11 9.44 4.40191 0.71 0.80 1.47 0.65 1.10 0.94 0.91 0.76199 ND ND ND ND ND ND ND ND
170,190 10.18 10.02 17.30 7.88 18.22 12.72 16.92 13.96198 0.61 0.55 1.03 0.46 1.08 0.75 1.31 1.17201 6.26 4.80 8.43 3.96 9.86 6.66 13.53 10.95
203,196 12.06 13.25 22.06 9.86 23.14 16.07 21.59 15.49189 0.47 0.25 0.44 0.21 0.51 0.38 0.60 0.56
208,195 6.13 4.28 7.10 3.27 8.37 5.83 3.65 10.07207 1.38 0.65 1.04 0.48 1.41 0.99 2.46 1.91194 4.03 2.44 4.54 1.92 5.07 3.60 8.20 4.86205 1.34 0.35 0.56 0.23 0.52 0.60 0.63 0.55206 8.19 3.76 6.91 2.79 8.89 6.11 23.67 12.27209 3.61 1.63 2.81 1.25 3.51 2.56 11.29 6.62
Total PCBs 509 379 836 384 778 583 743 599Recovery
14 231% 137% 334% 204% 200% 221% 216% 283%65 NM NM NM NM NM NM NM NM
166 81% 89% 97% 98% 100% 93% 69% 78%
98

B-2. PCB concentrations in Channel Catfish (ng/g) from Fall 2001 Variability Study
Field ID 4CC CC3F 4CC CC4F 4CC CC5F 4CC CC1-5F 5SED2 CC1F 5SED2 CC2F 5SED2 CC3F 5SED2 CC4FCollected Fall 2001 Fall 2001 Fall 2001 Fall 2001 Fall 2001 Fall 2001 Fall 2001 Fall 2001Zone 4 4 4 4 5 5 5 5Description Individual Fillet Individual Fillet Individual Fillet Composite fillet Individual Fillet Individual Fillet Individual Fillet Individual FilletReplicate analysis?Analyzed by CBL CBL CBL CBL CBL CBL CBL CBLFish Mass (g) 376.91 352.38 129.28 500.76 569.79 963.1 537.63Fish Length (mm) 353 360 267 405 419 477 397Fish Sex M F M F M M FFish Age (yrs) 7 5 3 6 5 8 7Lipid Content (%) 6.0% 2.7% 2.6% 3.6% 5.8% 1.8% 6.2% 2.6%
1 ND 9.94 ND ND ND ND ND ND3 1.90 39.28 1.65 0.99 3.11 1.27 5.84 1.18
4,10 ND ND ND ND ND ND ND ND7,9 0.17 0.52 0.14 0.26 0.16 0.07 0.39 0.106 0.15 0.45 0.27 0.28 0.22 0.05 0.50 0.11
8,5 13.55 16.95 4.42 13.19 8.15 1.84 16.88 4.9919 ND ND ND ND 0.46 ND 0.83 ND
12,13 0.17 0.38 0.13 0.31 0.20 0.08 0.40 0.0918 3.51 4.78 1.97 4.76 3.09 0.87 7.48 1.4917 2.23 2.62 1.31 2.78 1.91 0.47 4.57 1.1024 0.16 0.24 0.07 0.24 0.16 0.05 0.35 0.03
16,32 3.55 4.47 1.53 4.27 2.57 0.68 6.45 0.8629 ND ND ND ND ND ND ND ND26 0.23 0.56 0.33 0.44 0.19 0.02 0.32 0.1625 0.11 0.20 0.16 0.17 0.16 0.03 0.34 0.16
31, 28 4.20 4.42 1.38 4.75 3.12 0.52 8.26 2.2233,21,53 3.64 6.38 2.38 5.11 3.36 0.96 8.41 1.56
51 1.53 1.23 0.24 1.50 0.74 0.12 2.14 0.2122 1.00 1.16 0.43 0.97 0.55 ND 1.69 ND45 3.20 3.66 0.98 3.40 1.81 0.58 5.21 1.3246 2.67 1.75 0.66 2.17 1.29 0.31 3.55 1.2752 6.25 7.50 2.30 7.46 5.34 1.01 11.54 2.7149 3.80 10.08 9.55 7.35 4.56 2.74 10.27 4.80
47,48 4.30 11.93 7.57 7.57 4.89 1.80 11.90 2.6544 6.39 7.49 1.40 7.40 3.61 0.97 12.41 0.96
37,42 3.83 5.68 1.47 4.86 2.69 0.70 7.92 1.6641,64,71 8.57 11.27 4.02 10.84 5.33 1.75 17.99 2.79
40 1.55 1.92 0.57 1.81 0.98 0.33 2.90 0.70100 1.53 1.92 0.95 1.85 1.38 0.36 3.62 1.3563 0.89 0.87 0.72 1.02 0.97 0.22 2.22 1.3174 4.25 5.77 2.33 5.15 3.19 0.84 8.66 3.19
70,76 1.46 2.42 0.77 2.50 1.59 0.36 4.73 1.0666,95 20.12 28.64 7.93 26.98 15.68 4.08 45.85 11.57
91 2.37 3.38 1.23 3.20 2.13 0.59 5.52 1.8356,60/92,84 9.86 8.36 3.29 9.56 5.89 1.57 18.65 4.95
89 9.07 24.17 1.52 6.28 3.74 1.10 10.58 2.16101 9.05 13.39 5.74 12.75 8.26 2.29 21.74 8.4399 5.57 9.12 5.87 8.37 6.11 1.92 15.77 7.71
119 1.71 1.78 0.66 1.46 0.96 0.27 2.57 1.1483 1.31 1.68 0.55 1.81 1.07 0.28 2.92 0.6597 11.07 27.48 6.23 17.19 5.91 1.98 12.64 4.66
81,87 0.98 1.62 ND 1.36 0.72 ND 2.08 ND85 3.01 5.03 2.63 4.54 2.59 0.76 7.56 3.39
136 0.68 1.18 0.21 1.05 0.47 0.17 1.64 0.4277,110 17.73 28.05 7.14 24.77 14.63 3.87 43.24 1.6582, 151 0.92 1.92 0.76 1.94 1.14 0.31 2.40 1.13135,144 2.62 4.32 1.65 4.07 2.59 0.67 6.75 2.92
107 1.15 1.70 1.10 1.75 1.38 0.41 3.24 1.13123,149 12.53 19.32 5.64 18.36 10.52 3.45 31.53 10.33
118 11.26 17.87 9.87 16.50 9.98 2.54 30.91 12.34134 0.44 0.82 0.51 0.70 0.49 0.24 0.89 0.47146 3.88 6.49 4.62 6.48 4.83 1.87 10.91 6.23
132,105,153 35.43 40.09 31.33 58.90 32.39 12.27 100.36 40.26141 6.12 10.85 5.07 10.15 5.48 1.54 13.38 7.13
137,130,176 1.55 2.94 0.96 2.64 1.47 0.55 4.12 0.92163,138 25.95 45.60 23.99 42.59 24.58 7.99 70.15 26.54
158 0.90 1.64 ND 1.39 0.82 ND 2.05 ND129,178 2.76 5.63 2.72 4.93 3.02 1.06 6.87 3.46187,182 10.03 15.77 10.19 15.92 11.85 4.52 25.25 15.49
183 5.31 8.46 4.75 9.07 5.56 1.68 14.98 7.52128 2.11 5.09 2.20 3.73 2.33 0.49 6.03 2.78185 1.20 2.05 0.87 2.04 1.00 0.33 2.78 1.52174 5.77 10.59 4.40 9.81 5.02 1.83 13.08 7.44177 4.55 8.03 1.02 7.77 2.77 1.35 11.34 1.67
202,171,156 4.46 8.06 3.28 7.59 3.49 1.36 9.35 4.74157,200 2.09 4.31 2.45 3.72 2.67 0.97 6.03 3.52172,197 2.41 4.29 2.29 4.28 2.52 0.91 5.66 3.64
180 21.16 35.44 17.10 37.51 18.88 5.81 49.57 28.58193 8.44 5.08 2.24 6.95 3.72 0.96 12.47 4.69191 0.44 0.63 0.35 0.78 0.42 0.10 1.27 0.52199 ND ND ND ND ND ND ND ND
170,190 7.78 16.26 6.04 14.10 6.33 1.93 17.77 9.59198 0.72 1.27 0.75 1.14 0.80 0.33 1.77 1.29201 7.54 13.48 8.22 12.41 8.39 3.29 17.38 13.79
203,196 11.27 19.64 11.20 19.69 12.25 4.51 30.08 19.63189 0.31 0.46 0.21 0.52 0.26 0.08 0.72 0.37
208,195 1.77 17.36 10.74 3.21 10.77 0.34 3.78 20.48207 1.67 3.42 2.75 2.88 2.43 1.21 5.10 4.13194 3.96 7.40 3.11 7.11 3.19 1.11 7.92 5.53205 0.26 0.63 0.21 0.52 0.18 0.07 0.60 0.35206 15.54 28.96 17.33 24.50 16.06 7.02 36.64 34.80209 8.21 14.70 11.82 12.65 8.94 4.63 19.84 20.13
Total PCBs 410 710 304 601 362 116 942 414Recovery
14 655% 228% 136% 305% 204% 81% 324% 176%65 NM NM NM NM NM NM NM NM
166 83% 93% 83% 87% 71% 64% 95% 91%
99

B-2. PCB concentrations in Channel Catfish (ng/g) from Fall 2001 Variability Study
Field ID 5SED2 CC5F 5SED2 CC1-5FCollected Fall 2001 Fall 2001Zone 5 5Description Individual Fillet Composite filletReplicate analysis?Analyzed by CBL CBLFish Mass (g) 184.1Fish Length (mm) 295Fish Sex FFish Age (yrs) 5Lipid Content (%) 2.7% 4.0%
1 ND ND3 1.77 3.14
4,10 ND ND7,9 0.06 0.216 0.06 0.19
8,5 3.33 7.7319 ND ND
12,13 0.08 0.2418 1.28 3.6017 0.84 2.1624 0.07 0.16
16,32 1.23 2.8829 ND ND26 0.11 0.2025 0.06 0.18
31, 28 1.41 3.2933,21,53 1.29 4.09
51 0.46 0.7922 0.34 0.7545 1.00 2.1646 0.57 1.3852 2.91 5.1049 3.10 5.48
47,48 1.66 6.2544 2.38 4.10
37,42 1.55 3.1641,64,71 3.24 6.96
40 0.58 1.10100 0.67 1.5063 0.48 1.0174 1.43 3.71
70,76 0.70 1.7066,95 8.71 17.99
91 1.07 2.3856,60/92,84 2.49 6.35
89 2.23 3.54101 4.18 9.3999 2.87 7.44
119 0.43 1.1183 0.54 0.9897 2.44 7.72
81,87 0.37 0.7685 1.46 3.40
136 0.34 0.6277,110 7.58 14.8082, 151 0.54 1.30135,144 1.26 2.90
107 0.52 1.45123,149 5.91 12.44
118 4.32 12.58134 0.25 0.60146 2.04 5.99
132,105,153 18.88 44.71141 2.70 6.68
137,130,176 0.80 1.75163,138 12.13 31.54
158 ND 1.23129,178 1.59 3.52187,182 4.77 14.33
183 2.76 7.19128 1.06 2.77185 0.62 1.37174 3.21 6.78177 2.07 3.96
202,171,156 1.82 6.48157,200 1.39 3.40172,197 1.42 3.15
180 11.78 24.43193 1.65 4.77191 0.22 0.52199 ND ND
170,190 3.72 7.76198 0.50 1.04201 5.29 10.74
203,196 9.06 16.14189 0.18 0.32
208,195 1.01 2.70207 1.99 3.35194 2.62 4.37205 0.20 0.31206 16.01 22.95209 9.39 13.09
Total PCBs 201 438Recovery
14 115% 187%65 NM NM
166 59% 85%
100

B-3. PCB concentrations in Channel Catfish (ng/g) from Spring 2002 Core Study
Field ID 2 CORE CCF 2 CORE CCR 2 CORE WHOLE FISH 3 CORE CCF 3 CORE CCR 3 CORE WHOLE FISH 4 CORE CCFCollected Spring 2002 Spring 2002 Spring 2002 Spring 2002 Spring 2002 Spring 2002 Spring 2002Zone 2 2 2 3 3 3 4Description Fillet Composite Remains Composite Whole Fish Fillet Composite Remains Composite Whole Fish Fillet CompositeReplicate analysis?Analyzed by CBL CBL CBL CBL CBL CBL CBLLipid Content (%) 4.7% 4.9% 4.8% 3.5% 7.8% 7.4% 4.5%
1 0.27 0.51 0.44 0.33 0.11 0.13 2.693 2.75 2.89 2.62 3.85 6.63 6.31 8.41
4,10 3.88 0.43 3.33 1.08 2.66 2.48 0.927,9 0.17 0.22 0.16 0.14 0.30 0.28 0.156 0.03 0.09 0.01 0.05 0.05 0.05 0.04
8,5 7.80 10.26 8.02 9.75 26.17 24.28 17.5519 0.25 0.40 0.25 0.27 0.38 0.37 0.31
12,13 0.20 0.28 0.19 ND 0.39 ND 0.1218 4.08 6.35 4.46 4.04 9.02 8.45 2.7217 1.73 2.30 1.84 1.99 4.79 4.47 1.7824 0.13 0.20 0.15 0.19 0.48 0.44 0.19
16,32 2.22 2.98 2.39 3.07 7.20 6.72 2.8429 0.21 0.30 0.20 0.22 0.45 0.43 0.1226 0.32 0.33 0.32 0.50 1.23 1.14 0.4325 ND ND ND ND ND ND ND
31, 28 3.24 3.31 2.99 4.27 13.03 12.02 7.6233,21,53 3.71 4.63 3.80 3.70 10.64 9.85 3.26
51 0.56 0.57 0.59 1.54 4.61 4.26 1.7722 0.55 0.50 0.53 0.57 1.88 1.73 0.3645 2.46 2.88 2.63 3.81 10.69 9.90 4.6146 2.99 2.73 2.46 1.96 5.03 4.68 3.3152 3.34 3.59 3.48 7.49 18.97 17.65 11.8149 ND ND ND ND ND ND ND
47,48 6.09 11.66 6.54 12.53 31.33 29.16 16.5144 3.64 4.09 3.66 6.81 18.05 16.75 8.14
37,42 3.18 4.01 3.47 5.37 14.28 13.25 6.9641,64,71 6.39 8.03 6.65 9.35 24.40 22.67 11.59
40 0.49 0.60 0.51 1.34 3.83 3.54 1.97100 1.44 1.69 1.47 2.16 5.92 5.49 3.1163 0.77 0.79 0.73 1.04 2.72 2.53 1.8674 4.91 5.72 4.79 6.32 16.79 15.59 8.09
70,76 1.80 2.08 1.83 2.98 8.59 7.95 3.0566,95 15.41 17.57 15.55 28.01 68.62 63.95 34.11
91 2.11 2.39 2.16 3.37 8.89 8.25 5.0856,60/92,84 9.60 11.37 9.51 15.28 44.93 41.52 18.71
89 6.92 5.56 5.11 31.43 98.08 90.42 41.00101 8.57 9.45 8.84 14.83 37.42 34.82 22.4499 5.39 8.85 7.80 9.70 24.27 22.59 16.13119 3.19 3.39 2.79 2.60 7.11 6.59 3.9183 1.29 1.53 1.40 3.03 8.91 8.23 4.9497 19.11 24.33 19.68 25.36 65.38 60.78 27.93
81,87 0.95 1.11 0.92 1.53 3.85 3.58 1.8485 4.25 4.96 3.96 4.66 15.75 14.47 7.76136 0.42 0.52 1.01 0.94 2.76 1.86 1.10
77,110 16.07 17.49 15.73 27.19 71.68 66.57 36.4582, 151 1.48 1.22 1.43 2.13 5.76 5.34 2.93135,144 2.99 3.40 3.03 5.00 13.26 12.31 7.09
107 1.53 1.68 1.46 1.88 5.10 4.73 3.04123,149 13.82 15.02 14.47 23.02 57.96 53.94 27.14
118 19.39 20.33 17.55 20.83 54.57 50.69 29.48134 1.35 2.05 1.55 2.22 7.92 7.26 2.23146 7.90 8.78 7.53 8.27 20.43 19.03 14.59
132,105,153 71.99 78.02 70.09 77.21 191.53 178.38 101.91141 6.73 7.73 6.39 11.84 31.15 28.92 18.29
137,130,176 2.53 2.86 2.36 3.02 8.07 7.49 3.83163,138 49.08 53.72 46.07 53.02 131.91 122.84 77.02
158 1.88 2.14 1.77 1.80 4.62 4.29 2.12129,178 4.68 5.53 4.47 5.49 14.34 13.33 8.62187,182 19.13 21.26 18.19 19.81 49.52 46.11 30.82
183 10.81 12.30 10.04 12.38 31.93 29.68 15.87128 4.46 4.68 3.94 4.72 12.43 11.54 7.78185 1.81 2.08 1.67 2.26 6.19 5.74 3.25174 6.31 7.41 6.06 10.81 27.87 25.90 15.24177 6.91 7.80 6.51 9.13 23.79 22.10 8.27
202,171,156 8.49 9.74 7.71 8.97 23.74 22.04 13.47157,200 3.14 3.68 2.93 3.24 8.74 8.11 5.72172,197 3.05 3.35 2.83 4.14 10.73 9.97 7.62
180 31.01 35.42 28.45 40.14 103.76 96.44 66.06193 26.16 30.81 20.23 10.80 32.11 29.66 16.79191 0.96 0.96 0.90 1.07 2.68 2.49 1.23199 ND ND ND ND 5.80 ND 2.98
170,190 12.91 15.07 11.35 17.52 48.71 45.12 28.40198 0.77 0.93 0.70 0.81 2.21 2.05 1.82201 7.59 9.04 6.86 8.88 23.40 21.73 20.95
203,196 17.10 20.34 14.96 16.79 46.11 42.74 30.77189 0.39 0.47 0.34 0.44 1.31 1.21 0.79
208,195 6.76 8.44 6.29 7.96 20.53 19.08 21.83207 1.31 1.66 1.29 1.29 3.20 2.98 3.55194 3.88 4.75 3.44 5.19 15.02 13.89 11.16205 0.45 0.52 0.40 0.43 1.32 1.21 0.80206 8.68 11.52 8.26 10.02 25.48 23.70 37.98209 4.30 5.74 4.35 5.05 12.34 11.51 19.19
Total PCBs 535 613 511 682 1794 1660 1024Recovery
14 196% 211% 193% 188% 376% 354% 260%65 NM NM NM NM NM NM NM166 82% 79% 78% 75% 91% 89% 91%
101

B-3. PCB concentrations in Channel Catfish (ng/g) from Spring 2002 Core Study
Field ID 4 CORE CCR 4 CORE WHOLE FISH 5 CORE CCF 5 CORE CCR 5 CORE WHOLE FISH 5 CORE WHOLE FISH*Collected Spring 2002 Spring 2002 Spring 2002 Spring 2002 Spring 2002 Spring 2002Zone 4 4 5 5 5 5Description Remains Composite Whole Fish Fillet Composite Remains Composite Whole Fish Whole FishReplicate analysis?Analyzed by CBL CBL CBL CBL CBL CBLLipid Content (%) 9.5% 9.0% 3.0% 10.8% 10.1% 10.1%
1 5.06 4.82 ND 0.223 10.39 10.18 0.76 1.84 1.75 4.45
4,10 1.58 1.52 0.21 0.72 0.67 1.707,9 0.14 0.14 0.03 0.15 0.14 0.366 0.03 0.03 0.02 0.13 0.12 0.30
8,5 31.55 30.11 2.35 8.80 8.23 20.8019 0.64 0.61 0.10 0.41 0.38 0.96
12,13 0.15 0.15 0.03 0.21 0.19 0.4818 3.95 3.83 0.74 3.86 3.58 9.0317 2.77 2.67 0.47 2.08 1.94 4.8924 ND ND 0.03 0.20 0.18 0.46
16,32 4.94 4.73 0.45 2.04 1.90 4.8029 0.15 0.15 0.04 0.18 0.17 0.4226 0.97 0.91 0.15 0.36 0.34 0.8825 ND ND ND ND ND ND
31, 28 14.28 13.59 0.90 3.35 3.14 7.9333,21,53 5.16 4.97 0.70 3.31 3.08 7.77
51 3.22 3.07 0.19 0.74 0.69 1.7522 1.22 1.13 0.16 0.46 0.44 1.1145 7.78 7.45 0.79 2.91 2.73 6.9046 6.75 6.40 0.43 1.28 1.21 3.0652 20.75 19.83 1.53 5.53 5.18 13.0949 25.60 ND ND ND ND ND
47,48 28.48 27.25 2.86 6.41 6.09 15.5144 15.00 14.29 1.31 4.68 4.39 11.09
37,42 12.71 12.11 1.07 3.95 3.70 9.3541,64,71 20.35 19.45 1.94 7.69 7.18 18.14
40 3.70 3.52 0.30 1.18 1.10 2.77100 5.54 5.29 0.49 1.75 1.64 4.1563 3.59 3.41 0.34 1.20 1.13 2.8574 15.66 14.88 1.32 4.90 4.59 11.60
70,76 5.24 5.02 0.40 1.57 1.47 3.7166,95 62.25 59.35 5.32 19.39 18.15 45.90
91 8.64 8.27 0.89 3.18 2.98 7.5456,60/92,84 37.20 35.29 2.91 9.67 9.07 22.96
89 93.19 87.81 4.64 16.11 15.10 38.19101 37.57 36.01 3.29 12.00 11.23 28.4099 26.26 25.22 2.82 10.07 9.43 23.85119 8.24 7.79 0.65 2.21 2.08 5.2583 9.99 9.47 0.72 2.21 2.08 5.2797 46.88 44.93 5.63 23.50 21.93 55.37
81,87 3.30 3.15 0.29 1.01 0.94 2.3985 13.89 13.26 1.13 3.94 3.69 9.34136 2.07 1.94 0.17 0.67 1.05 2.59
77,110 64.85 61.92 6.29 21.50 20.16 51.0182, 151 5.48 5.21 0.45 1.65 1.55 3.92135,144 12.41 11.86 1.09 3.86 3.62 9.15
107 5.54 5.28 0.55 1.99 1.87 4.72123,149 45.95 44.02 5.06 17.68 16.57 41.92
118 52.87 50.46 4.14 15.21 14.23 35.98134 6.67 6.21 0.60 1.86 1.75 4.43146 24.81 23.76 2.89 10.30 9.65 24.40
132,105,153 174.21 166.76 14.37 67.53 62.85 158.52141 33.57 32.00 2.75 9.70 9.09 22.98
137,130,176 7.21 6.86 0.82 2.92 2.73 6.91163,138 132.42 126.72 12.89 46.45 43.50 109.99
158 3.85 3.67 0.45 1.50 1.41 3.57129,178 15.35 14.66 1.72 6.45 6.04 15.25187,182 53.53 51.19 6.26 22.36 20.94 52.96
183 29.06 27.70 3.02 10.92 10.22 25.85128 13.61 13.01 1.09 4.06 3.80 9.60185 6.33 6.01 0.56 1.91 1.79 4.53174 27.27 26.03 2.73 9.87 9.24 23.38177 16.08 15.28 2.21 7.99 7.48 18.92
202,171,156 25.77 24.51 2.60 9.72 9.09 22.99157,200 11.00 10.46 1.36 6.00 5.60 14.12172,197 14.84 14.10 1.39 5.06 4.73 11.97
180 122.00 116.24 10.45 38.25 35.80 90.52193 40.96 38.47 2.29 8.73 8.17 20.64191 2.31 2.20 0.20 0.74 0.69 1.75199 5.00 ND 1.94 4.31 ND ND
170,190 56.48 53.59 4.13 15.49 14.49 36.63198 3.85 3.64 0.41 1.53 1.43 3.62201 41.38 39.27 4.50 16.87 15.79 39.90
203,196 63.36 60.01 6.31 24.33 22.74 57.46189 1.70 1.61 0.14 0.53 0.49 1.25
208,195 46.47 43.93 5.88 22.77 21.29 53.79207 7.43 7.03 1.27 5.07 4.74 11.96194 24.80 23.40 1.69 6.57 6.14 15.53205 1.82 1.71 0.12 0.45 0.42 1.06206 83.71 79.00 9.76 38.24 35.73 90.27209 40.84 38.61 5.99 22.37 20.93 52.91
Total PCBs 1932 1810 179 669 622 1572Recovery
14 420% 404% 85% 184% 176% 447%65 NM NM NM NM NM NM166 97% 96% 43% 49% 49% 126%
*Transformed value to meet average recovery
102

B-4. PCB concentrations in Channel Catfish (ng/g) from Spring 2002 Variability Study
Field ID 2CC CC1F 2CC CC2F 2CC CC3F 2CC CC4F 2CC CC5F 2CC CC6F 2CC CC1-6FCollected Spring 2002 Spring 2002 Spring 2002 Spring 2002 Spring 2002 Spring 2002 Spring 2002Zone 2 2 2 2 2 2 2Description Individual Fillet Individual Fillet Individual Fillet Individual Fillet Individual Fillet Individual Fillet Composite filletReplicate analysis?Analyzed by CBL CBL CBL CBL CBL CBL CBLFish Mass (g) 1133 977 952 903 1190 622Fish Length (mm) 470 474 480 458 514 419Fish Sex F M M F M MAverage Fish Age (yrs) 10 9 9 9 14 7Lipid Content (%) 6.2% 6.8% 5.4% 6.9% 1.9% 3.7% 3.4%
1 6.01 1.68 0.23 0.15 0.82 0.42 0.203 5.88 9.42 5.34 4.28 3.56 1.33 3.03
4,10 1.95 2.89 1.73 3.06 1.10 1.52 2.357,9 0.42 0.52 0.19 0.18 0.31 0.20 0.286 0.25 0.36 0.15 0.10 0.21 0.12 0.18
8,5 21.25 22.44 14.03 15.74 11.65 9.10 15.9719 0.47 0.74 0.34 0.36 0.27 0.38 0.39
12,13 0.65 0.47 0.19 0.26 0.30 0.20 0.3518 12.47 12.72 6.21 5.91 6.05 4.99 7.0317 4.64 5.02 2.47 2.74 2.57 2.37 3.5324 0.16 0.50 0.19 0.24 0.13 0.20 0.21
16,32 3.75 7.38 2.61 3.72 2.57 3.21 4.1629 0.62 0.44 0.22 0.22 0.32 0.20 0.2926 0.55 0.39 0.26 0.45 0.36 0.23 0.5525 ND 1.06 ND ND 0.58 ND ND
31, 28 7.54 8.66 3.77 5.55 4.27 4.01 7.8033,21,53 8.68 8.70 4.34 5.57 4.51 3.98 6.30
51 1.18 1.94 1.05 1.86 0.75 1.23 1.6522 0.78 2.40 0.65 0.94 0.60 0.56 1.3045 7.24 6.94 4.04 5.68 3.69 3.77 5.3246 2.56 2.27 1.77 3.41 4.56 1.71 3.5752 8.18 9.30 5.53 8.03 6.36 4.62 8.3749 ND ND ND ND ND ND ND
47,48 27.87 19.77 7.20 7.03 20.97 11.43 19.6444 3.14 10.90 4.10 9.41 3.46 6.18 7.82
37,42 5.47 8.56 5.16 8.06 4.81 5.32 7.7241,64,71 10.78 15.93 8.21 11.40 12.64 8.32 13.01
40 1.94 1.98 0.94 1.66 1.42 1.03 1.71100 4.30 3.32 1.98 2.46 3.32 1.93 3.2163 1.65 1.36 0.69 1.15 1.90 0.84 1.6574 11.53 9.50 5.30 7.06 9.03 5.28 9.06
70,76 3.41 3.23 1.95 3.17 2.08 2.03 3.2366,95 31.81 32.33 18.73 31.47 23.87 19.81 35.19
91 4.88 4.04 2.92 4.17 3.59 2.76 4.6656,60/92,84 19.17 23.05 15.42 21.49 18.15 14.05 23.81
89 33.86 38.05 16.73 49.79 4.18 31.50 41.03101 21.77 16.14 12.24 16.36 17.61 11.03 19.1299 18.23 9.83 7.97 10.32 17.48 7.15 14.30
119 4.49 4.12 2.86 4.81 4.28 2.74 5.4483 3.62 3.14 2.45 3.53 3.18 2.19 3.7597 51.55 34.79 21.25 29.19 35.14 22.77 22.39
81,87 0.87 1.74 1.07 1.63 1.61 1.06 1.6385 8.47 4.77 4.39 5.25 10.77 4.14 7.88
136 1.06 0.85 0.47 1.36 0.22 0.68 0.9777,110 8.28 27.29 17.54 29.43 21.13 19.70 27.0182, 151 2.79 2.20 1.71 2.58 3.03 1.76 2.92135,144 7.38 4.54 3.99 5.75 6.00 3.76 6.39
107 2.36 1.88 1.53 2.09 3.56 1.44 2.72123,149 25.61 24.20 16.36 26.08 16.14 17.85 24.84
118 30.86 18.43 15.34 21.91 34.32 15.38 29.51134 4.56 3.35 2.51 3.26 3.82 2.13 4.40146 18.44 9.22 7.16 9.30 17.13 6.70 13.41
132,105,153 131.31 89.16 60.89 87.88 117.68 67.45 107.35141 24.59 9.12 5.03 6.59 29.79 6.68 16.43
137,130,176 2.64 3.26 2.07 3.72 2.58 2.56 3.41163,138 87.12 55.72 43.71 56.17 98.06 41.91 76.23
158 4.00 2.14 1.62 1.91 3.81 1.50 2.88129,178 11.51 6.11 4.49 5.62 9.96 4.45 8.50187,182 40.76 23.17 17.30 21.83 36.83 16.83 30.74
183 26.00 12.52 9.80 12.56 25.60 9.61 19.21128 9.42 4.54 3.78 4.98 12.47 3.36 7.75185 4.42 2.36 1.69 2.25 3.86 1.92 3.34174 20.77 8.63 4.95 7.19 17.36 6.72 12.91177 4.13 8.93 3.41 9.94 2.03 7.58 7.57
202,171,156 18.94 8.79 6.93 9.25 18.50 6.88 14.06157,200 8.53 3.68 2.51 3.36 5.78 2.65 5.01172,197 9.10 3.39 2.05 2.79 9.68 2.71 6.22
180 85.90 35.26 22.20 30.39 85.48 29.81 60.03193 18.73 13.95 11.83 19.58 31.00 14.12 26.13191 2.16 1.09 0.80 1.03 2.35 0.82 1.71199 5.87 ND ND ND 2.89 ND 3.11
170,190 37.27 13.57 8.96 12.20 39.84 11.47 26.36198 2.15 0.78 0.52 0.74 1.93 0.63 1.42201 23.22 7.46 4.20 5.97 18.93 5.97 13.74
203,196 40.79 15.91 10.81 15.33 35.63 13.28 27.79189 1.06 0.37 0.44 0.32 1.05 0.32 0.67
208,195 25.34 6.32 3.91 5.52 14.34 5.07 12.31207 5.39 1.18 0.61 0.94 2.55 0.83 2.24194 12.48 3.73 1.98 2.90 12.29 3.54 8.12205 0.97 0.43 0.32 0.46 0.86 0.40 0.80206 37.00 6.80 3.28 5.34 18.60 6.40 16.65209 19.29 3.19 1.51 2.62 7.91 3.33 8.25
Total PCBs 1186 796 505 739 1030 554 962Recovery
14 295% 238% 158% 224% 138% 143% 243%65 NM NM NM NM NM NM NM
166 84% 68% 57% 75% 94% 65% 97%
103

B-4. PCB concentrations in Channel Catfish (ng/g) from Spring 2002 Variability Study
Field ID 4CC CC1F 4CC CC2F 4CC CC3F 4CC CC4F 4CC CC5F 4CC CC1-5F 5SED CC1FCollected Spring 2002 Spring 2002 Spring 2002 Spring 2002 Spring 2002 Spring 2002 Spring 2002Zone 4 4 4 4 4 4 5Description Individual Fillet Individual Fillet Individual Fillet Individual Fillet Individual Fillet Composite fillet Individual FilletReplicate analysis?Analyzed by CBL CBL CBL CBL CBL CBL CBLFish Mass (g) 420 401 337 394 376 472Fish Length (mm) 385 375 338 326 365 385Fish Sex M M M F F FAverage Fish Age (yrs) 7 8 11 10 9 6Lipid Content (%) 2.8% 1.8% 5.4% 2.5% 2.9% 3.1% 2.5%
1 0.66 0.46 0.10 0.50 0.20 0.19 0.743 0.50 1.89 1.70 3.08 2.64 5.19 2.31
4,10 0.85 0.29 0.39 0.59 0.49 0.76 0.947,9 0.21 0.11 0.16 0.09 0.08 0.16 0.166 0.14 0.06 0.15 0.01 ND 0.08 0.08
8,5 9.12 7.69 13.04 7.94 10.07 14.04 8.0119 0.37 0.21 0.44 0.17 0.19 0.30 0.24
12,13 0.25 0.06 0.17 0.17 0.14 0.22 0.1718 4.74 3.02 3.31 2.57 2.23 4.42 4.4217 2.48 1.10 2.24 1.21 1.30 2.40 2.0524 0.23 0.99 0.19 0.09 0.16 0.20 0.18
16,32 3.51 2.90 3.70 1.27 1.97 2.92 2.3329 0.19 0.08 0.12 0.16 0.12 0.24 0.1926 0.28 0.13 0.22 ND 0.27 0.37 0.1125 ND ND ND 0.56 ND ND ND
31, 28 3.82 7.20 3.96 2.81 3.74 4.44 3.0433,21,53 4.73 2.38 3.72 2.31 2.45 4.51 3.30
51 1.41 1.98 1.72 0.45 1.12 1.56 1.1422 0.73 0.52 1.00 0.35 0.52 0.70 0.4945 3.46 3.08 3.40 2.43 3.42 4.57 3.0846 1.52 3.88 2.87 1.84 2.23 3.36 1.3852 8.01 8.01 5.83 3.81 5.76 9.25 6.2949 ND ND ND ND ND ND ND
47,48 11.91 0.99 4.62 11.34 12.04 17.32 6.7844 6.95 8.14 5.93 1.87 6.23 7.61 4.92
37,42 5.89 6.55 3.60 2.54 5.72 5.95 4.4041,64,71 10.22 10.29 8.64 6.62 8.70 12.24 8.86
40 1.27 1.53 1.49 0.86 1.14 1.66 0.95100 1.74 2.88 1.42 2.10 2.10 3.16 1.7363 0.82 1.87 0.77 1.18 1.21 1.70 0.8674 5.14 8.16 3.91 4.98 5.84 8.15 5.04
70,76 1.70 1.13 1.28 1.00 1.56 1.95 1.0866,95 24.65 26.64 17.42 13.18 23.77 31.36 19.52
91 3.31 4.08 2.33 2.40 3.63 4.83 3.1956,60/92,84 10.23 14.35 8.90 9.22 12.23 16.50 10.08
89 26.51 9.79 9.06 5.86 33.05 31.77 18.21101 14.17 12.60 8.93 12.20 13.65 20.60 12.7499 8.72 13.33 5.22 11.53 12.39 16.48 9.27
119 2.41 4.53 2.45 2.15 2.94 3.87 2.0783 2.45 2.40 1.21 2.04 3.34 4.06 2.2497 25.94 19.40 11.37 18.56 22.80 35.26 26.07
81,87 1.27 1.62 0.89 0.79 1.38 1.86 1.1685 4.09 6.33 2.79 4.99 5.85 7.59 4.11
136 0.83 0.49 0.71 0.19 0.62 0.91 0.4777,110 24.28 30.32 15.87 15.10 29.98 36.54 22.6082, 151 1.70 2.28 0.86 1.71 1.98 2.97 1.77135,144 4.09 4.82 2.50 3.89 4.98 6.99 3.84
107 1.65 2.67 1.00 2.09 2.26 3.19 1.84123,149 18.78 21.42 11.83 12.44 21.14 29.19 19.39
118 16.00 24.40 9.49 19.54 22.95 29.70 14.61134 1.45 0.98 0.65 1.54 1.81 2.67 1.94146 7.72 8.98 4.37 12.36 11.25 16.63 9.50
132,105,153 61.64 61.89 34.51 78.45 62.61 118.75 67.21141 8.71 11.46 5.96 16.02 12.23 22.25 9.96
137,130,176 2.76 2.41 1.60 1.95 3.48 4.64 2.76163,138 42.73 45.74 24.16 61.30 60.22 88.43 45.31
158 1.48 1.43 1.07 1.92 1.76 2.67 1.61129,178 5.14 4.79 2.75 7.77 6.65 10.73 5.91187,182 16.47 19.56 9.86 28.56 23.90 37.21 21.62
183 8.92 10.24 5.14 15.23 13.01 20.69 9.80128 4.04 4.38 2.21 5.79 5.41 8.03 3.72185 1.95 1.80 1.15 2.71 2.46 4.09 1.86174 8.63 8.95 5.46 12.14 11.85 19.09 9.63177 7.53 7.10 4.11 2.27 10.04 12.14 7.66
202,171,156 7.27 8.07 4.22 11.58 10.88 16.22 8.11157,200 3.54 2.98 2.04 5.81 5.09 7.48 4.57172,197 3.77 4.62 2.26 6.82 5.76 9.38 4.30
180 32.77 38.12 18.40 59.51 48.39 80.70 35.99193 9.98 12.43 8.18 11.20 11.97 18.11 9.22191 0.65 0.93 0.40 1.15 0.99 1.60 0.69199 2.84 ND 2.17 3.25 3.25 4.61 3.49
170,190 14.47 16.72 6.42 23.50 19.92 34.73 13.88198 1.03 1.00 0.63 1.73 1.69 2.29 1.20201 10.87 11.54 6.54 19.80 18.26 25.90 13.41
203,196 16.49 17.82 9.57 29.86 26.82 39.59 18.69189 0.39 0.44 0.25 0.70 0.66 1.00 0.48
208,195 13.03 10.55 1.47 21.85 21.43 28.16 15.63207 2.40 1.66 1.48 4.23 4.00 4.80 3.16194 5.80 5.43 3.12 10.17 8.22 13.69 5.69205 0.49 0.37 0.23 0.68 0.61 0.96 0.41206 22.09 16.97 12.23 37.88 37.22 47.28 25.94209 11.79 7.77 6.68 20.43 20.71 24.05 13.75
Total PCBs 623 636 382 721 775 1132 626Recovery
14 145% 130% 629% 109% 154% 180% 137%65 NM NM NM NM NM NM NM
166 67% 92% 71% 66% 79% 94% 73%
104

B-4. PCB concentrations in Channel Catfish (ng/g) from Spring 2002 Variability Study
Field ID 5SED CC2F 5SED CC3F 5SED CC4F 5SED CC5F 5SED CC1-5FCollected Spring 2002 Spring 2002 Spring 2002 Spring 2002 Spring 2002Zone 5 5 5 5 5Description Individual Fillet Individual Fillet Individual Fillet Individual Fillet Composite filletReplicate analysis?Analyzed by CBL CBL CBL CBL CBLFish Mass (g) 357 589 174 513Fish Length (mm) 360 387 275 390Fish Sex M F M MAverage Fish Age (yrs) 6 7 4 8Lipid Content (%) 2.8% 5.1% 3.3% 3.8% 3.5%
1 0.14 0.12 0.77 0.16 0.193 0.93 1.32 5.68 0.66 0.44
4,10 0.35 0.53 0.40 0.59 0.277,9 0.05 0.05 0.02 0.10 0.056 0.01 0.01 0.06 0.09 0.02
8,5 3.50 5.29 2.37 4.06 3.3819 0.13 0.18 0.10 0.23 0.11
12,13 0.06 0.06 0.06 0.10 0.0418 1.48 1.53 0.45 1.97 1.1817 0.76 0.96 0.34 1.05 0.6524 0.06 0.06 0.03 0.09 0.05
16,32 0.73 0.91 0.22 1.06 0.5829 0.07 0.07 0.05 0.09 0.0526 ND 0.21 0.11 0.09 0.0925 ND ND ND ND ND
31, 28 1.11 1.82 0.69 1.29 1.2933,21,53 1.21 1.50 0.41 1.84 0.97
51 0.30 0.50 0.07 0.35 0.3022 0.19 ND 0.47 0.26 ND45 1.27 1.84 0.75 1.48 1.1846 0.67 0.91 0.44 0.74 0.5852 2.64 3.81 0.84 3.20 2.5449 ND ND ND ND ND
47,48 2.76 6.73 0.95 5.28 4.2544 1.87 3.27 0.37 2.39 1.83
37,42 1.61 2.72 0.33 1.90 1.6141,64,71 3.28 4.84 0.88 3.99 2.94
40 0.40 0.77 0.24 0.64 0.47100 0.80 1.17 0.42 0.95 0.7063 0.38 0.84 0.26 0.68 0.4474 1.98 3.10 0.77 2.58 1.91
70,76 0.29 1.01 0.24 0.98 0.5566,95 7.75 12.53 2.80 10.53 8.20
91 1.06 2.30 0.53 1.67 1.3656,60/92,84 4.15 6.92 1.87 5.50 3.94
89 5.71 13.28 2.98 8.08 6.88101 5.87 8.75 2.40 6.78 5.5999 4.85 6.77 1.98 5.24 4.30
119 1.01 1.63 0.54 1.24 0.9083 0.97 1.79 0.38 1.26 0.9197 9.35 14.07 2.98 11.34 8.88
81,87 0.53 0.73 0.11 0.49 0.4185 1.80 2.70 0.71 2.01 1.86
136 0.26 0.37 0.13 0.47 0.2677,110 9.71 16.19 1.34 10.84 8.8582, 151 0.75 1.16 0.34 0.89 0.73135,144 1.69 2.69 0.94 2.06 1.67
107 0.91 1.44 0.26 1.00 0.79123,149 8.93 13.32 3.58 9.85 8.38
118 6.69 9.45 2.58 7.40 6.07134 0.92 1.45 0.35 1.22 0.75146 5.11 7.27 2.04 5.36 4.51
132,105,153 33.54 44.75 13.34 35.17 29.75141 4.19 6.74 1.85 4.77 4.06
137,130,176 1.38 2.09 0.54 1.42 1.21163,138 22.73 32.21 8.13 22.84 19.79
158 0.78 1.01 0.38 0.98 0.69129,178 2.78 4.33 1.21 2.92 2.55187,182 11.43 16.61 5.07 11.89 10.35
183 5.23 7.02 2.24 5.60 4.60128 2.01 2.87 0.82 1.93 1.64185 0.78 1.34 0.45 0.91 0.80174 4.32 6.81 2.33 4.78 4.15177 3.48 6.11 0.75 3.69 3.10
202,171,156 4.17 6.65 2.18 4.77 3.85157,200 2.32 3.65 1.17 2.29 1.99172,197 2.28 3.77 1.11 2.54 2.05
180 16.99 26.80 7.80 18.43 15.80193 3.70 5.43 1.43 4.86 3.49191 0.33 0.46 0.14 0.41 0.29199 2.32 3.47 2.47 ND 2.10
170,190 6.72 11.17 3.22 7.26 6.28198 0.60 1.14 0.40 0.66 0.60201 7.16 12.42 4.29 7.70 6.88
203,196 10.09 16.98 6.09 11.36 9.62189 0.23 0.35 0.15 0.22 0.18
208,195 8.34 16.27 6.95 9.41 8.87207 1.94 3.49 1.62 2.14 1.95194 2.68 5.44 1.38 2.97 2.63205 0.19 0.38 0.24 0.21 0.19206 13.08 27.22 11.90 15.29 14.99209 7.29 15.18 7.94 8.60 8.91
Total PCBs 290 463 145 328 277Recovery
14 98% 150% 123% 120% 101%65 NM NM NM NM NM
166 50% 78% 48% 68% 51%
105

B-5. PCB concentrations in White Perch (ng/g) from Fall 2001 Core Study
Field ID 2 CORE WPF 2 CORE WPF 2 CORE WPR 2 CORE Whole Fish 3 CORE WPF 3 CORE WPR 3 Core Whole Fish 4 CORE WPFCollected Fall 2001 Fall 2001 Fall 2001 Fall 2001 Fall 2001 Fall 2001 Fall 2001 Fall 2001Zone 2 2 2 2 3 3 3 4Description Fillet Composite Fillet Composite Remains Composite Whole Fish Fillet Composite Remains Composite Whole Fish Fillet CompositeReplicate analysis? rep A rep BAnalyzed by ANS ANS ANS ANS ANS ANS ANS ANSLipid Content (%) 4.6% 3.7% 6.4% 5.9% 5.3% 8.3% 7.6% 3.3%
1 ND ND ND ND ND ND ND ND3 0.99 0.92 0.60 0.68 1.57 2.35 2.19 0.91
4,10 0.12 0.10 0.13 0.13 0.15 0.19 0.18 0.107,9 0.05 0.04 0.06 0.06 0.10 0.12 0.11 0.066 ND ND ND 0.00 0.06 0.08 0.08 0.06
8,5 2.42 1.89 3.95 3.57 4.33 6.88 6.34 2.4519 0.25 0.18 0.40 0.36 0.42 0.70 0.64 0.21
12,13 0.07 0.04 0.10 0.09 0.18 0.21 0.20 ND18 1.17 0.82 1.45 1.36 2.55 3.93 3.64 1.3317 1.15 0.80 1.48 1.37 2.20 3.46 3.19 1.0624 0.06 0.05 0.08 0.07 0.10 0.16 0.14 0.05
16,32 1.84 1.52 2.52 2.34 4.19 6.95 6.37 1.8829 ND ND ND ND ND ND ND ND26 0.77 0.54 0.94 0.88 1.32 2.20 2.01 0.6925 0.42 0.31 0.53 0.50 0.77 1.24 1.14 0.44
31, 28 5.14 3.76 7.17 6.60 13.17 23.87 21.61 6.3233,21,53 3.03 2.23 4.32 3.97 7.43 12.82 11.68 2.73
51 1.05 0.76 1.48 1.36 3.24 5.33 4.89 0.9822 0.53 0.40 0.73 0.67 1.60 2.85 2.59 0.9845 1.88 1.36 2.80 2.55 3.28 5.14 4.75 1.3546 1.19 0.89 1.79 1.63 2.04 3.30 3.04 0.7952 6.29 4.57 ND 1.13 14.36 23.53 21.60 5.1549 6.26 4.49 8.36 7.74 13.92 22.85 20.97 4.83
47,48 9.15 6.66 8.64 8.49 21.36 36.15 33.03 6.6444 5.15 3.72 6.97 6.44 12.31 21.12 19.26 4.37
37,42 3.41 2.07 5.00 4.53 6.67 13.78 12.28 2.9541,64,71 7.05 6.98 13.65 12.27 22.62 38.70 35.31 7.59
40 1.77 1.27 2.29 2.13 3.77 6.52 5.94 1.29100 1.97 1.40 3.37 3.02 4.13 6.96 6.36 1.7363 0.56 0.41 0.79 0.73 1.06 1.88 1.71 0.7074 4.56 3.21 6.12 5.66 9.78 17.44 15.83 3.73
70,76 9.73 6.83 13.05 12.06 23.71 41.22 37.53 8.1366,95 19.68 18.88 26.88 25.30 41.97 72.96 66.42 16.71
91 3.48 2.43 5.00 4.57 6.64 11.09 10.15 2.1756,60/92,84 27.82 19.36 37.36 34.49 51.78 86.60 79.25 11.39
89 NA NA NA NA NA NA NA NA101 16.03 11.05 21.30 19.69 28.82 47.20 43.33 9.2799 10.95 7.63 15.04 13.85 19.31 33.27 30.32 6.37
119 NA NA NA NA NA NA NA NA83 1.79 1.22 2.61 2.38 3.25 6.26 5.63 1.0897 4.10 2.81 5.68 5.22 8.01 13.53 12.37 2.51
81,87 1.25 1.00 2.04 1.85 2.99 5.26 4.78 0.8585 3.55 ND ND 0.74 ND ND ND ND
136 2.28 1.56 3.20 2.93 4.04 6.61 6.07 1.2777,110 28.27 19.22 38.93 35.77 54.39 92.05 84.10 15.8782, 151 13.37 8.98 18.92 17.31 21.69 36.39 33.29 6.17135,144 6.32 4.22 9.08 8.29 10.33 17.39 15.90 2.79
107 2.34 1.57 3.60 3.26 4.29 7.55 6.86 1.34123,149 19.39 13.45 27.61 25.28 28.69 46.33 42.61 9.53
118 15.21 10.22 22.27 20.29 23.23 48.65 43.29 8.21134 0.00 0.00146 5.64 3.64 8.28 7.53 7.41 12.43 11.37 2.34
132,105,153 62.14 41.80 87.75 80.30 77.86 127.31 116.87 26.47141 3.15 2.20 4.86 4.41 4.76 7.91 7.25 1.51
137,130,176 2.22 1.57 3.37 3.06 3.30 5.65 5.15 1.08163,138 50.01 32.95 70.54 64.49 71.06 119.98 109.66 22.61
158 0.88 0.58 1.29 1.17 1.31 2.32 2.11 0.36129,178 5.27 3.53 7.91 7.18 7.40 12.75 11.63 2.35187,182 14.04 9.41 20.79 18.90 17.11 28.64 26.21 5.88
183 10.42 6.71 15.49 14.05 12.31 21.19 19.31 3.72128 5.41 2.64 7.88 7.08 8.52 15.36 13.92 2.47185 1.72 1.18 2.64 2.39 2.36 4.06 3.70 0.76174 6.42 4.39 9.75 8.84 10.38 17.75 16.20 3.25177 4.17 2.94 6.41 5.82 6.48 11.24 10.23 2.17
202,171,156 7.26 4.72 10.57 9.61 9.56 16.87 15.33 3.07157,200 2.97 1.98 3.56 3.34 4.20 7.25 6.61 0.92172,197 1.90 1.24 2.76 2.52 2.48 4.28 3.90 0.84
180 32.78 21.70 47.90 43.60 41.71 72.17 65.75 12.67193 4.75 ND 1.78 2.39 2.32 ND ND ND191 0.58 0.44 0.83 0.77 0.79 1.38 1.25 0.21199 0.18 0.13 0.29 0.26 0.31 0.53 0.49 0.13
170,190 21.05 13.00 29.31 26.76 28.14 50.53 45.80 8.44198 0.41 0.28 0.61 0.55 0.63 1.15 1.04 0.26201 8.77 5.86 13.13 11.92 12.11 21.20 19.28 4.54
203,196 12.60 8.12 18.70 16.96 15.49 27.59 25.04 5.18189 1.01 0.64 1.35 1.24 1.14 1.96 1.79 0.39
208,195 4.32 2.42 5.89 5.37 4.67 8.52 7.71 5.54207 0.61 0.42 0.89 0.81 0.79 1.31 1.20 0.41194 4.12 2.63 5.87 5.35 5.32 9.22 8.40 1.92205 0.27 0.16 0.30 0.29 0.28 0.48 0.44 0.16206 8.02 5.57 11.38 10.43 11.19 18.73 17.14 6.32209 0.48 0.34 0.63 0.58 0.60 0.93 0.86 0.45
Total PCBs 537 365 741 702 864 1474 1303 291Recovery
14 126% 113% 107% 113% 97% NM 97% 119%65 83% 73% NM 78% 74% 88% 81% 68%
166 83% 72% 92% 85% 80% 102% 91% 68%
106

B-5. PCB concentrations in White Perch (ng/g) from Fall 2001 Core Study
Field ID 4 CORE WPR 4 CORE Whole Fish* 5 CORE WPF 5 CORE WPR 5 CORE Whole FishCollected Fall 2001 Fall 2001 Fall 2001 Fall 2001 Fall 2001Zone 4 4 5 5 5Description Remains Composite Whole Fish Fillet Composite Remains Composite Whole FishReplicate analysis?Analyzed by ANS ANS ANS ANS ANSLipid Content (%) 8.0% 7.3% 7.2% 11.4% 10.3%
1 Sample Lost ND ND ND ND3 1.94 0.55 0.89 0.80
4,10 0.21 0.04 0.03 0.037,9 0.13 0.02 0.02 0.026 0.12 ND ND ND
8,5 5.20 1.44 1.48 1.4719 0.44 0.07 0.09 0.09
12,13 ND 0.03 0.03 0.0318 2.82 0.46 0.48 0.4817 2.25 0.42 0.44 0.4324 0.11 0.02 0.03 0.02
16,32 4.00 0.73 0.84 0.8129 ND ND ND ND26 1.48 0.31 0.32 0.3225 0.92 0.13 0.14 0.14
31, 28 13.42 2.28 2.67 2.5633,21,53 5.80 1.54 1.64 1.61
51 2.08 0.60 0.67 0.6522 2.08 0.28 0.29 0.2945 2.88 1.37 1.22 1.2646 1.69 0.62 0.63 0.6352 10.94 3.65 3.96 3.8849 10.26 3.55 3.91 3.81
47,48 14.11 5.09 5.79 5.6044 9.29 3.00 3.39 3.29
37,42 6.28 2.16 2.07 2.0941,64,71 16.11 5.60 6.55 6.29
40 2.74 1.06 1.24 1.20100 3.68 1.26 1.44 1.3963 1.49 0.27 0.33 0.3174 7.92 2.31 2.75 2.63
70,76 17.26 4.90 5.87 5.6166,95 35.50 11.88 16.99 15.62
91 4.61 1.97 2.21 2.1456,60/92,84 24.19 14.73 17.12 16.48
89 NA NA NA NA101 19.70 8.29 9.12 8.9099 13.53 6.54 7.54 7.27
119 NA NA NA NA83 2.29 1.60 1.79 1.7497 5.33 2.22 2.55 2.46
81,87 1.81 0.72 0.87 0.8385 ND ND ND ND
136 2.69 1.11 1.26 1.2277,110 33.71 16.19 18.26 17.7082, 151 13.10 6.38 7.42 7.14135,144 5.93 3.04 3.58 3.44
107 2.84 1.32 1.66 1.57123,149 20.24 9.04 10.03 9.76
118 17.44 7.46 8.88 8.50134146 4.97 3.43 4.22 4.01
132,105,153 56.23 28.46 31.80 30.90141 3.21 1.42 1.67 1.61
137,130,176 2.30 1.03 1.25 1.19163,138 48.03 23.34 26.97 25.99
158 0.76 ND ND ND129,178 5.00 2.61 3.11 2.98187,182 12.48 7.31 8.24 7.99
183 7.91 4.69 5.62 5.37128 5.24 2.62 3.31 3.12185 1.61 0.92 1.09 1.05174 6.91 3.16 3.78 3.61177 4.61 2.03 2.42 2.31
202,171,156 6.52 3.85 4.63 4.42157,200 1.95 1.92 2.21 2.13172,197 1.78 0.99 1.19 1.14
180 26.92 15.93 19.29 18.39193 ND 0.92 0.63 0.71191 0.44 0.28 0.36 0.34199 0.28 0.16 0.15 0.16
170,190 17.93 10.49 13.19 12.46198 0.54 0.34 0.40 0.39201 9.64 7.17 8.37 8.04
203,196 11.01 8.05 9.77 9.31189 0.83 0.44 0.56 0.52
208,195 11.77 11.05 12.49 12.10207 0.86 1.01 1.10 1.07194 4.08 2.36 2.94 2.78205 0.35 0.13 0.14 0.14206 13.43 15.25 17.13 16.62209 0.95 1.11 1.17 1.15
Total PCBs 619 299 348 335Recovery
14 119% NM NM NM65 68% NM NM NM
166 68% NM NM NM
*Based on Fillet/Whole Fish Ratio
107

B-6. PCB concentrations in White Perch (ng/g) from Fall 2001 Variability Study 1
Field ID 5 VAR1 WP1 5 VAR1 WP2 5 VAR1 WP3 5 VAR1 WP4 5 VAR1 WP5 5 VAR1 WP1-5FCollected Fall 2001 Fall 2001 Fall 2001 Fall 2001 Fall 2001 Fall 2001Zone 5 5 5 5 5 5Description Individual Fillet Individual Fillet Individual Fillet Individual Fillet Individual Fillet Fillet Composite Replicate analysis?Analyzed by ANS ANS ANS ANS ANS ANSFish Mass (g) 161.38 92.93 129.27 125.3 100.9Fish Length (mm) 223 186 203 199 190Fish Sex M M F M MAverage Fish Age (yrs) 6 3 7 6 6Lipid Content (%) 5.7% 2.8% 6.9% 4.9% 3.7% 7.2%
1 ND ND ND ND ND ND3 1.21 1.25 0.58 0.57 0.47 0.55
4,10 0.06 0.06 0.05 ND 0.03 0.047,9 0.03 0.04 0.03 0.01 0.02 0.026 ND ND ND ND ND ND
8,5 2.16 ND 1.71 0.68 1.25 1.4419 0.11 0.18 0.10 0.05 0.06 0.07
12,13 0.06 0.06 0.03 0.20 0.02 0.0318 0.68 1.19 0.54 0.15 0.52 0.4617 0.58 0.91 0.60 0.14 0.45 0.4224 0.04 0.06 0.03 ND 0.02 0.02
16,32 0.80 1.96 0.96 0.25 0.81 0.7329 ND ND ND ND ND ND26 0.45 0.64 0.33 0.20 0.34 0.3125 0.16 0.33 0.16 0.06 0.16 0.13
31, 28 1.55 5.45 3.19 0.56 2.78 2.2833,21,53 2.13 4.24 1.49 0.48 1.69 1.54
51 0.71 1.67 0.59 0.14 0.70 0.6022 0.28 0.61 0.32 ND 0.32 0.2845 1.78 2.66 1.27 0.56 1.27 1.3746 1.03 1.35 0.61 0.15 0.55 0.6252 5.76 9.25 3.43 1.18 3.77 3.6549 5.72 8.83 3.51 1.08 3.63 3.55
47,48 7.81 13.53 4.85 1.34 5.66 5.0944 4.29 7.67 2.97 0.88 3.19 3.00
37,42 3.29 5.34 2.04 0.64 2.25 2.1641,64,71 7.95 15.16 5.49 1.45 5.95 5.60
40 1.65 2.77 0.91 0.35 1.10 1.06100 1.86 3.07 1.17 0.29 1.24 1.2663 0.44 0.69 0.27 0.11 0.26 0.2774 2.97 5.76 2.47 0.63 2.47 2.31
70,76 6.07 13.44 5.32 1.25 5.12 4.9066,95 17.92 44.85 14.08 4.34 14.24 11.88
91 3.65 4.96 1.73 0.71 1.81 1.9756,60/92,84 23.61 40.35 13.43 4.57 14.48 14.73
89 NA NA NA NA NA NA101 15.20 22.22 7.06 2.71 8.14 8.2999 11.37 15.01 5.71 2.27 6.16 6.54
119 NA NA NA NA NA NA83 1.62 2.73 1.50 0.70 1.49 1.6097 3.86 6.17 1.88 0.63 2.20 2.22
81,87 1.08 2.23 0.66 0.16 0.72 0.7285 ND ND ND ND ND ND
136 2.08 3.06 0.99 0.33 1.04 1.1177,110 26.76 41.57 14.23 5.14 15.21 16.1982, 151 11.76 16.83 5.39 1.86 6.29 6.38135,144 5.57 8.38 2.63 0.89 2.85 3.04
107 2.51 3.38 1.08 0.45 1.16 1.32123,149 17.88 23.06 8.46 3.30 8.69 9.04
118 11.88 20.79 7.18 2.14 7.19 7.46134 ND ND ND ND ND ND146 6.48 6.85 2.89 1.70 3.19 3.43
132,105,153 57.81 65.87 25.05 11.38 27.84 28.46141 2.87 3.65 1.37 0.50 1.32 1.42
137,130,176 1.95 2.64 1.02 0.37 0.89 1.03163,138 43.24 58.21 20.21 8.07 23.05 23.34
158 0.65 1.05 0.34 0.11 0.36 ND129,178 5.39 5.96 2.20 1.02 2.52 2.61187,182 16.05 14.16 5.61 3.29 7.31 7.31
183 9.35 10.93 3.94 1.68 4.62 4.69128 4.57 7.13 2.00 0.84 2.60 2.62185 1.48 1.85 0.89 0.36 0.85 0.92174 6.06 7.90 2.93 1.05 2.92 3.16177 3.89 4.80 2.06 0.73 1.64 2.03
202,171,156 8.02 8.01 3.04 1.58 3.64 3.85157,200 4.62 3.46 1.36 0.93 1.68 1.92172,197 2.02 2.06 0.74 0.38 0.99 0.99
180 30.99 36.04 12.57 5.49 16.42 15.93193 ND 4.99 0.53 0.39 1.28 0.92191 0.43 0.67 0.21 0.08 0.30 0.28199 0.48 0.26 0.10 0.09 0.13 0.16
170,190 19.73 24.02 7.92 3.53 10.72 10.49198 0.86 0.51 0.22 0.19 0.28 0.34201 17.61 10.74 4.65 3.85 6.43 7.17
203,196 17.83 13.44 5.71 3.70 7.51 8.05189 0.89 0.85 0.33 0.22 0.43 0.44
208,195 31.68 12.64 6.07 7.07 8.57 11.05207 2.97 1.02 0.48 0.73 0.79 1.01194 4.96 4.19 1.65 0.98 2.26 2.36205 0.30 0.21 0.08 0.08 0.13 0.13206 42.91 14.39 6.94 9.79 11.79 15.25209 3.28 0.91 0.48 0.79 0.78 1.11
Total PCBs 568 693 255 115 291 299Recovery
14 116% 127% NM NM NM NM65 71% 79% NM NM NM NM
166 73% 81% NM NM NM NM
108

B-7. PCB concentrations in White Perch (ng/g) from Fall 2001 Variability Study 2
Field ID 5 VAR2 WP1 5 VAR2 WP2 5 VAR2 WP3 5 VAR2 WP4 5 VAR2 WP5 5 VAR2 WP6 5 VAR2 WP1-6FCollected Fall 2001 Fall 2001 Fall 2001 Fall 2001 Fall 2001 Fall 2001 Fall 2001Zone 5 5 5 5 5 5 5Description Individual Fillet Individual Fillet Individual Fillet Individual Fillet Individual Fillet Individual Fillet Fillet Composite Replicate analysis?Analyzed by ANS ANS ANS ANS ANS ANS ANSFish Mass (g) 84.27 75.03 55.79 66.25 44.88 27.39Fish Length (mm) 185 230 162 175 153 135Fish Sex M F F M M FAverage Fish Age (yrs) 4 3 2 5 3 2Lipid Content (%) 6.8% 2.6% 4.7% 5.1% 2.5% 1.4% 3.9%
1 ND 9.10 ND ND ND ND 0.413 0.85 3.91 1.68 2.03 0.22 0.80 0.64
4,10 0.05 0.62 0.04 0.07 0.03 0.05 0.067,9 0.03 0.47 0.02 0.03 0.02 0.03 0.046 0.07 0.78 ND ND 0.04 ND 0.06
8,5 2.10 13.43 2.50 5.83 ND ND ND19 0.14 ND 0.08 0.28 0.04 0.11 0.18
12,13 0.03 0.28 0.05 0.07 0.01 0.03 0.0318 0.80 3.08 0.61 1.42 0.38 0.54 0.9817 1.05 2.31 0.46 1.24 0.41 0.54 1.0524 0.06 0.22 0.02 0.08 ND 0.03 ND
16,32 1.47 3.32 0.91 2.84 0.56 0.94 1.6429 ND 0.09 ND ND ND 0.01 ND26 0.76 ND 0.39 1.00 0.33 0.34 0.9425 0.38 ND 0.18 0.46 0.17 0.18 0.52
31, 28 4.20 8.74 3.57 10.06 2.07 2.77 7.5133,21,53 2.51 3.68 1.38 5.09 0.88 1.84 3.11
51 0.82 1.02 0.40 2.32 0.17 0.66 1.1422 0.44 1.34 0.63 0.81 0.27 0.31 0.7645 1.86 1.14 0.91 3.77 0.48 1.17 1.2146 0.75 0.48 0.33 1.98 0.15 0.67 0.8152 5.76 6.28 2.69 12.10 1.98 3.85 7.2149 5.94 6.01 2.30 12.15 1.83 3.77 7.40
47,48 8.24 6.97 0.81 17.42 2.52 6.33 10.9044 4.81 4.61 2.40 17.90 1.85 3.28 5.74
37,42 3.80 2.99 1.72 ND 1.25 2.33 4.1441,64,71 9.42 6.78 3.71 21.59 2.88 6.22 10.61
40 1.70 1.64 0.74 4.27 0.50 1.15 1.78100 1.52 1.42 ND 4.70 0.25 1.23 1.9763 0.60 0.45 0.20 1.05 0.16 0.40 0.7274 3.92 3.30 2.05 9.10 1.40 2.77 5.66
70,76 7.41 7.02 3.76 20.09 3.04 6.08 12.8266,95 18.09 17.02 8.41 45.95 13.21 34.42 59.73
91 2.69 5.73 0.93 6.01 0.56 1.90 3.1056,60/92,84 20.63 6.12 ND 50.21 ND ND 25.93
89 NA NA NA NA NA NA NA101 10.15 7.86 3.95 24.95 2.26 8.34 14.2899 8.65 5.62 2.49 21.70 1.84 6.45 10.26
119 NA NA NA NA NA NA NA83 2.61 1.31 ND 7.11 0.38 1.23 1.6897 2.90 1.25 1.05 7.18 0.67 2.35 3.79
81,87 0.97 1.36 0.36 2.61 0.18 0.84 1.3585 ND 2.31 0.78 ND 0.48 1.30 3.07
136 1.31 ND 0.42 3.49 0.20 1.08 1.6577,110 20.85 14.25 7.65 51.40 4.02 16.09 22.9282, 151 7.15 5.22 2.15 19.14 1.15 6.21 7.97135,144 3.53 2.47 0.95 9.44 0.51 2.93 4.12
107 1.74 1.27 0.48 4.38 0.26 1.32 2.15123,149 9.89 10.48 3.22 31.74 1.68 8.54 11.94
118 9.54 4.97 3.68 29.91 2.16 8.48 14.98134 13.08 3.01 5.96 28.82 2.39 6.05 7.70146 3.75 4.09 1.04 12.38 0.52 2.54 4.59
132,105,153 32.03 31.99 11.56 90.12 5.48 26.41 44.05141 1.66 2.77 0.39 5.68 0.24 1.39 1.89
137,130,176 1.37 0.56 0.44 4.65 0.18 1.06 1.70163,138 26.79 21.22 10.52 84.55 4.21 22.71 34.53
158 ND 2.75 ND ND ND ND ND129,178 3.04 2.26 0.97 9.85 0.44 2.29 3.15187,182 7.16 7.27 2.23 21.11 0.94 5.49 7.53
183 4.84 4.34 1.39 15.11 0.62 4.00 5.84128 3.42 2.19 1.23 11.28 0.48 2.71 3.55185 1.14 0.70 0.23 4.35 0.12 0.72 1.06174 3.70 3.14 0.99 14.02 0.53 2.84 4.30177 2.55 2.13 1.10 9.68 0.37 2.12 2.97
202,171,156 4.33 3.23 1.23 12.97 0.62 3.02 2.78157,200 2.34 0.65 0.53 6.45 0.27 1.26 2.34172,197 1.14 ND 0.37 3.93 0.16 0.75 1.51
180 17.54 10.86 5.40 61.80 2.08 12.83 25.27193 0.65 11.44 0.16 1.61 0.12 0.44 0.49191 0.29 0.27 0.10 0.96 0.04 0.22 0.32199 0.25 ND 0.05 0.65 0.04 0.09 0.21
170,190 11.86 7.11 3.89 44.60 1.39 8.37 15.36198 0.49 0.15 0.11 1.28 0.07 0.18 0.42201 9.31 3.32 2.18 25.17 1.30 3.86 7.85
203,196 9.59 4.31 2.15 27.53 1.19 4.85 9.68189 0.52 0.37 0.16 1.71 0.07 0.36 0.68
208,195 15.56 3.32 3.16 36.86 2.27 4.13 11.67207 1.38 0.23 0.21 2.47 0.19 0.29 1.06194 2.94 1.18 0.84 11.18 0.34 1.61 4.05205 0.16 ND 0.06 0.75 0.02 0.10 0.26206 23.84 3.04 3.64 48.87 2.98 4.04 19.10209 1.67 0.30 0.27 3.16 0.21 0.26 1.14
Total PCBs 401 327 134 1079 83 277 506Recovery
14 NM 121% NM NM NM 113% 94%65 NM 79% NM NM NM 89% 49%
166 NM 90% NM NM NM 89% 68%
109

B-8. PCB concentrations in White Perch (ng/g) from Fall 2001 Variability Study 3
Field ID 5 VAR3 WP1 5 VAR3 WP2 5 VAR3 WP3 5 VAR3 WP5 5 VAR3 WP6 5 VAR3 WP1-6FCollected Fall 2001 Fall 2001 Fall 2001 Fall 2001 Fall 2001 Fall 2001Zone 5 5 5 5 5 5Description Individual Fillet Individual Fillet Individual Fillet Individual Fillet Individual Fillet Fillet Composite Replicate analysis?Analyzed by ANS ANS ANS ANS ANS ANSFish Mass (g) 91.98 68.24 52.24 51.11 53.32Fish Length (mm) 186 173 162 158 163Fish Sex M M F M FAverage Fish Age (yrs) 5 3 2 3 4Lipid Content (%) 3.1% 2.5% NA 3.0% 5.1% 2.9%
1 0.78 7.17 0.41 ND ND 0.303 1.90 ND 1.01 1.36 2.12 1.03
4,10 0.10 0.97 0.04 0.07 0.09 0.067,9 0.05 0.32 0.02 0.03 0.05 0.046 0.08 0.50 ND 0.03 0.20 0.04
8,5 5.00 10.70 ND ND 7.28 3.1919 0.32 ND ND 0.59 0.36 0.18
12,13 0.07 0.26 0.02 0.04 0.09 0.0518 1.86 3.78 0.65 0.97 2.11 0.9517 1.71 2.42 0.53 1.02 1.75 0.8324 ND 0.13 ND ND 0.12 0.06
16,32 3.44 3.99 1.15 1.83 3.97 1.6829 ND 0.08 ND ND ND 0.0126 1.33 ND 0.36 0.54 1.34 0.5825 0.61 ND 0.17 0.31 0.63 0.28
31, 28 10.94 5.33 2.63 5.07 12.60 4.7433,21,53 6.67 5.15 2.54 2.94 6.78 3.01
51 2.38 0.63 0.85 1.11 2.80 1.1422 1.14 1.42 0.32 0.58 1.17 0.5745 3.87 1.51 1.65 1.92 4.66 2.1546 2.28 0.60 0.69 1.16 2.54 1.0952 14.69 4.19 5.02 4.84 15.75 6.7249 14.68 4.83 4.46 4.84 15.31 6.48
47,48 21.40 6.10 6.52 7.91 21.34 9.5344 21.13 3.36 4.20 4.31 14.38 5.86
37,42 ND 2.47 2.75 3.20 10.73 4.1241,64,71 26.54 6.00 7.67 7.71 27.83 11.04
40 4.89 1.18 1.46 1.49 5.18 2.07100 4.67 1.28 1.37 1.64 4.92 2.0863 1.35 0.43 0.32 0.46 1.29 0.5574 10.66 2.20 2.48 3.75 10.89 4.32
70,76 21.73 4.25 5.56 8.32 23.72 9.3666,95 146.22 15.66 41.87 35.28 81.74 35.06
91 7.92 8.12 2.28 2.28 7.68 3.3556,60/92,84 62.53 8.40 16.67 9.71 62.48 22.19
89 NA NA NA NA NA NA101 31.63 5.39 9.64 10.25 32.34 14.0999 25.72 3.67 7.24 8.02 27.66 11.36
119 NA NA NA NA NA NA83 6.35 1.46 ND 2.06 8.41 3.1997 9.02 0.36 2.64 2.84 9.19 3.95
81,87 3.33 0.62 0.90 1.05 3.34 1.4085 ND 1.52 ND ND ND ND
136 4.44 ND 1.24 1.33 4.41 1.9077,110 66.16 11.31 19.73 19.99 66.39 28.9082, 151 25.12 4.48 6.66 7.86 24.30 10.62135,144 12.29 1.98 3.21 3.45 11.96 5.14
107 5.70 0.88 1.28 1.42 5.35 2.25123,149 29.01 7.36 9.64 10.88 30.92 14.38
118 27.78 1.33 7.92 11.05 29.40 13.17134 27.40 0.69 9.06 10.34 30.50 13.09146 9.75 3.06 3.03 2.83 10.08 4.48
132,105,153 84.27 25.61 25.62 31.55 89.75 42.00141 4.77 3.09 1.78 1.42 5.26 2.32
137,130,176 3.98 0.92 1.12 1.18 4.29 1.81163,138 76.09 15.87 22.54 28.01 80.91 36.75
158 ND ND ND ND ND ND129,178 8.27 ND 2.23 2.52 8.87 3.82187,182 19.13 7.07 5.48 6.79 20.44 9.68
183 14.23 3.56 3.89 4.48 14.59 6.59128 10.40 1.91 2.64 3.12 9.98 4.40185 3.01 0.57 0.75 0.86 3.06 1.15174 11.08 2.45 3.13 3.63 12.48 5.16177 7.24 1.74 2.14 2.47 8.41 3.50
202,171,156 11.76 2.74 3.07 3.58 12.33 5.29157,200 5.46 0.22 1.42 ND 6.03 2.50172,197 3.01 ND 0.69 0.85 3.34 1.32
180 48.15 8.97 12.23 14.63 55.52 22.53193 1.95 8.44 0.64 ND 1.92 0.83191 0.99 0.10 0.21 0.25 0.92 0.38199 0.43 ND 0.12 0.11 0.60 0.21
170,190 34.03 6.01 8.07 9.83 38.10 14.97198 0.90 0.13 0.40 0.16 1.11 0.41201 17.41 3.80 4.37 3.98 22.01 8.46
203,196 21.24 4.42 5.05 5.31 25.23 9.75189 1.42 0.33 0.30 0.45 1.55 0.60
208,195 21.90 5.30 5.61 1.87 30.99 11.15207 1.79 0.46 0.45 0.22 2.24 0.92194 6.61 1.09 1.31 1.95 8.71 3.02205 0.35 0.09 0.09 0.12 0.59 0.18206 27.60 5.37 6.04 3.26 40.33 13.61209 1.62 0.97 0.38 0.20 2.55 0.88
Total PCBs 1136 269 320 341 1160 487Recovery
14 107% 74% 92% 105% 122% 107%65 108% 60% 69% 87% 105% 87%
166 112% 61% 64% 80% 109% 84%
110

B-9. PCB concentrations in White Perch (ng/g) from Spring 2002 Core Study
Field ID 2 CORE WPF 2 CORE WPR 2 CORE Whole Fish* 3 CORE WPF 3 CORE WPR 3 CORE Whole Fish 4 CORE WPF 4 CORE WPRCollected Spring 2002 Spring 2002 Spring 2002 Spring 2002 Spring 2002 Spring 2002 Spring 2002 Spring 2002Zone 2 2 2 3 3 3 4 4Description Fillet Composite Remains Composite Whole Fish Fillet Composite Remains Composite Whole Fish Fillet Composite Remains CompositeReplicate analysis?Analyzed by ANS ANS ANS ANS ANS ANS ANS ANSLipid Content (%) 3.7% 7.1% 6.0% 5.1% 7.9% 7.1% 5.1% 7.2%
1 ND sample lost ND 16.86 20.64 19.46 10.98 13.473 ND ND 10.00 12.10 11.44 8.21 8.69
4,10 1.41 2.30 1.78 1.90 1.86 1.27 1.167,9 ND ND 1.36 1.73 1.62 1.03 1.526 0.04 0.07 2.62 3.37 3.14 1.93 3.18
8,5 0.54 0.88 30.37 37.36 35.18 23.92 33.6319 ND ND 1.10 1.18 1.16 ND ND
12,13 ND ND 1.21 1.80 1.62 0.88 1.3718 0.68 1.10 13.74 17.64 16.42 12.64 17.7217 0.56 0.91 11.39 14.61 13.61 9.24 15.4524 0.16 0.26 0.24 0.25 0.25 0.20 0.21
16,32 1.32 2.14 14.81 18.34 17.24 12.37 16.2929 ND ND 0.16 0.18 0.18 0.12 0.1326 0.57 0.92 1.60 2.08 1.93 1.38 2.1025 0.32 0.51 ND 1.50 ND ND 1.29
31, 28 4.42 7.19 24.67 31.05 29.06 17.72 28.4833,21,53 0.44 0.71 21.84 27.70 25.87 18.26 25.53
51 0.91 1.48 2.75 3.13 3.01 2.39 2.9922 0.75 1.22 3.57 4.91 4.49 4.00 4.4245 0.69 1.12 5.30 6.48 6.11 5.11 6.6646 0.40 0.65 1.77 2.23 2.09 1.73 2.0152 5.72 9.30 14.68 18.70 17.45 13.67 19.3349 5.29 8.60 15.08 18.95 17.74 13.90 21.07
47,48 7.85 12.77 23.46 29.71 27.76 20.36 28.2944 4.63 7.54 13.25 16.66 15.60 12.18 18.46
37,42 1.93 3.14 9.77 12.70 11.79 9.48 14.6141,64,71 8.56 13.92 25.76 33.87 31.34 23.44 36.03
40 1.66 2.71 4.27 5.50 5.12 4.30 6.71100 1.47 2.39 4.38 5.29 5.01 3.90 5.6163 0.44 0.72 1.21 1.54 1.44 1.01 1.5574 4.17 6.79 9.51 15.13 13.37 6.78 10.10
70,76 7.62 12.39 21.28 29.42 26.87 14.48 20.5666,95 20.30 33.02 58.75 76.71 71.11 52.64 76.69
91 2.72 4.42 25.58 37.60 33.84 18.35 32.0256,60/92,84 10.92 17.76 25.78 18.46 20.77 12.33 42.61
89 NA NA NA NA NA NA NA101 12.38 20.14 18.68 24.66 22.79 16.88 23.5499 11.00 17.90 12.35 17.01 15.55 10.81 15.23119 NA NA NA NA NA NA NA83 1.49 2.42 4.04 5.65 5.15 ND 5.6897 3.33 5.41 1.79 2.31 2.15 1.70 3.03
81,87 3.68 5.99 2.22 2.96 2.73 14.53 2.5685 ND ND 6.95 10.01 9.06 5.28 7.65136 1.81 2.94 2.87 3.59 3.37 2.81 4.06
77,110 23.08 37.53 39.33 55.84 50.68 35.27 51.1682, 151 9.00 14.63 15.96 21.22 19.58 15.12 21.69135,144 4.17 6.79 6.65 8.68 8.05 6.67 9.51
107 2.09 3.39 2.60 3.54 3.25 2.59 3.60123,149 12.84 20.88 23.29 29.51 27.57 22.40 30.50
118 10.77 17.51 5.83 8.84 7.89 4.12 5.63134 8.44 13.72 2.47 3.82 3.40 2.14 3.47146 7.22 11.74 8.50 10.45 9.85 8.81 13.06
132,105,153 40.02 65.10 79.07 98.29 92.31 72.12 100.59141 1.88 3.05 13.03 16.90 15.69 11.61 18.26
137,130,176 ND ND 3.13 4.18 3.86 2.99 4.91163,138 32.36 52.63 58.52 77.35 71.48 51.15 75.08
158 2.02 3.29 ND ND ND ND ND129,178 3.20 5.20 6.48 8.69 8.00 6.04 9.96187,182 10.90 17.74 21.05 25.84 24.35 18.95 28.19
183 6.36 10.34 11.53 15.31 14.13 10.61 16.55128 3.90 6.34 6.77 10.38 9.25 5.95 8.91185 1.02 1.65 2.32 4.17 3.59 2.33 3.88174 4.30 6.99 9.63 13.19 12.07 8.84 14.95177 2.89 4.70 5.96 8.32 7.58 5.10 8.11
202,171,156 ND ND 9.27 13.47 12.15 8.16 12.59157,200 2.07 3.36 0.70 1.22 1.06 0.64 1.18172,197 1.67 2.72 ND ND ND ND ND
180 18.46 30.03 32.16 42.21 39.08 29.34 45.87193 21.98 35.76 30.59 38.78 36.23 26.77 43.90191 0.25 0.40 0.72 ND ND 0.34 0.57199 ND ND ND ND ND ND 2.10
170,190 13.33 21.68 23.51 31.01 28.67 20.60 31.81198 0.25 0.41 0.38 ND ND 0.39 0.67201 6.11 9.94 10.68 14.05 13.00 10.32 17.44
203,196 7.63 12.41 13.59 17.33 16.16 12.73 22.48189 0.86 1.40 1.32 1.78 1.63 1.38 3.61
208,195 6.34 10.32 11.83 14.24 13.49 12.99 25.40207 0.42 0.68 0.82 0.82 0.82 1.02 2.53194 2.58 4.20 4.12 5.20 4.87 3.56 6.57205 0.17 0.28 0.29 0.27 0.28 0.31 1.34206 6.55 10.66 9.80 11.28 10.82 12.87 22.34209 0.41 0.67 1.30 1.43 1.39 1.75 3.23
Total PCBs 406 660 942 1214 1128 828 1253Recovery
14 138% 138% 89% 81% NM 171% 418%65 94% 94% 68% 59% NM 55% 63%166 89% 89% 66% 56% NM 55% 63%
*Based on Fillet/Whole Fish Ratio
111

B-9. PCB concentrations in White Perch (ng/g) from Spring 2002 Core Study
Field ID 4 CORE Whole Fish 5 CORE WPF 5 CORE WPR 5 CORE Whole FishCollected Spring 2002 Spring 2002 Spring 2002 Spring 2002Zone 4 5 5 5Description Whole Fish Fillet Composite Remains Composite Whole FishReplicate analysis?Analyzed by ANS ANS ANS ANSLipid Content (%) 7.1% 4.6% 4.2% 4.3%
1 13.47 ND ND ND3 8.94 ND ND ND
4,10 1.24 ND ND ND7,9 1.47 0.02 ND ND6 3.03 0.02 0.06 0.05
8,5 32.83 0.59 0.93 0.8619 ND 0.37 0.48 0.46
12,13 1.32 ND ND ND18 17.31 0.78 1.16 1.0817 14.69 0.75 1.19 1.1024 0.21 0.15 0.25 0.23
16,32 16.09 1.68 2.62 2.4429 0.13 ND ND ND26 2.02 0.68 1.09 1.0125 ND 0.49 0.70 0.66
31, 28 27.24 1.72 3.21 2.9233,21,53 24.95 ND ND ND
51 2.98 1.78 2.79 2.6022 4.51 0.97 1.68 1.5445 6.59 0.83 1.36 1.2546 2.03 0.45 0.69 0.6452 18.86 8.43 13.46 12.4849 20.33 8.54 14.22 13.12
47,48 27.67 12.92 21.12 19.5344 17.81 6.40 11.29 10.34
37,42 14.06 3.21 6.42 5.7941,64,71 34.69 11.02 21.53 19.48
40 6.44 2.08 3.67 3.36100 5.45 2.48 4.39 4.0263 1.49 0.58 1.07 0.9774 9.77 6.08 11.46 10.41
70,76 20.04 13.94 24.50 22.4566,95 74.45 22.81 44.04 39.91
91 30.26 4.08 7.34 6.7056,60/92,84 37.55 17.91 33.14 30.17
89 NA NA NA NA101 23.01 18.07 29.64 27.3999 14.86 15.79 19.81 19.04119 NA NA NA NA83 ND 4.14 8.70 7.8197 2.85 4.82 8.51 7.79
81,87 5.37 5.69 10.72 9.7485 7.43 ND ND ND136 3.95 2.58 4.64 4.24
77,110 49.70 33.98 61.58 56.2182, 151 21.11 12.17 22.55 20.53135,144 9.27 5.84 10.99 9.99
107 3.52 2.61 5.87 5.24123,149 29.94 24.43 39.33 36.43
118 5.52 20.31 33.63 31.04134 3.32 16.64 38.14 33.95146 12.64 11.76 26.88 23.93
132,105,153 98.35 72.58 117.55 108.81141 17.52 3.22 6.03 5.48
137,130,176 4.68 ND ND ND163,138 72.80 59.57 98.05 90.57
158 ND 4.88 10.22 9.18129,178 9.49 5.06 9.99 9.03187,182 27.28 20.70 37.38 34.13
183 15.89 11.01 21.69 19.61128 8.61 6.58 13.93 12.50185 3.69 1.40 4.00 3.49174 14.19 7.99 14.98 13.62177 7.77 4.73 9.14 8.28
202,171,156 12.11 8.89 18.09 16.29157,200 1.11 3.27 7.62 6.77172,197 ND 2.63 6.21 5.51
180 44.04 31.26 62.44 56.37193 41.86 39.89 66.80 61.57191 0.54 0.56 0.91 0.84199 ND ND 0.46 ND
170,190 30.60 23.94 48.44 43.67198 0.64 0.45 1.04 0.93201 16.56 12.21 26.10 23.39
203,196 21.21 14.15 31.87 28.41189 3.26 0.69 0.92 0.88
208,195 23.66 3.38 ND ND207 2.30 1.40 3.96 3.46194 6.17 8.39 9.61 9.38205 1.16 0.71 0.40 0.46206 21.13 22.78 47.31 42.53209 3.03 1.75 3.51 3.16
Total PCBs 1202 685 1235 1127Recovery
14 NM 130% 121% NM65 NM 73% 98% NM166 NM 83% 117% NM
*Based on Fillet/Whole Fish Ratio
112

B-10. PCB concentrations in Prey FIsh (ng/g) from Fall 2001 Core Study
Field ID 3SD1SFA 3SD1SFB 3SED2SFA 3SED2SFB 3SED2SFC 3 CORE SF 4SD1SFA 4SD1SFB 4SD1SFCCollected Fall 2001 Fall 2001 Fall 2001 Fall 2001 Fall 2001 Fall 2001 Fall 2001 Fall 2001 Fall 2001Zone 3 3 3 3 3 3 4 4 4Description 4 YOY Catfish 1 Hogchoker YOY Catfish YOY Catfish YOY Catfish Prey Fish 16 Croaker 15 Croaker 5 HogchokerReplicate analysis? Rep A Rep B Rep CAnalyzed by CBL CBL CBL CBL CBL CBL CBL CBL CBLLipid Content (%) 4.5% 8.6% 2.5% 2.4% 2.6% 2.6% 2.0% 1.1% 3.2%
1 ND ND ND ND ND ND ND ND ND3 10.33 1.98 0.93 2.87 4.40 4.10 0.98 0.60 6.71
4,10 ND ND ND ND ND ND ND ND ND7,9 0.42 0.10 0.25 0.29 0.23 0.26 0.10 0.06 0.286 0.57 0.08 0.27 0.37 0.24 0.31 0.14 0.06 0.30
8,5 18.28 2.10 13.59 12.95 13.68 12.12 3.28 1.83 9.4919 0.50 ND ND ND ND 0.50 ND ND ND
12,13 0.61 0.06 0.30 0.46 0.27 0.34 0.10 0.06 0.3018 7.03 1.35 5.86 5.80 5.62 5.13 1.97 1.12 4.8817 3.69 0.58 2.73 2.67 2.59 2.45 0.90 0.51 2.2324 0.25 0.05 0.21 0.20 0.19 0.18 0.08 0.05 0.15
16,32 5.54 0.85 4.13 3.78 3.82 3.62 1.46 0.83 3.4429 ND ND ND ND ND ND ND ND ND26 0.55 0.07 0.21 0.27 0.25 0.27 0.17 0.09 0.4925 0.29 0.06 0.79 0.18 0.14 0.29 0.08 0.04 0.24
31, 28 5.69 1.06 3.68 3.64 3.69 3.55 0.85 0.45 3.2633,21,53 8.18 1.04 6.11 5.68 5.75 5.35 2.25 1.30 4.84
51 2.42 0.20 1.62 1.53 1.62 1.48 0.39 0.22 1.0122 1.44 ND 0.85 0.76 0.89 0.98 0.33 0.16 0.6045 5.32 0.90 4.05 4.01 4.23 3.70 1.21 0.65 4.1446 3.31 0.42 2.25 1.95 2.29 2.04 0.55 0.28 1.6652 10.39 1.49 7.35 7.13 7.25 6.72 3.01 1.62 9.0049 8.68 4.26 7.16 5.69 6.12 6.38 2.34 1.32 5.55
47,48 10.01 2.97 12.92 12.27 12.29 10.09 4.13 2.28 10.4144 8.35 1.00 6.08 6.01 5.89 5.46 1.92 1.09 4.51
37,42 5.86 0.68 5.11 4.96 4.91 4.31 1.45 0.82 3.9241,64,71 15.49 1.81 9.04 10.46 8.74 9.11 2.70 1.53 8.46
40 2.61 0.32 1.86 1.68 1.77 1.65 0.64 0.36 1.72100 3.49 0.45 2.21 2.34 2.34 2.16 0.76 0.39 2.0963 1.62 0.26 1.18 1.31 1.21 1.12 0.16 0.09 0.7274 8.10 0.94 5.09 5.27 5.86 5.05 1.45 0.79 4.69
70,76 3.53 1.35 3.00 2.90 3.01 2.76 1.56 0.94 7.8166,95 38.16 4.77 26.23 25.82 25.84 24.16 10.69 6.05 26.67
91 4.73 0.46 3.24 3.23 3.25 2.98 1.15 0.68 2.7356,60/92,84 18.35 2.09 12.87 12.96 13.92 12.04 2.68 1.48 8.83
89 9.51 1.44 34.73 33.33 36.18 23.04 3.71 2.95 42.94101 18.98 2.38 13.11 12.74 12.93 12.03 5.24 2.90 13.9099 13.51 1.53 8.65 8.22 8.47 8.08 3.01 1.64 7.90119 1.92 0.31 1.44 1.42 1.45 1.31 0.39 0.21 1.1183 4.16 0.30 2.57 2.77 2.89 2.54 0.67 0.37 2.9597 16.00 4.56 25.81 23.89 25.12 19.08 8.57 4.81 26.67
81,87 1.71 ND 1.36 1.29 1.40 1.44 0.45 0.21 1.2085 8.53 0.83 4.84 4.85 141.50 32.11 1.38 0.76 2.98136 1.51 0.25 0.92 0.89 0.93 0.90 0.85 0.47 1.72
77,110 38.12 2.43 25.59 24.76 25.63 23.31 8.33 4.96 19.1882, 151 3.09 0.40 2.09 2.03 1.59 1.84 0.73 0.41 1.52135,144 6.25 0.70 4.10 3.95 4.09 3.82 1.44 0.81 4.77
107 3.58 0.39 2.21 2.17 2.20 2.11 0.63 0.36 1.85123,149 27.26 2.95 19.69 18.76 19.40 17.61 8.08 4.50 19.29
118 31.93 2.67 18.12 17.49 18.11 17.67 4.69 2.66 13.83134 1.25 0.13 0.91 0.98 1.11 0.88 0.35 0.19 1.12146 10.13 1.52 7.29 7.08 7.35 6.67 2.79 1.59 6.64
132,105,153 92.50 11.39 64.49 62.91 65.78 59.42 20.60 11.41 52.01141 15.65 1.49 10.01 9.64 10.38 9.44 2.71 1.38 9.10
137,130,176 3.81 ND 2.64 2.54 2.70 2.92 0.89 0.50 2.90163,138 67.94 8.02 48.46 46.82 49.20 44.09 14.49 7.85 40.24
158 2.20 ND 1.63 1.54 1.65 1.76 0.68 ND 1.28129,178 6.17 0.95 4.90 4.55 5.47 4.41 1.57 0.76 5.46187,182 23.88 3.58 19.31 18.52 19.61 16.98 6.50 3.53 16.67
183 14.98 1.79 10.10 10.06 10.29 9.44 3.51 1.82 8.16128 6.02 0.62 4.03 4.02 5.18 3.97 1.14 0.61 4.33185 2.74 0.38 1.90 1.75 1.96 1.74 0.61 0.32 2.15174 12.82 1.09 8.96 8.49 9.16 8.11 2.56 1.35 9.37177 11.66 1.42 8.09 7.82 8.28 7.45 1.72 0.96 8.53
202,171,156 11.72 1.26 7.55 7.27 7.76 7.11 2.87 1.54 7.40157,200 3.96 0.36 2.46 2.53 2.53 2.37 1.31 0.64 3.50172,197 5.63 0.67 3.53 3.46 3.54 3.36 1.00 0.49 4.15
180 53.90 4.91 35.20 34.15 36.18 32.87 9.29 4.33 34.16193 10.19 1.27 7.06 6.47 7.30 6.46 2.06 1.10 6.38191 1.41 0.14 0.91 0.94 0.91 0.86 0.20 0.10 0.51199 ND ND ND ND ND ND ND ND ND
170,190 24.79 2.18 15.92 15.26 16.49 14.93 3.79 1.79 15.65198 0.97 0.13 0.69 0.66 0.74 0.64 0.25 0.14 1.33201 12.06 1.30 7.69 7.21 7.98 7.25 3.29 1.68 13.05
203,196 22.81 2.23 14.70 13.93 15.48 13.83 6.26 3.00 18.84189 0.70 0.06 0.40 0.44 0.44 0.41 0.10 0.05 0.50
208,195 4.26 0.94 2.89 4.61 2.92 3.12 4.11 2.15 16.01207 1.30 0.14 0.80 0.74 0.82 0.76 0.99 0.50 3.09194 7.96 0.68 4.67 4.41 4.94 4.53 1.36 0.59 7.07205 0.54 0.05 0.32 0.35 0.28 0.31 0.06 0.05 0.45206 9.97 0.98 5.04 4.81 5.34 5.23 6.26 3.00 24.95209 4.03 0.47 2.04 1.96 2.22 2.14 3.30 1.64 13.17
Total PCBs 848 105 621 604 768 591 204 111 641Recovery
14 256% 70% 158% 151% 171% 161% 125% 78% 233%65 NM NM NM NM NM NM NM NM NM 166 116% 55% 97% 95% 102% 93% 94% 60% 94%
113

B-10. PCB concentrations in Prey FIsh (ng/g) from Fall 2001 Core Study
Field ID 4SD1SFD 4SD1SFE 4SD1SFF 4SD1SFG 4 CORE SF 5CCSFA 5CCSFB 5 CORE SFCollected Fall 2001 Fall 2001 Fall 2001 Fall 2001 Fall 2001 Fall 2001 Fall 2001 Fall 2001Zone 4 4 4 4 4 5 5 5Description 10 YOY Catfish 1 Spotted Shiner Tesselated Darter 4 White perch Prey Fish 3 American Eels 4 Hogchoaker Prey FishReplicate analysis?Analyzed by CBL CBL CBL CBL CBL CBL CBL CBLLipid Content (%) 5.5% 5.7% 3.2% 2.4% 2.9% 2.7% 3.8% 4.2%
1 ND ND ND ND ND ND ND ND3 5.82 9.94 0.84 4.21 4.16 1.89 0.41 1.15
4,10 ND ND ND ND ND ND ND ND7,9 0.23 0.37 0.13 0.18 0.19 0.11 0.02 0.076 0.23 0.21 0.16 0.25 0.19 0.11 0.02 0.07
8,5 13.16 21.66 3.05 7.14 8.52 3.46 0.52 1.9919 0.44 ND ND 0.33 0.39 ND ND ND
12,13 0.15 0.58 0.13 0.22 0.22 0.12 0.02 0.0718 4.35 8.17 2.08 3.55 3.73 1.16 0.28 0.7217 2.38 3.66 0.85 1.57 1.73 0.65 0.15 0.4024 0.18 0.32 0.10 0.16 0.15 0.03 0.01 0.02
16,32 3.55 5.19 1.70 2.72 2.70 1.52 0.27 0.9029 ND ND ND ND ND ND ND ND26 0.35 1.42 0.07 0.40 0.43 0.08 0.01 0.0425 0.17 0.54 0.05 0.15 0.18 0.03 0.01 0.02
31, 28 2.80 7.28 0.47 1.57 2.38 0.21 0.22 0.2133,21,53 5.35 8.67 2.51 4.59 4.22 1.62 0.32 0.97
51 1.25 1.08 0.31 0.97 0.75 0.14 0.04 0.0922 0.43 2.56 ND 0.42 0.75 0.26 ND 0.2645 3.77 6.94 1.22 2.51 2.92 0.90 0.22 0.5646 1.76 2.55 0.92 1.29 1.29 0.34 0.08 0.2152 8.55 17.85 1.15 5.79 6.71 1.11 0.48 0.7949 5.45 9.45 ND 3.40 4.59 ND 0.63 0.63
47,48 11.51 17.32 5.37 7.10 8.30 4.14 0.69 2.4144 6.07 13.63 0.92 4.24 4.63 0.81 0.23 0.52
37,42 4.29 9.63 1.20 3.14 3.49 0.97 0.21 0.5941,64,71 10.37 16.01 4.00 5.34 6.92 2.57 0.46 1.51
40 1.87 4.52 0.71 1.61 1.63 0.52 0.11 0.32100 2.27 2.53 0.82 1.55 1.49 0.41 0.08 0.2563 0.95 0.80 0.17 0.48 0.48 0.34 0.05 0.2074 5.24 7.04 1.49 3.04 3.39 1.66 0.25 0.95
70,76 1.88 15.09 1.45 5.00 4.82 0.21 0.30 0.2566,95 27.35 55.64 6.78 22.77 22.28 4.70 1.41 3.06
91 3.36 5.73 1.17 2.49 2.47 0.49 0.20 0.3456,60/92,84 11.38 22.66 2.61 6.32 8.00 1.56 0.46 1.01
89 31.31 73.62 4.87 19.97 25.63 1.96 1.38 1.67101 14.82 23.65 6.95 10.14 11.09 2.71 0.73 1.7299 9.90 12.21 3.99 5.68 6.33 2.69 0.51 1.60119 1.30 1.74 0.45 0.81 0.86 0.39 0.07 0.2383 3.87 6.45 0.67 1.96 2.42 0.52 0.07 0.2997 26.02 41.76 8.05 17.56 19.06 8.04 0.87 4.45
81,87 1.20 2.23 ND 0.93 1.04 0.33 ND 0.3385 4.86 6.66 1.94 2.89 3.07 0.99 0.17 0.58136 1.14 3.32 0.96 1.60 1.44 0.40 0.12 0.26
77,110 26.84 44.31 10.58 19.29 19.07 4.15 0.91 2.5382, 151 2.05 2.25 1.01 1.53 1.36 0.21 0.08 0.15135,144 4.71 7.61 2.13 3.74 3.60 0.76 0.23 0.49
107 2.19 2.70 1.08 1.36 1.45 1.23 0.10 0.67123,149 19.96 32.04 14.12 14.71 16.10 6.39 1.12 3.75
118 18.97 22.69 7.13 10.22 11.46 3.09 0.45 1.77134 1.38 2.05 0.67 0.57 0.90 1.22 0.15 0.68146 7.91 9.89 5.78 4.64 5.61 7.06 0.52 3.79
132,105,153 62.30 87.57 42.99 35.44 44.62 31.91 3.06 17.48141 10.01 14.58 6.71 5.63 7.16 2.30 0.33 1.31
137,130,176 2.83 4.74 2.10 1.44 2.20 1.76 0.24 1.00163,138 46.71 64.09 29.64 25.71 32.68 23.79 1.84 12.81
158 1.44 2.18 ND 0.89 1.29 1.11 ND 1.11129,178 5.15 7.37 3.82 2.96 3.87 4.92 0.44 2.68187,182 18.11 21.85 14.26 10.07 13.00 31.96 1.24 16.60
183 9.55 14.39 7.94 6.09 7.35 6.64 0.51 3.57128 4.21 5.89 2.44 2.47 3.01 2.02 0.15 1.09185 2.26 3.04 1.49 1.05 1.56 0.48 0.12 0.30174 9.81 15.26 7.62 4.27 7.18 4.08 0.75 2.42177 7.14 11.73 5.25 2.60 5.42 5.87 0.48 3.18
202,171,156 8.52 11.46 5.75 4.81 6.05 7.98 0.77 4.37157,200 4.36 5.32 2.21 1.82 2.74 4.52 0.68 2.60172,197 4.42 6.08 2.65 1.84 2.95 3.94 0.39 2.16
180 38.16 48.80 24.80 15.77 25.04 24.30 1.56 12.93193 5.79 12.45 3.22 4.65 5.09 2.03 0.18 1.11191 0.77 1.38 0.53 0.42 0.56 0.54 0.02 0.28199 4.59 ND ND ND 4.59 ND ND ND
170,190 17.91 22.78 10.04 6.89 11.26 10.80 0.72 5.76198 1.41 1.71 0.65 0.36 0.84 1.51 0.18 0.84201 14.45 16.78 7.18 4.53 8.71 16.88 1.68 9.28
203,196 22.88 29.92 11.90 8.77 14.51 20.91 2.18 11.55189 0.49 0.73 0.27 0.18 0.33 0.34 0.04 0.19
208,195 18.69 19.53 6.31 4.20 10.14 22.99 3.42 13.21207 3.65 4.48 1.11 1.07 2.13 4.76 0.89 2.83194 7.45 9.77 3.27 1.81 4.48 5.23 0.47 2.85205 0.51 0.73 0.17 0.09 0.29 0.37 0.07 0.22206 31.40 30.40 8.20 6.50 15.82 33.66 5.59 19.63209 15.33 16.02 3.60 2.93 8.00 17.60 3.44 10.52
Total PCBs 706 1065 329 387 497 369 47 209Recovery
14 256% 343% 82% 94% 173% 131% 54% 92%65 NM NM NM NM NM NM NM NM 166 102% 98% 69% 56% 82% 102% 28% 65%
114

B-11. PCB concentrations in Prey FIsh (ng/g) from Fall 2001 Variability Study
Field ID 4CCSFA 5 SD2 SFA 5 SD2 SFB 5 SD2 SFC 5 SD2 SFCollected Fall 2001 Fall 2001 Fall 2001 Fall 2001 Fall 2001Zone 4 5 5 5 5Description Prey Fish 1 YOY Catfish Croaker Croaker Prey FishReplicate analysis?Analyzed by CBL CBL CBL CBL CBLLipid Content (%) 4.1% 1.3% 1.5% 0.1% 1.0%
1 ND ND ND ND ND3 4.04 0.77 ND 1.51 1.14
4,10 ND ND ND ND ND7,9 0.17 0.07 0.06 ND 0.076 0.25 0.14 0.12 0.03 0.10
8,5 10.88 1.96 1.79 ND 1.8819 0.31 ND ND ND ND
12,13 0.23 0.08 0.06 ND 0.0718 3.72 1.03 1.13 0.41 0.8517 1.96 0.63 0.60 0.30 0.5124 0.15 0.05 0.06 0.06 0.06
16,32 3.05 1.01 0.80 ND 0.9129 ND ND ND ND ND26 0.31 0.02 0.08 ND 0.0525 0.10 0.04 0.03 0.16 0.08
31, 28 2.39 0.44 0.55 0.46 0.4833,21,53 4.11 1.16 1.25 0.71 1.04
51 1.04 0.14 0.18 0.07 0.1322 0.50 0.16 0.28 ND 0.2245 2.96 0.63 0.66 0.24 0.5146 1.32 0.32 0.34 ND 0.3352 6.50 0.89 1.67 0.59 1.0549 4.09 1.52 1.99 ND 1.76
47,48 5.16 2.83 2.76 1.46 2.3544 4.86 0.94 0.94 0.53 0.80
37,42 3.34 0.98 0.81 0.49 0.7641,64,71 8.20 2.24 1.84 1.49 1.86
40 1.51 0.29 0.38 0.18 0.28100 1.58 0.33 0.43 0.20 0.3263 0.81 0.40 0.13 0.11 0.2174 3.51 1.14 0.90 0.50 0.84
70,76 1.46 0.31 0.79 0.43 0.5166,95 19.53 4.14 6.27 2.66 4.36
91 2.53 0.71 0.79 0.34 0.6156,60/92,84 7.12 1.88 1.42 2.28 1.86
89 4.31 2.78 2.49 1.21 2.16101 10.69 2.54 3.16 1.61 2.4399 7.07 2.42 2.07 1.03 1.84119 0.98 0.25 0.24 ND 0.2583 3.07 0.32 0.34 0.11 0.2697 7.29 3.63 5.58 ND 4.60
81,87 1.01 0.26 ND ND 0.2685 4.08 1.04 0.79 0.33 0.72136 0.80 0.18 0.52 0.15 0.29
77,110 19.91 5.24 4.76 2.10 4.0382, 151 1.43 0.40 0.42 0.16 0.33135,144 3.39 0.84 0.88 0.36 0.70
107 1.65 0.53 0.45 0.26 0.41123,149 14.18 4.33 5.01 2.43 3.92
118 12.98 3.29 2.75 1.01 2.35134 1.09 0.42 0.27 0.15 0.28146 6.02 2.44 2.04 1.65 2.04
132,105,153 32.53 16.07 13.47 7.97 12.50141 7.53 2.41 1.64 0.65 1.57
137,130,176 2.33 0.81 0.62 ND 0.71163,138 35.84 11.54 8.77 3.99 8.10
158 1.09 0.63 ND ND 0.63129,178 3.19 1.63 0.91 0.33 0.96187,182 13.97 7.36 4.57 2.35 4.76
183 7.70 2.81 2.19 1.05 2.01128 3.46 0.99 0.60 0.25 0.62185 1.75 0.60 0.38 0.13 0.37174 8.05 3.23 1.79 0.68 1.90177 5.85 1.98 1.20 0.41 1.20
202,171,156 4.40 2.69 2.09 0.89 1.89157,200 4.22 1.89 1.06 0.34 1.10172,197 3.93 1.42 0.77 0.39 0.86
180 31.36 9.62 5.46 2.30 5.79193 4.58 1.06 1.14 0.49 0.90191 0.57 0.19 0.12 ND 0.15199 4.66 ND ND ND ND
170,190 11.68 4.18 2.14 0.91 2.41198 1.49 0.64 0.22 0.07 0.31201 13.90 6.16 2.74 1.16 3.36
203,196 21.13 8.77 4.39 1.91 5.02189 0.47 0.13 0.07 ND 0.10
208,195 20.32 9.36 3.97 0.05 4.46207 4.14 2.17 0.98 0.43 1.19194 7.23 1.89 0.86 0.31 1.02205 0.54 0.14 0.04 ND 0.09206 35.04 14.86 5.80 2.33 7.66209 17.76 7.76 3.58 1.39 4.25
Total PCBs 518 181 132 59 129Recovery
14 178% 70% 133% 67% 90%65 NM NM NM NM NM166 80% 49% 98% 57% 68%
115

B-12. PCB concentrations in Prey FIsh (ng/g) from Spring 2002 Core Study
Field ID 2 CORE SFA 2 CORE SFB 2 CORE SFC 2 CORE SF 3 CORE SFA 3 CORE SFB 3 CORE SF 4 SED2 SFA1Collected Spring 2002 Spring 2002 Spring 2002 Spring 2002 Spring 2002 Spring 2002 Spring 2002 Spring 2002Zone 2 2 2 2 3 3 3 4Description Spot-tailed Shiners Tessalated Darter Banded Killifish Prey Fish YOY Channel Catfish Juvenile White Perch Prey Fish Juvenile White PerchReplicate analysis? Rep AAnalyzed by CBL CBL CBL CBL CBL CBL CBL CBLLipid Content (%) 3.2% 2.7% 2.2% 2.7% 1.5% 2.5% 2.0% 2.6%
1 ND 0.03 0.16 0.10 1.86 ND 1.86 ND3 ND 0.13 1.10 0.61 0.96 2.73 1.85 2.26
4,10 1.02 0.85 0.68 0.85 1.04 0.62 0.83 0.387,9 ND 0.05 0.08 0.07 0.24 0.19 0.22 0.096 0.05 0.03 0.04 0.04 0.20 0.47 0.34 0.04
8,5 2.17 1.54 3.90 2.54 7.88 8.53 8.21 8.6119 0.10 0.06 0.14 0.10 0.40 0.31 0.35 0.22
12,13 0.07 0.04 0.07 0.06 0.35 0.21 0.28 0.1718 0.82 0.90 1.96 1.23 8.62 3.62 6.12 2.6217 0.28 0.40 0.72 0.47 2.70 1.75 2.22 1.4124 0.03 0.04 0.07 0.04 0.28 0.12 0.20 0.11
16,32 0.33 0.64 0.87 0.61 3.48 2.30 2.89 2.1529 0.04 0.04 0.07 0.05 0.40 0.13 0.26 0.1026 0.06 0.11 0.07 0.08 0.19 0.57 0.38 0.6925 ND ND ND ND ND ND ND ND
31, 28 1.19 1.03 1.08 1.10 2.02 3.74 2.88 4.1233,21,53 0.77 0.80 1.78 1.12 6.13 4.63 5.38 4.50
51 0.12 0.15 0.31 0.20 1.38 1.63 1.50 2.0122 0.37 0.29 ND 0.33 0.50 0.63 0.56 0.8245 0.60 0.61 1.16 0.79 4.36 3.62 3.99 3.6246 0.02 0.45 0.39 0.28 1.62 2.02 1.82 2.6552 1.43 1.31 2.19 1.65 4.46 8.04 6.25 9.0849 ND ND ND ND ND ND ND ND
47,48 1.70 1.25 4.03 2.33 16.76 10.41 13.59 10.8644 1.09 1.00 0.92 1.00 3.61 5.92 4.76 6.64
37,42 0.66 0.78 1.13 0.86 3.73 4.49 4.11 4.6341,64,71 1.30 1.23 2.91 1.81 9.98 6.49 8.23 7.01
40 0.17 0.27 0.27 0.24 1.39 1.97 1.68 2.22100 0.29 0.34 0.71 0.45 2.24 2.40 2.32 2.8863 0.20 0.18 0.19 0.19 0.83 0.99 0.91 1.0574 0.99 0.97 1.73 1.23 6.03 4.70 5.36 5.24
70,76 1.44 1.51 1.03 1.33 1.85 8.60 5.23 10.6966,95 4.08 4.08 8.76 5.64 20.49 28.29 24.39 33.35
91 0.46 0.51 1.08 0.68 3.06 3.38 3.22 4.0856,60/92,84 2.49 2.03 3.88 2.80 9.03 11.91 10.47 13.46
89 3.04 3.83 2.01 2.96 23.03 45.22 34.12 58.57101 2.45 2.54 4.92 3.30 13.81 14.75 14.28 18.1599 1.24 1.44 2.62 1.77 9.92 8.29 9.11 10.43
119 0.42 0.48 1.17 0.69 2.05 2.24 2.15 3.0383 0.33 0.31 0.43 0.36 1.79 2.81 2.30 3.5597 4.11 4.68 5.92 4.90 17.59 22.19 19.89 25.50
81,87 0.21 0.30 0.44 0.31 1.39 1.29 1.34 1.7285 0.83 0.78 1.36 0.99 5.10 5.23 5.17 5.84
136 0.20 0.27 0.35 4.53 0.77 2.09 14.53 2.6377,110 3.51 3.67 7.89 5.03 22.48 24.26 23.37 32.0782, 151 0.21 0.21 0.65 0.36 2.12 2.11 2.11 2.78135,144 0.66 0.66 0.86 0.72 4.60 4.83 4.72 6.68
107 0.29 0.29 0.56 0.38 2.41 1.85 2.13 2.62123,149 3.41 3.57 7.19 4.72 22.49 19.33 20.91 24.65
118 2.75 2.61 4.71 3.36 18.54 14.68 16.61 21.85134 0.26 0.22 0.72 0.40 1.88 1.80 1.84 1.55146 1.42 1.48 2.53 1.81 12.23 7.44 9.84 8.95
132,105,153 11.93 11.50 20.40 14.61 92.42 53.59 73.01 65.74141 1.21 1.47 1.39 1.36 14.22 8.35 11.28 11.50
137,130,176 0.47 0.47 0.79 0.58 3.72 2.29 3.01 2.93163,138 7.68 8.05 14.27 10.00 66.47 39.57 53.02 49.07
158 0.45 0.46 0.68 0.53 2.73 1.46 2.10 1.88129,178 0.76 0.88 1.22 0.95 8.43 4.51 6.47 5.38187,182 3.34 3.64 6.41 4.47 28.32 15.42 21.87 18.12
183 1.81 1.87 2.95 2.21 15.66 8.74 12.20 11.22128 0.63 0.72 1.36 0.90 6.22 4.05 5.14 5.47185 0.30 0.33 0.12 0.25 2.68 1.62 2.15 1.98174 1.22 1.37 2.23 1.61 13.06 6.15 9.61 8.09177 1.31 0.99 1.85 1.38 11.48 4.22 7.85 5.53
202,171,156 1.35 1.43 1.90 1.56 10.73 6.86 8.80 9.43157,200 0.40 0.43 0.64 0.49 4.25 2.25 3.25 2.84172,197 0.61 0.57 0.78 0.65 5.62 2.99 4.30 3.99
180 4.91 5.06 5.80 5.26 54.97 25.24 40.10 33.06193 5.24 3.57 5.79 4.87 10.97 15.69 13.33 24.20191 0.14 0.11 0.21 0.16 1.25 0.67 0.96 0.87199 ND ND ND ND ND ND ND ND
170,190 2.02 2.08 2.73 2.27 22.35 11.28 16.81 15.74198 0.12 0.11 0.05 0.09 0.98 0.56 0.77 0.62201 1.33 1.41 2.04 1.60 12.38 6.58 9.48 8.06
203,196 2.61 2.65 1.83 2.36 21.54 12.12 16.83 15.36189 0.10 0.06 0.11 0.09 0.58 0.29 0.44 0.43
208,195 0.84 0.81 1.06 0.90 8.18 5.16 6.67 6.38207 0.16 0.15 0.19 0.17 1.30 0.99 1.14 1.15194 0.79 0.74 0.89 0.81 7.79 3.63 5.71 4.75205 0.08 0.05 0.06 0.06 0.50 0.21 0.35 0.26206 0.90 0.87 0.72 0.83 9.80 7.76 8.78 9.87209 0.36 0.34 0.41 0.37 4.11 3.84 3.98 4.68
Total PCBs 103 103 167 129 733 572 666 707Recovery
14 103% 82% 75% 86% 106% 179% 142% 143%65 NM NM NM NM NM NM NM NM
166 51% 51% 53% 52% 80% 86% 83% 86%
116

B-12. PCB concentrations in Prey FIsh (ng/g) from Spring 2002 Core Study
Field ID 4 SED2 SFA2 4 SED2 SFA3 4 SED2 SFB 4 SED2 SFC 4 CORE SF 5 SED3 SFA 5 SED3 SFB 5 CORE SFCollected Spring 2002 Spring 2002 Spring 2002 Spring 2002 Spring 2002 Spring 2002 Spring 2002 Spring 2002Zone 4 4 4 4 4 5 5 5Description Juvenile White Perch Juvenile White Perch YOY Channel Catfish Spottail shiner Prey Fish Juvenile White Perch YOY Channel Catfish Prey FishReplicate analysis? Rep B Rep CAnalyzed by CBL CBL CBL CBL CBL CBL CBL CBLLipid Content (%) 2.7% 2.7% 1.8% 5.0% 3.0% 2.4% 1.9% 2.1%
1 ND 0.12 0.08 0.29 0.16 ND 0.06 0.063 0.20 1.67 0.82 2.34 1.46 0.97 0.81 0.89
4,10 0.46 0.39 0.40 1.10 0.55 0.36 0.33 0.347,9 0.11 0.13 0.10 0.04 0.09 0.08 0.05 0.076 0.06 0.07 0.05 0.07 0.06 0.03 0.04 0.04
8,5 10.08 8.92 5.84 11.78 9.05 2.00 2.56 2.2819 0.24 0.21 0.06 0.13 0.17 0.11 0.11 0.11
12,13 0.16 0.15 0.16 0.25 0.18 0.08 0.07 0.0718 2.84 3.46 3.28 3.34 3.11 1.12 1.09 1.1117 1.56 1.61 1.24 1.65 1.50 0.63 0.68 0.6524 0.16 0.14 0.11 0.19 0.14 0.04 0.05 0.05
16,32 2.35 2.36 1.44 1.71 2.00 0.70 0.72 0.7129 0.13 0.15 0.13 0.17 0.14 0.05 0.06 0.0526 0.61 0.60 ND 0.83 0.68 0.11 0.17 0.1425 ND ND ND ND ND ND ND ND
31, 28 4.13 4.02 1.80 7.83 4.38 0.62 0.62 0.6233,21,53 4.74 5.15 2.62 4.09 4.22 1.18 1.07 1.13
51 2.07 2.15 0.72 0.47 1.48 0.24 0.31 0.2722 0.68 0.79 ND 1.22 0.88 0.25 0.22 0.2345 3.71 4.10 2.64 4.53 3.72 0.75 1.00 0.8846 2.87 2.42 1.31 0.73 2.00 0.32 0.37 0.3552 9.53 9.32 5.55 14.94 9.68 1.85 1.78 1.8249 ND ND ND ND ND ND ND ND
47,48 11.37 11.80 5.93 13.28 10.65 2.62 3.21 2.9244 6.86 6.76 3.21 10.26 6.75 1.27 1.23 1.25
37,42 4.96 4.82 2.97 6.43 4.76 0.90 1.14 1.0241,64,71 9.42 7.17 6.25 10.12 8.00 1.29 2.31 1.80
40 2.11 2.30 0.89 3.05 2.11 0.46 0.43 0.45100 3.03 2.91 1.66 2.28 2.55 0.39 0.50 0.4563 1.09 0.97 0.72 1.05 0.98 0.22 0.44 0.3374 5.49 5.31 3.67 5.58 5.06 1.00 1.16 1.08
70,76 11.28 10.63 1.26 12.60 9.29 1.34 0.34 0.8466,95 34.82 33.77 17.35 47.50 33.36 6.03 5.58 5.81
91 4.24 4.13 3.01 5.51 4.19 0.82 1.08 0.9556,60/92,84 14.03 13.28 6.47 19.09 13.27 2.17 3.17 2.67
89 58.49 53.87 16.82 61.60 49.87 5.06 5.93 5.49101 18.47 18.29 13.82 24.70 18.69 3.53 3.99 3.7699 10.48 10.46 9.46 12.94 10.76 2.44 3.43 2.93
119 2.92 2.88 1.63 2.31 2.55 0.52 0.64 0.5883 3.75 3.35 1.88 5.31 3.57 0.48 0.70 0.5997 26.32 27.06 23.11 35.07 27.41 6.50 5.22 5.86
81,87 1.73 1.63 1.07 2.46 1.72 0.20 0.34 0.2785 6.62 6.00 4.31 6.76 5.91 0.82 1.23 1.02
136 2.73 2.69 0.67 3.01 24.00 0.46 0.26 4.7177,110 33.28 32.10 22.02 44.86 32.86 4.69 6.77 5.7382, 151 2.80 2.71 1.80 2.51 2.52 0.44 0.55 0.49135,144 6.60 6.54 4.59 6.80 6.24 1.08 1.29 1.19
107 2.52 2.50 1.89 2.44 2.39 0.42 0.70 0.56123,149 24.83 24.96 20.94 28.38 24.75 5.27 6.47 5.87
118 21.79 21.24 14.99 23.96 20.76 2.30 3.95 3.13134 1.82 1.70 1.43 3.00 1.90 0.47 0.74 0.60146 8.80 8.83 10.49 8.92 9.20 2.59 3.88 3.23
132,105,153 67.11 66.42 71.04 77.63 69.59 11.56 21.80 16.68141 11.24 11.02 11.14 12.50 11.48 1.82 2.85 2.33
137,130,176 2.90 2.87 3.06 4.05 3.16 0.64 1.09 0.87163,138 49.47 49.07 51.74 57.57 51.38 9.50 14.85 12.18
158 1.79 1.77 1.68 2.10 1.84 0.67 0.66 0.67129,178 5.24 5.32 6.42 5.72 5.62 1.47 2.30 1.89187,182 17.74 17.91 22.08 14.32 18.03 5.31 10.47 7.89
183 10.67 10.81 11.29 9.69 10.74 2.60 3.56 3.08128 5.62 5.16 4.64 6.20 5.42 0.79 1.30 1.04185 1.95 1.93 2.32 1.95 2.03 0.44 0.69 0.56174 8.05 7.98 11.19 10.36 9.14 2.01 3.67 2.84177 5.44 5.34 7.74 7.46 6.30 1.16 2.75 1.95
202,171,156 8.86 8.78 8.93 8.82 8.96 2.45 3.60 3.03157,200 2.70 2.76 4.52 3.56 3.28 1.43 2.53 1.98172,197 3.59 3.58 4.90 4.00 4.01 1.17 1.97 1.57
180 30.97 31.07 41.96 30.71 33.55 7.07 12.21 9.64193 21.71 21.75 7.44 9.61 16.94 1.70 2.11 1.91191 0.78 0.80 0.81 0.93 0.84 0.12 0.22 0.17199 ND ND ND ND ND ND ND ND
170,190 14.37 14.22 17.03 14.63 15.20 2.72 5.10 3.91198 0.59 0.59 1.29 1.00 0.82 0.35 0.84 0.59201 7.33 7.35 14.22 10.00 9.39 3.89 8.21 6.05
203,196 13.73 13.83 21.55 16.27 16.15 6.19 10.74 8.46189 0.37 0.38 0.43 0.39 0.40 0.09 0.16 0.12
208,195 5.69 5.59 15.34 11.16 8.83 5.19 12.20 8.69207 1.02 1.04 2.87 2.34 1.68 1.61 2.86 2.24194 4.08 4.13 7.16 4.99 5.02 1.22 2.54 1.88205 0.23 0.22 0.49 0.41 0.32 0.13 0.19 0.16206 8.45 8.33 25.79 18.34 14.16 9.55 21.21 15.38209 3.97 3.87 13.13 9.13 6.96 5.57 12.58 9.08
Total PCBs 705 692 625 825 733 156 244 204Recovery
14 144% 130% 106% 180% 141% 122% 114% 118%65 NM NM NM NM NM NM NM NM
166 86% 76% 78% 72% 80% 54% 59% 57%
117

B-13. PCB concentrations in Prey FIsh (ng/g) from Spring 2002 Variability Study
Field ID 2 CC SFA 5 SED1 SFA 5 SED1 SFB 5 SED1 SFC 5 SED1 SFCollected Spring 2002 Spring 2002 Spring 2002 Spring 2002 Spring 2002Zone 2 5 5 5 5Description Gizzard shad Juvenile White Perch Hogchoker YOY Channel Catfish Prey FishReplicate analysis?Analyzed by CBL CBL CBL CBL CBLLipid Content (%) 1.8% 2.9% 1.8% 1.7% 2.0%
1 0.06 ND 0.12 0.08 0.103 0.21 ND 0.13 1.29 0.71
4,10 0.48 0.34 0.36 0.32 0.347,9 0.12 0.08 0.03 0.08 0.066 0.02 0.06 0.02 0.02 0.03
8,5 22.46 3.36 0.68 4.26 2.7719 0.19 0.07 0.06 0.22 0.12
12,13 0.10 0.06 0.02 0.12 0.0718 3.29 1.23 0.53 1.97 1.2417 1.56 0.77 0.21 0.94 0.6424 0.14 0.05 0.03 0.08 0.05
16,32 2.24 0.75 0.28 1.20 0.7429 0.14 0.06 0.03 0.09 0.0626 0.92 0.21 ND 0.08 0.1525 0.63 ND ND ND ND
31, 28 6.67 1.25 0.25 1.19 0.9033,21,53 4.07 2.13 0.40 1.87 1.47
51 0.71 0.48 0.06 0.57 0.3722 1.49 0.57 ND 0.23 0.4045 2.11 1.50 0.39 2.09 1.3346 0.77 0.64 0.10 0.51 0.4252 6.36 4.92 0.74 3.61 3.0949 ND ND ND ND ND
47,48 6.29 2.49 1.21 3.56 2.4244 5.48 3.24 0.31 2.63 2.06
37,42 3.72 2.20 0.27 2.44 1.6441,64,71 5.64 3.28 0.68 4.75 2.90
40 1.49 0.86 0.13 0.74 0.58100 1.60 0.80 0.17 1.07 0.6863 0.60 0.50 0.05 0.60 0.3974 4.46 2.46 0.42 2.67 1.85
70,76 7.93 5.11 0.50 0.87 2.1666,95 18.97 16.71 2.21 11.95 10.29
91 1.90 2.02 0.37 2.07 1.4956,60/92,84 11.86 6.18 1.91 6.05 4.71
89 12.34 13.96 2.33 14.48 10.26101 8.15 9.25 1.34 8.52 6.3799 4.29 6.09 1.08 6.37 4.52119 4.01 0.96 0.22 1.26 0.8183 1.66 1.43 0.19 1.43 1.0297 13.26 12.74 1.91 15.60 10.08
81,87 0.92 0.77 0.23 0.76 0.5985 2.90 2.99 0.26 2.99 2.08136 1.21 1.00 0.12 0.52 6.41
77,110 14.25 14.37 1.64 14.84 10.2882, 151 1.12 1.02 0.15 1.07 0.74135,144 2.55 2.53 0.40 2.69 1.87
107 0.92 1.10 0.18 1.23 0.83123,149 11.14 10.42 2.19 12.75 8.46
118 8.34 9.68 0.88 10.03 6.86134 1.34 1.08 0.33 1.22 0.87146 3.68 5.03 1.23 6.66 4.31
132,105,153 31.16 33.25 6.67 45.81 28.58141 4.53 4.56 0.61 6.14 3.77
137,130,176 1.55 1.44 0.34 3.41 1.73163,138 22.56 24.40 3.69 33.02 20.37
158 0.89 0.88 0.63 1.12 0.88129,178 2.61 2.63 0.76 4.40 2.60187,182 7.80 8.74 2.55 14.29 8.53
183 4.66 4.73 1.04 7.18 4.31128 2.30 2.52 0.26 3.08 1.95185 1.00 0.66 0.20 1.46 0.77174 4.79 3.36 1.27 6.92 3.85177 3.25 2.23 0.94 6.04 3.07
202,171,156 4.91 4.69 1.49 6.56 4.25157,200 1.34 1.85 1.25 3.80 2.30172,197 1.69 2.07 0.74 3.43 2.08
180 13.74 14.26 2.85 27.92 15.01193 5.08 3.12 0.42 4.61 2.72191 0.41 0.32 0.05 0.35 0.24199 ND 2.31 2.54 3.41 2.75
170,190 6.01 6.19 1.26 12.08 6.51198 0.32 0.60 0.30 1.28 0.73201 3.85 6.87 2.88 13.25 7.67
203,196 6.96 10.07 3.68 19.46 11.07189 0.27 0.18 0.04 0.37 0.20
208,195 2.43 7.80 5.37 19.37 10.85207 0.47 1.99 1.44 3.99 2.47194 2.34 2.25 0.82 6.08 3.05205 0.15 0.16 0.06 0.49 0.24206 2.74 15.77 9.67 37.14 20.86209 1.32 8.08 5.96 20.13 11.39
Total PCBs 358 337 87 479 307Recovery
14 136% 127% 98% 95% 107%65 NM NM NM NM NM166 51% 78% 59% 66% 68%
118
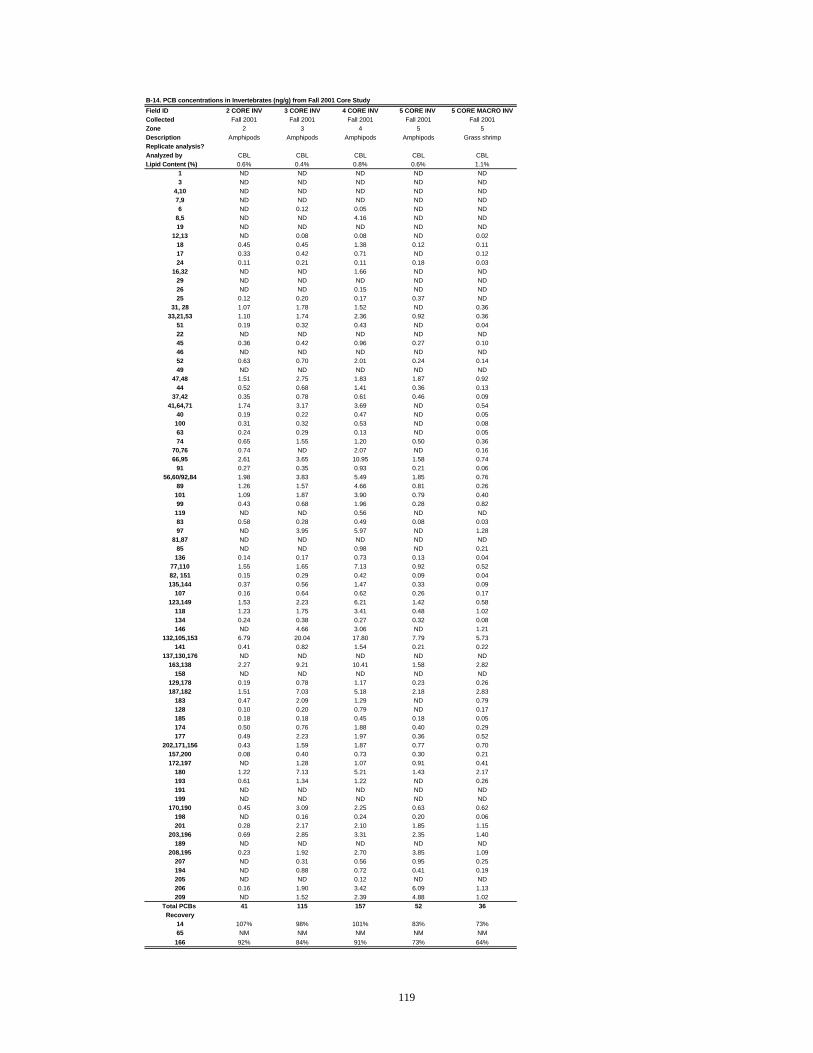
B-14. PCB concentrations in Invertebrates (ng/g) from Fall 2001 Core Study
Field ID 2 CORE INV 3 CORE INV 4 CORE INV 5 CORE INV 5 CORE MACRO INVCollected Fall 2001 Fall 2001 Fall 2001 Fall 2001 Fall 2001Zone 2 3 4 5 5Description Amphipods Amphipods Amphipods Amphipods Grass shrimpReplicate analysis?Analyzed by CBL CBL CBL CBL CBLLipid Content (%) 0.6% 0.4% 0.8% 0.6% 1.1%
1 ND ND ND ND ND3 ND ND ND ND ND
4,10 ND ND ND ND ND7,9 ND ND ND ND ND6 ND 0.12 0.05 ND ND
8,5 ND ND 4.16 ND ND19 ND ND ND ND ND
12,13 ND 0.08 0.08 ND 0.0218 0.45 0.45 1.38 0.12 0.1117 0.33 0.42 0.71 ND 0.1224 0.11 0.21 0.11 0.18 0.03
16,32 ND ND 1.66 ND ND29 ND ND ND ND ND26 ND ND 0.15 ND ND25 0.12 0.20 0.17 0.37 ND
31, 28 1.07 1.78 1.52 ND 0.3633,21,53 1.10 1.74 2.36 0.92 0.36
51 0.19 0.32 0.43 ND 0.0422 ND ND ND ND ND45 0.36 0.42 0.96 0.27 0.1046 ND ND ND ND ND52 0.63 0.70 2.01 0.24 0.1449 ND ND ND ND ND
47,48 1.51 2.75 1.83 1.87 0.9244 0.52 0.68 1.41 0.36 0.13
37,42 0.35 0.78 0.61 0.46 0.0941,64,71 1.74 3.17 3.69 ND 0.54
40 0.19 0.22 0.47 ND 0.05100 0.31 0.32 0.53 ND 0.0863 0.24 0.29 0.13 ND 0.0574 0.65 1.55 1.20 0.50 0.36
70,76 0.74 ND 2.07 ND 0.1666,95 2.61 3.65 10.95 1.58 0.74
91 0.27 0.35 0.93 0.21 0.0656,60/92,84 1.98 3.83 5.49 1.85 0.76
89 1.26 1.57 4.66 0.81 0.26101 1.09 1.87 3.90 0.79 0.4099 0.43 0.68 1.96 0.28 0.82119 ND ND 0.56 ND ND83 0.58 0.28 0.49 0.08 0.0397 ND 3.95 5.97 ND 1.28
81,87 ND ND ND ND ND85 ND ND 0.98 ND 0.21136 0.14 0.17 0.73 0.13 0.04
77,110 1.55 1.65 7.13 0.92 0.5282, 151 0.15 0.29 0.42 0.09 0.04135,144 0.37 0.56 1.47 0.33 0.09
107 0.16 0.64 0.62 0.26 0.17123,149 1.53 2.23 6.21 1.42 0.58
118 1.23 1.75 3.41 0.48 1.02134 0.24 0.38 0.27 0.32 0.08146 ND 4.66 3.06 ND 1.21
132,105,153 6.79 20.04 17.80 7.79 5.73141 0.41 0.82 1.54 0.21 0.22
137,130,176 ND ND ND ND ND163,138 2.27 9.21 10.41 1.58 2.82
158 ND ND ND ND ND129,178 0.19 0.78 1.17 0.23 0.26187,182 1.51 7.03 5.18 2.18 2.83
183 0.47 2.09 1.29 ND 0.79128 0.10 0.20 0.79 ND 0.17185 0.18 0.18 0.45 0.18 0.05174 0.50 0.76 1.88 0.40 0.29177 0.49 2.23 1.97 0.36 0.52
202,171,156 0.43 1.59 1.87 0.77 0.70157,200 0.08 0.40 0.73 0.30 0.21172,197 ND 1.28 1.07 0.91 0.41
180 1.22 7.13 5.21 1.43 2.17193 0.61 1.34 1.22 ND 0.26191 ND ND ND ND ND199 ND ND ND ND ND
170,190 0.45 3.09 2.25 0.63 0.62198 ND 0.16 0.24 0.20 0.06201 0.28 2.17 2.10 1.85 1.15
203,196 0.69 2.85 3.31 2.35 1.40189 ND ND ND ND ND
208,195 0.23 1.92 2.70 3.85 1.09207 ND 0.31 0.56 0.95 0.25194 ND 0.88 0.72 0.41 0.19205 ND ND 0.12 ND ND206 0.16 1.90 3.42 6.09 1.13209 ND 1.52 2.39 4.88 1.02
Total PCBs 41 115 157 52 36Recovery
14 107% 98% 101% 83% 73%65 NM NM NM NM NM166 92% 84% 91% 73% 64%
119

B-15. PCB concentrations in Invertebrates (ng/g) from Fall 2001 Variability Study
Field ID 2 CC INV 2 CC MACRO INV 4 CC INV 5 SD2 INVCollected Fall 2001 Fall 2001 Fall 2001 Fall 2001Zone 2 2 4 5Description Amphipods Blue crab Amphipods Grass ShrimpReplicate analysis?Analyzed by CBL CBL CBL CBLLipid Content (%) 0.6% 2.1% 0.6% 0.8%
1 ND ND ND ND3 ND 0.54 1.04 ND
4,10 ND ND ND ND7,9 0.22 0.07 ND ND6 0.04 0.04 ND 0.03
8,5 1.74 1.77 ND ND19 ND ND ND ND
12,13 0.03 0.07 ND ND18 0.43 1.07 0.45 0.1617 0.20 0.62 0.23 ND24 0.04 0.02 0.06 0.06
16,32 0.51 0.34 0.66 ND29 ND ND ND ND26 ND 0.04 ND ND25 0.04 0.05 0.04 ND
31, 28 0.57 1.44 0.39 0.4433,21,53 0.74 1.03 0.77 0.49
51 0.14 0.07 0.14 ND22 0.51 0.20 ND ND45 0.36 0.47 0.36 0.1646 0.31 0.23 ND ND52 0.77 0.07 0.86 0.5549 ND ND ND ND
47,48 1.13 1.78 1.34 0.8244 0.64 0.21 0.58 0.34
37,42 0.51 0.28 0.36 0.2641,64,71 1.27 0.92 1.23 0.89
40 0.21 0.12 0.19 0.07100 0.15 0.53 0.24 0.0963 0.06 0.04 0.09 0.0474 0.49 1.76 0.37 0.37
70,76 0.74 0.34 0.54 ND66,95 3.15 3.33 3.58 1.22
91 0.31 0.06 0.33 0.0556,60/92,84 1.13 2.56 2.36 1.26
89 1.78 0.63 1.65 0.28101 1.14 0.71 1.30 0.4799 0.57 2.97 0.61 0.41119 0.23 0.29 ND ND83 0.18 0.20 0.17 0.0797 1.97 2.32 1.82 1.38
81,87 ND ND ND ND85 0.33 1.19 0.29 ND136 0.22 0.09 0.24 0.06
77,110 2.07 1.02 2.10 0.3882, 151 0.21 0.07 0.21 0.11135,144 0.47 0.14 0.50 0.14
107 0.18 0.21 0.17 0.13123,149 2.04 0.87 2.05 0.54
118 1.11 4.73 1.16 0.89134 0.09 0.14 0.11 0.15146 0.85 1.87 1.24 1.50
132,105,153 5.36 15.69 5.84 4.70141 0.67 0.20 0.46 0.39
137,130,176 ND ND ND ND163,138 3.08 8.75 2.81 1.89
158 ND ND ND ND129,178 0.36 1.10 0.35 0.38187,182 1.57 3.89 1.71 2.25
183 0.62 2.37 0.63 0.36128 0.16 0.70 0.01 ND185 0.19 0.10 0.16 0.12174 0.79 0.41 0.57 0.61177 0.70 0.14 0.58 0.49
202,171,156 0.64 2.42 0.57 0.84157,200 0.08 0.93 0.16 0.29172,197 0.22 0.51 0.21 0.69
180 1.63 3.89 1.14 2.25193 0.74 1.06 0.38 0.26191 ND 0.10 ND ND199 ND ND ND ND
170,190 0.67 1.58 0.50 0.77198 0.05 0.22 0.05 0.13201 0.45 1.48 0.50 1.38
203,196 0.90 3.43 0.82 1.77189 ND 0.05 ND ND
208,195 0.28 3.30 0.59 1.99207 0.06 0.82 0.13 0.39194 0.21 0.47 0.14 0.43205 0.03 0.03 ND ND206 0.27 3.71 0.67 2.97209 0.17 2.92 0.46 1.81
Total PCBs 50 98 49 41Recovery
14 105% 119% 68% 77%65 NM NM NM NM166 92% 96% 66% 68%
120

B-16. PCB concentrations in Invertebrates (ng/g) from Spring 2002 Core Study
Field ID 2 CORE INV 3 CORE INVA 3 COR INVC 3 CORE INV 3 CORE MACRO INV 4 CORE INV 4 CORE MACRO INV 5 CORE INVCollected Spring 2002 Spring 2002 Spring 2002 Spring 2002 Spring 2002 Spring 2002 Spring 2002 Spring 2002Zone 2 3 3 3 4 4 4 5Description Amphipods Amphipods Amphipods Amphipods Crayfish Amphipods Crayfish AmphipodsReplicate analysis?Analyzed by CBL CBL CBL CBL CBL CBL CBL CBLLipid Content (%) 1.6% 2.2% 0.9% 1.6% 1.8% 1.3% 1.1% 1.2%
1 ND ND ND ND 0.09 0.11 0.10 0.133 ND 2.09 1.85 1.97 0.22 2.63 ND ND
4,10 2.63 0.96 0.70 0.83 0.20 0.53 0.21 0.577,9 ND 0.19 0.10 0.15 0.04 ND 0.04 0.066 0.14 0.01 0.02 0.02 0.03 ND 0.02 0.09
8,5 5.58 5.30 2.79 4.04 0.44 1.42 0.27 5.1419 0.25 0.17 0.13 0.15 0.04 0.07 0.03 0.10
12,13 0.18 0.04 ND 0.04 0.04 ND 0.02 ND18 2.11 2.31 1.11 1.71 0.40 0.44 0.31 1.0817 0.72 0.79 0.47 0.63 0.22 0.22 0.09 0.4124 0.07 0.08 0.05 0.07 0.01 0.03 0.01 0.03
16,32 0.85 1.22 0.85 1.04 0.14 0.41 0.15 0.8029 0.10 0.07 0.04 0.06 0.03 0.03 0.02 0.0326 0.15 0.26 0.15 0.21 0.04 ND 0.10 ND25 ND ND ND ND ND ND ND ND
31, 28 3.06 2.39 1.26 1.83 1.00 0.80 0.68 1.3033,21,53 1.98 2.14 1.27 1.71 0.38 0.55 0.34 1.35
51 0.32 0.72 0.45 0.58 0.06 0.20 0.03 0.4622 0.95 0.57 ND 0.57 0.12 0.38 ND ND45 1.53 1.51 0.88 1.19 0.14 0.49 0.09 1.1046 0.04 0.65 0.51 0.58 0.07 0.24 0.04 0.5452 3.67 4.30 2.32 3.31 0.80 1.33 1.00 2.2449 ND ND ND ND ND ND ND ND
47,48 4.36 3.93 1.04 2.48 0.63 1.03 0.68 1.1944 2.80 2.60 1.67 2.14 0.17 0.93 0.25 1.62
37,42 1.70 1.61 1.00 1.30 0.12 0.40 0.13 0.9741,64,71 3.35 2.53 2.21 2.37 0.46 1.18 0.25 1.94
40 0.45 0.69 0.52 0.61 0.07 0.31 0.04 0.56100 0.74 0.72 0.43 0.57 0.19 1.54 0.06 0.4563 0.51 0.27 0.22 0.24 0.20 0.20 0.06 0.2174 2.54 1.96 1.03 1.50 0.95 0.67 0.42 1.05
70,76 3.70 3.43 1.95 2.69 0.63 1.03 0.42 1.8266,95 10.49 12.26 6.09 9.17 2.44 3.24 1.68 6.19
91 1.19 1.22 0.60 0.91 0.05 0.25 0.07 0.7156,60/92,84 6.40 5.84 2.62 4.23 1.02 1.53 1.28 6.23
89 7.81 8.32 3.84 6.08 0.35 2.22 0.15 4.47101 6.29 4.29 2.47 3.38 1.94 1.40 1.06 2.6499 3.19 2.23 1.28 1.75 1.12 0.81 0.40 1.54119 1.08 0.81 0.49 0.65 0.10 0.24 0.04 0.5883 0.85 0.72 0.45 0.59 0.16 0.27 0.05 0.4397 10.56 5.19 3.48 4.34 1.28 0.97 0.56 3.97
81,87 0.53 0.44 0.47 0.46 0.09 0.15 ND 0.2585 2.14 1.00 0.60 0.80 0.31 0.25 0.08 0.59136 0.52 0.83 0.42 0.62 0.05 0.24 0.03 0.44
77,110 9.01 6.68 3.95 5.31 0.44 2.48 0.21 4.4282, 151 0.54 0.68 0.31 0.50 0.15 0.18 0.07 0.36135,144 1.69 1.70 0.76 1.23 0.27 0.53 0.17 0.89
107 0.74 0.63 0.26 0.44 0.25 0.19 0.11 0.31123,149 8.76 6.74 3.18 4.96 1.24 2.00 0.60 3.74
118 7.07 3.55 1.80 2.67 2.50 1.24 0.98 2.06134 0.67 0.56 0.23 0.40 0.05 0.15 0.07 0.17146 3.65 2.35 1.28 1.81 1.11 0.72 0.69 1.59
132,105,153 30.65 16.96 8.39 12.68 7.03 4.86 4.02 11.11141 3.12 2.51 1.03 1.77 1.12 0.67 0.79 1.25
137,130,176 1.21 0.81 ND 0.81 0.23 0.26 0.14 0.49163,138 19.73 9.27 4.71 6.99 5.39 2.95 2.70 5.68
158 1.15 1.01 0.93 0.97 0.19 ND 0.27 0.81129,178 1.96 1.30 0.51 0.90 0.57 0.36 0.29 0.74187,182 8.59 4.58 2.02 3.30 2.45 1.30 1.22 2.93
183 4.64 2.27 0.98 1.62 0.49 0.61 0.29 1.28128 1.62 0.78 0.38 0.58 0.14 0.23 0.05 0.46185 0.77 0.50 0.18 0.34 0.11 0.11 0.08 0.25174 3.13 2.29 1.00 1.64 0.75 0.59 0.55 1.26177 3.35 1.89 0.78 1.33 0.83 0.49 0.41 0.99
202,171,156 3.47 1.54 0.77 1.15 0.20 0.46 0.11 1.06157,200 1.02 0.40 0.21 0.30 0.17 0.13 0.10 0.34172,197 1.56 0.57 0.37 0.47 0.25 0.17 0.15 0.47
180 12.61 5.21 2.30 3.75 3.25 1.45 1.71 3.10193 13.46 4.89 1.97 3.43 0.69 1.07 0.22 3.07191 0.36 0.09 ND 0.09 0.06 ND 0.03 ND199 ND ND ND ND ND ND ND ND
170,190 5.19 2.32 1.00 1.66 1.01 0.61 0.57 1.30198 0.31 0.10 0.06 0.08 0.03 0.04 0.02 0.11201 3.41 1.36 0.76 1.06 0.67 0.51 0.39 1.19
203,196 6.71 2.32 1.15 1.73 0.53 0.76 0.29 1.84189 0.25 0.05 0.03 0.04 0.03 0.02 0.02 0.03
208,195 2.16 0.72 0.62 0.67 0.29 0.39 0.23 1.06207 0.41 0.13 0.14 0.13 0.05 0.09 0.04 0.23194 2.04 0.56 0.25 0.41 0.29 0.20 0.15 0.37205 0.21 ND ND ND 0.02 0.05 0.01 ND206 2.31 0.74 0.88 0.81 0.17 0.59 0.17 1.35209 0.94 0.39 0.39 0.39 0.13 0.28 0.10 0.43
Total PCBs 264 175 91 134 50 55 29 110Recovery
14 164% 108% 111% 109% 118% 57% 52% 124%65 NM NM NM NM NM NM NM NM166 82% 65% 81% 73% 58% 37% 39% 64%
121

B-17. PCB concentrations in Invertebrates (ng/g) from Spring 2002 Variability Study
Field ID 2 CC INV 5 SED1 INVB1 5 SED1 INVB2 5 SED1 INVB3 5 SED1 MACRO INVCollected Spring 2002 Spring 2002 Spring 2002 Spring 2002 Spring 2002Zone 2 5 5 5 5Description Amphipods Amphipods Amphipods Amphipods White fingered mud crabReplicate analysis? Rep A Rep B Rep CAnalyzed by CBL CBL CBL CBL CBLLipid Content (%) 1.0% 1.4% 1.3% 1.2% 1.4%
1 0.19 0.34 0.06 0.06 0.403 0.79 0.37 0.08 0.24 ND
4,10 0.83 0.41 0.15 0.11 0.557,9 0.07 0.04 0.02 0.02 0.066 0.02 0.01 0.00 ND 0.02
8,5 1.71 1.35 0.73 0.64 0.8019 0.06 0.06 0.03 0.02 0.04
12,13 0.05 ND ND ND 0.0318 0.49 0.52 0.18 0.14 0.4117 0.17 0.40 0.40 0.24 0.1724 0.03 0.03 0.01 0.01 0.03
16,32 0.26 0.33 0.15 0.10 0.2829 0.02 0.03 0.01 0.01 0.0326 ND 0.10 0.07 0.08 ND25 ND ND ND ND ND
31, 28 0.56 0.53 0.21 0.19 0.2033,21,53 0.52 0.56 0.24 0.20 0.43
51 0.13 0.14 0.08 0.08 ND22 ND 0.24 0.15 0.14 ND45 0.35 0.33 0.16 0.15 0.1646 0.22 0.17 0.08 0.08 0.0852 0.91 0.97 0.63 0.57 0.4149 ND ND ND ND ND
47,48 ND 0.97 0.47 0.41 1.0844 0.52 0.65 0.41 0.37 0.21
37,42 0.32 0.44 0.26 0.25 0.2541,64,71 0.82 0.67 0.46 0.41 0.76
40 0.13 0.26 0.13 0.11 0.08100 0.13 9.44 9.67 6.54 0.1163 0.02 0.13 0.04 0.05 0.0774 0.45 0.45 0.20 0.19 0.68
70,76 0.59 0.72 0.44 0.39 0.3066,95 3.31 2.78 1.69 1.49 1.15
91 0.28 0.38 0.23 0.20 0.2456,60/92,84 1.12 1.37 0.91 0.84 0.58
89 2.12 1.57 1.05 0.76 0.36101 1.08 1.13 0.72 0.64 1.1499 0.56 0.73 0.48 0.44 0.71119 0.32 0.23 0.15 0.13 0.2183 0.16 0.19 0.11 0.11 0.0997 1.24 1.65 0.74 0.60 2.01
81,87 0.38 0.20 0.05 ND 0.2385 0.28 0.22 0.16 0.17 0.22136 0.20 0.18 0.12 0.09 0.05
77,110 1.59 1.90 1.28 1.13 1.8082, 151 0.16 0.15 0.09 0.08 0.08135,144 0.49 0.41 0.27 0.24 0.28
107 0.16 0.17 0.11 0.10 0.26123,149 1.96 1.70 1.09 0.99 1.09
118 0.95 0.87 0.57 0.49 1.09134 0.11 0.20 0.10 0.11 0.15146 0.93 0.84 0.51 0.45 1.55
132,105,153 5.61 4.68 2.76 2.57 7.60141 0.72 0.49 0.31 0.28 0.54
137,130,176 ND ND 0.09 ND 0.27163,138 2.40 2.54 1.62 1.49 3.71
158 ND 0.42 ND ND 0.81129,178 0.26 0.35 0.20 0.18 0.68187,182 1.43 1.51 0.92 0.85 3.60
183 0.70 0.58 0.34 0.32 1.01128 0.23 0.20 0.11 0.12 0.32185 0.15 0.09 0.05 0.06 0.10174 0.67 0.53 0.32 0.30 0.67177 0.55 0.44 0.29 0.27 0.84
202,171,156 0.42 0.56 0.35 0.33 1.19157,200 0.06 0.19 0.10 0.08 0.61172,197 ND 0.32 0.19 0.16 0.56
180 1.27 1.54 0.94 0.85 2.75193 1.63 0.88 0.54 0.49 0.49191 ND ND 0.02 ND 0.04199 ND ND ND ND ND
170,190 0.57 0.60 0.36 0.35 0.86198 0.07 0.07 0.04 0.04 0.16201 0.36 0.78 0.47 0.42 1.94
203,196 0.61 1.13 0.65 0.59 2.36189 0.03 0.02 0.01 0.02 0.03
208,195 0.18 0.74 0.43 0.38 2.29207 0.07 0.17 0.10 0.09 0.60194 0.13 0.22 0.12 0.11 0.41205 ND 0.01 ND ND ND206 0.12 1.15 0.66 0.56 2.56209 ND 0.54 0.29 0.25 1.87
Total PCBs 46 58 38 32 60Recovery
14 46% 111% 75% 68% 80%65 NM NM NM NM NM166 35% 66% 43% 41% 61%
122

123
APPENDIX C: PCB CONCENTRATIONS IN SEDIMENT
C-1. PCB concentrations in Sediments from Fall 2001 Core Study C-2. PCB concentrations in Sediments from Fall 2001 Variability Study C-3. PCB concentrations in Sediments from Spring 2002 Core Study C-4. PCB concentrations in Sediments from Spring 2002 Variability Study

C-1. PCB concentrations in Sediments (ng/g) from Fall 2001 Core Study
Field ID 02sed1 02sed1 02sed1 2 CORE 03sed1 03sed1 03sed1 3 CORE 04sed1 04sed1 04sed2 4 CORE 05sed2Collected Fall 2001 Fall 2001 Fall 2001 Fall 2001 Fall 2001 Fall 2001 Fall 2001 Fall 2001 Fall 2001 Fall 2001 Fall 2001 Fall 2001 Fall 2001Zone 2 2 2 2 3 3 3 3 4 4 4 4 5Description Sediment Sediment Sediment Sediment Sediment Sediment Sediment Sediment Sediment Sediment Sediment Sediment SedimentReplicate analysis? Rep A Rep B Rep C Rep A Rep B Rep C Rep A Rep B Rep AAnalyzed by ANS ANS ANS ANS ANS ANS ANS ANS ANS ANS ANS ANS ANS
Amt. Nitrogen (mg) 0.24 0.24 0.24 0.21 0.20 0.21 0.04 0.10 0.03 0.07 0.00Amt. Carbon (mg) 3.77 3.60 3.69 5.95 6.59 6.27 1.47 2.04 6.59 4.32 0.64Sediment % Solid 42 40 41 41 41 42 39 40 54 55 72 61 69Sediment % Water 58 60 59 59 59 58 61 60 46 45 28 39 31
1 ND Sample Lost ND ND 0.23 ND ND 0.23 0.53 ND ND 0.38 ND3 ND ND ND ND ND ND ND ND 0.87 0.46 0.66 ND
4,10 ND ND ND ND ND ND ND ND ND ND ND ND7,9 ND ND ND ND ND ND ND ND ND ND ND ND6 0.11 0.04 0.08 0.08 0.09 0.13 0.10 0.03 0.03 0.02 0.04 ND
8,5 0.71 0.89 0.80 0.60 0.45 0.57 0.54 0.47 0.39 0.32 0.39 ND19 0.09 0.05 0.07 0.06 0.09 0.29 0.15 0.03 0.04 0.05 0.06 ND
12,13 0.02 0.03 0.02 0.31 0.07 0.02 0.14 0.01 0.01 0.01 0.03 0.0118 0.19 0.28 0.23 1.34 1.23 1.73 1.43 0.21 0.22 0.17 0.40 0.1717 0.36 0.42 0.39 0.72 0.66 0.88 0.75 0.23 0.24 0.27 0.34 0.0224 ND ND ND ND ND ND ND ND ND ND ND ND
16,32 0.42 0.30 0.36 1.04 0.96 1.36 1.12 0.25 0.24 0.17 0.35 ND29 ND ND ND ND ND ND ND 0.01 ND 0.00 ND ND26 ND 0.02 0.02 0.37 0.39 0.56 0.44 0.16 0.13 0.16 0.20 0.0425 ND ND ND 0.37 0.22 0.27 0.29 0.10 0.11 0.09 0.13 0.09
31, 28 0.93 0.99 0.96 8.36 4.55 6.43 6.45 0.80 1.20 1.34 2.08 0.1833,21,53 0.57 0.34 0.45 2.02 1.93 2.64 2.20 0.54 0.39 0.27 0.66 0.08
51 0.07 0.07 0.07 0.26 0.26 0.31 0.28 0.08 0.07 0.05 0.09 0.0022 0.25 0.22 0.23 0.93 0.89 1.24 1.02 0.23 0.16 0.19 0.33 ND45 0.19 0.11 0.15 0.49 0.45 0.60 0.51 0.16 0.12 0.08 0.17 0.0146 0.08 0.11 0.09 0.24 0.22 0.30 0.25 0.06 0.06 0.03 0.08 0.0152 0.74 1.84 1.29 3.37 3.21 4.55 3.71 1.09 0.79 0.78 1.32 0.1349 0.82 1.06 0.94 2.95 2.84 3.88 3.22 0.92 0.69 0.61 1.11 0.13
47,48 1.17 1.06 1.11 3.98 3.71 5.30 4.33 1.08 0.77 0.56 1.31 0.1044 0.72 1.22 0.97 3.65 3.43 4.98 4.02 1.08 0.68 0.59 1.26 0.08
37,42 0.56 0.56 0.56 2.17 2.06 2.93 2.39 0.67 0.45 0.36 0.77 0.0641,64,71 0.93 0.93 0.93 5.26 3.48 6.94 5.22 1.45 1.03 0.52 1.55 0.23
40 0.14 0.26 0.20 0.65 0.67 0.84 0.72 0.25 0.13 0.11 0.24 0.01100 ND ND ND 0.10 0.11 0.16 0.12 ND ND ND 0.12 ND63 ND ND ND 0.12 0.14 0.19 0.15 ND ND 0.03 0.09 ND74 0.29 0.50 0.39 2.19 2.10 2.98 2.42 0.67 0.32 0.36 0.75 0.09
70,76 1.02 2.43 1.73 6.32 6.20 8.76 7.09 2.30 1.25 1.53 2.54 0.2266,95 3.60 5.68 4.64 15.63 13.66 19.97 16.42 4.02 2.24 3.23 5.40 0.49
91 0.20 0.36 0.28 0.52 0.55 0.81 0.63 0.29 0.20 0.14 0.26 0.0356,60/92,84 2.93 1.70 2.31 4.82 7.99 10.79 7.87 3.48 2.03 2.15 3.31 0.57
89 NA NA NA NA NA NA NA NA NA NA NA NA101 1.07 2.22 1.65 3.35 3.38 4.72 3.82 1.28 0.90 0.85 1.43 0.1499 0.71 1.14 0.93 1.47 1.52 2.03 1.67 0.72 0.48 0.45 0.70 0.09
119 NA NA NA NA NA NA NA NA NA NA NA NA83 0.12 0.16 0.14 0.19 0.20 0.26 0.22 0.13 0.10 0.07 0.11 0.0297 0.41 0.77 0.59 0.78 0.74 1.06 0.86 0.44 0.28 0.26 0.39 0.05
81,87 ND ND ND 0.23 0.23 0.32 0.26 0.13 ND ND 0.19 ND85 0.23 0.30 0.27 0.49 0.48 0.68 0.55 0.27 0.18 0.12 0.22 ND
136 0.19 0.26 0.22 0.60 0.59 0.81 0.67 0.14 0.12 0.09 0.20 0.0177,110 2.04 4.27 3.15 5.24 5.53 7.50 6.09 2.56 1.78 1.71 2.59 0.2482, 151 0.93 1.29 1.11 2.75 2.71 3.63 3.03 0.77 0.56 0.47 0.96 0.08135,144 0.43 0.67 0.55 1.40 1.37 1.84 1.53 0.40 0.31 0.24 0.49 0.06
107 0.11 0.19 0.15 0.35 0.35 0.51 0.40 0.13 0.08 0.08 0.14 0.03123,149 1.88 2.76 2.32 6.65 6.81 9.00 7.49 1.48 1.23 0.93 2.17 0.15
118 1.12 2.58 1.85 2.66 2.87 3.83 3.12 1.40 0.83 0.96 1.37 0.11134 ND 0.02 0.02 0.03 ND 0.06 0.04 0.02 0.03 0.01 0.02 ND146 0.22 0.29 0.25 0.77 0.78 0.12 0.55 0.23 0.16 0.12 0.22 0.02
132,105,153 3.83 5.35 4.59 14.32 14.32 19.06 15.90 2.80 2.22 1.84 4.41 0.33141 0.40 0.38 0.39 1.17 1.10 1.39 1.22 0.25 0.20 0.15 0.35 0.04
137,130,176 0.12 0.34 0.23 0.57 0.56 0.71 0.61 0.16 0.11 0.08 0.19 0.03163,138 3.74 6.12 4.93 12.48 12.92 17.12 14.17 2.94 2.22 1.85 4.15 0.26
158 0.03 0.04 0.04 0.06 0.06 0.08 0.07 0.02 0.01 ND 0.03 ND129,178 0.36 0.43 0.39 0.90 0.84 1.14 0.96 0.27 0.20 0.14 0.31 0.07187,182 1.63 1.64 1.63 4.11 3.95 5.14 4.40 1.00 0.76 0.55 1.30 0.15
183 0.84 0.69 0.76 2.52 2.43 3.04 2.66 0.40 0.31 0.26 0.69 0.10128 0.20 0.38 0.29 0.47 0.49 0.62 0.53 0.18 0.13 0.10 0.19 0.07185 0.23 0.20 0.22 0.45 0.41 0.53 0.46 0.07 0.06 0.07 0.14 0.02174 0.88 0.95 0.91 3.10 3.04 3.92 3.35 0.57 0.45 0.38 0.92 0.08177 0.89 0.93 0.91 2.49 2.34 2.96 2.60 0.54 0.40 0.32 0.75 0.07
202,171,156 0.73 0.89 0.81 3.20 3.04 4.25 3.50 0.51 0.36 0.26 0.86 0.08157,200 0.29 0.33 0.31 0.85 0.82 1.13 0.93 0.19 0.12 0.08 0.25 0.04172,197 0.16 0.16 0.16 0.42 0.39 0.49 0.43 0.08 0.09 0.06 0.13 ND
180 3.00 3.56 3.28 11.83 11.29 14.69 12.60 1.86 1.39 1.23 3.26 0.19193 0.22 0.31 0.26 0.90 0.76 1.11 0.92 0.16 0.07 0.03 0.21 ND191 0.05 0.03 0.04 0.17 0.11 0.17 0.15 0.02 0.03 0.03 0.05 0.01199 0.08 0.09 0.08 0.24 0.21 0.29 0.25 0.05 0.04 0.03 0.07 0.02
170,190 2.38 2.53 2.45 8.51 8.07 10.43 9.01 1.26 1.13 1.01 2.40 0.31198 0.06 0.10 0.08 0.43 0.40 0.59 0.47 0.06 0.04 0.02 0.11 ND201 1.72 3.53 2.63 8.45 7.98 11.62 9.35 1.24 1.03 0.54 2.20 0.23
203,196 1.93 4.56 3.25 8.20 7.72 11.18 9.03 1.23 0.95 0.59 2.16 0.26189 0.08 0.16 0.12 0.30 0.34 0.35 0.33 0.09 0.03 0.05 0.10 0.06
208,195 0.65 0.85 0.75 2.55 1.39 3.45 2.46 0.23 0.19 0.20 0.58 ND207 0.13 0.30 0.21 1.84 1.56 2.41 1.94 0.18 0.18 0.06 0.41 0.04194 0.87 2.28 1.57 2.76 2.50 3.63 2.96 0.52 0.35 0.28 0.78 0.06205 0.14 0.04 0.09 0.11 0.13 0.21 0.15 0.03 0.01 0.02 0.04 0.01206 1.81 9.34 5.58 27.52 26.87 39.09 31.16 3.69 3.77 1.06 6.97 0.93209 0.13 0.21 0.17 4.09 3.72 5.75 4.52 0.39 0.36 0.11 0.93 0.10
Total PCBs 54 85 70 221 210 293 242 52 39 32 73 7Recovery
14 132% 127% 129% 110% 123% 150% 128% 141% 142% 148% 148% 145%65 111% 103% 107% 82% 92% 112% 95% 115% 112% 116% 116% 115%
166 111% 107% 109% 86% 103% 125% 105% 123% 121% 121% 121% 117%
124

C-1. PCB concentrations in Sediments (ng/g) from Fall 2001 Core Study
Field ID 05sed2 05sed2 05sed3 05sed3 5 CORECollected Fall 2001 Fall 2001 Fall 2001 Fall 2001 Fall 2001Zone 5 5 5 5 5Description Sediment Sediment Sediment Sediment SedimentReplicate analysis? Rep B Rep C Rep A Rep BAnalyzed by ANS ANS ANS ANS ANS
Amt. Nitrogen (mg) 0.02 0.00 0.00 0.01Amt. Carbon (mg) 0.88 0.69 0.64 0.71Sediment % Solid 73 72 71 69 60Sediment % Water 27 28 29 31 40
1 ND ND ND ND ND3 0.46 ND ND 0.48 0.47
4,10 ND ND ND ND ND7,9 ND ND ND ND ND6 ND ND ND 0.04 0.02
8,5 ND ND ND 0.29 0.1819 ND 0.02 0.02 0.01 0.02
12,13 0.00 0.08 0.01 0.08 0.0318 0.13 0.20 0.03 0.07 0.1717 0.06 0.05 0.07 0.11 0.0524 ND ND ND ND ND
16,32 0.05 0.04 0.05 0.05 0.0529 ND ND ND 0.00 0.0026 0.05 0.03 0.03 0.05 0.0325 0.04 0.06 0.07 0.07 0.08
31, 28 0.23 0.18 0.27 0.43 0.2433,21,53 0.10 0.07 0.08 0.17 0.08
51 0.01 0.01 0.01 0.01 0.0122 ND 0.07 0.05 0.09 0.0745 0.04 0.01 0.02 0.03 0.0446 0.01 0.01 0.01 0.01 0.0152 0.26 0.12 0.16 0.18 0.1449 0.22 0.11 0.19 0.45 0.18
47,48 0.18 0.16 0.16 0.15 0.1844 0.18 0.15 0.14 0.15 0.12
37,42 0.10 0.05 0.10 0.25 0.1041,64,71 0.27 0.14 0.27 0.18 0.19
40 0.04 0.03 0.03 0.04 0.03100 ND ND ND ND ND63 ND ND ND ND ND74 0.07 0.06 0.08 0.11 0.06
70,76 0.31 0.20 0.30 0.35 0.1966,95 0.67 0.47 0.78 0.77 0.46
91 0.07 0.04 0.03 0.04 0.0456,60/92,84 1.39 0.48 0.56 0.75 0.74
89 NA NA NA NA NA101 0.28 0.15 0.17 0.19 0.1599 0.14 0.09 0.10 0.11 0.09
119 NA NA NA NA NA83 0.02 0.01 0.02 0.02 0.0297 0.07 0.05 0.06 0.06 0.05
81,87 ND ND ND ND ND85 0.03 0.02 0.03 0.02 0.03
136 0.05 0.02 0.02 0.03 0.0477,110 0.46 0.28 0.34 0.39 0.2282, 151 0.22 0.08 0.09 0.11 0.08135,144 0.12 0.05 0.06 0.06 0.05
107 0.02 0.01 0.01 0.02 0.02123,149 0.47 0.19 0.22 0.25 0.21
118 0.18 0.13 0.17 0.20 0.12134 ND ND ND ND 0.03146 0.05 0.03 0.03 0.04 0.06
132,105,153 0.89 0.38 0.44 0.50 0.37141 0.09 0.04 0.04 0.05 0.06
137,130,176 0.03 0.01 0.02 0.02 0.02163,138 0.72 0.35 0.39 0.47 0.30
158 ND ND ND ND ND129,178 0.08 0.03 0.04 0.04 0.07187,182 0.28 0.15 0.21 0.27 0.38
183 0.15 0.08 0.07 0.07 0.18128 0.02 0.04 0.03 0.03 0.03185 0.04 0.02 0.02 0.02 0.03174 0.20 0.06 0.07 0.10 0.14177 0.18 0.10 0.09 0.09 0.08
202,171,156 0.12 0.07 0.08 0.10 0.57157,200 0.05 0.06 0.02 0.04 0.39172,197 0.04 0.02 0.02 0.02 0.04
180 0.62 0.25 0.27 0.31 0.24193 0.06 0.02 0.02 0.02 0.03191 ND ND ND ND 0.01199 0.02 0.01 0.01 0.01 0.05
170,190 0.48 0.19 0.23 0.33 0.20198 0.01 0.01 0.02 0.01 0.15201 0.34 0.25 0.29 0.38 3.08
203,196 0.34 0.22 0.29 0.25 2.44189 0.04 0.02 0.00 0.03 0.03
208,195 ND ND ND ND 0.49207 0.08 0.06 0.06 0.06 1.13194 0.14 0.07 0.09 0.10 0.25205 0.00 0.00 0.01 0.01 0.04206 0.95 1.09 1.21 1.17 21.44209 0.11 0.13 0.12 0.11 1.68
Total PCBs 13 8 9 12 39Recovery
14 136% NM 139% 138% 131%65 110% 125% 114% 112% 109%
166 117% 131% 126% 121% 120%
125
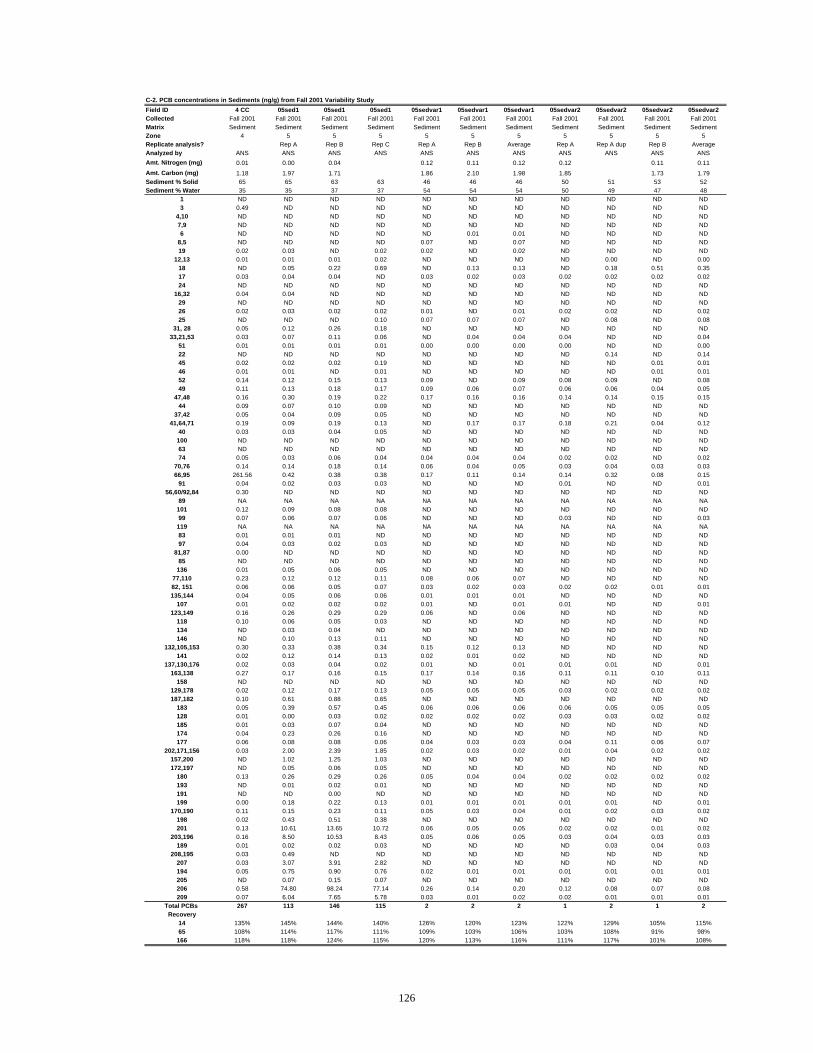
C-2. PCB concentrations in Sediments (ng/g) from Fall 2001 Variability Study
Field ID 4 CC 05sed1 05sed1 05sed1 05sedvar1 05sedvar1 05sedvar1 05sedvar2 05sedvar2 05sedvar2 05sedvar2Collected Fall 2001 Fall 2001 Fall 2001 Fall 2001 Fall 2001 Fall 2001 Fall 2001 Fall 2001 Fall 2001 Fall 2001 Fall 2001Matrix Sediment Sediment Sediment Sediment Sediment Sediment Sediment Sediment Sediment Sediment SedimentZone 4 5 5 5 5 5 5 5 5 5 5Replicate analysis? Rep A Rep B Rep C Rep A Rep B Average Rep A Rep A dup Rep B AverageAnalyzed by ANS ANS ANS ANS ANS ANS ANS ANS ANS ANS ANS
Amt. Nitrogen (mg) 0.01 0.00 0.04 0.12 0.11 0.12 0.12 0.11 0.11
Amt. Carbon (mg) 1.18 1.97 1.71 1.86 2.10 1.98 1.85 1.73 1.79Sediment % Solid 65 65 63 63 46 46 46 50 51 53 52Sediment % Water 35 35 37 37 54 54 54 50 49 47 48
1 ND ND ND ND ND ND ND ND ND ND ND3 0.49 ND ND ND ND ND ND ND ND ND ND
4,10 ND ND ND ND ND ND ND ND ND ND ND7,9 ND ND ND ND ND ND ND ND ND ND ND6 ND ND ND ND ND 0.01 0.01 ND ND ND ND
8,5 ND ND ND ND 0.07 ND 0.07 ND ND ND ND19 0.02 0.03 ND 0.02 0.02 ND 0.02 ND ND ND ND
12,13 0.01 0.01 0.01 0.02 ND ND ND ND 0.00 ND 0.0018 ND 0.05 0.22 0.69 ND 0.13 0.13 ND 0.18 0.51 0.3517 0.03 0.04 0.04 ND 0.03 0.02 0.03 0.02 0.02 0.02 0.0224 ND ND ND ND ND ND ND ND ND ND ND
16,32 0.04 0.04 ND ND ND ND ND ND ND ND ND29 ND ND ND ND ND ND ND ND ND ND ND26 0.02 0.03 0.02 0.02 0.01 ND 0.01 0.02 0.02 ND 0.0225 ND ND ND 0.10 0.07 0.07 0.07 ND 0.08 ND 0.08
31, 28 0.05 0.12 0.26 0.18 ND ND ND ND ND ND ND33,21,53 0.03 0.07 0.11 0.06 ND 0.04 0.04 0.04 ND ND 0.04
51 0.01 0.01 0.01 0.01 0.00 0.00 0.00 0.00 ND ND 0.0022 ND ND ND ND ND ND ND ND 0.14 ND 0.1445 0.02 0.02 0.02 0.19 ND ND ND ND ND 0.01 0.0146 0.01 0.01 ND 0.01 ND ND ND ND ND 0.01 0.0152 0.14 0.12 0.15 0.13 0.09 ND 0.09 0.08 0.09 ND 0.0849 0.11 0.13 0.18 0.17 0.09 0.06 0.07 0.06 0.06 0.04 0.05
47,48 0.16 0.30 0.19 0.22 0.17 0.16 0.16 0.14 0.14 0.15 0.1544 0.09 0.07 0.10 0.09 ND ND ND ND ND ND ND
37,42 0.05 0.04 0.09 0.05 ND ND ND ND ND ND ND41,64,71 0.19 0.09 0.19 0.13 ND 0.17 0.17 0.18 0.21 0.04 0.12
40 0.03 0.03 0.04 0.05 ND ND ND ND ND ND ND100 ND ND ND ND ND ND ND ND ND ND ND63 ND ND ND ND ND ND ND ND ND ND ND74 0.05 0.03 0.06 0.04 0.04 0.04 0.04 0.02 0.02 ND 0.02
70,76 0.14 0.14 0.18 0.14 0.06 0.04 0.05 0.03 0.04 0.03 0.0366,95 261.56 0.42 0.38 0.38 0.17 0.11 0.14 0.14 0.32 0.08 0.15
91 0.04 0.02 0.03 0.03 ND ND ND 0.01 ND ND 0.0156,60/92,84 0.30 ND ND ND ND ND ND ND ND ND ND
89 NA NA NA NA NA NA NA NA NA NA NA101 0.12 0.09 0.08 0.08 ND ND ND ND ND ND ND99 0.07 0.06 0.07 0.06 ND ND ND 0.03 ND ND 0.03
119 NA NA NA NA NA NA NA NA NA NA NA83 0.01 0.01 0.01 ND ND ND ND ND ND ND ND97 0.04 0.03 0.02 0.03 ND ND ND ND ND ND ND
81,87 0.00 ND ND ND ND ND ND ND ND ND ND85 ND ND ND ND ND ND ND ND ND ND ND
136 0.01 0.05 0.06 0.05 ND ND ND ND ND ND ND77,110 0.23 0.12 0.12 0.11 0.08 0.06 0.07 ND ND ND ND82, 151 0.06 0.06 0.05 0.07 0.03 0.02 0.03 0.02 0.02 0.01 0.01135,144 0.04 0.05 0.06 0.06 0.01 0.01 0.01 ND ND ND ND
107 0.01 0.02 0.02 0.02 0.01 ND 0.01 0.01 ND ND 0.01123,149 0.16 0.26 0.29 0.29 0.06 ND 0.06 ND ND ND ND
118 0.10 0.06 0.05 0.03 ND ND ND ND ND ND ND134 ND 0.03 0.04 ND ND ND ND ND ND ND ND146 ND 0.10 0.13 0.11 ND ND ND ND ND ND ND
132,105,153 0.30 0.33 0.38 0.34 0.15 0.12 0.13 ND ND ND ND141 0.02 0.12 0.14 0.13 0.02 0.01 0.02 ND ND ND ND
137,130,176 0.02 0.03 0.04 0.02 0.01 ND 0.01 0.01 0.01 ND 0.01163,138 0.27 0.17 0.16 0.15 0.17 0.14 0.16 0.11 0.11 0.10 0.11
158 ND ND ND ND ND ND ND ND ND ND ND129,178 0.02 0.12 0.17 0.13 0.05 0.05 0.05 0.03 0.02 0.02 0.02187,182 0.10 0.61 0.88 0.65 ND ND ND ND ND ND ND
183 0.05 0.39 0.57 0.45 0.06 0.06 0.06 0.06 0.05 0.05 0.05128 0.01 0.00 0.03 0.02 0.02 0.02 0.02 0.03 0.03 0.02 0.02185 0.01 0.03 0.07 0.04 ND ND ND ND ND ND ND174 0.04 0.23 0.26 0.16 ND ND ND ND ND ND ND177 0.06 0.08 0.08 0.06 0.04 0.03 0.03 0.04 0.11 0.06 0.07
202,171,156 0.03 2.00 2.39 1.85 0.02 0.03 0.02 0.01 0.04 0.02 0.02157,200 ND 1.02 1.25 1.03 ND ND ND ND ND ND ND172,197 ND 0.05 0.06 0.05 ND ND ND ND ND ND ND
180 0.13 0.26 0.29 0.26 0.05 0.04 0.04 0.02 0.02 0.02 0.02193 ND 0.01 0.02 0.01 ND ND ND ND ND ND ND191 ND ND 0.00 ND ND ND ND ND ND ND ND199 0.00 0.18 0.22 0.13 0.01 0.01 0.01 0.01 0.01 ND 0.01
170,190 0.11 0.15 0.23 0.11 0.05 0.03 0.04 0.01 0.02 0.03 0.02198 0.02 0.43 0.51 0.38 ND ND ND ND ND ND ND201 0.13 10.61 13.65 10.72 0.06 0.05 0.05 0.02 0.02 0.01 0.02
203,196 0.16 8.50 10.53 8.43 0.05 0.06 0.05 0.03 0.04 0.03 0.03189 0.01 0.02 0.02 0.03 ND ND ND ND 0.03 0.04 0.03
208,195 0.03 0.49 ND ND ND ND ND ND ND ND ND207 0.03 3.07 3.91 2.82 ND ND ND ND ND ND ND194 0.05 0.75 0.90 0.76 0.02 0.01 0.01 0.01 0.01 0.01 0.01205 ND 0.07 0.15 0.07 ND ND ND ND ND ND ND206 0.58 74.80 98.24 77.14 0.26 0.14 0.20 0.12 0.08 0.07 0.08209 0.07 6.04 7.65 5.78 0.03 0.01 0.02 0.02 0.01 0.01 0.01
Total PCBs 267 113 146 115 2 2 2 1 2 1 2Recovery
14 135% 145% 144% 140% 126% 120% 123% 122% 129% 105% 115%65 108% 114% 117% 111% 109% 103% 106% 103% 108% 91% 98%
166 118% 118% 124% 115% 120% 113% 116% 111% 117% 101% 108%
126

C-2. PCB concentrations in Sediments (ng/g) from Fall 2001 Variability Study
Field ID 05sedvar3 05sedvar3 05sedvar3 05sedvar4 05sedvar4 05sedvar4 05sedvar4Collected Fall 2001 Fall 2001 Fall 2001 Fall 2001 Fall 2001 Fall 2001 Fall 2001Matrix Sediment Sediment Sediment Sediment Sediment Sediment SedimentZone 5 5 5 5 5 5 5Replicate analysis? Rep A Rep B Average Rep A Rep A dup Rep B AverageAnalyzed by ANS ANS ANS ANS ANS ANS ANS
Amt. Nitrogen (mg) 0.00 0.00 0.00 0.00 0.00 0.00
Amt. Carbon (mg) 0.19 0.18 0.19 0.11 0.12 0.11Sediment % Solid 76 74 75 80 80 83 81Sediment % Water 24 26 25 20 20 17 19
1 ND ND ND ND ND ND ND3 ND ND ND ND ND ND ND
4,10 ND ND ND ND ND ND ND7,9 ND ND ND ND ND ND ND6 ND 0.00 0.00 0.00 0.00 ND ND
8,5 ND ND ND ND ND ND ND19 ND ND ND ND ND ND ND
12,13 ND 0.00 0.00 ND ND ND ND18 ND ND ND 0.08 0.08 0.08 0.0817 ND 0.01 0.01 0.01 0.01 ND 0.0124 ND ND ND ND ND ND ND
16,32 ND ND ND ND ND ND ND29 ND ND ND ND ND ND ND26 0.01 0.00 0.01 0.01 0.00 0.00 0.0025 ND ND ND 0.03 ND ND 0.03
31, 28 0.04 ND 0.04 ND ND ND ND33,21,53 ND 0.02 0.02 ND ND ND ND
51 0.01 0.00 0.01 0.00 0.00 0.00 0.0022 ND ND ND ND ND ND ND45 ND ND ND ND ND ND ND46 0.01 ND 0.01 ND ND ND ND52 0.07 0.05 0.06 ND 0.04 ND 0.0449 0.09 0.05 0.07 0.03 0.05 0.02 0.03
47,48 0.21 0.07 0.14 0.07 0.06 0.07 0.0744 ND ND ND ND ND ND ND
37,42 0.04 ND 0.04 0.02 ND ND 0.0241,64,71 0.02 0.09 0.05 0.00 0.03 ND 0.01
40 ND ND ND ND ND ND ND100 ND ND ND ND ND ND ND63 ND ND ND ND ND ND ND74 0.02 0.02 0.02 0.01 0.01 0.01 0.01
70,76 0.10 0.06 0.08 0.04 0.04 0.03 0.0466,95 0.31 0.13 0.22 0.10 0.11 0.05 0.08
91 0.01 0.01 0.01 0.01 0.01 ND 0.0156,60/92,84 0.24 ND 0.24 ND ND ND ND
89 NA NA NA NA NA NA NA101 0.07 0.04 0.06 0.03 0.03 ND 0.0399 0.04 0.03 0.03 0.02 0.02 ND 0.02
119 NA NA NA NA NA NA NA83 0.01 ND 0.01 ND ND ND ND97 0.02 ND 0.02 ND ND ND ND
81,87 ND ND ND ND ND ND ND85 ND ND ND ND ND ND ND
136 0.01 ND 0.01 ND ND ND ND77,110 0.13 0.07 0.10 0.06 0.06 0.04 0.0582, 151 0.04 0.03 0.03 0.03 0.02 0.01 0.02135,144 0.03 0.02 0.02 0.01 0.01 0.01 0.01
107 0.01 ND 0.01 0.00 0.00 ND 0.00123,149 0.09 0.07 0.08 0.05 0.04 0.03 0.04
118 0.06 0.02 0.04 0.03 0.02 ND 0.03134 ND ND ND ND ND ND ND146 ND ND ND ND ND ND ND
132,105,153 0.18 0.14 0.16 0.12 0.10 0.08 0.10141 0.01 0.01 0.01 0.01 0.01 0.01 0.01
137,130,176 0.01 0.01 0.01 0.01 0.01 0.01 0.01163,138 0.19 0.11 0.15 0.10 0.08 0.06 0.07
158 ND ND ND ND ND ND ND129,178 0.01 0.01 0.01 0.01 0.01 0.01 0.01187,182 0.11 0.09 0.10 0.08 0.09 ND 0.08
183 0.03 0.02 0.03 0.02 0.02 0.01 0.02128 0.01 0.01 0.01 0.01 0.00 0.00 0.00185 ND ND ND ND 0.01 ND 0.01174 0.04 0.02 0.03 0.02 0.02 0.01 0.02177 0.04 0.02 0.03 0.02 0.02 0.01 0.02
202,171,156 0.04 0.02 0.03 0.02 0.02 0.01 0.02157,200 ND ND ND 0.01 ND ND 0.01172,197 0.03 ND 0.03 ND ND ND ND
180 0.13 0.08 0.11 0.08 0.06 0.04 0.06193 ND ND ND ND ND 0.00 0.00191 ND ND ND 0.00 ND ND 0.00199 0.00 0.00 0.00 0.00 ND 0.00 0.00
170,190 0.10 0.06 0.08 0.07 0.06 0.05 0.05198 0.00 ND 0.00 0.00 0.01 ND 0.01201 0.10 0.06 0.08 0.07 0.06 0.05 0.06
203,196 0.10 0.06 0.08 0.07 0.06 0.05 0.06189 0.01 ND 0.01 ND ND 0.01 0.01
208,195 ND ND ND ND ND ND ND207 0.02 0.01 0.02 0.01 0.01 0.01 0.01194 0.04 0.02 0.03 0.02 0.03 0.01 0.02205 ND ND ND ND ND ND ND206 0.38 0.22 0.30 0.32 0.25 0.21 0.25209 0.05 0.03 0.04 0.03 0.03 0.02 0.03
Total PCBs 3 2 3 2 2 1 2Recovery
14 113% 85% 99% 118% 121% 115% 117%65 99% 72% 86% 105% 105% 102% 103%
166 109% 75% 92% 112% 114% 112% 113%
127

C-3. PCB concentrations in Sediments (ng/g) from Spring 2002 Core Study
Field ID 2 Sed1 2 Sed3 2 Sed4 2 CORE 3 Sed1 3 Sed1 3 Sed2 3 CORE 4 Sed1 4 Sed2 4 CORE 5 Sed1Collected Spring 2002 Spring 2002 Spring 2002 Spring 2002 Spring 2002 Spring 2002 Spring 2002 Spring 2002 Spring 2002 Spring 2002 Spring 2002 Spring 2002Matrix Sediment Sediment Sediment Sediment Sediment Sediment Sediment Sediment Sediment Sediment Sediment SedimentZone 2 2 2 2 3 3 3 3 4 4 4 5Replicate analysis? Rep A Rep BAnalyzed by ANS ANS ANS ANS ANS ANS ANS ANS ANS ANS ANS ANSAmt. Nitrogen (mg) 0.03 0.18 0.00 0.07 0.23 0.22 0.07 0.14 0.12 0.03 0.08 0.06Amt. Carbon (mg) 2.31 4.80 0.21 2.44 7.59 7.97 1.40 4.69 1.96 1.41 1.69 1.86Sediment % Solid 63 46 80 63 51 52 74 74 44 73 60 61Sediment % Water
1 ND ND ND 0.20 ND ND 0.15 0.15 1.43 ND 1.43 ND3 ND 1.19 ND 1.19 ND ND ND ND ND ND ND ND
4,10 ND 0.06 ND 0.05 0.17 0.15 0.03 0.09 0.04 0.02 0.03 ND7,9 0.02 0.09 ND 0.05 0.02 0.03 0.03 0.03 ND 0.02 0.02 ND6 0.02 0.27 0.01 0.08 0.19 0.21 0.03 0.12 0.09 0.00 0.05 ND
8,5 0.24 1.66 ND 0.97 0.91 0.95 0.66 0.79 0.33 0.56 0.67 ND19 0.25 ND ND 0.25 ND ND ND ND ND ND ND ND
12,13 ND 0.10 ND 0.06 ND 0.07 0.02 0.05 0.20 0.03 0.10 ND18 0.78 ND ND 0.81 8.72 8.46 0.15 4.37 0.16 0.11 0.26 ND17 ND 0.89 ND 0.47 ND 2.00 0.10 1.05 0.25 0.09 0.55 0.2024 0.02 0.11 ND 0.05 0.08 0.08 0.01 0.05 0.08 0.01 0.04 ND
16,32 0.24 0.79 ND 0.40 2.76 3.12 0.18 1.56 0.31 0.16 0.26 ND29 ND 0.02 ND 0.02 0.04 0.04 ND 0.04 ND ND 8.81 ND26 ND ND ND ND 1.49 1.70 ND 1.60 ND ND 0.32 ND25 ND ND ND ND ND 1.71 ND 1.71 ND ND ND ND
31, 28 0.33 0.63 ND 0.42 10.52 20.96 0.16 7.95 0.94 0.67 3.55 ND33,21,53 0.14 0.27 ND 0.22 3.96 2.81 0.34 1.86 0.19 0.32 0.35 ND
51 0.04 0.23 ND 0.11 2.40 2.78 0.03 1.31 0.11 0.03 0.21 0.0922 0.16 0.42 ND 0.25 2.85 3.32 0.21 1.65 0.17 0.24 0.72 ND45 0.03 0.05 ND 0.08 1.67 1.89 0.07 0.93 0.09 0.08 0.20 0.1046 0.08 0.38 0.01 0.12 0.56 0.64 0.02 0.31 0.03 0.02 0.03 ND52 0.41 0.67 ND 0.40 6.93 8.08 0.33 3.92 0.54 0.36 1.00 ND49 0.39 0.81 ND 0.45 7.23 8.25 0.28 4.01 0.58 0.45 1.06 0.16
47,48 1.21 1.82 0.60 1.21 4.82 12.78 0.28 4.54 2.14 ND 2.14 0.8644 0.36 0.49 ND 0.32 10.00 10.14 0.29 5.18 0.51 0.26 0.95 ND
37,42 0.18 0.36 ND 0.20 6.19 5.34 0.12 2.94 0.34 0.16 0.62 0.0741,64,71 0.58 1.23 ND 0.68 16.72 6.04 0.47 5.92 0.25 0.48 0.74 ND
40 0.15 0.39 ND 0.20 4.02 2.81 0.07 1.74 0.17 0.10 0.32 ND100 ND ND ND 0.03 ND ND 0.05 0.05 0.07 0.06 0.07 5.7163 0.04 0.04 ND 0.03 ND ND 0.05 0.05 0.06 ND 0.25 ND74 0.20 0.40 ND 0.22 5.08 5.39 0.12 2.68 0.34 0.19 0.64 ND
70,76 0.61 1.11 ND 0.62 12.54 13.88 0.27 6.74 0.91 0.51 3.39 ND66,95 0.71 1.10 ND 0.72 25.55 31.06 1.01 14.66 0.94 1.15 2.86 0.14
91 0.13 0.29 0.01 0.18 1.21 1.33 0.52 0.89 0.21 0.70 3.11 ND56,60/92,84 1.23 1.84 ND 1.20 15.59 17.95 0.24 8.50 1.00 0.22 1.49 0.82
89 NA NA NA NA NA NA NA NA NA NA NA NA101 0.63 0.73 ND 0.49 6.43 7.31 0.28 3.57 0.66 0.26 0.96 0.0699 0.44 0.58 0.03 0.28 2.84 3.20 0.16 1.59 0.06 0.17 0.54 0.07
119 NA NA NA NA NA NA NA NA NA NA NA NA83 0.20 0.17 0.01 0.11 3.27 2.34 0.05 1.43 0.21 0.00 0.88 0.0497 0.19 0.25 ND 0.16 1.36 1.57 0.02 0.74 0.20 0.03 0.12 ND
81,87 0.24 0.33 ND 0.23 1.34 1.56 0.14 0.79 0.18 0.15 0.56 ND85 ND ND ND ND 1.61 2.74 ND 2.18 1.51 ND 1.15 ND
136 ND ND ND ND 1.25 1.35 ND 1.30 ND ND 0.45 ND77,110 1.43 1.97 ND 1.23 9.60 10.52 0.56 5.31 1.45 0.68 2.33 0.1482, 151 0.41 0.49 0.05 0.26 3.35 4.78 0.15 2.11 0.31 0.16 0.83 0.03135,144 0.19 0.22 0.01 0.12 1.75 2.33 0.12 1.08 0.30 0.12 0.55 0.11
107 0.09 0.10 ND 0.07 1.26 1.32 0.05 0.67 0.09 0.03 0.39 0.11123,149 0.90 0.96 ND 0.69 6.54 9.55 0.33 4.19 1.05 0.40 1.31 ND
118 0.66 0.86 ND 0.54 3.50 8.43 0.07 3.02 1.94 0.05 0.88 0.36134 1.19 1.51 0.06 0.75 3.15 7.01 0.04 2.56 2.28 0.03 0.81 0.09146 0.28 0.33 ND 0.23 1.99 3.95 0.15 1.56 1.19 0.16 0.60 0.35
132,105,153 2.24 2.47 ND 1.73 15.25 26.99 1.09 11.10 4.38 1.20 3.30 0.45141 0.18 0.22 0.02 0.12 1.30 2.06 0.04 0.86 0.19 0.20 0.47 0.16
137,130,176 0.16 ND ND 0.16 ND ND ND ND 0.31 0.08 0.22 ND163,138 2.19 2.38 0.08 1.25 12.89 17.89 0.44 7.91 1.90 0.91 2.46 0.16
158 ND ND ND ND ND 1.10 ND 1.10 ND ND ND ND129,178 ND ND ND ND 1.35 2.38 ND 1.86 ND ND ND ND187,182 0.64 0.82 0.07 0.41 4.81 6.76 0.32 3.05 0.70 0.28 0.79 0.95
183 0.35 0.39 0.01 0.20 3.75 5.35 0.01 2.28 0.44 0.15 0.50 0.58128 0.26 0.28 ND 0.22 0.78 2.20 0.28 0.88 0.33 0.13 0.35 0.03185 0.08 0.14 ND 0.08 0.67 0.23 0.01 0.23 0.14 0.04 0.12 0.02174 0.40 0.54 0.04 0.26 3.63 6.27 0.09 2.52 0.74 0.27 0.75 0.14177 0.28 0.34 0.01 0.18 2.21 3.71 0.09 1.53 0.76 0.17 0.53 0.05
202,171,156 0.39 0.48 0.03 0.25 2.88 4.16 0.04 1.78 0.49 0.18 0.56 2.52157,200 0.17 0.21 ND 0.13 0.82 1.16 ND 0.99 ND ND ND 1.17172,197 ND ND ND ND 0.88 ND ND 0.88 ND ND ND ND
180 1.16 1.31 ND 1.24 10.48 11.40 0.36 5.65 0.58 0.50 1.22 ND193 1.81 3.25 0.38 1.81 0.32 0.93 ND 0.63 0.26 ND 0.55 ND191 0.02 ND 0.04 0.03 ND 1.84 0.09 0.97 1.05 0.02 0.38 0.03199 ND ND ND ND ND 1.76 ND 1.76 0.55 0.29 0.42 ND
170,190 1.18 1.11 0.02 0.62 6.86 ND 0.14 3.50 1.05 0.31 1.18 0.08198 0.15 0.07 0.02 0.08 0.35 8.46 0.01 2.21 3.70 0.02 1.31 0.84201 0.57 0.80 0.05 0.39 6.93 9.68 0.11 4.21 3.60 0.28 2.18 14.08
203,196 0.60 0.88 0.02 0.41 6.84 9.14 0.14 4.07 3.59 0.33 2.28 9.91189 0.03 ND ND 0.03 0.20 10.19 ND 5.20 10.15 ND 5.21 0.02
208,195 0.25 0.72 ND 0.34 9.08 ND 0.07 4.58 1.01 ND 1.01 58.17207 0.03 0.07 ND 0.04 0.68 3.38 0.03 1.03 ND 0.11 0.26 2.92194 0.24 1.35 ND 0.65 4.35 ND 0.07 2.21 49.06 0.09 16.56 0.88205 0.21 ND ND 0.14 ND ND ND ND 76.43 ND 38.23 0.09206 0.51 0.71 ND 0.47 12.34 13.87 0.17 6.64 31.02 0.77 13.66 ND209 0.05 0.10 ND 0.06 2.01 3.11 0.03 1.29 ND 0.24 1.40 12.07
Total PCBs 30 45 2 29 313 396 12 200 216 16 144 115Recovery
14 124% 108% 84% 106% 103% 94% 69% 69% 231% 82% 139% 161%65 109% 96% 67% 91% 69% 96% 64% 64% 109% 67% 79% 103%
166 113% 100% 47% 87% 77% 124% 65% 65% 137% 68% 90% 135%
128

C-3. PCB concentrations in Sediments (ng/g) from Spring 2002 Core Study
Field ID 5 Sed2 5 Sed3 5 Sed2 AMP 5 Sed3 AMP 5 Sed3 AMP 5 CORE Collected Spring 2002 Spring 2002 Spring 2002 Spring 2002 Spring 2002 Spring 2002Matrix Sediment Sediment Sediment Sediment Sediment SedimentZone 5 5 5 5 5Replicate analysis? Rep A Rep BAnalyzed by ANS ANS ANS ANS ANS ANSAmt. Nitrogen (mg) 0.00 0.05 0.10 0.11 0.05Amt. Carbon (mg) 0.41 1.85 1.95 1.95 1.52Sediment % Solid 78 50 80 30 63Sediment % Water
1 ND ND ND ND ND3 ND sample lost ND ND ND ND
4,10 ND 0.07 ND 0.05 0.067,9 ND 0.38 ND ND 0.386 ND 0.05 ND 0.02 0.03
8,5 ND 0.59 ND ND 0.5919 ND ND ND ND ND
12,13 ND 0.08 ND 0.06 0.0718 ND ND ND ND ND17 0.06 0.12 ND ND 0.1324 ND 0.02 ND 0.04 0.03
16,32 ND ND ND ND ND29 ND ND ND ND ND26 ND ND ND ND ND25 ND ND ND ND ND
31, 28 0.42 0.28 0.19 0.17 0.2933,21,53 ND ND ND ND ND
51 ND 0.04 ND 0.04 0.0622 ND ND ND ND ND45 0.02 ND 0.01 ND 0.0446 0.00 0.03 0.00 0.01 0.0252 0.19 0.26 0.07 0.19 0.2049 0.39 ND 0.19 0.24 0.26
47,48 ND ND ND ND 0.8644 0.15 0.18 0.05 0.12 0.14
37,42 0.09 0.15 0.04 0.11 0.1041,64,71 0.11 ND 0.05 0.12 0.10
40 0.05 0.07 0.02 0.05 0.05100 0.09 ND 0.02 0.06 1.9563 0.04 0.07 0.02 0.04 0.0574 0.06 ND 0.03 0.11 0.06
70,76 0.23 0.29 0.06 0.22 0.2266,95 0.55 0.39 ND 0.31 0.35
91 1.37 0.09 0.17 0.07 0.5356,60/92,84 ND 0.81 0.09 0.58 0.66
89 NA NA NA NA NA101 0.14 0.28 0.06 0.23 0.1699 0.11 0.23 0.06 ND 0.12
119 NA NA NA NA NA83 0.04 0.15 0.03 0.11 0.0897 ND 0.09 ND 0.07 0.08
81,87 ND ND 0.05 0.08 0.0785 ND 0.76 ND 0.65 0.71
136 ND ND ND ND ND77,110 0.43 0.83 0.19 0.57 0.4582, 151 0.07 0.21 0.05 0.12 0.10135,144 0.06 0.22 0.03 0.09 0.11
107 0.05 0.14 0.01 0.05 0.08123,149 0.21 0.66 0.11 0.42 0.38
118 ND 0.44 ND 0.27 0.36134 ND 0.77 ND 0.48 0.45146 0.07 0.28 0.04 0.20 0.20
132,105,153 0.47 1.40 0.26 1.04 0.74141 0.06 0.08 0.03 0.06 0.09
137,130,176 ND ND ND ND ND163,138 0.35 1.06 0.17 0.67 0.50
158 ND ND ND ND ND129,178 ND ND ND ND ND187,182 0.10 0.44 0.07 0.30 0.42
183 0.06 0.19 0.03 0.15 0.23128 0.07 0.17 0.02 0.05 0.07185 0.05 ND 0.02 ND 0.03174 0.10 0.20 0.04 0.12 0.13177 0.08 0.17 0.04 0.14 0.10
202,171,156 0.10 0.23 0.06 0.12 0.73157,200 0.01 0.08 0.01 0.07 0.32172,197 ND ND ND ND ND
180 ND ND ND ND ND193 ND 0.21 0.03 0.19 0.16191 0.02 0.05 0.01 0.01 0.03199 ND ND ND ND ND
170,190 0.15 0.38 0.08 0.29 0.20198 0.01 0.19 0.01 0.02 0.26201 0.23 0.62 0.15 0.44 3.80
203,196 0.18 0.57 0.13 0.35 2.73189 ND 0.22 ND 0.01 0.08
208,195 ND 1.36 0.46 1.15 1.08207 0.06 0.16 0.04 0.09 0.80194 0.07 ND 0.03 0.10 0.34205 ND ND ND ND 0.09206 0.67 3.06 0.49 1.67 1.60209 0.18 0.50 0.15 0.31 3.25
Total PCBs 8 20 4 13 28Recovery
14 71% 186% 86% 199% 139%65 61% 98% 63% 103% 87%
166 61% 132% 63% 126% 110%
129

C-4. PCB concentrations in Sediments (ng/g) from Spring 2002 Variability Study
Field ID 2 CC 2 CC 4 CC 5 Sed1 2 Sed3 VAR1 2 Sed3 VAR2 2 Sed3 VAR3Collected Spring 2002 Spring 2002 Spring 2002 Spring 2002 Spring 2002 Spring 2002 Spring 2002Matrix Sediment Sediment Sediment Sediment Sediment Sediment SedimentZone 2 2 4 5 2 2 2Replicate analysis? Rep A Rep BAnalyzed by ANS ANS ANS ANS ANS ANS ANS
Amt. Nitrogen (mg) 0.00 0.00 0.13 0.06 0.18 0.08 0.13Amt. Carbon (mg) 0.97 0.56 7.36 1.86 4.80 5.33 3.61Sediment % Solid 75 74 62 61 46 62 52Sediment % Water
1 ND 0.20 ND ND ND 0.73 0.753 ND ND ND ND 1.19 ND ND
4,10 0.02 0.05 ND ND 0.06 ND ND7,9 0.02 0.02 ND ND 0.09 0.05 ND6 ND 0.01 0.04 ND 0.27 0.03 0.05
8,5 ND 1.02 1.13 ND 1.66 0.54 0.3319 ND ND ND ND ND ND ND
12,13 ND 0.02 0.08 ND 0.10 ND ND18 0.83 ND 0.52 ND ND 0.47 ND17 ND 0.06 1.33 0.20 0.89 0.42 0.3424 0.03 0.02 ND ND 0.11 0.02 0.04
16,32 0.18 0.15 0.31 ND 0.79 0.31 0.3929 ND ND 8.81 ND 0.02 ND 0.0226 ND ND 0.32 ND ND ND ND25 ND ND ND ND ND ND ND
31, 28 ND 0.30 9.05 ND 0.63 0.36 0.2933,21,53 ND 0.24 0.53 ND 0.27 0.16 0.14
51 0.08 0.01 0.47 0.09 0.23 0.07 0.1622 0.17 0.16 1.76 ND 0.42 0.21 0.2945 0.24 0.05 0.42 0.10 0.05 0.20 ND46 0.03 0.03 0.04 ND 0.38 0.01 0.0852 0.12 0.13 2.08 ND 0.67 0.48 0.4849 0.13 0.15 2.15 0.16 0.81 0.59 0.78
47,48 ND ND ND 0.86 1.82 0.82 1.5244 0.09 0.13 2.09 ND 0.49 0.34 0.36
37,42 0.05 0.07 1.38 0.07 0.36 0.25 0.2241,64,71 0.21 0.26 1.48 ND 1.23 0.50 0.58
40 0.04 0.05 0.70 ND 0.39 0.12 0.34100 ND 0.03 ND 5.71 ND 0.03 0.0663 0.02 ND 0.44 ND 0.04 ND 0.0974 0.07 0.07 1.39 ND 0.40 0.26 0.32
70,76 0.12 ND 8.75 ND 1.11 0.68 0.6166,95 0.36 0.36 6.48 0.14 1.10 0.63 0.71
91 0.03 0.53 8.40 ND 0.29 0.23 0.1856,60/92,84 0.53 ND 3.26 0.82 1.84 1.21 1.88
89 NA NA NA NA NA NA NA101 0.11 0.10 1.95 0.06 0.73 0.43 0.5999 0.08 0.05 1.38 0.07 0.58 0.24 0.40
119 NA NA NA NA NA NA NA83 0.06 ND 2.43 0.04 0.17 0.14 0.1497 0.04 0.02 ND ND 0.25 0.10 0.19
81,87 0.08 0.14 1.36 ND 0.33 0.18 0.2585 ND ND 0.80 ND ND ND ND
136 ND ND 0.45 ND ND ND ND77,110 0.34 0.24 4.86 0.14 1.97 0.65 1.2582, 151 0.14 0.06 2.01 0.03 0.49 0.30 0.46135,144 0.05 0.04 1.22 0.11 0.22 0.13 0.14
107 0.05 0.01 1.04 0.11 0.10 0.10 0.11123,149 0.24 0.14 2.48 ND 0.96 0.54 0.68
118 0.16 0.02 0.65 0.36 0.86 0.40 0.52134 0.48 0.03 0.10 0.09 1.51 3.04 1.57146 0.06 0.08 0.46 0.35 0.33 0.16 0.18
132,105,153 0.43 0.51 4.33 0.45 2.47 1.23 1.77141 0.04 0.05 1.01 0.16 0.22 0.13 0.22
137,130,176 ND ND 0.28 ND ND ND 0.14163,138 0.38 0.31 4.57 0.16 2.38 1.10 1.57
158 ND ND ND ND ND ND ND129,178 ND ND ND ND ND ND ND187,182 0.11 0.13 1.40 0.95 0.82 0.53 0.67
183 0.09 0.04 0.91 0.58 0.39 0.20 0.32128 0.08 0.16 0.58 0.03 0.28 0.17 0.29185 0.02 0.01 0.18 0.02 0.14 0.15 0.16174 0.07 0.06 1.24 0.14 0.54 0.25 0.33177 0.15 0.04 0.65 0.05 0.34 0.18 0.29
202,171,156 0.09 ND 1.00 2.52 0.48 0.25 0.37157,200 0.01 0.01 ND 1.17 0.21 0.06 0.07172,197 ND ND ND ND ND ND ND
180 ND ND 2.57 ND 1.31 0.67 0.73193 ND ND 0.84 ND 3.25 1.38 2.73191 ND 0.02 0.07 0.03 ND 0.01 ND199 ND ND ND ND ND ND ND
170,190 0.22 0.12 2.17 0.08 1.11 0.63 0.65198 ND ND 0.21 0.84 0.07 0.26 0.31201 0.15 0.12 2.65 14.08 0.80 0.48 0.44
203,196 0.17 0.14 2.91 9.91 0.88 0.49 0.47189 ND ND 0.27 0.02 ND 0.02 0.01
208,195 0.05 0.03 ND 58.17 0.72 0.36 ND207 0.02 0.02 0.41 2.92 0.07 0.04 0.04194 0.68 0.04 0.52 0.88 1.35 0.19 0.23205 0.07 ND 0.03 0.09 ND ND ND206 0.22 0.16 9.19 ND 0.71 0.47 0.29209 0.02 0.03 2.56 12.07 0.10 0.02 0.03
Total PCBs 8 7 125 115 45 25 30Recovery
14 82% 65% 105% 161% 108% 114% 114%65 79% 64% 60% 103% 96% 98% 94%
166 74% 62% 65% 135% 100% 104% 99%
130

131
APPENDIX D: QUALITY ASSURANCE
D-1. Comparison of PCB Congeners Analyzed and Quantified by CBL and ANS D-2. CBL's Matrix Blank Masses and Method Detection Limits D-3. ANS's Matrix Blank Masses and Method Detection Limits D-4. Summary of CBL's Matrix Spike Recoveries D-5. Summary of ANS's Matrix Spike Recoveries D-6. Summary of CBL's SRM Recoveries D-7. Summary of ANS's SRM Recoveries D-8. Summary of CBL's Replicate Analyses D-9. Summary of ANS's Replicate Analyses D-10. Results of Interlaboratory Comparisons between CBL and ANS

A-1. Location of Biota and Sediment Collections for Fall 2001
Sample Site ID STUDY START START Date TimeLatitude Longitude
Sediment Collection
Zone 202 SED1 CORE 40.10387 74.83698 11/7/2001 1:53:00
Zone 303 SED1 CORE 39.96467 75.09897 11/7/2001 7:55:00
Zone 404 SED1 CORE 39.84375 75.28223 11/6/2001 2:17:0004 SED2 CORE 39.86788 75.20395 11/6/2001 3:00:0004 CC CCVar 39.85238 75.31213 11/6/2001 12:48:09
Zone 505 SED1 CORE 39.58208 75.54306 11/6/2001 10:00:0005 SED2 CORE 39.68438 75.52755 11/6/2001 11:24:3105 SED3 CORE 39.75000 75.48330 11/8/2001 ~1:30:00 05 Var1 Variability 39.77995 75.46597 11/9/2001 9:51:0005 Var2 Variability 39.77687 75.46367 11/9/2001 10:06:0005 Var3 Variability 39.77574 75.46095 11/9/2001 10:16:0005 Var4 Variability 39.77487 75.45829 11/9/2001 10:23:00
Biota Collection
Zone 202 CC2 CORE 40.0388 74.9881 11/8/2001 7:30:0002 CC2 CORE/CC 40.0399 74.9880 11/8/2001 7:54:00
Zone 303 SED1 CORE 39.5799 75.0697 11/9/2001 6:06:0003 SED2 CORE 40.0005 75.0556 11/9/2001 6:47:00
Zone 404 SED1 CORE 39.8511 75.3016 11/8/2001 3:24:0004 SED2 CORE 39.8514 75.3018 11/8/2001 3:36:0004 CC CCVar 39.8509 75.3005 11/8/2001 3:40:00
Zone 505 CC CORE/WPVar1 39.6054 75.5773 11/8/2001 12:03:0005 SED2 CCVar 39.6700 75.5334 11/8/2001 12:42:0005 SED3 WPVar2 39.7516 75.4778 11/8/2001 1:36:0005 SED4 WPVar3 39.7854 75.4538 11/8/2001 2:17:18
132

A-2. Location of Biota and Sediment Collections for Spring 2002
Sample Site ID STUDY START START Date TimeLatitude Longitude
Sediment Collection
Zone 202 CC CC 40.04087 74.97816 3/19/2002 14:0502 Sed1 Core 40.10405 74.83773 3/19/2002 15:0202 Sed3 Core/Var 40.15044 74.72394 3/19/2002 16:0102 Var2 Var 40.08987 74.43357 3/19/200202 Var3 Var 40.14875 74.72126 3/19/200202 Var4 Var 40.14738 74.72089 3/19/2002
Zone 303 Sed1 Core 39.96407 75.09901 3/19/2002 10:3003 Sed2 Core 39.99409 75.05546 3/19/2002 11:27
Zone 404 Sed1 Core 39.84375 75.28223 3/18/2002 15:3604 Sed2 Core 39.86788 75.20395 3/18/2002 16:0504 CC CC 39.85238 75.31213 3/18/2002
Zone 505 Sed1 CC 39.5440 75.54165 3/18/2002 11:5205 Sed2 Core 39.6700 75.5334 3/18/2002 13:0805 Sed2 amphipod Core 39.6888 75.52169 3/18/2002 13:2005 Sed3 Core 39.7537 75.4673 3/18/2002 14:11
Biota Collection
Zone 3
03 SED1 CORE 39.9649 75.1164 3/20/2002 7:03
03 SED2 CORE 40.0000 75.0576 3/20/2002 8:06
Zone 4
04 SED1 CORE 39.8499 75.2748 3/20/2002 11:11
04 SED2 CORE 39.8662 75.2118 3/20/2002 10:30
04 CC CC 39.8555 75.3087 3/20/2002 12:19/18:28
Zone 5
05 SED1 CC 39.5839 75.5532 3/20/2002 14:43/15:23
05 SED2 CORE 39.6824 75.5259 3/20/2002 16:50
05 SED3 CORE 39.7472 75.4780 3/20/2002 17:16
Additional Sampling Trips
Zone 2
2CC CC 40.04 74.97 4/3/2002
2Sed1 Core 40.1 74.84 4/2/2002
2Sed3 Core 40.1 74.84 4/2/2002
2Sed4 Core 40.15 74.72 4/2/20022Sed1 Core 40.15 74.16 5/21/2002
133

A-3. Summary of Channel Catfish Samples from Fall 2001 Collections/Analyses
Sample ID Sex Age Length (cm) Weight(g) Fillet Whole(g) Fillet (g) Whole Remains(g) Remains(g)Zone 2110801 02 CC2 CC1 F 9 44.2 761 92.2 69.44 668.8110801 02 CC2 CC2 F gravid 19 44.8 799.2 109.24 80.23 689.96*02 CC2 CC3 M 9 40.3 524.2 75.7 25.01 448.5*02 CC2 CC4 M 11 49.2 1020.4 124.71 25.01 895.69*02 CC2 CC5 F 13 47.4 863.4 122.53 24.99 740.87*02 CC2 CC6 F 10 60.2 2170.2 314.71 24.99 1855.49 Whole Fillet+Whole Remains*second sampling trip Average 12 1023.07 139.85 883.22 1023.07Zone 3110901 03 Sed1 CC1 M 9 38.2 475.05 58.84 55.65 416.21 299.6110901 03 Sed1 CC2 M 9 38 448.75 55.98 57.68 392.26 299.88110901 03 Sed1 CC3 M 10 46.2 907.9 100.99 57.67 807.3 299.62110901 03 Sed2 CC1 M 8 47.1 892.42 124.52 57.38 767.9 300.3110901 03 Sed2 CC2 M 8 44.5 801.26 127.26 57.75 674 300.04110901 03 Sed2 CC3 M 9 38.4 476.42 58.04 57.72 418.38 299.82110901 03 Core CCF Average 9 666.97 87.61 579.34 666.95110901 03 Core CCRZone 4110801 04 Sed 1 CC1 F 8 37.5 406.54 52.24 34.99 200.02110801 04 Sed 2 CC1 M 5 35.7 292.81 36.9 35.02 199.55110801 04 Sed2 CC2 Discarded110801 04 Sed2 CC3 F 5 34.3 282.14 36.53 35.01 199.23110801 04 Sed2 CC4 F 5 35.8 358.39 45.72 35.03 199.8110801 04 Sed2 CC5 M 7 40.6 500.24 63.75 34.99 201.23110801 04 Core CCF Average 6 368.02 47.03 199.97 246.99110801 04 Core CCRVariability110801 04 CC CC1 M 8 33.7 601.9 15110801 04 CC CC2 M 7 38.8 597.7 14.99110801 04 CC CC3 M 7 35.3 484.7 15110801 04 CC CC4 F 5 36 427.5 15.01110801 04 CC CC5 M 3 26.7 359.7 15.01110801 04 CC CC1-5F Average 6 71.36Zone 5110801 05 CC5 CC1 F 4 33.8 291.07 37.41 35.03 235.98 200.01110801 05 CC5 CC2 F 8 41.7 579.23 79.27 34.97 479.89 199.96110801 05 CC5 CC3 M 9 52 1410.17 146.44 35.02 1151.09 199.97110801 05 CC5 CC4 M 5 40.8 535.62 67.37 35.03 453.48 200.03110801 05 CC5 CC5 F 7 36.6 366.06 40.05 35.03 327.94 200.08110801 05 Core CCF Average 7 636.43 74.11 529.68 603.78110801 05 Core CCRVariability110801 05 Sed2 CC1 F 6 40.5 500.76 63.97 19.96110801 05 Sed2 CC2 M 5 41.9 569.79 68.98 19.97110801 05 Sed2 CC3 M 8 47.7 963.1 130.16 19.91110801 05 Sed2 CC4 F 7 39.7 537.63 66.28 19.91110801 05 Sed2 CC5 F 5 29.5 184.82 45.85 19.98110801 05 Sed2 CC1-5F Average 6 66.45
134

A-4. Summary of Channel Catfish Samples from Spring 2002 Collections/Analyses
Sample ID Sex Age Length (cm) Weight(g) Fillet Whole(g) Fillet for Whole Remains(g) Remains for Composite(g)Zone 2040202 02 CC1 M? 9 48.9 995.4 138.97 ~120 856.43 450.9040202 02 CC2 M 12 51.9 1535.5 188.8 ~120 1346.7 450.8040402 02 CC3 M 10 53.5 1375.9 151.28 ~120 1224.62 449.5040402 02 CC4 M 10 52.5 1439.6 182.94 ~120 1256.66 451.8040402 02 CC5 F gravid 11 55.2 1728 230.53 ~120 1497.47 450.3 Whole Fish+Whole Remains040402 02 Core CCF Average 10.4 1414.88 178.50 1236.38 1414.88040402 02 Core CCRCatfish Variability040302 02 CC1 F gravid 10 47 1132.5 112.13 29.98040302 02 CC2 M 9 47.4 977.2 116.52 30.02040302 02 CC3 M 9 48 952 137.98 30.07040302 02 CC4 F 9 45.8 902.9 137.16 29.99040302 02 CC5 M 14 51.4 1190.3 117.85 30.05040302 02 CC6 M 7 41.9 621.7 149.27* 29.99040302 CC1-6F * 2 filletsZone 3032002 03 CC1 M 8 40.5 590.85 78.99 40.02 511.86 349.7032002 03 CC2 M 9 52.1 1505.50 222.87 40.00 1282.63 350.31032002 03 CC3 F 10 43.7 738.80 57.65 40.05 681.15 349.60032002 03 CC4 M 8 44.9 801.10 46.10 40.03 755.00 349.81032002 03 CC5 M 7 40.2 526.85 73.26 40.01 453.59032002 03 Core CCF Average 8 832.62 95.77 736.85 832.62032002 03 Core CCRZone 4032002 04 CC1 F gravid 8 409 642.70 57.70 30.02 585.00 232.49032002 04 CC2 F 6 384 441.56 47.91 30.04 393.65 231.91032002 04 CC6 F gravid 6 353 392.53 42.32 30.03 350.21 232.63032002 04 CC7 M 8 350 361.68 42.06 29.98 319.62 232.23032002 04 CC8 M 8 340 328.30 33.15 30.02 295.15 232.00032002 04 Core CCF Average 7 433.35 44.63 388.73 433.35032002 04 Core CCRCatfish Variability032002 04 CC1 M 7 385 419.80 40.88 10.03032002 04 CC2 M 8 375 400.86 42.18 10.04032002 04 CC3 M 11 338 336.99 35.55 9.99032002 04 CC4 F 10 362 393.81 35.18 10.03032002 04 CC5 F 9 365 376.27 31.73 10.00032002 04 CC1-5F 46.90Zone 5032002 05 CC1 F 11 41.5 624.7 58.97 38.78 565.73 349.56032002 05 CC2 F 8 40.5 528.27 50.88 38.47 477.39 349.71032002 05 CC3 F 9 48 1021.6 92.54 38.54 929.06 349.15032002 05 CC4 F 8 41.5 627.1 46.77 38.04 580.33 349.78032002 05 CC5 F 7 38.5 470.46 38.89 38.89 431.57 349.25032002 05 Core CCF Average 9 654.43 57.61 596.82 654.43032002 05 Core CCRCatfish Variability032002 05 CC1 F 6 385 472.09 56.26 10.03032002 05 CC2 M 6 360 357.38 49.68 10.02032002 05 CC3 F 7 387 589.47 54.30 9.99032002 05 CC4 M 4 275 174.76 20.52 9.98032002 05 CC5 M 8 390 513.33 56.72 9.98032002 05 CC1-5F 50.00
135

A-5. Summary of White Perch Samples from Fall 2001 Collections/Analyses
Sample ID Sex Age Length (cm) Weight(g) Fillet Whole(g) Fillet (g) Whole Remains(g) Remains(g)Zone 2110801 02 CC2 WP1 F gravid 6 21.9 171.3 32.39 15.01 138.91 29.74110801 02 CC2 WP2 F gravid 5 19.9 102.7 20.01 14.98 82.69 29.79110801 02 CC2 WP3 Discarded 51.86 51.86110801 02 CC2 WP4 M ripe 5 18.1 93.26 18.96 15.02 74.3 29.78110801 02 CC2 WP5 M ripe 9 21.2 137.66 27.78 15.01 109.88 29.64110801 02 CC2 WP6 M ripe 5 17.4 79.9 15.61 15.03 64.29 29.69110801 02 CC2 WP7 Discarded110801 02 CC2 WP8 M ripe 5 18.7 96.23 19.95 14.97 76.28 29.75Whole Fillet+Whole Remains110801 02 Core WPF Average 6 104.70 22.45 85.46 107.91110801 02 Core WPRZone 3110801 03 Sed1 WP1 M 2 16.5 66.66 12.93 10.82 51.57 29.94110801 03 Sed1 WP3 F 3 16.9 65.51 13.84 10.34 50.89 30110801 03 Sed1 WP4 M 3 16.6 69.92 13.97 10.68 53.93 30.02110801 03 Sed1 WP5 M 5 18 84.64 18.07 10.78 63.55 30.02110801 03 Sed1 WP6 M 3 16 53.53 10.6 10.6 40.18 29.99110801 03 Sed1 WP2* F 6 23.4 203.62 38.86 37.78 158.57 69.12110801 03 Core WPF Average 3 68.05 13.88 52.02 65.91110801 03 Core WPRZone 4 110801 04 Sed 1 WP1 F(gravid) 3 18.4 88.75 17.13 10.99 71.62 29.99110801 04 Sed 1 WP2 F 4 17.3 65.74 14.24 10.99 51.5 30.08110801 04 Sed 1 WP3 F 4 17.6 76.98 17.05 10.97 59.93 30.11110801 04 Sed 1 WP4 F 3 15.9 51.66 11.45 11.01 40.21 30.14110801 04 Sed 2 WP1 F(gravid) 3 18 75.13 15.52 10.97 59.61 29.97110801 04 Sed 2 WP2 F 3 16.5 59.74 12.59 11.03 47.15 30.06110801 04 Core WPF Average 3 69.67 14.66 55.00 69.67110801 04 Core WPRZone 5110801 05 CC5 WP1 M ripe 6 22.3 161.38 33.61 15 90.41 42.01110801 05 CC5 WP2 M ripe 3 18.6 92.93 18.9 15.01 52.26 42110801 05 CC5 WP3 F gravid 7 20.2 129.27 26.22 15.02 71.96 42.01110801 05 CC5 WP4 M ripe 6 19.9 125.26 25.72 15.02 68.3 41.99110801 05 CC5 WP5 M ripe 6 19 100.89 19.72 14.99 55.78 42110801 05 Core/Var WPF Average 6 121.95 24.83 67.74 92.58110801 05 Core WPRVariability Study110801 05 CC5 WP1 M ripe 6 22.3 161.38 31.11 29110801 05 CC5 WP2 M ripe 3 18.6 92.93 19.82 17.62110801 05 CC5 WP3 F gravid 7 20.2 129.27 24.55 21.55110801 05 CC5 WP4 M ripe 6 19.9 125.26 24.45 21.27110801 05 CC5 WP5 M ripe 6 19 100.89 20.61 17.97110801 05 Var2 WP1 M 4 18.5 84.27 34.55 5.03110801 05 Var2 WP2 F 3 17.9 75.03 32.22 5.01110801 05 Var2 WP3 F 2 16.2 55.79 25.97 5.01110801 05 Var2 WP4 M 5 17.5 66.25 28.83 4.99110801 05 Var2 WP5 M 3 15.3 44.88 19.76 5.02110801 05 Var2 WP6 F 2 13.5 27.39 12.3 5.01110801 05 Var2 WPF 28.32110801 05 Var3 WP1 M 5 18.6 91.98 36.62 9110801 05 Var3 WP2 M 3 17.3 68.24 29.61 9.01110801 05 Var3 WP3 F 2 16.2 52.24 22.01 9.02110801 05 Var3 WP4 F 2 15.4 48.56 18.43 8.99110801 05 Var3 WP5 M 3 15.8 51.11 21.82 9110801 05 Var3 WP6 F gravid 4 16.3 53.32 21.54 8.97110801 05 Var3 WPF 41.92
*individual
136

A-6. Summary of White Perch Samples from Spring 2002 Collections/Analyses
Sample ID Sex Age Length (cm) Weight(g) Fillet Whole(g) Fillet (g) Whole Remains(g) Remains(g)Zone 2062102 02 WP1* M 3 15.5 63.23 18.57 10.01 37.76 20062102 02 WP2* F 3 15.2 60.96 14.92 10.03 37.4 20.01062102 02 WP3* M NA 15.4 64.25 19.26 9.99 37.67 19.97062102 02 WP4* M 2 16.3 65.02 18.4 10.03 43.41 20.05062102 02 WP5* F (gravid) 3 16 66.27 19.9 10.01 42.53 20.02 Whole Fillet+Whole Remains062102 02 CORE WPF Average 3 63.95 18.21 39.75 57.96062102 02 CORE WPR*caught by rod & reel by ANS (near Bordentown, NJ)Zone 3032002 03 WP1 F 4 18.3 94.66 21.22 9.98 69.48 49.98032002 03 WP2 F 4 17.2 87.13 18.87 10.02 65.29 49.99032002 03 WP3 M 5 16.7 62.12 22.18 9.97 73.98 50.02032002 03 WP4 M 3 19 99.02 13.95 9.98 45.89 44.27032002 03 WP5 F 3 17.7 79.8 15.02 10.01 58.59 49.97032002 03 Core WPF Average 4 84.55 18.25 62.65 80.89032002 03 Core WPRZone 4032002 04 WP1 F 4 184 90.79 19.34 10.01 71.45 49.13032002 04 WP2 M 4 196 119.81 19.31 10.00 100.50 49.60032002 04 WP3 M 4 183 89.10 15.91 10.03 73.19 49.29032002 04 WP4 M 5 179 90.82 16.76 9.99 74.06 49.49032002 04 WP5 M 4 165 67.34 12.98 10.00 54.36 48.53032002 04 Core WPF Average 4 91.57 16.86 74.71 91.57032002 04 Core WPRZone 5032002 05 WP1 F 9 23.8 220 38.33 25 195 59.99032002 05 WP2 F 9 20.8 183 34.93 24.99 158.01 59.69032002 05 WP4 F 6 20.9 177 33.38 24.98 152.02 60.25032002 05 WP6 M 6 20.8 162 29.68 24.98 137.02 59.78032002 05 WP8 M 5 19.1 115 42.09 24.99 90.01 60.48032002 05 Core WPF Average 7 171.4 35.68 146.41 182.09032002 05 Core WPR
137

A-7. Summary of Prey Fish from Fall 2001 Collections/Analyses
Sample ID Species
Zone 3110801 03 SED1 SFA 4 YOY Channel Catfish Ictalurus punctatus110801 03 SED1 SFB 1 Hogchoker Trinectes maculatus110801 03 SED2 SFA YOY Catfish Ictalurus punctatus110801 03 SED2 SFB YOY Catfish Ictalurus punctatus110801 03 SED2 SFC YOY Catfish Ictalurus punctatus
Zone 4110801 04 CC SFA 4 YOY Channel Catfish Ictalurus punctatus110801 04 SED1 SFA 16 Croaker Micropogonias undulatus110801 04 SED1 SFB 15 Croaker Micropogonias undulatus110801 04 SED1 SFC 5 Hogchoker Trinectes maculatus110801 04 SD1 SFD 10 YOY Channel Catfish Ictalurus punctatus110801 04 SD1 SFE 1 Spottailed Shiner Notropis hudsonius110801 04 SED1 SFF Tesselated Darter Etheostoma olmstedi110801 04 SED1 SFG 4 White perch Morone americanus
Zone 5110801 05 SED2 SFA 1 YOY Channel Catfish Ictalurus punctatus110801 05 SED2 SFB Croaker Micropogonias undulatus110801 05 SED2 SFC Croaker Micropogonias undulatus110801 05 CC SFA 3 American Eels Anguilla rostrata110801 05 CC SFB 4 Hogchoaker Trinectes maculatus
*Individual species analyzed and composited by zone **No Zone 2 SF***YOY= Young of the Year
138

A-8. Summary of Prey Fish from Spring 2002 Collections/Analyses
Small Fish Species
Zone 2040202 2CC SFA Gizzard shad Dorosoma cepedianum040302 02CORE SFA Spot-tailed Shiners Notropis hudsonius040302 02CORE SFB Tessalated Darter Etheostoma olmstedi040302 02CORE SFC Banded Killifish Fundulus diaphanus
Zone 3032002 03 CORE SFA YOY Channel Catfish Ictalurus punctatus032002 03 CORE SFB Juvenile White Perch Morone americanus
Zone 4032002 04 SED2 SFA1 Juvenile White Perch Morone americanus032002 04 SED2 SFA2 Juvenile White Perch Morone americanus032002 04 SED2 SFA3 Juvenile White Perch Morone americanus032002 04 SED2 SFB YOY Channel Catfish Ictalurus punctatus032002 04 SED2 SFC Spottail shiner Notropis hudsonius
Zone 5032002 05 SED1 SFA Juvenile White Perch Morone americanus032002 05 SED1 SFB Hogchoker Trinectes maculatus032002 05 SED1 SFC YOY Channel Catfish Ictalurus punctatus032002 05SED3 SFA Juvenile White Perch Morone americanus032002 05SED3 SFB YOY Channel Catfish Ictalurus punctatus
*Individual species analyzed and composited by zone **YOY= Young of the Year
139

A-9. Summary of Invertebrate Samples from Fall 2001 Collections/Analyses
Sample ID Species
Zone 2110801 02 CC INVA Amphipods Gammarus spp.110801 02 CC INVB Blue crab Callinectes sapidus110801 02 SED1 INV Amphipods Gammarus spp.
Zone 3110801 03 SED1 INV Amphipods Gammarus spp.
Zone 4110801 04 CC INV Amphipods Gammarus spp.
110801 04 SED1 INV Amphipods Gammarus spp.
Zone 5110801 05 CC INVA Amphipods Gammarus spp.110801 05 CC INVB Grass shrimp Palaemonetes spp.110801 05 SED2 INV Grass Shrimp Palaemonetes spp.
140

A-10. Summary of Invertebrate Samples from Spring 2002 Collections/Analyses
Site Species
Zone 2040302 02 CC INV Amphipods Gammarus spp.040302 02 CORE INV Amphipods Gammarus spp.
Zone 3032002 03 CORE INV Amphipods Gammarus spp.032002 03 CORE MACRO INV Crayfish Decopoda
Zone 4032002 04 CORE INV Amphipods Gammarus spp.032002 04 CORE MACRO Crayfish Decopoda
Zone 5032002 05 CORE INV Amphipods Gammarus spp.032002 05 SED1 INV Amphipods Gammarus spp.032002 05 SED1 MACRO INV White fingered mud crab Rhithropanopeus harrisii
141

A-11. Summary of Sediment Samples from Fall 2001 Collections/Analyses
Sample ID
Zone 202 Sed1
Zone 303 Sed1
Zone 404 Sed104 Sed204 CC
Zone 505 Sed105 Sed205 Sed3
Variability05 Sed Var105 Sed Var205 Sed Var305 Sed Var4
142

A-12. Summary of Sediment Samples from Spring 2002 Collections/Analyses
Sample ID
Zone 202 CC
02 Sed1 02 Sed3 02 Var2 02 Var302 Var4
Zone 303 Sed1 03 Sed2
Zone 404 Sed104 Sed204 CC
Zone 505 Sed105 Sed2
05 Sed2 amphipod05 Sed3
143

144
References Anderson, J. W. 1991. "Determination of congeners of polychlorinated-biphenyls in reference materials." HRC-Journal of High Resolution Chromatography 14(6): 369-372. Ashley, J. T. F. and J. E. Baker. 1999. "Hydrophobic organic contaminants in surficial sediments of Baltimore Harbor: Inventories and sources." Environmental Toxicology and Chemistry 18(5): 838-849. Ashley, J. T. F., D. H. Secor, E. Zlokovitz, S. Q. Wales and J. E. Baker 2000. "Linking habitat use of Hudson River striped bass to accumulation of polychlorinated biphenyl congeners." Environmental Science & Technology 34(6): 1023-1029. Baker, J. E. and S. J. Eisenreich. 1990. "Concentrations and fluxes of polyaromatic hydrocarbons and polychlorinated biphenyls across the air-water interface of Lake Superior." Environmental Science & Technology 42: 342-352. Barber, M. C., L. A. Suarez and R. R. Lassiter. 1991. "Modeling bioaccumulation of organic pollutants in fish with an application to PCBs in Lake Ontario salmonids." Canadian Journal of Fisheries and Aquatic Sciences 48(2): 318-337. Connell, D. W., D. W. Hawker, M. S. J. Warne and P. P. Vowles. 1997. Basic Concepts of Environmental Chemistry. Boca Raton, CRC Press LLC. Davis, J., M. May, G. Ichikawa and D. Crane. 2000. Contaminant concentrations in fish from the Sacramento-San Joaquin Delta and the lower San Joaquin River, 1998. Richmond, CA, San Francisco Estuary Institute. DeWitt, T. H., M. S. Redmond, J. E. Sewall and R. C. Swartz. 1992. Development of a chronic sediment toxicity test for marine benthic invertebrates. Annapolis, MD, U.S. Environmental Protection Agency. DiPinto, L. M. and B. C. Coull. 1997. "Trophic transfer of sediment-associated polychlorinated biphenyls from meiobenthos to bottom-feeding fish." Environmental Toxicology and Chemistry 16(12): 2568-2575. DNREC. 1994. Fish consumption patterns of Delaware recreational fishermen and their households. Department of Natural Resources and Environmental Control. Dove, L. E. and R. M. Nyman. 1995. Living Resources of the Delaware Estuary, The Delaware River Estuary Program. 530 pp. & appendices. DRBC. 1998. Study of the loadings of polychlorinated biphenyls from tributaries and point sources discharging to the tidal Delaware River. West Trenton, New Jersey, Estuary Toxics Management Program, Delaware River Basin Commission.

145
DRBC. 2003. Calibration of the PCB water quality model for the Delaware estuary for carbon and penta-PCBs. West Trenton, NJ, Delaware River Basin Commission. Feldman, R. S. and J. E. Titus. 2001. "Polychlorinated biphenyl accumulation differs among pumpkinseed sunfish during experimental field exposure: The role of invertebrate prey." Aquatic Toxicology 51(4): 389-404. Fisk, A. T., R. J. Norstrom, C. D. Cymbalisty and D. C. G. Muir. 1998. "Dietary accumulation and depuration of hydrophobic organochlorines: Bioaccumulation parameters and their relationship with the octanol/water partition coefficient." Environmental Toxicology and Chemistry 17(5): 951-961. Frame, G. M., J. W. Cochran and S. S. Bowadt. 1996. "Complete PCB congener distributions for 17 Aroclor mixtures determined by 3 HRGC systems optimized for comprehensive, quantitative, congener-specific analysis." HRC-Journal of High Resolution Chromatography 19(12): 657-668. Gardner, W. S., T. F. Nalepa, W. A. Frez, E. A. Cichocki and P. F. Landrum. 1985. "Seasonal patterns in lipid-content of Lake Michigan macroinvertebrates." Canadian Journal of Fisheries and Aquatic Sciences 42(11): 1827-1832. Gobas, F. A. P. C., D. C. G. Muir and D. Mackay. 1988. "Dynamics of dietary bioaccumulation and faecal elimination of hydrophobic organic chemicals in fish." Chemosphere 17: 943-962. Greene, R. 2002. Delaware Estuary fish tissue data compilation. West Trenton, New Jersey, Delaware River Basin Commission. Greenfield, B., J. Davis, R. Fairey, C. Roberts, D. Crane, G. Ichikawa and M. Petreas. 2003. Contaminant concentrations in fish from San Francisco Bay, 2000. RMP Technical Report: SFEI contribution 77. Oakland, CA, San Francisco Estuary Institute. Harding, G. C., R. J. LeBlanc, W. P. Vass, R. F. Addison, B. T. Hargrave, S. Pearre, A. Dupuis and P. F. Brodie. 1997. "Bioaccumulation of polychlorinated biphenyls (PCBs) in the marine pelagic food web, based on a seasonal study in the southern Gulf of St. Lawrence, 1976-1977." Marine Chemistry 56(3-4): 145-179. Hartwell, S. I., J. Hameedi and M. Harmon. 2001. Magnitude and extent of contaminated sediment and toxicity in Delaware Bay (NOAA Technical Memorandum NOS ORCA 148). Silver Spring, MD, National Oceanic and Atmospheric Administration. Hawker, D. W. and D. W. Connell. 1988. "Octanol-water partition coefficients of polychlorinated biphenyl congeners." Environmental Science & Technology 22: 382-387.

146
Horwitz, R. J., T. K. O'Donnell, P. Overbeck, A. Kindt and J. T. F. Ashley. 2002. Feeding habits of selected fishes in the Delaware River estuary, Patrick Center For Environmental Research, Academy of Natural Sciences. Jackson, L. F. and C. V. Sullivan. 1995. "Reproduction of white perch: The annual gametogenic cycle." Transactions of the American Fisheries Society 124(4): 563-577. Kannan, K., K. A. Maruya and S. Tanabe. 1997. "Distribution and characterization of polychlorinated biphenyl congeners in soil and sediments from a Superfund site contaminated with Aroclor 1268." Environmental Science & Technology 31(5): 1483-1488. Kucklick, J. R. and J. E. Baker. 1998. "Organochlorines in Lake Superior's food web." Environmental Science & Technology 32(9): 1192-1198. Lake, J. L., R. McKinney, C. A. Lake, F. A. Osterman and J. Heltshe. 1995. "Comparisons of patterns of polychlorinated biphenyl congeners in water, sediment, and indigenous organisms from New Bedford Harbor, Massachusetts." Archives of Environmental Contamination and Toxicology 29(2): 207-220. Larsson, P., L. Okla and L. Collvin. 1993. "Reproductive status and lipid-content as factors in PCB, DDT and HCH contamination of a population of pike (Esox lucius L.)." Environmental Toxicology and Chemistry 12(5): 855-861. Liebert, D., J. E. Baker, F. C. Ko, D. Connell, T. Burrell, C. Poukish, C. Luckett, Q. Forest, W. Beaty, V. Burch, B. Fairall, J. McKay, W. Evans and D. Johnson. 2000. Bioaccumulative toxic chemicals in fish from Maryland waters, Maryland Department of the Environment. Mackay, D. and A. Fraser. 2000. "Bioaccumulation of persistent organic chemicals: Mechanisms and models." Environmental Pollution 110(3): 375-391. Madenjian, C. P., S. R. Carpenter, G. W. Eck and M. A. Miller. 1993. "Accumulation of PCBs by lake trout (Salvelinus namaycush) - An individual-based model approach." Canadian Journal of Fisheries and Aquatic Sciences 50(1): 97-109. Mansueti, R. 1961. "Movements, reproduction, and mortality of the white perch, Roccus americanus, in the Patuxent Estuary, Maryland." Chesapeake Science 2: 142-205. Maruya, K. A. and R. E. Lee. 1998. "Biota-sediment accumulation and trophic transfer factors for extremely hydrophobic polychlorinated biphenyls." Environmental Toxicology and Chemistry 17(12): 2463-2469. Morrison, H. A., F. Gobas, R. Lazar and G. D. Haffner. 1996. "Development and verification of a bioaccumulation model for organic contaminants in benthic invertebrates." Environmental Science & Technology 30(11): 3377-3384.

147
Morrison, H. A., D. M. Whittle and G. D. Haffner. 2002. "A comparison of the transport and fate of polychlorinated biphenyl congeners in three Great Lakes food webs." Environmental Toxicology and Chemistry 21(4): 683-692. Mullin, M. D., C. M. Pochini, S. McCrindle, M. Romkes, S. H. Safe and L. M. Safe. 1984. "High resolution PCB analysis: Synthesis and chromatographic properties of all 209 congeners." Environmental Science & Technology 18: 468-476. Oliver, B. G. and A. J. Niimi. 1988. "Trophodynamic analysis of polychlorinated biphenyl congeners and other chlorinated hydrocarbons in the Lake Ontario ecosystem." Environmental Science & Technology 22: 388-397. SFEI. 1999. 1999 San Francisco estuary regional monitoring program for trace substances (RPM). San Francisco, CA, San Francisco Estuary Institute. Shaw, G. R. and D. W. Connell. 1984. "Physiochemical properties controlling polychlorinated biphenyl (PCB) concentrations in aquatic organisms." Environmental Science & Technology 18: 18-23. Shifrin, N. S. and A. P. Toole. 1998. "Historical perspective on PCBs." Environmental Engineering Science 15(3): 247-257. Sijm, D., W. Seinen and A. Opperhulzen. 1992. "Life-cycle biomagnification study in fish." Environmental Science & Technology 26(11): 2162-2174. Steinbacher, J.C. 2001. The american eel, Anguilla rostrata, as a sentinel species of polychlorinated biphenyl contamination in the Hudson River. M.S. Thesis. College Park, University of Maryland: 96. Thomann, R. V. 1989. "Bioaccumulation model of organic chemical distribution in aquatic food chains." Environmental Science & Technology 23: 699-707. Thomann, R. V., J. P. Connolly and T. F. Parkerton. 1992. "An equilibrium-model of organic-chemical accumulation in aquatic food webs with sediment interaction." Environmental Toxicology and Chemistry 11(5): 615-629. Tracey, G. A. and D. J. Hansen. 1996. "Use of biota-sediment accumulation factors to assess similarity of nonionic organic chemical exposure to benthically-coupled organisms of differing trophic mode." Archives of Environmental Contamination and Toxicology 30: 467-475. US EPA. 2000a. Guidance for assessing chemical contaminant data for use in fish advisories. Washington D.C., U.S. Environmental Protection Agency. 1. Fish Sampling Analysis (Third edition).
148
US EPA. 2000b. Methodology for deriving ambient water quality criteria for the protection of human health. Washington D.C., U.S. Environmental Protection Agency. US EPA. 2001. Methods for collection, storage and manipulation of sediments for chemical and toxicological analyses: Technical manual. Washington D.C., U.S. Environmental Protection Agency. van der Oost, R., J. Beyer and N. P. E. Vermeulen. 2003. "Fish bioaccumulation and biomarkers in environmental risk assessment: A review." Environmental Toxicology and Pharmacology 13(2): 57-149. VanderZanden, M. J. and J. B. Rasmussen. 1996. "A trophic position model of pelagic food webs: Impact on contaminant bioaccumulation in lake trout." Ecological Monographs 66(4): 451-477. Wilhelm, F. M. 2002. "Estimating reproductive effort in small aquatic invertebrates from lipid dynamics." Journal of Freshwater Ecology 17(4): 595-599. Woodburn, K. B., W. J. Doucette and A. W. Andren. 1984. "Generator column determination of octanol/water partition coefficients for selected polychlorinated biphenyls." Environmental Science & Technology 18: 457-459.