bio-inspired materials: an electrochemically … materials: an electrochemically controlled...
TRANSCRIPT

Bio-inspired materials: an electrochemically controlled polymeric system which mimics biological learning
behavior
Victor Erokhin
Institute of Crystallography Russian Academy of SciencesDepartment of Physics, University of Parma

Biologically Inspired Adaptive Organic Networks – BION
Probability of the pathway involvment into the signal propagation depends on the frequency of its utilization
Training will eliminate occasional connections

NEURON ANALOGS
• Schottky barrier
-0.006
-0.004
-0.002
0
0.002
0.004
0.006
0.008
-1.5 -1 -0.5 0 0.5 1 1.5
U(V)
I(A)
Difference in the work functions of Au and PANI results in the rectifying characteristics
In-PANI-Au structure

SYNAPSIS ANALOG: ELECTROCHEMICAL NONLINEAR ELEMENT (VIEW AND
CONNECTION)
PANIS DPEOG
IG
ID
V. Erokhin, T. Berzina and M.P. Fontana, “A polymer based electrochemical device”,J. Appl. Phys., 97, 064501 (2005).

ELECTROCHEMICAL NONLINEAR ELEMENT (V-I characteristics (Ag))
-400
0
400
800
1200
-1 -0.5 0 0.5 1
voltage (V)
curr
ent (
nA)
-400
-200
0
200
400
-1 -0.5 0 0.5 1
voltage (V)
curr
ent (
nA)
0
200
400
600
800
1000
-1 -0.5 0 0.5 1
voltage (V)
curr
ent (
nA)
Drain current Gate current
Differential current
Empty squares – increasing VFilled squares – decreasing V

ELECTROCHEMICAL NONLINEAR ELEMENT (adaptive behavior)
0100200300400500600700
0 1000 2000 3000 4000
time (s)
curr
ent (
nA)
-250
-200
-150
-100
-50
00 500 1000 1500 2000
time (s)
curr
ent (
nA)
Kinetics of drain current variation at positive (+0.6 V) bias
Kinetics of drain current variation at positive (-0.1 V) bias

electrons; Li+ ions;
insulating PANI; conducting PANI;
solid electrolyte (LiClO4 doped PEO);
WORKING PRINCIPLE

WORKING PRINCIPLE
Li+ ions penetrate PANI active layer decreasing its conductivity before application of voltage (partial reduction)

WORKING PRINCIPLE
When biased negatively, Li+ ions penetrate on practically whole depth of active PANI layer, transferring it into insulator (reduction)
LiClPANIeLiClPANI +⇔++ −+−+ :

Drain current at +0.6 V
0100200300400500600700
0 1000 2000 3000 4000
time [s]
curr
ent [
nA]
experimenttheory
V
V
V
x
x
x
i1
Ri=Rins if Vi <Vox
Ri=R(t) if Vi>Vox
GRADUAL SHIFT OF THE INSULATING AREA BOUNDARY IN THE DIRECTION OF SOURCE AT POSITIVE BIAS

WORKING PRINCIPLE
When biased positively, Li+ ions are shifted into solid electrolyte layer (PEO); PANI layer is highly conducting (oxidation)

RAMAN SPECTROSCOPY CHARACTERIZATION
Raman spectra of non conducting(a) and conducting (b) PANI LS film upon excitation at 488 nm.
Raman spectra taken for the PANI-PEO junction before the final doping with HCl . Thespectra were taken focussing nearthe silver electrode (a) and in the PANI-only area (b).
T. Berzina, V. Erokhin, and M.P. Fontana, J. Appl. Phys., in press

Sequence of Raman spectra upon application of positive and negativevoltage cycles

IMITATING THE SNAIL LEARNING PROCESS
After several simultaneous applications of “taste”and “touch” actions, feeding pattern begins to start, when only “touch” action is applied.
Main input (MI) corresponds to the “touch”actionTeaching input (TI) corresponds to the “taste” action After learning the output signal
was twice higher at the same input conditionsA. Smerieri, T. Berzina, V. Erokhin, and M.P. Fontana,
Mater. Sci. Engineer. C, submitted.

MODEL ADAPTIVE NETWORK
Out
1
Out 2
Input 1 Input 2
12465After teaching
32120Before teaching
Out 2 (nA)Out 1 (nA)
Teaching by applying –0.5Vbetween 1 input and 1 output
V. Erokhin, T. Berzina, and M.P. Fontana, Crystallogr. Rep. In press.

“Living matter evades the decay to equilibrium”
Schrödinger E. // What is Life? Physical Aspect of the Living Cell. Cambridge University Press, 1944
If we take the example of the pond snail, we can recognize one neuron, whose behavior is different from all the others, namely, the N1M neuron. Being activated once, it produces a rather long sequence of potential pulses. These pulses, then, interfere with nervous system treated signals from sensory elements providing learning and performing commands to executive organs.
Straub V.A., Staras K., Kemenes G., Benjamin P.R. // J. Neurophysiol. 2002. V. 88. P. 1569.
Our electrochemical element can be modified in order to perform similar tasks.
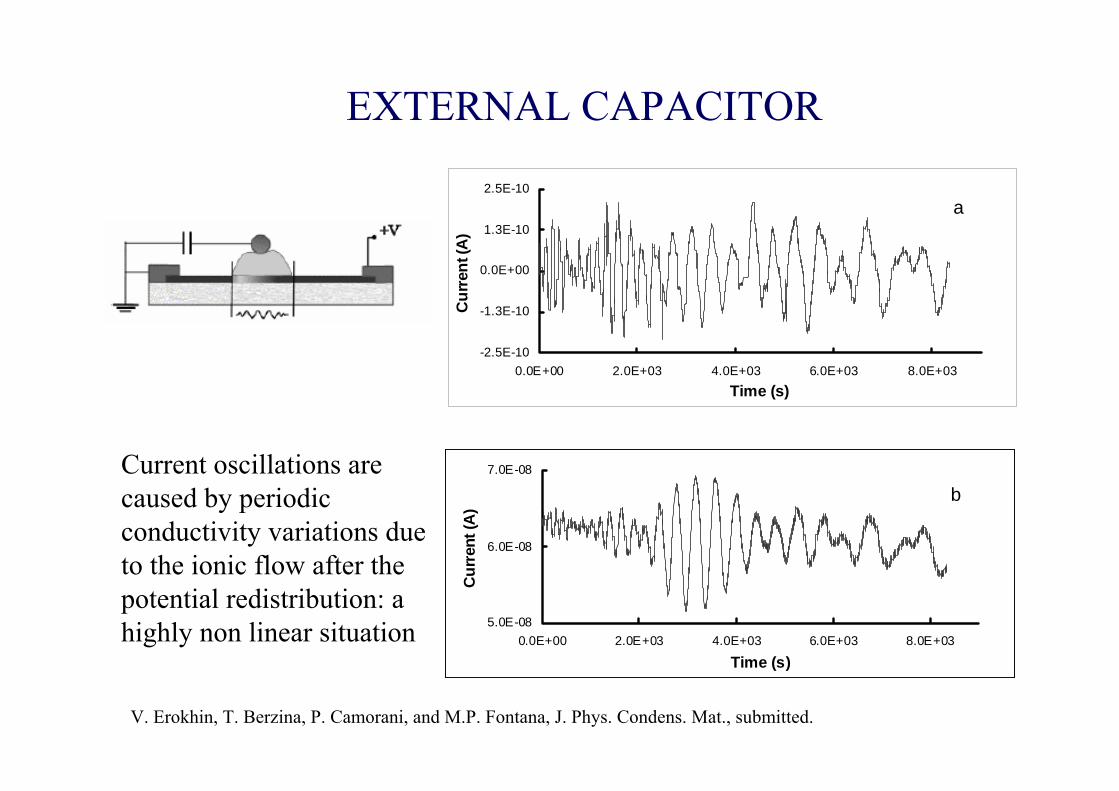
Current oscillations are caused by periodic conductivity variations due to the ionic flow after the potential redistribution: a highly non linear situation
EXTERNAL CAPACITOR
-2.5E-10
-1.3E-10
0.0E+00
1.3E-10
2.5E-10
0.0E+00 2.0E+03 4.0E+03 6.0E+03 8.0E+03Time (s)
Cur
rent
(A)
a
5.0E-08
6.0E-08
7.0E-08
0.0E+00 2.0E+03 4.0E+03 6.0E+03 8.0E+03
Time (s)
Cur
rent
(A)
b
V. Erokhin, T. Berzina, P. Camorani, and M.P. Fontana, J. Phys. Condens. Mat., submitted.

GRAPHITE STRIPE AS GATE
Current oscillations were also observed when graphite stripe, capable to accumulate chargesby intercalation, was used as gate electrode.A - positive biasB - negative bias
Non-equilibrium reactions must be considered for the explanation of observed phenomenon
2.70E-07
2.90E-07
3.10E-07
3.30E-07
0.00E+00 1.00E+03 2.00E+03 3.00E+03
Time (s)
Cur
rent
(A) a
4.50E-07
5.50E-07
6.50E-07
0.00E+00 2.00E+03 4.00E+03 6.00E+03
Time (s)
Cur
rent
(A) b
The oscillations lasted at least 24 hrs, when our observation was stopped
⇓

MODEL
1 i
∑=
=N
i
gig iI
1actpas
gi iii +=
)(
)(
tfiR
VVi
act
eli
igpas
=
−=
When ΔV pass oxidation or reduction potential value
g
ii
dd I
RV
I +=∑
Active area is devided into 100 zones. Conductivity variation is due according actual potential of the zone with respect to the G potential.

CALCULATION RESULTS
•Variation of capacitor value•Variation of drain voltage•Variation of resistances

SCHEME OF THE PROCESS
Transfer to insulating state + charging of the capacitor
Capacitor is charged (negatively).
Channel is insulating
Discharge of the capacitor. Areas at potential more then oxidizing one become conducting.
Redistribution of the potential profile. Enlargement of the conducting area.
Repetition of the process⇒ space periodicity ⇒“conductivity waves”

BELOUSOV-ZHABOTINSKY REACTION
Cyclic reaction (oftenredox reactions) far from the equillibrium of the reagents concentration.
BrO3- + Br- => HBrO2 + HOBr Rate = k1[BrO3
-][Br-]
HBrO2 + Br- => 2HOBr Rate = k2[HBrO2][Br-]
BrO3- + HBrO2 => 2HBrO2 + 2Ce4+ Rate = k3[BrO3
-][HBrO2]
2HBrO2 => BrO3- + HOBr Rate = k4[HBrO2]2
B + Ce4+ => 1/2fBr- Rate = kc[Z][Ce4+]
Zaikin AN and Zhabotinsky AM 1970 Nature 225 535

PROCESSES IN THE ELECTROCHEMICAL ELEMENT WITH CAPACITOR:
•Process A: Oxidation (increase of the conductivity)
•Process B: Reduction (decrease of the conductivity)
•Process C: Variation of the gate potential due to the charge accumulation and Redistribution of the potential profile along the channel due to the conductivity variation

BZ REACTION CAN BE DESCRIBED BY LOTKA-VOLTERRA EQUATIONS:
hXYdYdtdY
bXYaXdtdX
+−=
−=
IN OUR CASE :
A – amount of oxidized PANI;
B – amount of reduced PANI;
Ig – gate current
BZkAXkdtdZ
BZkXYkAYkdtdY
XkAXkXYkAYkdtdX
65
623
24523
2
5.0
2
−=
+−−=
−+−=
AkBIkdtdA
g 21 −=
BkAIkdtdB
g 43 −−=
CI
dtdV gg =
CIk
dtdB
dtdI
kBkV
VVkI
gg
act
actgg
8
76
5 )(
=+
+=
−=

ALTERNATIVE APPROACH
Formation of the network by statistical assembling of electrochemical junctions
Realization of fibrillar structures

Electric field assisted polymer fiber formation
4 kV bias
+-

Optical microscopy image of PEO fibrillar network
PEO fibrillar matrix fabricated by vacuum treatment of PEO solution
PEO solution (0.1-0.5 ml) on the substrate (glass or glass with Cr electrodes) was placed into the vacuum chamber and pumped with mechanical pump at 10-2 Torr for 15-20 min.
image size 0.6 x 0.5 mm

• PANI fibers were formed on PEO fibrillar matrix by dropping 0.1-0.2 ml of PANI solution on it, placing the structure into the vacuum chamber, and pumping again for 15-20 min till 10-2 Torr.
• The formed fibers of different diameter of both PEO and PANI (from less than one micron up to tens of microns) and length (up to some millimeters) are clearly visible, as well as the 3D morphology.
PEO –PANI fibrillar networks after vacuum treatment
Optical microphotograph (image size 0.6 x 0.5 mm).
V. Erokhin, T. Berzina, P. Camorani, and M.P. Fontana, Soft Matter., 2, 870 (2006).

Statistical network of mixed PEO-PANI fibers

Statistical network of mixed PEO-PANI fibers

FIBRILLAR STRUCTURE WITH 3 ELECTRODES
Is the formed structure complex enough in order to provide by the statistically distributed PANI-PEO fiber interconnections the pathways similar to those directly fabricated in the discrete deterministic device?
In other words, whether some parts of the structure have Ag wire – PEO – PANI heterojunctions?
The third electrode (Ag wire) was inserted into the drop of PEO before vacuum evaporation. Thus, after the formation of PEO and PANI fibers, the wire would be retained in the middle of the fibrillar structure to maintain ground potential level in PEO-PANI junctions in the central part of the structure.
Question:

0
200
400
600
800
-1 -0.5 0 0.5 1
Voltage (V)
Cur
rent
(nA
)increasedecrease
V/I characteristics measured in on the drain electrode in 3 electrode circuit.
Non linear electrical characteristics were found, implying thesubstantial presence of nodes similar to the fabricated device
Clearly visible rectifying behavior of the curve confirms the Clearly visible rectifying behavior of the curve confirms the success of the realization of the desirable success of the realization of the desirable heterojunctionsheterojunctions in in some areas of the formed some areas of the formed fibrillarfibrillar networknetwork

CONCLUSIONS• Demonstration of the possibility to realize adaptive
network based on electrochemically controlled polymeric structures.
• Observation of non-equilibrium rhythmic electrical behavior at fixed external conditions.
• Possible interpretation of the observed phenomenain terms of Belousov-Zhabotinsky reaction.
• Justification of the connection to biological systems

COLLABORATORS
• Prof. Marco P. Fontana• Dr. Tatiana Berzina• Dr. Paolo Camorani • Dr. Svetlana Erokhina• Anteo Smerieri
The present work was supported by MIUR under the project FIRB RBNE014YSR8 “Molecular nanodevices”.