bio-functionalized pt nanoparticles based electrochemical impedance immunosensor for human cardiac...
TRANSCRIPT
RSC Advances
PAPER
Publ
ishe
d on
17
Apr
il 20
14. D
ownl
oade
d by
Col
umbi
a U
nive
rsity
on
01/1
0/20
14 0
8:52
:12.
View Article OnlineView Journal | View Issue
aCSIR-National Physical Laboratory, Dr K.
India. E-mail: [email protected] of Applied Chemistry, Delhi
Delhi-110042, India
Cite this: RSC Adv., 2014, 4, 21267
Received 6th January 2014Accepted 14th April 2014
DOI: 10.1039/c4ra00105b
www.rsc.org/advances
This journal is © The Royal Society of C
Bio-functionalized Pt nanoparticles basedelectrochemical impedance immunosensor forhuman cardiac myoglobin
Sujeet K. Mishra,ab Avanish K. Srivastava,a Devendra Kumarb and Rajesh*a
We report the covalent immobilization of three-dimensional carboxyl-functionalized Pt(MPA) nanoparticles
with myoglobin protein antibody by carbodiimide coupling reaction deposited onto an indium-tin-oxide-
coated glass plate for the construction of a bioelectrode. This bioelectrode assembly was characterized by
spectro/microscopic and electrochemical techniques. Electrochemical impedance studies of the
bioelectrode showed significant changes in charge transfer resistance (Ret), predominantly in the low AC
frequency region of <40 Hz, on immunoreaction with human cardiac myoglobin antigen (Ag-cMb). Ag-
cMb detection in phosphate buffer exhibited a linear range of 0.01 mg mL�1 to 1 mg mL�1 with a
sensitivity of 184.8 U cm2 per decade.
1. Introduction
Nanostructured materials such as nanoparticles, nanotubes,and nano hybrid materials have become an intensive researcharea due to their unique chemical and physical propertiesincluding large specic surface areas, good biocompatibilities,and high surface free energies.1 Recent advances in the eld ofnanotechnology have opened up research opportunities onmaterials with ultrane nanostructures. Metal nanoparticles,with their fascinating properties such as large surface-to-volume ratios and increased surface activities, have continuedto draw a great deal of attention in interdisciplinary areas of thescientic community. Metal nanoparticles have been used inintriguing applications in many elds of physical, chemical andmaterial sciences in the past few years.2–4 Recently, the amountof research on their biological applications has increased, withpotential applications in the construction of electrochemicalsensors and biosensors, where they function as “electronantennae” to efficiently channel electrons between the electrodeand the electroactive species.5,6 Functionalized nanomaterialsoffer excellent prospects for interfacing biological recognitionevents with electronic signal transduction, leading to the designof a new generation of bioelectronic devices that exhibit novelfunctions. The major advantage of using functionalized nano-materials is their potential capacity for combining multiplemodalities within a single probe, which enables far highersensitivities to be achieved. Platinum (Pt), one of the mostresearched noble metals, has extensive applications in the eld
S. Krishnan Road, New Delhi-110012,
Technological University, Bawana Road,
hemistry 2014
of electrochemical sensors. This is because Pt nanoparticles canact as an effective matrix for biomolecules due to theirbiocompatibility and large surface areas.7 Recent applicationsof Pt nanoparticles include the detection of low concentrationsof DNA by using a platinum nanoparticle–gold ultra micro-electrode in a hydrazine oxidation reaction.8
According to a WHO report (2011), cardiovascular diseases(CVDs) are considered to be the leading cause of death aroundthe world.9 CVDs include coronary heart disease, cerebrovas-cular disease, raised blood pressure, peripheral artery disease,rheumatic heart disease and congenital heart disease and heartfailure. Cardiac markers are biological analytes that aredetectable in the blood serum and play an essential role in thediagnosis, prognosis, monitoring, and risk stratication insuspected CVD patients.10 Among the currently-used cardiacmarkers for the detection of acute myocardial infarction(AMI),11 myoglobin (found in heart and skeletal muscles) hasbeen proven to be a valuable screening test for early AMI diag-nosis. Myoglobin concentration (cMb) in blood rises quickly, i.e.1–3 h, aer the appearance of the initial symptoms of thedisease, and reaches its maximum concentration between 6 and12 h before returning to baseline within 24–48 h. Myoglobin is a17.6 kDamonomeric hemeprotein that contains 153 amino acidresidues in a highly-folded and compact structure with eightseparate and distinct alpha helical secondary structures. Due toits small molecular dimensions (3 nm � 4 nm � 5 nm) andmolar volume (1.87 � 104 cm3 mol�1),12 it is quickly releasedinto circulation, making cMb a valuable early screening test forAMI. The normal cMb level in human blood ranges from 30 to90 ng mL�1, which spikes to 200 ng mL�1 or even higher within1 h of the onset of myocardial infarction. cMB can reach as highas 900 ng mL�1 during the peak hour. In general, tests fordetecting cMb are either indicative rapid tests or estimations
RSC Adv., 2014, 4, 21267–21276 | 21267
RSC Advances Paper
Publ
ishe
d on
17
Apr
il 20
14. D
ownl
oade
d by
Col
umbi
a U
nive
rsity
on
01/1
0/20
14 0
8:52
:12.
View Article Online
using sandwich immunoassay with secondary-labelled anti-bodies, i.e. the enzyme linked immunosorbent assay (ELISA)technique. However, these tests require the proper laboratoryequipment and instrumentation, multi-step processing ofsamples, and well-trained personnel, leading to a time-consuming and expensive detection. Masson et al. developed asurface plasmon resonance (SPR)-based sensor for myoglobin.13
This type of detection is relatively easy and cheap to perform,and also allows quantitative and kinetic measurements ofmolecular interactions. The main problems associated with theSPR sensor are the fouling ability, low affinity and specicitythat affect sensitivity of biosensing transducers. Other types ofoptical biosensors used for Mb detection include those devel-oped by Darain et al.14 and Matveeva et al.15 These sensors canperform enhanced Mb immunoassays, however, they areexpensive and require dedicated personnel to perform the tests.They also require difficult labelling procedures that depend onindirect indicator-based signal schemes. Matveeva et al. haveutilized silver island lms (SIF) for developing a uorescence-based immunoassay for cardiac Mb. The main disadvantage ofthis method is the non-homogeneous nature of SIFs, whichresults in signicant deviations in assay readings, making thismethod unsuitable for precise Mb detection.15
Electrochemical immunosensors are an important class ofsensing systems that have revolutionized modern chemicalanalysis due to their easy use, high efficiency, possibility ofportability and miniaturization, fast response time and directtransduction of bio-molecular recognition events into electronicsignals. Because of their high accuracy, sensitivity, selectivityand cost-effectiveness, they have been extensively used to detectproteins, biomarkers, biological toxins and biological-warfareagents in critical situation, food, environment, pharmaceuticalchemistry, and clinical diagnostic applications.16–20 Pak-apongpan et al.21 have reported an electrochemical sensor forMb based on a methylene blue-multiwalled carbon nanotubes(MWCNT) nanohybrid modied glassy carbon electrode (GCE),where the detection is based on the direct electrochemicalreduction of Mb. Although this sensor provided a wide linearrange of Mb detection from 0.1 mM to 3.0 mM (�1.78 mg mL�1 to53.40 mg mL�1), it is out of the physiological range of cMb inhuman blood, and thus would require a sample dilution for lowlevel, sub-mg mL�1 Mb detection.
Electrochemical impedance spectroscopy (EIS) has recentlyreceived considerable attention for providing a sensitive andnon-destructive characterization of the electrical properties inbiological interfaces such as sensing formation of antigen–antibody and biotin–avidin complexes and interactionsbetween oligonucleotides and DNAs.22,23
In this paper, considering the advantages of the EIS methodand the properties of metal Pt nanoparticles, we report a plat-form for the construction of a bioelectrode for the detection ofthe cardiac biomarker, cMb, using functionalized Pt nano-particles. The functionalized Pt nanoparticles are covalentlyanchored on a 3-aminopropyltriethoxy silane (APTES) selfassembled monolayer (SAM) over an indium-tin-oxide (ITO)-glass plate. The cardiac protein antibody, Ab-cMb, is covalentlyattached to the carboxyl-functionalized Pt nanoparticle-
21268 | RSC Adv., 2014, 4, 21267–21276
modied APTES/ITO-glass plates using a carbodiimide couplingreaction. This bioelectrode is systematically characterized byvarious microscopic techniques, and its immunosensing abilitytowards the quantitative estimation of Ag-cMb in phosphatebuffer saline (PBS; pH 7.4) is investigated by EIS using [Fe(CN)6]
3�/4� as a redox probe.
2. Experimental2.1 Reagents
Monoclonal mouse anti-human cardiac myoglobin (Ab-cMb;Cat 4M23) and myoglobin derived from human heart tissue (Ag-cMb; Cat 8M50) were procured from Hytest (Turku, Finland).Mouse immunoglobulin-G (Ag-IgG; Cat IGP3) were obtainedfrom GENEI (Bangalore, India). 3-Aminopropyl triethoxysilane(APTES) was purchased from Merck chemicals (Germany). N-(3-Dimethyl aminopropyl)-N0-ethyl carbodiimide hydro chloride(EDC), N-hydroxy succinimide 98% (NHS), hydrogen hexa-chloroplatinate hexahydrate (H2PtCl6$6H2O), sodium borohy-dride (NaBH4) and 3-mercaptopropionic acid (MPA) wereobtained from Sigma-Aldrich Corp. All other chemicals were ofanalytical grade and used without further purication.
2.2 Apparatus
Contact angles were recorded on a model DSA10MK2 DropShape Analysis System from Kruss GmbH, Germany. XRDpatterns were recorded using a Bruker AXS Advance D8 powderX-ray diffractometer. High resolution transmission electronmicroscopy was performed on a Tecnai G2 F30 STWIN HRTEMmodel with eld emission gun operated at 300 kV. Scanningelectron microscopy (SEM) images were obtained with a LEO440 PC (UK) digital scanning electron micrograph with amounted energy dispersive X-ray spectrometer (EDX). Fourier-transform infrared (FTIR) spectrum was taken on a Perkin-Elmer Spectrum BX II. Atomic force microscopy (AFM) imageswere obtained on a Nanoscope 5 (VEECO Instrument Ltd., USA).Cyclic voltammetry and EIS measurements were done on aPGSTAT302N AUTOLAB instrument from Eco Chemie, Nether-lands. The EIS experimental data were circuit tted by GPES(general purpose electrochemical system version 4.9, EcoChemie) soware to obtain the values of EIS parameters.
2.3 Synthesis of functionalized Pt nanoparticles
3-Mercaptopropionic acid-capped Pt (MPA) nanoparticles werechemically synthesized using the conventional sodium boro-hydride reduction method in aqueous solution as reportedearlier, with slight modication.24 Briey, a 100 mM stocksolution of Pt salt was prepared by dissolving 1 g ofH2PtCl6$6H2O in 19 mL of deionized water. 1 mL of this stocksolution was then reduced by adding NaBH4 solution (48 mg in2 mL H2O) drop wise under constant stirring. The change incolour of the solution from yellow to dark brown indicated theformation of the Pt nanoparticles. A solution of 46 mL MPA in 10mL H2O was then immediately added to stabilize the above Ptcolloidal solution. The nal volume of the reaction mixture waskept at 50 mL. The reaction mixture was le stirring for 2 h at
This journal is © The Royal Society of Chemistry 2014
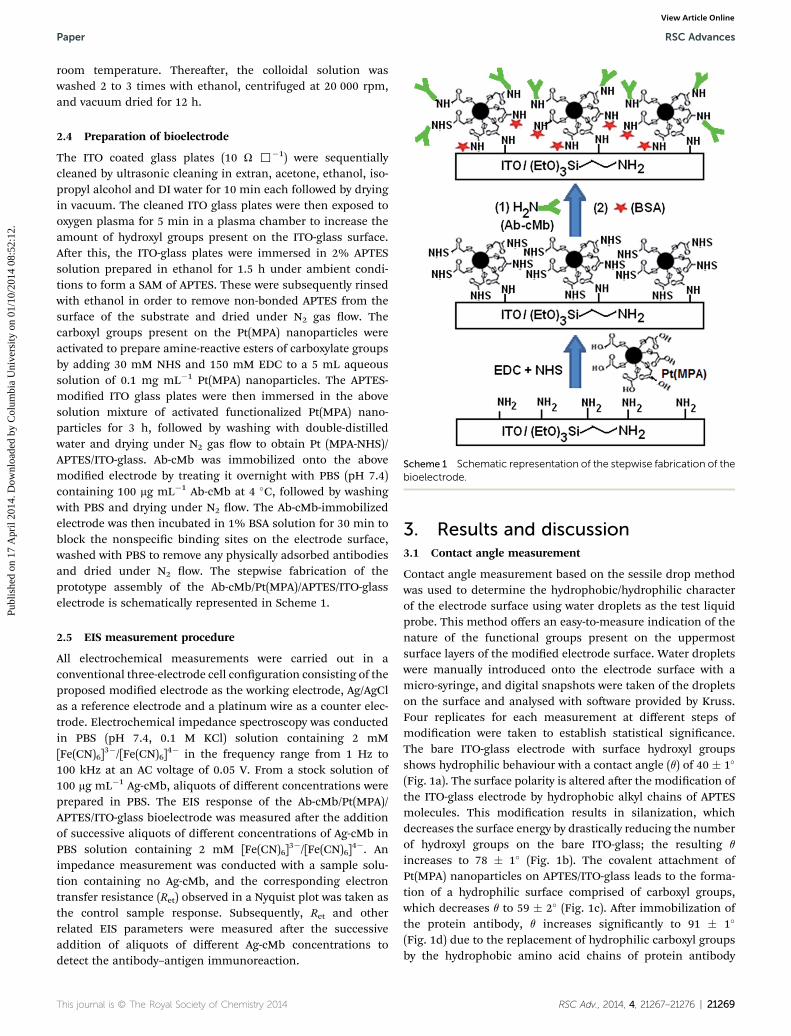
Scheme 1 Schematic representation of the stepwise fabrication of thebioelectrode.
Paper RSC Advances
Publ
ishe
d on
17
Apr
il 20
14. D
ownl
oade
d by
Col
umbi
a U
nive
rsity
on
01/1
0/20
14 0
8:52
:12.
View Article Online
room temperature. Thereaer, the colloidal solution waswashed 2 to 3 times with ethanol, centrifuged at 20 000 rpm,and vacuum dried for 12 h.
2.4 Preparation of bioelectrode
The ITO coated glass plates (10 U ,�1) were sequentiallycleaned by ultrasonic cleaning in extran, acetone, ethanol, iso-propyl alcohol and DI water for 10 min each followed by dryingin vacuum. The cleaned ITO glass plates were then exposed tooxygen plasma for 5 min in a plasma chamber to increase theamount of hydroxyl groups present on the ITO-glass surface.Aer this, the ITO-glass plates were immersed in 2% APTESsolution prepared in ethanol for 1.5 h under ambient condi-tions to form a SAM of APTES. These were subsequently rinsedwith ethanol in order to remove non-bonded APTES from thesurface of the substrate and dried under N2 gas ow. Thecarboxyl groups present on the Pt(MPA) nanoparticles wereactivated to prepare amine-reactive esters of carboxylate groupsby adding 30 mM NHS and 150 mM EDC to a 5 mL aqueoussolution of 0.1 mg mL�1 Pt(MPA) nanoparticles. The APTES-modied ITO glass plates were then immersed in the abovesolution mixture of activated functionalized Pt(MPA) nano-particles for 3 h, followed by washing with double-distilledwater and drying under N2 gas ow to obtain Pt (MPA-NHS)/APTES/ITO-glass. Ab-cMb was immobilized onto the abovemodied electrode by treating it overnight with PBS (pH 7.4)containing 100 mg mL�1 Ab-cMb at 4 �C, followed by washingwith PBS and drying under N2 ow. The Ab-cMb-immobilizedelectrode was then incubated in 1% BSA solution for 30 min toblock the nonspecic binding sites on the electrode surface,washed with PBS to remove any physically adsorbed antibodiesand dried under N2 ow. The stepwise fabrication of theprototype assembly of the Ab-cMb/Pt(MPA)/APTES/ITO-glasselectrode is schematically represented in Scheme 1.
2.5 EIS measurement procedure
All electrochemical measurements were carried out in aconventional three-electrode cell conguration consisting of theproposed modied electrode as the working electrode, Ag/AgClas a reference electrode and a platinum wire as a counter elec-trode. Electrochemical impedance spectroscopy was conductedin PBS (pH 7.4, 0.1 M KCl) solution containing 2 mM[Fe(CN)6]
3�/[Fe(CN)6]4� in the frequency range from 1 Hz to
100 kHz at an AC voltage of 0.05 V. From a stock solution of100 mg mL�1 Ag-cMb, aliquots of different concentrations wereprepared in PBS. The EIS response of the Ab-cMb/Pt(MPA)/APTES/ITO-glass bioelectrode was measured aer the additionof successive aliquots of different concentrations of Ag-cMb inPBS solution containing 2 mM [Fe(CN)6]
3�/[Fe(CN)6]4�. An
impedance measurement was conducted with a sample solu-tion containing no Ag-cMb, and the corresponding electrontransfer resistance (Ret) observed in a Nyquist plot was taken asthe control sample response. Subsequently, Ret and otherrelated EIS parameters were measured aer the successiveaddition of aliquots of different Ag-cMb concentrations todetect the antibody–antigen immunoreaction.
This journal is © The Royal Society of Chemistry 2014
3. Results and discussion3.1 Contact angle measurement
Contact angle measurement based on the sessile drop methodwas used to determine the hydrophobic/hydrophilic characterof the electrode surface using water droplets as the test liquidprobe. This method offers an easy-to-measure indication of thenature of the functional groups present on the uppermostsurface layers of the modied electrode surface. Water dropletswere manually introduced onto the electrode surface with amicro-syringe, and digital snapshots were taken of the dropletson the surface and analysed with soware provided by Kruss.Four replicates for each measurement at different steps ofmodication were taken to establish statistical signicance.The bare ITO-glass electrode with surface hydroxyl groupsshows hydrophilic behaviour with a contact angle (q) of 40 � 1�
(Fig. 1a). The surface polarity is altered aer the modication ofthe ITO-glass electrode by hydrophobic alkyl chains of APTESmolecules. This modication results in silanization, whichdecreases the surface energy by drastically reducing the numberof hydroxyl groups on the bare ITO-glass; the resulting q
increases to 78 � 1� (Fig. 1b). The covalent attachment ofPt(MPA) nanoparticles on APTES/ITO-glass leads to the forma-tion of a hydrophilic surface comprised of carboxyl groups,which decreases q to 59 � 2� (Fig. 1c). Aer immobilization ofthe protein antibody, q increases signicantly to 91 � 1�
(Fig. 1d) due to the replacement of hydrophilic carboxyl groupsby the hydrophobic amino acid chains of protein antibody
RSC Adv., 2014, 4, 21267–21276 | 21269
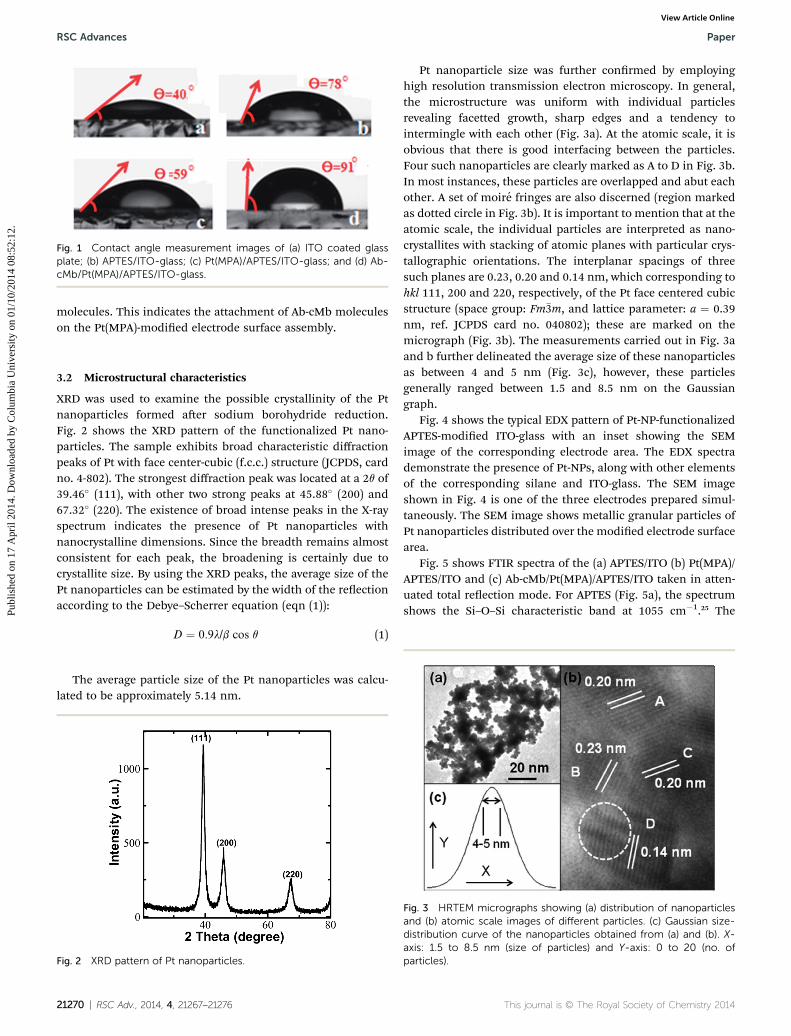
Fig. 1 Contact angle measurement images of (a) ITO coated glassplate; (b) APTES/ITO-glass; (c) Pt(MPA)/APTES/ITO-glass; and (d) Ab-cMb/Pt(MPA)/APTES/ITO-glass.
RSC Advances Paper
Publ
ishe
d on
17
Apr
il 20
14. D
ownl
oade
d by
Col
umbi
a U
nive
rsity
on
01/1
0/20
14 0
8:52
:12.
View Article Online
molecules. This indicates the attachment of Ab-cMb moleculeson the Pt(MPA)-modied electrode surface assembly.
3.2 Microstructural characteristics
XRD was used to examine the possible crystallinity of the Ptnanoparticles formed aer sodium borohydride reduction.Fig. 2 shows the XRD pattern of the functionalized Pt nano-particles. The sample exhibits broad characteristic diffractionpeaks of Pt with face center-cubic (f.c.c.) structure (JCPDS, cardno. 4-802). The strongest diffraction peak was located at a 2q of39.46� (111), with other two strong peaks at 45.88� (200) and67.32� (220). The existence of broad intense peaks in the X-rayspectrum indicates the presence of Pt nanoparticles withnanocrystalline dimensions. Since the breadth remains almostconsistent for each peak, the broadening is certainly due tocrystallite size. By using the XRD peaks, the average size of thePt nanoparticles can be estimated by the width of the reectionaccording to the Debye–Scherrer equation (eqn (1)):
D ¼ 0.9l/b cos q (1)
The average particle size of the Pt nanoparticles was calcu-lated to be approximately 5.14 nm.
Fig. 2 XRD pattern of Pt nanoparticles.
21270 | RSC Adv., 2014, 4, 21267–21276
Pt nanoparticle size was further conrmed by employinghigh resolution transmission electron microscopy. In general,the microstructure was uniform with individual particlesrevealing facetted growth, sharp edges and a tendency tointermingle with each other (Fig. 3a). At the atomic scale, it isobvious that there is good interfacing between the particles.Four such nanoparticles are clearly marked as A to D in Fig. 3b.In most instances, these particles are overlapped and abut eachother. A set of moire fringes are also discerned (region markedas dotted circle in Fig. 3b). It is important to mention that at theatomic scale, the individual particles are interpreted as nano-crystallites with stacking of atomic planes with particular crys-tallographic orientations. The interplanar spacings of threesuch planes are 0.23, 0.20 and 0.14 nm, which corresponding tohkl 111, 200 and 220, respectively, of the Pt face centered cubicstructure (space group: Fm�3m, and lattice parameter: a ¼ 0.39nm, ref. JCPDS card no. 040802); these are marked on themicrograph (Fig. 3b). The measurements carried out in Fig. 3aand b further delineated the average size of these nanoparticlesas between 4 and 5 nm (Fig. 3c), however, these particlesgenerally ranged between 1.5 and 8.5 nm on the Gaussiangraph.
Fig. 4 shows the typical EDX pattern of Pt-NP-functionalizedAPTES-modied ITO-glass with an inset showing the SEMimage of the corresponding electrode area. The EDX spectrademonstrate the presence of Pt-NPs, along with other elementsof the corresponding silane and ITO-glass. The SEM imageshown in Fig. 4 is one of the three electrodes prepared simul-taneously. The SEM image shows metallic granular particles ofPt nanoparticles distributed over the modied electrode surfacearea.
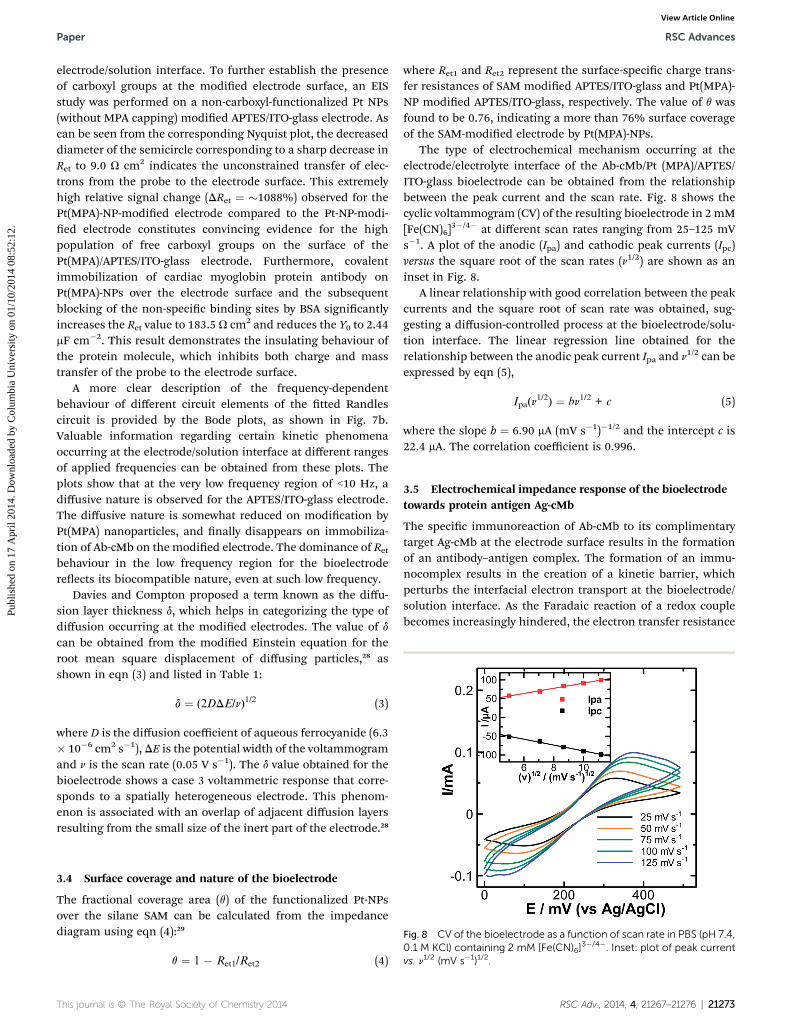
Fig. 5 shows FTIR spectra of the (a) APTES/ITO (b) Pt(MPA)/APTES/ITO and (c) Ab-cMb/Pt(MPA)/APTES/ITO taken in atten-uated total reection mode. For APTES (Fig. 5a), the spectrumshows the Si–O–Si characteristic band at 1055 cm�1.25 The
Fig. 3 HRTEM micrographs showing (a) distribution of nanoparticlesand (b) atomic scale images of different particles. (c) Gaussian size-distribution curve of the nanoparticles obtained from (a) and (b). X-axis: 1.5 to 8.5 nm (size of particles) and Y-axis: 0 to 20 (no. ofparticles).
This journal is © The Royal Society of Chemistry 2014
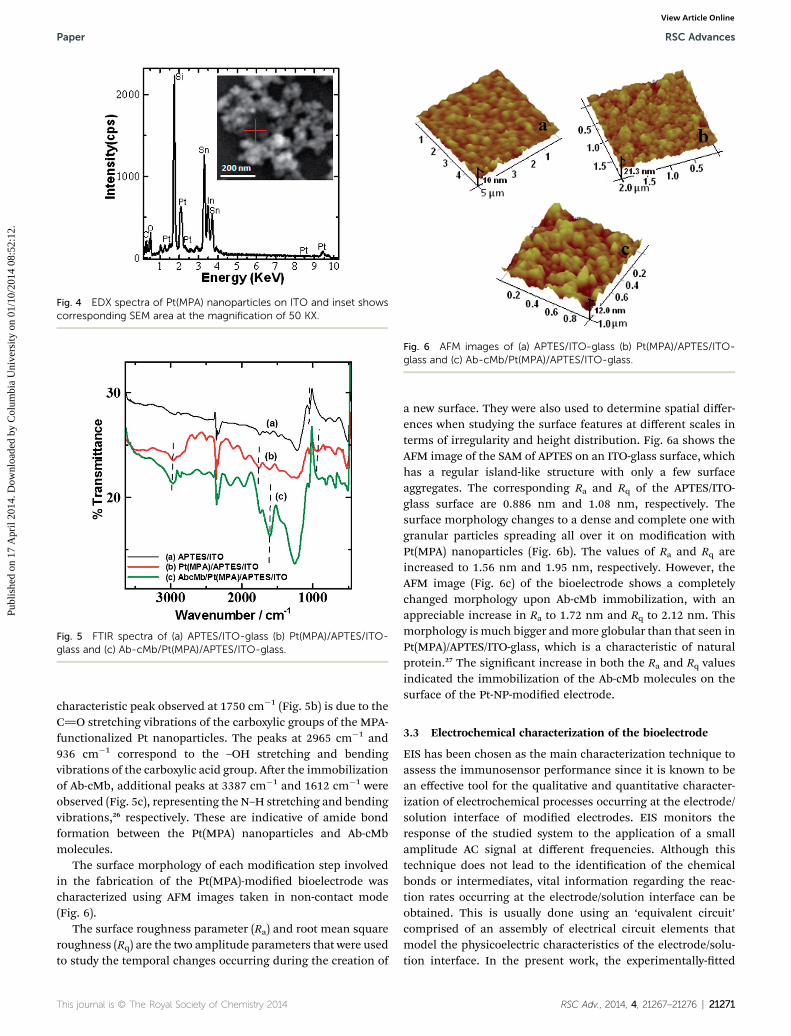
Fig. 4 EDX spectra of Pt(MPA) nanoparticles on ITO and inset showscorresponding SEM area at the magnification of 50 KX.
Fig. 5 FTIR spectra of (a) APTES/ITO-glass (b) Pt(MPA)/APTES/ITO-glass and (c) Ab-cMb/Pt(MPA)/APTES/ITO-glass.
Fig. 6 AFM images of (a) APTES/ITO-glass (b) Pt(MPA)/APTES/ITO-glass and (c) Ab-cMb/Pt(MPA)/APTES/ITO-glass.
Paper RSC Advances
Publ
ishe
d on
17
Apr
il 20
14. D
ownl
oade
d by
Col
umbi
a U
nive
rsity
on
01/1
0/20
14 0
8:52
:12.
View Article Online
characteristic peak observed at 1750 cm�1 (Fig. 5b) is due to theC]O stretching vibrations of the carboxylic groups of the MPA-functionalized Pt nanoparticles. The peaks at 2965 cm�1 and936 cm�1 correspond to the –OH stretching and bendingvibrations of the carboxylic acid group. Aer the immobilizationof Ab-cMb, additional peaks at 3387 cm�1 and 1612 cm�1 wereobserved (Fig. 5c), representing the N–H stretching and bendingvibrations,26 respectively. These are indicative of amide bondformation between the Pt(MPA) nanoparticles and Ab-cMbmolecules.
The surface morphology of each modication step involvedin the fabrication of the Pt(MPA)-modied bioelectrode wascharacterized using AFM images taken in non-contact mode(Fig. 6).
The surface roughness parameter (Ra) and root mean squareroughness (Rq) are the two amplitude parameters that were usedto study the temporal changes occurring during the creation of
This journal is © The Royal Society of Chemistry 2014
a new surface. They were also used to determine spatial differ-ences when studying the surface features at different scales interms of irregularity and height distribution. Fig. 6a shows theAFM image of the SAM of APTES on an ITO-glass surface, whichhas a regular island-like structure with only a few surfaceaggregates. The corresponding Ra and Rq of the APTES/ITO-glass surface are 0.886 nm and 1.08 nm, respectively. Thesurface morphology changes to a dense and complete one withgranular particles spreading all over it on modication withPt(MPA) nanoparticles (Fig. 6b). The values of Ra and Rq areincreased to 1.56 nm and 1.95 nm, respectively. However, theAFM image (Fig. 6c) of the bioelectrode shows a completelychanged morphology upon Ab-cMb immobilization, with anappreciable increase in Ra to 1.72 nm and Rq to 2.12 nm. Thismorphology is much bigger andmore globular than that seen inPt(MPA)/APTES/ITO-glass, which is a characteristic of naturalprotein.27 The signicant increase in both the Ra and Rq valuesindicated the immobilization of the Ab-cMb molecules on thesurface of the Pt-NP-modied electrode.
3.3 Electrochemical characterization of the bioelectrode
EIS has been chosen as the main characterization technique toassess the immunosensor performance since it is known to bean effective tool for the qualitative and quantitative character-ization of electrochemical processes occurring at the electrode/solution interface of modied electrodes. EIS monitors theresponse of the studied system to the application of a smallamplitude AC signal at different frequencies. Although thistechnique does not lead to the identication of the chemicalbonds or intermediates, vital information regarding the reac-tion rates occurring at the electrode/solution interface can beobtained. This is usually done using an ‘equivalent circuit’comprised of an assembly of electrical circuit elements thatmodel the physicoelectric characteristics of the electrode/solu-tion interface. In the present work, the experimentally-tted
RSC Adv., 2014, 4, 21267–21276 | 21271
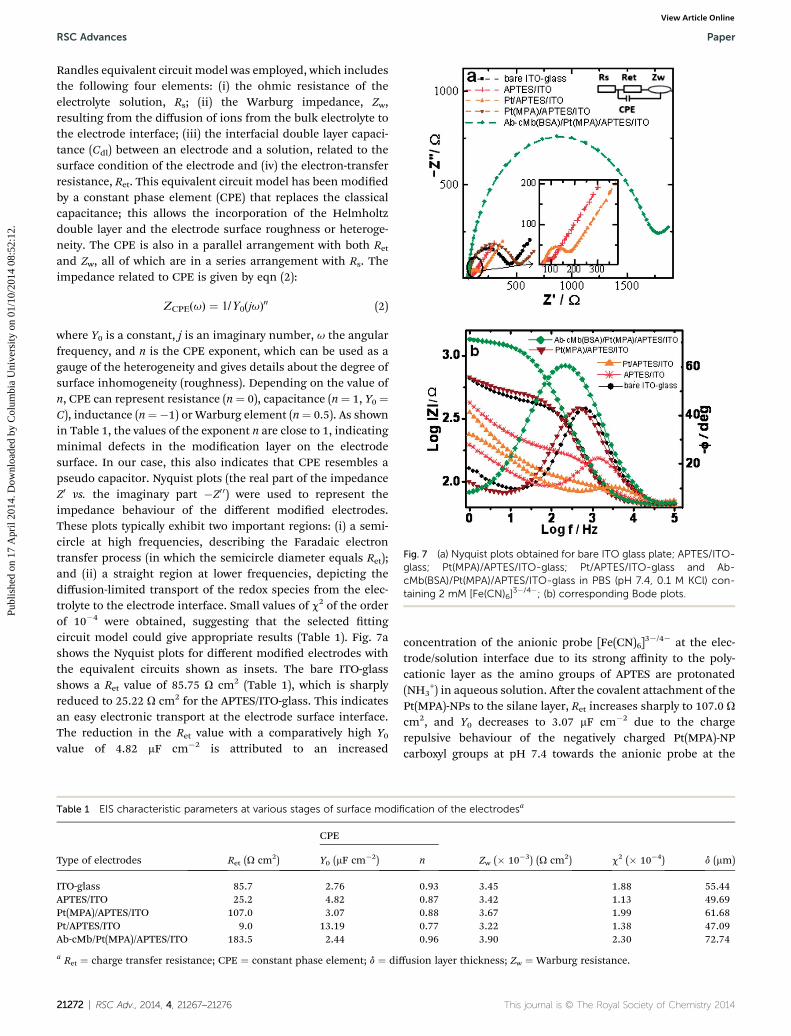
Fig. 7 (a) Nyquist plots obtained for bare ITO glass plate; APTES/ITO-glass; Pt(MPA)/APTES/ITO-glass; Pt/APTES/ITO-glass and Ab-cMb(BSA)/Pt(MPA)/APTES/ITO-glass in PBS (pH 7.4, 0.1 M KCl) con-taining 2 mM [Fe(CN)6]
3�/4�; (b) corresponding Bode plots.
RSC Advances Paper
Publ
ishe
d on
17
Apr
il 20
14. D
ownl
oade
d by
Col
umbi
a U
nive
rsity
on
01/1
0/20
14 0
8:52
:12.
View Article Online
Randles equivalent circuit model was employed, which includesthe following four elements: (i) the ohmic resistance of theelectrolyte solution, Rs; (ii) the Warburg impedance, Zw,resulting from the diffusion of ions from the bulk electrolyte tothe electrode interface; (iii) the interfacial double layer capaci-tance (Cdl) between an electrode and a solution, related to thesurface condition of the electrode and (iv) the electron-transferresistance, Ret. This equivalent circuit model has been modiedby a constant phase element (CPE) that replaces the classicalcapacitance; this allows the incorporation of the Helmholtzdouble layer and the electrode surface roughness or heteroge-neity. The CPE is also in a parallel arrangement with both Retand Zw, all of which are in a series arrangement with Rs. Theimpedance related to CPE is given by eqn (2):
ZCPE(u) ¼ 1/Y0(ju)n (2)
where Y0 is a constant, j is an imaginary number, u the angularfrequency, and n is the CPE exponent, which can be used as agauge of the heterogeneity and gives details about the degree ofsurface inhomogeneity (roughness). Depending on the value ofn, CPE can represent resistance (n ¼ 0), capacitance (n¼ 1, Y0 ¼C), inductance (n¼�1) or Warburg element (n¼ 0.5). As shownin Table 1, the values of the exponent n are close to 1, indicatingminimal defects in the modication layer on the electrodesurface. In our case, this also indicates that CPE resembles apseudo capacitor. Nyquist plots (the real part of the impedanceZ0 vs. the imaginary part �Z0 0) were used to represent theimpedance behaviour of the different modied electrodes.These plots typically exhibit two important regions: (i) a semi-circle at high frequencies, describing the Faradaic electrontransfer process (in which the semicircle diameter equals Ret);and (ii) a straight region at lower frequencies, depicting thediffusion-limited transport of the redox species from the elec-trolyte to the electrode interface. Small values of c2 of the orderof 10�4 were obtained, suggesting that the selected ttingcircuit model could give appropriate results (Table 1). Fig. 7ashows the Nyquist plots for different modied electrodes withthe equivalent circuits shown as insets. The bare ITO-glassshows a Ret value of 85.75 U cm2 (Table 1), which is sharplyreduced to 25.22 U cm2 for the APTES/ITO-glass. This indicatesan easy electronic transport at the electrode surface interface.The reduction in the Ret value with a comparatively high Y0value of 4.82 mF cm�2 is attributed to an increased
Table 1 EIS characteristic parameters at various stages of surface modi
Type of electrodes Ret (U cm2)
CPE
Y0 (mF cm�2)
ITO-glass 85.7 2.76APTES/ITO 25.2 4.82Pt(MPA)/APTES/ITO 107.0 3.07Pt/APTES/ITO 9.0 13.19Ab-cMb/Pt(MPA)/APTES/ITO 183.5 2.44
a Ret ¼ charge transfer resistance; CPE ¼ constant phase element; d ¼ diff
21272 | RSC Adv., 2014, 4, 21267–21276
concentration of the anionic probe [Fe(CN)6]3�/4� at the elec-
trode/solution interface due to its strong affinity to the poly-cationic layer as the amino groups of APTES are protonated(NH3
+) in aqueous solution. Aer the covalent attachment of thePt(MPA)-NPs to the silane layer, Ret increases sharply to 107.0 U
cm2, and Y0 decreases to 3.07 mF cm�2 due to the chargerepulsive behaviour of the negatively charged Pt(MPA)-NPcarboxyl groups at pH 7.4 towards the anionic probe at the
fication of the electrodesa
Zw (� 10�3) (U cm2) c2 (� 10�4) d (mm)n
0.93 3.45 1.88 55.440.87 3.42 1.13 49.690.88 3.67 1.99 61.680.77 3.22 1.38 47.090.96 3.90 2.30 72.74
usion layer thickness; Zw ¼ Warburg resistance.
This journal is © The Royal Society of Chemistry 2014
Paper RSC Advances
Publ
ishe
d on
17
Apr
il 20
14. D
ownl
oade
d by
Col
umbi
a U
nive
rsity
on
01/1
0/20
14 0
8:52
:12.
View Article Online
electrode/solution interface. To further establish the presenceof carboxyl groups at the modied electrode surface, an EISstudy was performed on a non-carboxyl-functionalized Pt NPs(without MPA capping) modied APTES/ITO-glass electrode. Ascan be seen from the corresponding Nyquist plot, the decreaseddiameter of the semicircle corresponding to a sharp decrease inRet to 9.0 U cm2 indicates the unconstrained transfer of elec-trons from the probe to the electrode surface. This extremelyhigh relative signal change (DRet ¼ �1088%) observed for thePt(MPA)-NP-modied electrode compared to the Pt-NP-modi-ed electrode constitutes convincing evidence for the highpopulation of free carboxyl groups on the surface of thePt(MPA)/APTES/ITO-glass electrode. Furthermore, covalentimmobilization of cardiac myoglobin protein antibody onPt(MPA)-NPs over the electrode surface and the subsequentblocking of the non-specic binding sites by BSA signicantlyincreases the Ret value to 183.5 U cm2 and reduces the Y0 to 2.44mF cm�2. This result demonstrates the insulating behaviour ofthe protein molecule, which inhibits both charge and masstransfer of the probe to the electrode surface.
A more clear description of the frequency-dependentbehaviour of different circuit elements of the tted Randlescircuit is provided by the Bode plots, as shown in Fig. 7b.Valuable information regarding certain kinetic phenomenaoccurring at the electrode/solution interface at different rangesof applied frequencies can be obtained from these plots. Theplots show that at the very low frequency region of <10 Hz, adiffusive nature is observed for the APTES/ITO-glass electrode.The diffusive nature is somewhat reduced on modication byPt(MPA) nanoparticles, and nally disappears on immobiliza-tion of Ab-cMb on the modied electrode. The dominance of Retbehaviour in the low frequency region for the bioelectrodereects its biocompatible nature, even at such low frequency.
Davies and Compton proposed a term known as the diffu-sion layer thickness d, which helps in categorizing the type ofdiffusion occurring at the modied electrodes. The value of dcan be obtained from the modied Einstein equation for theroot mean square displacement of diffusing particles,28 asshown in eqn (3) and listed in Table 1:
d ¼ (2DDE/n)1/2 (3)
where D is the diffusion coefficient of aqueous ferrocyanide (6.3� 10�6 cm2 s�1), DE is the potential width of the voltammogramand n is the scan rate (0.05 V s�1). The d value obtained for thebioelectrode shows a case 3 voltammetric response that corre-sponds to a spatially heterogeneous electrode. This phenom-enon is associated with an overlap of adjacent diffusion layersresulting from the small size of the inert part of the electrode.28
Fig. 8 CV of the bioelectrode as a function of scan rate in PBS (pH 7.4,0.1 M KCl) containing 2 mM [Fe(CN)6]
3�/4�. Inset: plot of peak currentvs. n1/2 (mV s�1)1/2.
3.4 Surface coverage and nature of the bioelectrode
The fractional coverage area (q) of the functionalized Pt-NPsover the silane SAM can be calculated from the impedancediagram using eqn (4):29
q ¼ 1 � Ret1/Ret2 (4)
This journal is © The Royal Society of Chemistry 2014
where Ret1 and Ret2 represent the surface-specic charge trans-fer resistances of SAM modied APTES/ITO-glass and Pt(MPA)-NP modied APTES/ITO-glass, respectively. The value of q wasfound to be 0.76, indicating a more than 76% surface coverageof the SAM-modied electrode by Pt(MPA)-NPs.
The type of electrochemical mechanism occurring at theelectrode/electrolyte interface of the Ab-cMb/Pt (MPA)/APTES/ITO-glass bioelectrode can be obtained from the relationshipbetween the peak current and the scan rate. Fig. 8 shows thecyclic voltammogram (CV) of the resulting bioelectrode in 2 mM[Fe(CN)6]
3�/4� at different scan rates ranging from 25–125 mVs�1. A plot of the anodic (Ipa) and cathodic peak currents (Ipc)versus the square root of the scan rates (n1/2) are shown as aninset in Fig. 8.
A linear relationship with good correlation between the peakcurrents and the square root of scan rate was obtained, sug-gesting a diffusion-controlled process at the bioelectrode/solu-tion interface. The linear regression line obtained for therelationship between the anodic peak current Ipa and n1/2 can beexpressed by eqn (5),
Ipa(n1/2) ¼ bn1/2 + c (5)
where the slope b ¼ 6.90 mA (mV s�1)�1/2 and the intercept c is22.4 mA. The correlation coefficient is 0.996.
3.5 Electrochemical impedance response of the bioelectrodetowards protein antigen Ag-cMb
The specic immunoreaction of Ab-cMb to its complimentarytarget Ag-cMb at the electrode surface results in the formationof an antibody–antigen complex. The formation of an immu-nocomplex results in the creation of a kinetic barrier, whichperturbs the interfacial electron transport at the bioelectrode/solution interface. As the Faradaic reaction of a redox couplebecomes increasingly hindered, the electron transfer resistance
RSC Adv., 2014, 4, 21267–21276 | 21273
Fig. 9 (a) Faradaic impedance spectra of the Ab-cMb(BSA)/Pt(MPA)/APTES/ITO-glass electrode before and after incubation with differentconcentrations of Ag-cMb in PBS (pH 7.4) with 0.1 M KCl solutioncontaining 2 mM [Fe(CN)6]
3�/4� and (b) corresponding Bode plots.
Fig. 10 Concentration dependent calibration curve of the bio-electrode. The error bars represent the standard deviation from threeseparate experiments.
RSC Advances Paper
Publ
ishe
d on
17
Apr
il 20
14. D
ownl
oade
d by
Col
umbi
a U
nive
rsity
on
01/1
0/20
14 0
8:52
:12.
View Article Online
increases, and the capacitance decreases accordingly. Thesample solution without a target protein, Ag-cMb, was taken asthe control sample, and the corresponding Ret value was takenas the control sample response. Fig. 9a shows the Nyquist plotsobtained aer the addition of successive aliquots of differentconcentrations of target protein antigen, and the corresponding
Table 2 EIS characteristic parameters upon immunoreactions with diffe
Concentration of Ag-cMb Ret (U cm2)
CPE
Y0 (mF cm�2)
Control 183.5 2.440.01 mg mL�1 288.3 2.260.05 mg mL�1 406.5 2.180.10 mg mL�1 494.3 2.150.50 mg mL�1 601.5 2.131.00 mg mL�1 647.8 2.08
21274 | RSC Adv., 2014, 4, 21267–21276
tting values of Ret are given in Table 2. The plot shows anoticeable increase in the diameter of the Nyquist circles withincreasing concentration of added Ag-cMb due to antigen–antibody interaction. A small but noticeable decrease in Y0 wasalso observed, indicating a decrease in the capacitive behaviourof the bioelectrode with immunoreaction.
The corresponding Bode frequency spectrum upon the aboveimmunoreactions occurring at the electrode surface is shown inFig. 9b. In the high frequency region of f > 4 kHz, the totalimpedance, log |Z|, remains unchanged with a phase angle (4)of �0�, indicating that electrolyte solution resistance, Rs, wasunchanged. In the intermediate frequency range from 4 kHz to40 Hz, an almost straight line curve was obtained with 55� < 4 <90�, indicating pseudo-capacitance behaviour of the bio-electrode. Negligible changes with the addition of target Ag-cMbin the sample solution were observed in this region, whichindicated that the proposed bioelectrode cannot function as acapacitive immunosensor. In the low frequency region (f < 40Hz), visible changes were observed in the impedance moduluslines upon immunoreactions with increasing concentrations ofadded target Ag-cMb. As this region is dominated by Ret, thisconrmed our choice of using changes in Ret as the mainsensing element.
The sensitivity of the as-prepared bioelectrode was obtainedby plotting (Fig. 10) the change in specic electron charge
rent concentrations of protein, Ag-cMb
Zw (� 10�3) (U cm2) c2 (� 10�4)n
0.960 3.90 2.300.970 2.20 2.100.974 1.37 2.010.976 1.02 2.740.974 0.92 2.670.979 0.82 3.12
This journal is © The Royal Society of Chemistry 2014
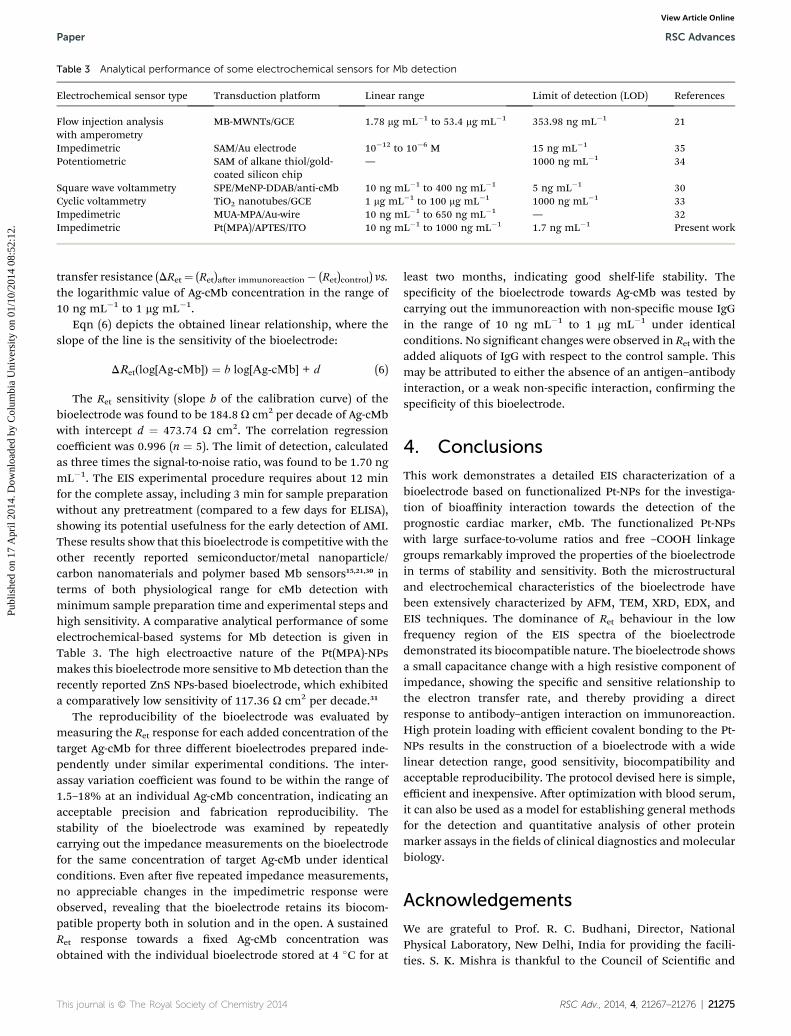
Table 3 Analytical performance of some electrochemical sensors for Mb detection
Electrochemical sensor type Transduction platform Linear range Limit of detection (LOD) References
Flow injection analysiswith amperometry
MB-MWNTs/GCE 1.78 mg mL�1 to 53.4 mg mL�1 353.98 ng mL�1 21
Impedimetric SAM/Au electrode 10�12 to 10�6 M 15 ng mL�1 35Potentiometric SAM of alkane thiol/gold-
coated silicon chip— 1000 ng mL�1 34
Square wave voltammetry SPE/MeNP-DDAB/anti-cMb 10 ng mL�1 to 400 ng mL�1 5 ng mL�1 30Cyclic voltammetry TiO2 nanotubes/GCE 1 mg mL�1 to 100 mg mL�1 1000 ng mL�1 33Impedimetric MUA-MPA/Au-wire 10 ng mL�1 to 650 ng mL�1 — 32Impedimetric Pt(MPA)/APTES/ITO 10 ng mL�1 to 1000 ng mL�1 1.7 ng mL�1 Present work
Paper RSC Advances
Publ
ishe
d on
17
Apr
il 20
14. D
ownl
oade
d by
Col
umbi
a U
nive
rsity
on
01/1
0/20
14 0
8:52
:12.
View Article Online
transfer resistance (DRet¼ (Ret)aer immunoreaction� (Ret)control) vs.the logarithmic value of Ag-cMb concentration in the range of10 ng mL�1 to 1 mg mL�1.
Eqn (6) depicts the obtained linear relationship, where theslope of the line is the sensitivity of the bioelectrode:
DRet(log[Ag-cMb]) ¼ b log[Ag-cMb] + d (6)
The Ret sensitivity (slope b of the calibration curve) of thebioelectrode was found to be 184.8 U cm2 per decade of Ag-cMbwith intercept d ¼ 473.74 U cm2. The correlation regressioncoefficient was 0.996 (n ¼ 5). The limit of detection, calculatedas three times the signal-to-noise ratio, was found to be 1.70 ngmL�1. The EIS experimental procedure requires about 12 minfor the complete assay, including 3 min for sample preparationwithout any pretreatment (compared to a few days for ELISA),showing its potential usefulness for the early detection of AMI.These results show that this bioelectrode is competitive with theother recently reported semiconductor/metal nanoparticle/carbon nanomaterials and polymer based Mb sensors15,21,30 interms of both physiological range for cMb detection withminimum sample preparation time and experimental steps andhigh sensitivity. A comparative analytical performance of someelectrochemical-based systems for Mb detection is given inTable 3. The high electroactive nature of the Pt(MPA)-NPsmakes this bioelectrodemore sensitive toMb detection than therecently reported ZnS NPs-based bioelectrode, which exhibiteda comparatively low sensitivity of 117.36 U cm2 per decade.31
The reproducibility of the bioelectrode was evaluated bymeasuring the Ret response for each added concentration of thetarget Ag-cMb for three different bioelectrodes prepared inde-pendently under similar experimental conditions. The inter-assay variation coefficient was found to be within the range of1.5–18% at an individual Ag-cMb concentration, indicating anacceptable precision and fabrication reproducibility. Thestability of the bioelectrode was examined by repeatedlycarrying out the impedance measurements on the bioelectrodefor the same concentration of target Ag-cMb under identicalconditions. Even aer ve repeated impedance measurements,no appreciable changes in the impedimetric response wereobserved, revealing that the bioelectrode retains its biocom-patible property both in solution and in the open. A sustainedRet response towards a xed Ag-cMb concentration wasobtained with the individual bioelectrode stored at 4 �C for at
This journal is © The Royal Society of Chemistry 2014
least two months, indicating good shelf-life stability. Thespecicity of the bioelectrode towards Ag-cMb was tested bycarrying out the immunoreaction with non-specic mouse IgGin the range of 10 ng mL�1 to 1 mg mL�1 under identicalconditions. No signicant changes were observed in Ret with theadded aliquots of IgG with respect to the control sample. Thismay be attributed to either the absence of an antigen–antibodyinteraction, or a weak non-specic interaction, conrming thespecicity of this bioelectrode.
4. Conclusions
This work demonstrates a detailed EIS characterization of abioelectrode based on functionalized Pt-NPs for the investiga-tion of bioaffinity interaction towards the detection of theprognostic cardiac marker, cMb. The functionalized Pt-NPswith large surface-to-volume ratios and free –COOH linkagegroups remarkably improved the properties of the bioelectrodein terms of stability and sensitivity. Both the microstructuraland electrochemical characteristics of the bioelectrode havebeen extensively characterized by AFM, TEM, XRD, EDX, andEIS techniques. The dominance of Ret behaviour in the lowfrequency region of the EIS spectra of the bioelectrodedemonstrated its biocompatible nature. The bioelectrode showsa small capacitance change with a high resistive component ofimpedance, showing the specic and sensitive relationship tothe electron transfer rate, and thereby providing a directresponse to antibody–antigen interaction on immunoreaction.High protein loading with efficient covalent bonding to the Pt-NPs results in the construction of a bioelectrode with a widelinear detection range, good sensitivity, biocompatibility andacceptable reproducibility. The protocol devised here is simple,efficient and inexpensive. Aer optimization with blood serum,it can also be used as a model for establishing general methodsfor the detection and quantitative analysis of other proteinmarker assays in the elds of clinical diagnostics andmolecularbiology.
Acknowledgements
We are grateful to Prof. R. C. Budhani, Director, NationalPhysical Laboratory, New Delhi, India for providing the facili-ties. S. K. Mishra is thankful to the Council of Scientic and
RSC Adv., 2014, 4, 21267–21276 | 21275
RSC Advances Paper
Publ
ishe
d on
17
Apr
il 20
14. D
ownl
oade
d by
Col
umbi
a U
nive
rsity
on
01/1
0/20
14 0
8:52
:12.
View Article Online
Industrial Research, India for providing a senior researchfellowship (SRF).
References
1 G. Hodes, Adv. Mater., 2007, 19, 639.2 M. Adaris, L. Marzo, J. Pons, D. A. Blake and A. Merkoçi,Biosens. Bioelectron., 2013, 47, 190.
3 W. Wu, M. Wu, Z. Sun, G. Li, Y. Ma, X. Liu, X. Wang andX. Chen, J. Alloys Compd., 2013, 579, 117.
4 Y. Chen, Y. Tang, S. Luo, C. Liu and Y. Li, J. Alloys Compd.,2013, 578, 242.
5 X. Xu, X. Liu, Y. Li and Y. Ying, Biosens. Bioelectron., 2013, 47,361.
6 Q. Kang, L. Yang and Q. Cai, Bioelectrochemistry, 2008, 74, 62.7 J. Wang, D. F. Thomas and A. Chen, Anal. Chem., 2008, 80,997.
8 S. J. Kwon and A. J. Bard, J. Am. Chem. Soc., 2012, 134, 10777.9 T. Kong, R. Su, B. Zhang, Q. Zhang and G. Cheng, Biosens.Bioelectron., 2012, 34, 267.
10 A. Qureshi, Y. Gurbuz and J. H. Niazi, Sens. Actuators, B,2012, 171, 62.
11 B. McDonnel, S. Hearty, P. Leonard and R. O'Kennedy, Clin.Biochem., 2009, 42, 549.
12 N. S. K. Gunda and S. K. Mitra, Biomicrouidics, 2010, 4,014105.
13 J. F. Masson, L. Obando, S. Beaudoin and K. Booksh,Talanta, 2004, 62, 865.
14 F. Darain, P. Yager, K. L. Gan and S. C. Tjin, Biosens.Bioelectron., 2009, 24, 1744.
15 E. G. Matveeva, Z. Gryczynski and J. R. Lakowicz, J. Immunol.Methods, 2005, 302, 26.
16 L. Bonel, J. C. Vidal, P. Duato and J. R. Castillo, Anal.Methods, 2010, 2, 335.
17 B. Jeong, R. Akter, O. H. Han, C. K. Rhee and M. A. Rahman,Anal. Chem., 2013, 85, 1784.
21276 | RSC Adv., 2014, 4, 21267–21276
18 J. Li, L. T. Xiao, G. M. Zeng, G. H. Huang, G. L. Shen andR. Q. Yu, J. Agric. Food Chem., 2005, 53, 1348.
19 S. K. Arya, T. S. Pui, C. C. Wong, S. Kumar andA. R. A. Rahman, Langmuir, 2013, 29, 6770.
20 Q. Wei, Y. Zhao, B. Du, D. Wu, H. Li and M. Yang, FoodChem., 2012, 134, 1601.
21 S. Pakapongpan, R. Palangsuntikul and W. Surareungchai,Electrochim. Acta, 2011, 56, 683.
22 A. Venkatanarayanan, T. E. Keyes and R. J. Forster, Anal.Chem., 2013, 85, 2216.
23 S. Shrikrishnan, K. Sankaran and V. Lakshminarayanan,J. Phys. Chem. C, 2012, 116, 16030.
24 Y. Teow and S. Valiyaveettil, Nanoscale, 2010, 2, 2607.25 E. T. Vandenberg, L. Bertilsson, B. Liedberg, K. Uvdal,
R. Erlandsson, H. Elwing and I. Lundstrom, J. ColloidInterface Sci., 1991, 147, 103.
26 A. Barth, Biochim. Biophys. Acta, 2007, 1767, 1073.27 L. Yang and Y. Li, Biosens. Bioelectron., 2005, 20, 1407.28 S. A. Mamuru and K. I. Ozoemena, Electroanalysis, 2010, 22,
985.29 V. Ganesh, S. K. Pal, S. Kumar and V. Lakshminarayanan,
J. Colloid Interface Sci., 2006, 296, 195.30 E. V. Suprun, A. L. Shilovskaya, A. V. Lisitsa, T. V. Bulko,
V. V. Shumyantseva and A. I. Archakov, Electroanalysis,2011, 23, 1051.
31 S. K. Mishra, D. Kumar, A. M. Biradar and Rajesh,Bioelectrochemistry, 2012, 88, 118.
32 Rajesh, V. Sharma, V. K. Tanwar, S. K. Mishra andA. M. Biradar, Thin Solid Films, 2010, 519, 1167.
33 S. S. Mandal, K. K. Narayan and A. J. Bhattacharyya, J. Mater.Chem. B, 2013, 1, 3051.
34 Y. Wang, Y. Zhou, J. Sokolov, B. Rigas, K. Levon andM. Rafailovich, Biosens. Bioelectron., 2008, 24, 162.
35 M. Billah, H. C. W. Hays and P. A. Millner, Microchim. Acta,2008, 160, 447.
This journal is © The Royal Society of Chemistry 2014