bio-derived three-dimensional hierarchical carbon …10.1038...support information figure s1 shows...
TRANSCRIPT
Bio-derived three-dimensional hierarchical carbon-graphene-TiO2 as electrode
for supercapacitors
Lili Jiang1, Zhifeng Ren*,2 Shuo Chen2, Qinyong Zhang1, Xiong Lu3, Hongping
Zhang4, and Guojiang Wan3
1.Key Laboratory of Fluid and Power Machinery of Ministry of Education, Center for
Advanced Materials and Energy, School of Materials Science and Engineering,
Xihua University, Chengdu 610039, China
2.Department of Physics and TcSUH, University of Houston, 3201 Cullen Blvd
Houston, Texas 77204, United states.
3. Key Lab of Advanced Technologies of Materials, Ministry of Education, School of
Materials Science and Engineering, Southwest Jiaotong University, Chengdu 610031,
Sichuan China
4.School of Materials Science and Engineering, Southwest University of Science and
Technology, Mianyang 621010, Sichuan China
* Corresponding author, E-mail address: [email protected]
Support information
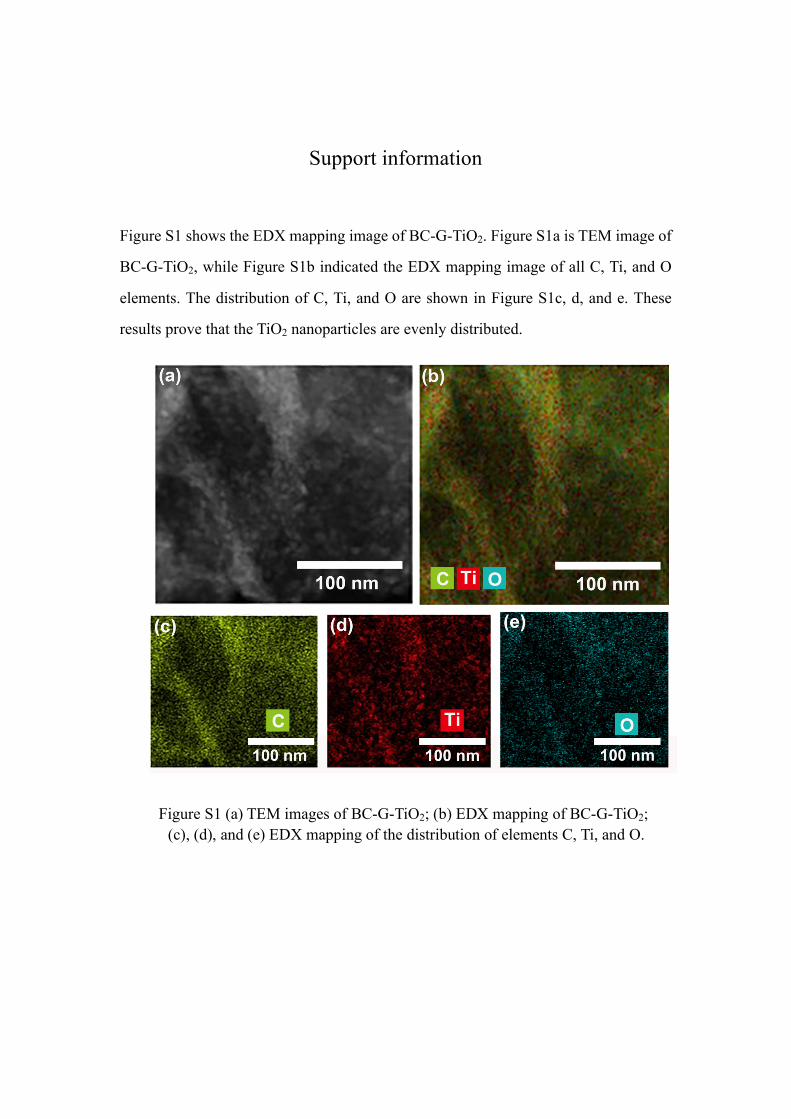
Figure S1 shows the EDX mapping image of BC-G-TiO2. Figure S1a is TEM image of
BC-G-TiO2, while Figure S1b indicated the EDX mapping image of all C, Ti, and O
elements. The distribution of C, Ti, and O are shown in Figure S1c, d, and e. These
results prove that the TiO2 nanoparticles are evenly distributed.
Figure S1 (a) TEM images of BC-G-TiO2; (b) EDX mapping of BC-G-TiO2; (c), (d), and (e) EDX mapping of the distribution of elements C, Ti, and O.