binf 702 spring 2014 practice problems practice problems binf 702 practice problems
TRANSCRIPT

BINF 702 Spring 2014 Practice Problems
Practice Problems
BINF 702 Practice Problems

Problem # 1
BINF 702 Spring 2014 Practice Problems

BINF 702 Spring 2014 Practice Problems
Problem # 1 Flow Chart Analysis Only one variable of interest? Yes One sample problem? No (Go to 1) Two-sample problem? Yes

BINF 702 Spring 2014 Practice Problems
Problem # 1 Flowchart Analysis Underlying distribution normal or can the
central-limit theorem be assumed to hold?? No Underlying distribution is
binomial? Yes Are samples independent? Yes

Problem # 1 Flowchart Analysis Are all expected values greater than or
equal to 5? Yes (go to 6) 2 x 2 contingency table? Yes (go to A) Use two-sample test for binomial
proportion, or 2 x 2 contingency table methods if no confounding is present, or the Mantel-Haenszel test if confounding is present.BINF 702 Spring 2014
Practice Problems

Problem #1 Solution
BINF 702 Spring 2014 Practice Problems

BINF 702 Spring 2014 Practice Problems
Problem # 1 Solution in R> prop.test(xx)
2-sample test for equality of proportions with continuity correction
data: xx X-squared = 5.6489, df = 1, p-value = 0.01747alternative hypothesis: two.sided 95 percent confidence interval: -0.38358985 -0.08699838 sample estimates: prop 1 prop 2 0.1000000 0.3352941

Problem # 2
BINF 702 Spring 2014 Practice Problems

BINF 702 Spring 2014 Practice Problems
Problem # 2 Flow Chart Analysis Only one variable of interest? Yes One sample problem? No (Go to 1) Two-sample problem? Yes

BINF 702 Spring 2014 Practice Problems
Problem # 2 Flowchart Analysis Underlying distribution normal or can the central-limit
theorem be assumed to hold??
No Underlying distribution is
binomial? Yes Are samples independent? Yes

Problem # 2 Flowchart Analysis Are all expected values greater than or
equal to 5? Yes (go to 6) 2 x 2 contingency table? No (go to A) 2 x k contingency table?
Yes (go to B)
BINF 702 Spring 2014 Practice Problems

BINF 702 Spring 2014 Practice Problems
Problem # 2 Flowchart Analysis Interested in trend over k binomial
proportions? Yes
Use chi-square test for trend, if n confounding is present, or the mantel Extension test if confounding is present.

Problem # 2 Solution
BINF 702 Spring 2014 Practice Problems

BINF 702 Spring 2014 Practice Problems
Problem #2 in R> library(stats)> prop.trend.test(x = c(3,7,8,12), n = c(60,50,50,40))
Chi-squared Test for Trend in Proportions
data: c(3, 7, 8, 12) out of c(60, 50, 50, 40) ,
using scores: 1 2 3 4 X-squared = 10.9341, df = 1, p-value = 0.0009441

BINF 702 Spring 2014 Practice Problems
Problem # 3

BINF 702 Spring 2014 Practice Problems
Problem # 3 Flow Chart Analysis Only one variable of interest? Yes One sample problem? No (Go to 1) Two-sample problem? Yes
BINF 702 Spring 2014 Practice Problems
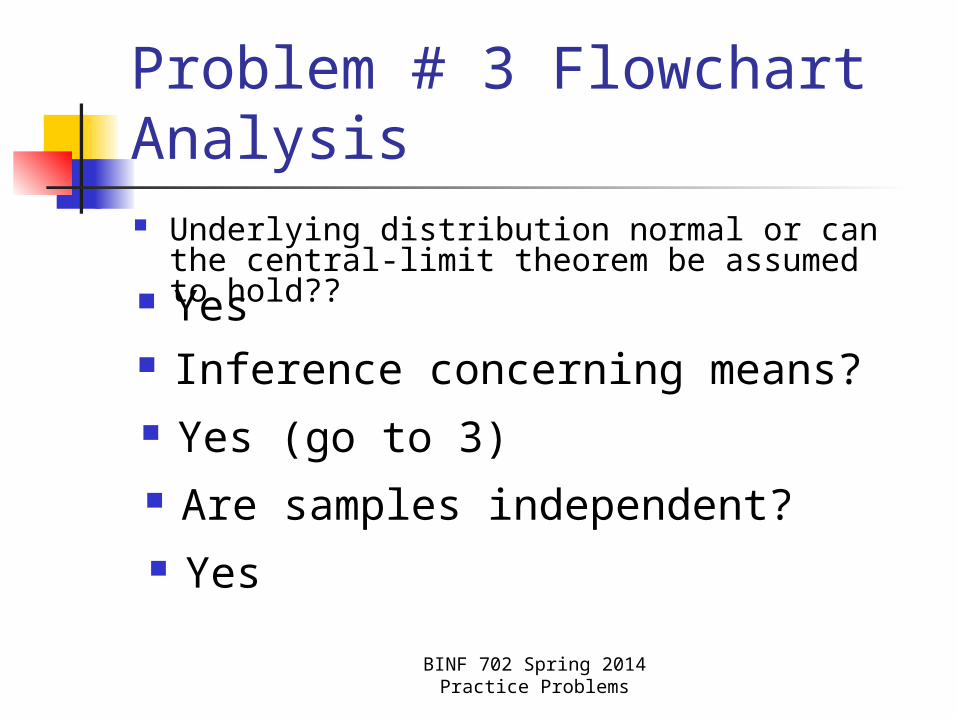
Problem # 3 Flowchart Analysis Underlying distribution normal or can the
central-limit theorem be assumed to hold?? Yes Inference concerning means? Yes (go to 3) Are samples independent? Yes
BINF 702 Spring 2014 Practice Problems
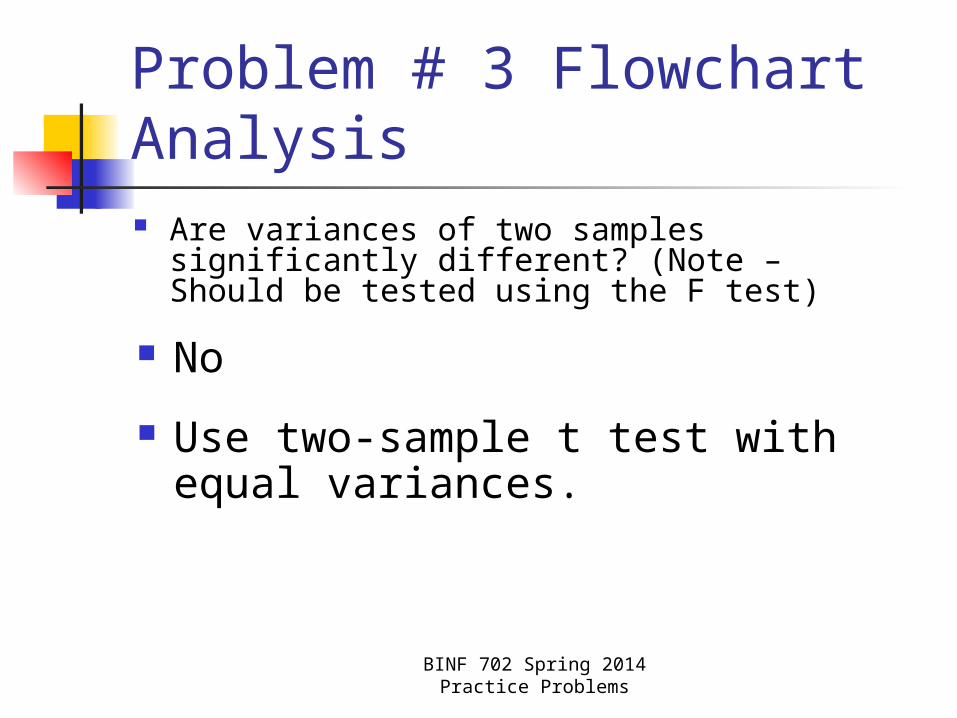
Problem # 3 Flowchart Analysis Are variances of two samples significantly
different? (Note – Should be tested using the F test)
No
Use two-sample t test with equal variances.

BINF 702 Spring 2014 Practice Problems
Problem # 3 Solution

BINF 702 Spring 2014 Practice Problems
Problem # 3 Solution in R
> pt(q=8.94,df = 2198, lower.tail=FALSE)[1] 4.026324e-19

BINF 702 Spring 2014 Practice Problems
Problem # 4
BINF 702 Spring 2014 Practice Problems
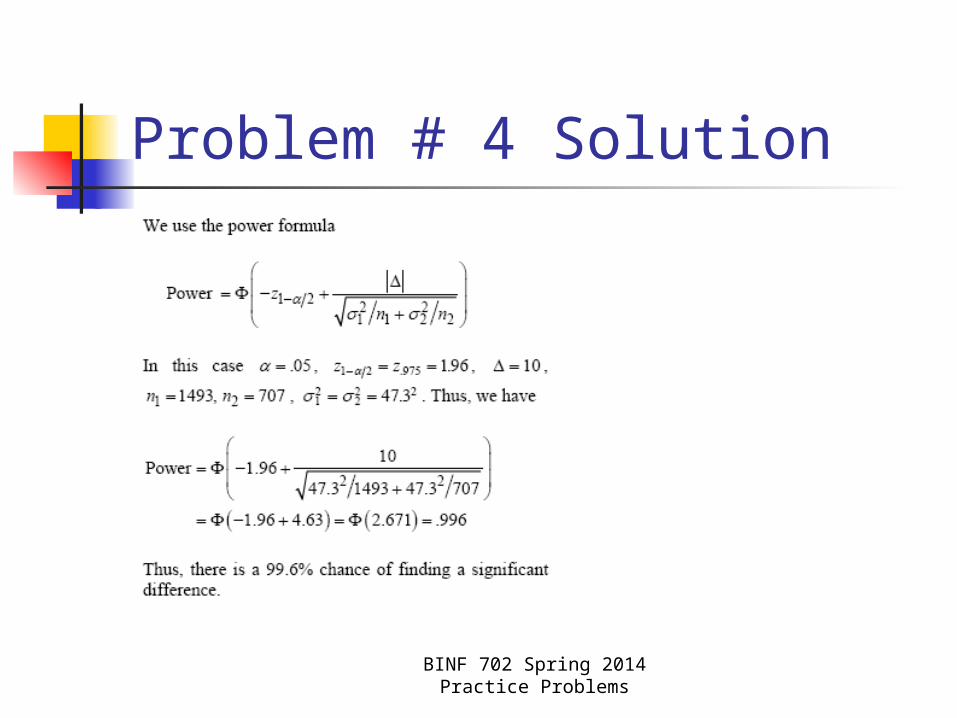
Problem # 4 Solution

BINF 702 Spring 2014 Practice Problems
Problem # 5a

BINF 702 Spring 2014 Practice Problems
Problem # 5b

BINF 702 Spring 2014 Practice Problems
Problem # 5c

BINF 702 Spring 2014 Practice Problems
Problem #5c in R
> 2 * pt(q=2.73, df = 19, lower.tail=FALSE)
[1] 0.01329876

BINF 702 Spring 2014 Practice Problems
Problem #6

BINF 702 Spring 2014 Practice Problems
Problem #6a
> 2 * pf(q=2.08, df1 = 24, df2 = 40,lower.tail=FALSE)[1] 0.03939543

BINF 702 Spring 2014 Practice Problems
Problem #6b

BINF 702 Spring 2014 Practice Problems
Problem # 6 Flow Chart Analysis Only one variable of interest? Yes One sample problem? No (Go to 1) Two-sample problem? Yes

BINF 702 Spring 2014 Practice Problems
Problem # 6 Flowchart Analysis Underlying distribution normal or can the
central-limit theorem be assumed to hold?? Yes Inference concerning means? Yes (go to 3) Are samples independent? Yes

BINF 702 Spring 2014 Practice Problems
Problem # 6 Flowchart Analysis Are variances of two samples significantly
different? (Note – Should be tested using the F test)
Yes
Use two-sample t test with unequal variances.

Problem #6c
Perform the test and report a p-value.> 2 * pt(q=5.34, df = 99,lower.tail=FALSE)[1] 5.929004e-07
BINF 702 Spring 2014 Practice Problems

Problem # 7
BINF 702 Spring 2014 Practice Problems

BINF 702 Spring 2014 Practice Problems
Problem # 7a

BINF 702 Spring 2014 Practice Problems
Problem # 7b

BINF 702 Spring 2014 Practice Problems
Problem # 7c
Which hypothesis test is appropriate here?

BINF 702 Spring 2014 Practice Problems
Problem # 7 Flow Chart Analysis Only one variable of interest? Yes One sample problem? No (Go to 1) Two-sample problem? Yes

Problem # 7 Flowchart Analysis Underlying distribution normal or can the
central-limit theorem be assumed to hold?? Yes Inference concerning means? Yes (go to 3) Are samples independent? No Use paired t test.
BINF 702 Spring 2014 Practice Problems

BINF 702 Spring 2014 Practice Problems
Problem # 7d
Conduct the hypothesis test and report a p-value.
BINF 702 Spring 2014 Practice Problems
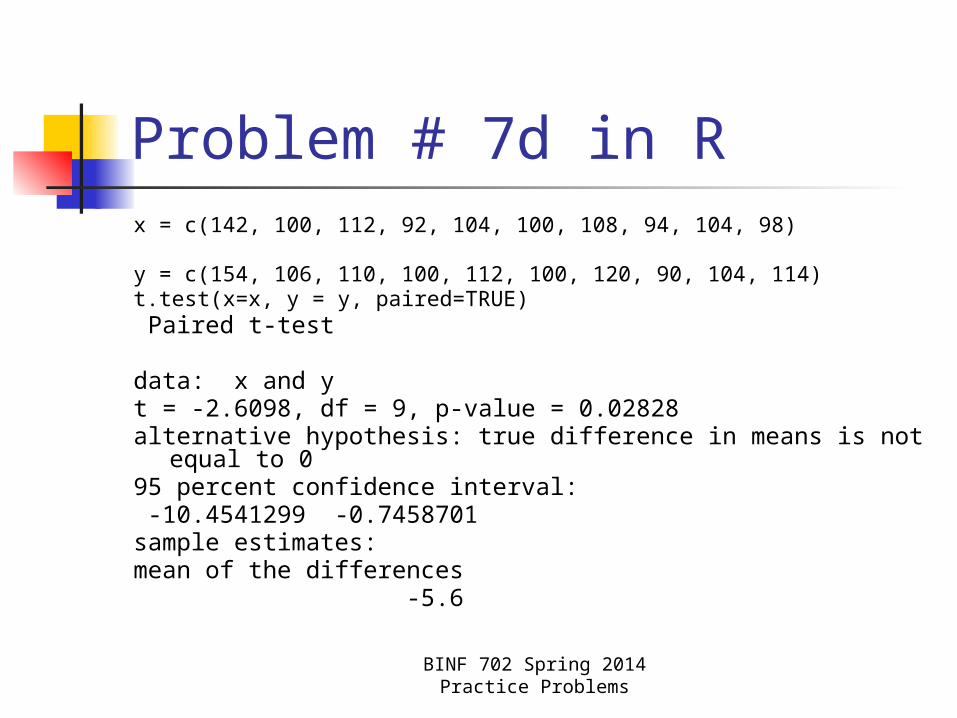
Problem # 7d in Rx = c(142, 100, 112, 92, 104, 100, 108, 94, 104, 98)
y = c(154, 106, 110, 100, 112, 100, 120, 90, 104, 114)t.test(x=x, y = y, paired=TRUE) Paired t-test
data: x and y t = -2.6098, df = 9, p-value = 0.02828alternative hypothesis: true difference in means is not
equal to 0 95 percent confidence interval: -10.4541299 -0.7458701 sample estimates:mean of the differences -5.6