binary: an optical freezing array for assessing temperature and
TRANSCRIPT

Atmos. Meas. Tech., 8, 689–703, 2015
www.atmos-meas-tech.net/8/689/2015/
doi:10.5194/amt-8-689-2015
© Author(s) 2015. CC Attribution 3.0 License.
BINARY: an optical freezing array for assessing temperature and
time dependence of heterogeneous ice nucleation
C. Budke and T. Koop
Faculty of Chemistry, Bielefeld University, Universitätsstraße 25, 33615 Bielefeld, Germany
Correspondence to: T. Koop ([email protected])
Received: 23 August 2014 – Published in Atmos. Meas. Tech. Discuss.: 10 September 2014
Revised: 23 December 2014 – Accepted: 20 January 2015 – Published: 10 February 2015
Abstract. A new optical freezing array for the study of
heterogeneous ice nucleation in microliter-sized droplets
is introduced, tested and applied to the study of immer-
sion freezing in aqueous Snomax® suspensions. In the
Bielefeld Ice Nucleation ARraY (BINARY) ice nucleation
can be studied simultaneously in 36 droplets at temper-
atures down to −40 ◦C (233 K) and at cooling rates be-
tween 0.1 and 10 K min−1. The droplets are separated from
each other in individual compartments, thus preventing
a Wegener–Bergeron–Findeisen type water vapor transfer
between droplets as well as avoiding the seeding of neigh-
boring droplets by formation and surface growth of frost ha-
los. Analysis of freezing and melting occurs via an auto-
mated real-time image analysis of the optical brightness of
each individual droplet. As an application ice nucleation in
water droplets containing Snomax® at concentrations from
1 ngmL−1 to 1 mg mL−1 was investigated. Using different
cooling rates, a small time dependence of ice nucleation in-
duced by two different classes of ice nucleators (INs) con-
tained in Snomax® was detected and the corresponding het-
erogeneous ice nucleation rate coefficient was quantified.
The observed time dependence is smaller than those of other
types of INs reported in the literature, suggesting that the BI-
NARY setup is suitable for quantifying time dependence for
most other INs of atmospheric interest, making it a useful
tool for future investigations.
1 Introduction
Atmospheric ice nucleation is one of the key steps in high-
altitude cloud formation and also for triggering precipitation
in mixed-phase clouds (Pruppacher and Klett, 1997; Cantrell
and Heymsfield, 2005; Lamb and Verlinde, 2011). Ice parti-
cles can be formed via homogeneous ice nucleation in liquid
aerosol and water droplets (Koop et al., 2000; Murray et al.,
2010), or via heterogeneous ice nucleation triggered by pre-
existing ice nucleators (Pruppacher and Klett, 1997; Cantrell
and Heymsfield, 2005; DeMott et al., 2010; Murray et al.,
2012; Hoose and Möhler, 2012; Cziczo and Froyd, 2014).
Both homogeneous as well as heterogeneous ice nucleation
processes do occur, and various approaches of parameteriz-
ing them in atmospheric models have been described. One
strategy for improving the description of ice nucleation in
cloud models is the elucidation of the responsible mecha-
nisms and their physical dependencies in laboratory experi-
ments. For example, such laboratory data can then serve as
a basis for physically consistent parameterizations for hetero-
geneous ice nucleation that can be incorporated into process
models (Hoose and Möhler, 2012). In mixed-phase clouds
heterogeneous immersion mode freezing is thought to be
a relevant process (Pruppacher and Klett, 1997; Lohmann
and Diehl, 2006). But time dependence of immersion freez-
ing is often poorly represented or not included at all in cloud
models, in order to reduce model complexity (Ervens and
Feingold, 2012). It is well accepted that homogeneous ice
nucleation is a time-dependent stochastic process which can
be described by the formation of an ice embryo with critical
size, whose probability of forming increases with time (Prup-
pacher and Klett, 1997; Murray et al., 2010; Riechers et al.,
2013). There is, however, an ongoing debate on whether het-
erogeneous ice nucleation in the immersion mode is only
Published by Copernicus Publications on behalf of the European Geosciences Union.

690 C. Budke and T. Koop: Optical freezing array BINARY
temperature dependent (i.e., a singular process) or both tem-
perature and time dependent (i.e., a stochastic process) (Vali,
2014). In a stochastic process, the probability of the occur-
rence of a nucleation event increases exponentially with time
at a rate that depends on temperature (e.g., Bigg, 1953; Von-
negut and Baldwin, 1984; Pruppacher and Klett, 1997; Vali,
1994, 2014). In contrast, in a singular process no such time
dependence of ice nucleation exists, because the probabil-
ity of ice nucleation switches instantaneously from 0 to 1 at
a deterministic temperature that depends on the IN (e.g., Vali
and Stansbury, 1966). Moreover, another so-called modified
singular process has been proposed that describes the over-
all process as temperature dependent with a small stochastic
variation around the deterministic temperature (Vali, 2008).
Several studies have employed experimental data and
model calculations to show very little time dependence, thus
justifying the use of the time-independent singular approach
(Kulkarni et al., 2012; Welti et al., 2012; Wright and Pet-
ters, 2013; Ervens and Feingold, 2013; Vali, 2014). But it
has been also suggested that any existing small time depen-
dence should not be neglected if a more accurate descrip-
tion of heterogeneous nucleation is to be achieved in models
(Barahona, 2012; Knopf and Alpert, 2013; Vali and Snider,
2014). One drawback from which many experimental tech-
niques suffer is the fact that cooling rates or the rates by
which the supersaturation changes can be varied over a small
range only, thus limiting their sensitivity to distinguish be-
tween the different approaches (see, e.g., the discussion in
Niedermeier et al., 2010; Lüönd et al., 2010).
Several instrumental techniques are available for the de-
termination of temperature and time dependence of hetero-
geneous ice nucleation (see, e.g., Murray et al., 2012; Hoose
and Möhler, 2012). One of the commonly used methods is
based on an early description of a drop-freezer apparatus
developed by Vali and Stansbury (1966) and Vali (1971a).
In the original setup, microliter-sized droplets are pipetted
onto a substrate that is placed on a thermoelectric cooler. The
droplets are separated by about 1 cm from each other, but no
other precautions are taken to avoid a Wegener–Bergeron–
Findeisen type process, i.e., the growth of frozen droplets
at the expense of remaining supercooled liquid ones by wa-
ter vapor transfer. In addition, the latent heat release during
freezing may cause the formation of frost halos that subse-
quently may grow and expand around the frozen droplets
by Wegener–Bergeron–Findeisen type water vapor transfer
(Jung et al., 2012; Welz, 2013). This frost halo growth bears
the risk of seeding neighboring droplets and thus biasing
the recorded ice nucleation temperatures (Jung et al., 2012;
Welz, 2013). To circumvent these problems and to minimize
evaporation, droplets are often covered with an oil film (Bigg,
1953; Hoffer, 1961; Murray et al., 2011; Pummer et al., 2012;
Wright and Petters, 2013). But the use of such emulsion-type
samples may lead to alternative problems because some ice
nucleators (INs) such as pollen or fungal spores may have
an affinity to the hydrophobic phase. When a part of the dis-
persed IN material is lost to the oil phase, an overestimation
of IN concentration may result, leading to an underestima-
tion of IN activity. Another uncertainty arises if surfactants
are used for the stabilization of emulsions, because surfac-
tants may also influence the investigated INs at the water–oil
interface (Pummer et al., 2012), particularly when the INs
reside predominantly at the droplet surface.
A very recent instrument development of Stopelli et al.
(2014) uses sealable tubes to prevent evaporation and cross-
contamination of the investigated suspensions. The device
bears an additional advantage over previous tube-based
ice nucleation devices (e.g., Barlow and Haymet, 1995;
Heneghan et al., 2002) in that it allows simultaneous investi-
gation of multiple samples rather than focusing on numerous
freeze–thaw repeats of a limited number of samples.
Another improvement is the nature of the substrate on
which the droplets are positioned. In the original drop
freezer, water droplets were pipetted onto an oil-covered
sheet of aluminum foil (Vali and Stansbury, 1966). More
recent techniques make use of advanced chemical ap-
proaches to hydrophobize glass or quartz substrates by a self-
assembled monolayer (e.g., using a halogenated silane),
which does not affect the mechanical or thermal properties of
the substrate (Koop et al., 1998; Salcedo et al., 2000; Knopf
and Lopez, 2009; Murray et al., 2010; Iannone et al., 2011).
Some of the devices introduced in the past for the analysis
of heterogeneous ice nucleation employ rather large sample
volumes (tens to hundreds of microliters) in order to be able
to further analyze the ice-nucleating substances, for long-
term IN sample storage and an associated investigation of
ageing effects, or to ease the detection of freezing (Barlow
and Haymet, 1995; Attard et al., 2012; Stopelli et al., 2014).
Others have focused on rather small (often emulsified) sam-
ples (picoliters to nanoliters) in order to minimize or exclude
the unwanted effects of ice-nucleating impurities contained
in the water for preparing the suspensions under scrutiny
(Koop and Zobrist, 2009; Murray et al., 2010, 2011; Pum-
mer et al., 2012; Wright and Petters, 2013; Atkinson et al.,
2013). Herein we use intermediate volume samples of 1 µL
which are easy to prepare and are not subject to concentra-
tion uncertainties owing to water evaporation during sample
preparation and storage. For such volumes heterogeneous ice
nucleation from impurities contained in the “pure” water usu-
ally occurs at temperatures below −20 ◦C (253 K). There-
fore, such samples are applicable for ice nucleation studies
over the important temperature range of mixed-phase clouds
between −20 ◦C (253 K) and 0 ◦C (273 K). At lower temper-
atures, corrections for the effects of IN impurities contained
in “pure” water must be employed.
In the following, we introduce a new droplet freezing as-
say, in which the separation of the investigated water droplets
is accomplished by a polymer spacer. This spacer encloses
each of a total of 36 microliter-sized droplets individually
without direct contact to any of them. Moreover, we have
developed an automated system for analyzing the freezing
Atmos. Meas. Tech., 8, 689–703, 2015 www.atmos-meas-tech.net/8/689/2015/

C. Budke and T. Koop: Optical freezing array BINARY 691
temperature of each drop. Finally, the device allows for an
accurate determination of ice nucleation temperatures over
a large range of cooling rates from 0.1 to 10 Kmin−1. We
chose Snomax®, a commercially available ice inducer used
in snow cannons, as a test substance for the investigation of
heterogeneous ice nucleation and an assessment of its tem-
perature and time dependence.
2 Theoretical background for freezing analysis
2.1 Singular (deterministic) data analysis
The temperature dependence of ice nucleation induced
by singular ice nucleators can be described in terms of
nm(T ), the cumulative number of ice nucleators per mass
of Snomax® as a function of temperature. nm(T ) can be
obtained from droplet freezing array data by analyzing the
frozen fraction fice from the cumulative number of frozen
droplets nice(T ) and the total number of droplets ntot of a par-
ticular Snomax® concentration (Vali, 1971b):
fice(T )=nice(T )
ntot
= 1− e−K(T )V . (1)
From Eq. (1) the cumulative ice nucleator concentration
K(T ) can be deduced, which is typically referred to as the ac-
tive site number density per unit droplet volume V . Because
in the experiments described below we know the mass con-
centration Cm of Snomax® and the volume V of the droplets,
K(T ) can be converted into the active site density per unit
mass nm(T ):
nm(T )=K(T )
Cm
= ns(T ) · S′= nn(T ) ·N
′ . (2)
Likewise the active site density per unit surface area ns(T )
or per particle number nn(T ) can be deduced if the specific
surface area S′, i.e., the surface area per sample mass, or
the specific particle number N ′, i.e., the number of particles
per sample mass, respectively, are known from independent
analysis (Fletcher, 1969; Connolly et al., 2009; Murray et al.,
2012; Niemand et al., 2012).
The value of the specific surface area S′ of Snomax® can
be derived as follows. For the specific particle number of
cells in Snomax® we used the value of N ′ = 1.4×10⁹ mg−1
determined by Wex et al. (2015) using multiple instruments
including the BINARY setup presented here. Furthermore,
Wex et al. (2015) investigated the size of the particles/cells
suspended in freshly prepared Snomax® suspensions by dy-
namic light scattering, resulting in a mean equivalent hy-
drodynamic radius of rh = 0.5 µm. Accordingly, we assumed
that each cell has a surface area equivalent to that of a sphere
with a radius of 0.5 µm, i.e., a surface area of 3.14 µm2 per
cell. These numbers result in a value of S′ = 44 cm2 mg−1,
which was used here.
2.2 Time-dependent (stochastic) data analysis
A time dependence of ice nucleation induced by ice nucle-
ators can be investigated by performing freezing experiments
at different cooling rates in order to determine the nucle-
ation rate R(T ). For such experiments, temperature is di-
vided into equally spaced intervals 1T = T1− T2 = 0.1 K
and all data are binned into these temperature intervals with
interval temperature T = T1− 0.5 ·1T . When droplets are
cooled at a constant cooling rate β, the nucleation rate R(T )
at the interval temperature T can be derived from the number
of droplets nucleated in that interval 1nice(T ) (Vali, 1994;
Koop et al., 1997; Zobrist et al., 2007):
R(T )=1nice(T )
ttot(T )(3)
=1nice(T ) ·β
1T ·(nliq(T1)−1nice(T )
)+
1nice(T )∑j=1
(T1− Tnuc,j )
, (4)
where j = 1, . . .,1nice(T ) are the nucleation events in in-
dividual droplets occurring at temperature Tnuc,j within the
interval 1T . With the simplification Tnuc,j ≈ T1− 0.5 ·1T ,
which is a good approximation for small temperature inter-
vals, the sum in the denominator in Eq. (4) can be approxi-
mated by 0.5 ·1T ·1nice(T ) and, hence,
R(T )≈1nice(T ) ·β
1T ·(nliq(T1)− 0.5 ·1nice(T )
) . (5)
Data of R(T ) can be normalized to the total surface area of
ice nucleator per droplet A, which for the case of a single-
component (sc) ice nucleator is equivalent to the nucleation
rate coefficient jhet(T ,α),
R(T )
A=
R(T )
S′CmV
sc= jhet(T ,α) , (6)
with the parameters S′,Cm and V as defined above. Using the
framework of classical nucleation theory (CNT) jhet(T ,α)
can be described as (Pruppacher and Klett, 1997)
jhet(T ,α)=kT
hexp
(−1Fdiff(T )
kT
)· nexp
(−1G(T )ϕ(α)
kT
). (7)
Here k is the Boltzmann constant, h is the Planck constant, T
is absolute temperature and n is the number density of water
molecules at the IN–water interface. 1Fdiff(T ) and 1G(T )
are the diffusion activation energy of a water molecule cross-
ing the water–ice embryo interface and the Gibbs free en-
ergy for critical ice embryo formation without the presence
of a heterogeneous IN, respectively. In the presence of an
www.atmos-meas-tech.net/8/689/2015/ Atmos. Meas. Tech., 8, 689–703, 2015

692 C. Budke and T. Koop: Optical freezing array BINARY
ice nucleus1G(T ) is modified by the compatibility function
ϕ(α):
ϕ(α)=1
4(2+ cos α)(1− cos α)2 , (8)
where the parameter α represents a hypothetical effective
contact angle between the forming ice embryo and the IN
in water, which can vary between 0 and 180◦. An effec-
tive contact angle of α = 0◦ implies a perfect IN leading to
ϕ = 0 and a negligible Gibbs free energy term (equivalent
to seeding by a mother crystal). An effective contact angle
of α = 180◦ leads to ϕ = 1, and the Gibbs free energy term
is not reduced, implying a maximally poor IN; thus, nucle-
ation occurs at the rate of homogeneous ice nucleation. For
our analysis of jhet(T ,α) from experimental data we use α
as the only free parameter when fitting Eq. (7) to the data.
Temperature-dependent parameterizations for all other quan-
tities were obtained from Zobrist et al. (2007).
2.3 Quantification of time dependence
In a very recent study Herbert et al. (2014) proposed the fol-
lowing equation for the description of cooling rate depen-
dence of a single IN (applied to Tf,50 values here):
Tf,50(β2)− Tf,50(β1)=1Tf,50 =1
λ· ln
(β1
β2
). (9)
Tf,50(β2) and Tf,50(β1) are the median freezing temperatures
at cooling rates β2 and β1, respectively, and λ is a constant.
Herbert et al. (2014) point out that, for a single-component
IN following stochastic (i.e., non-singular) behavior, λ is the
temperature dependence of the heterogeneous ice nucleation
rate coefficient of the IN: λ=−dln(jhet)/dT . We note that
an equation similar to Eq. (9) was originally introduced by
Vali and Stansbury (1966) for the mean freezing tempera-
ture, i.e., T f(β2)− T f(β1)= ξ · ln(β1
β2
). Ignoring any differ-
ence between T f and Tf,50 (which occurs, e.g., for a Tf dis-
tribution that is constant with changing cooling rate) implies
that the constant ξ is related to λ via ξ = λ−1. For the sin-
gular case ξsi = 0 and λsi =∞ by definition, and a small
ξ /large λ value indicates a behavior that is close to singular;
i.e., nucleation shows a less-pronounced stochastic time de-
pendence. Moreover, one can define the temperature depen-
dence of the normalized freezing rate ω =−dln(R/A)/dT
and note that ω = λ for a single-component IN and ω < λ
for a multi-component IN (Vali, 2014; Herbert et al., 2014).
3 Experimental setup
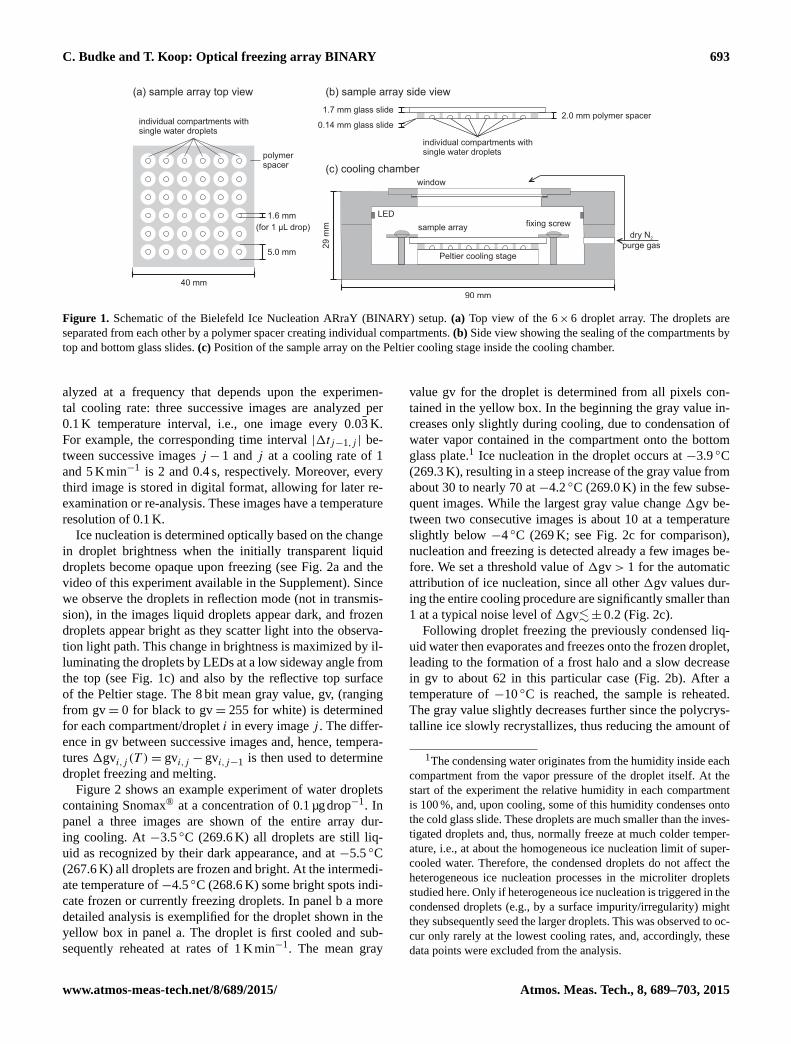
The optical freezing apparatus introduced here, which we
term BINARY (Bielefeld Ice Nucleation ARraY), consists
of a 6× 6 array of individual microliter-sized droplets po-
sitioned on a thin hydrophobic glass slide (Fig. 1a). The
droplets are separated from each other by a soft poly-
dimethylsiloxane (PDMS) spacer, and the resulting compart-
ments are sealed at the top with another glass slide (Fig. 1b).
The PDMS spacer is fabricated from a 10 : 1 mixture of
base polymer to curing agent (Sylgard® 184, Dow Corning)
poured onto a mold made from aluminum that was custom-
designed to represent the compartment array.
The droplet separation into individual compartments pre-
vents a Wegener–Bergeron–Findeisen process, in which
frozen droplets grow at the expense of unfrozen supercooled
liquid droplets due to the vapor pressure difference between
ice and supercooled liquid water (Murphy and Koop, 2005).
This process poses a particular problem to droplet arrays op-
erated at small cooling rates or employing stepwise cooling
and has been noted frequently to influence and corrupt ice
nucleation measurements (Welz, 2013; Stopelli et al., 2014;
O’Sullivan et al., 2014). In addition, the probability of het-
erogeneous ice nucleation at the lower glass surface is min-
imized by the hydrophobicity of the glass (see discussion
above). Water droplets positioned on the silanized glass show
contact angles of about 90–100◦ (Remmers, 2012). Hence,
the shape of the droplets investigated below is well approxi-
mated by a hemisphere.
Snomax® suspensions were prepared by mixing a pre-
determined mass of dry material with the appropriate vol-
ume of freshly double-distilled water. Individual droplets
of 1 µL volume were sampled from the suspension with a
micropipette (volume inaccuracy ≤ 3 %) and positioned in-
dividually on the glass surface in each compartment. We
note that the use of smaller (e.g., ∼ 0.5 µL) and larger (e.g.,
∼ 5 µL) droplets is also possible, but only 1 µL droplets were
used in the freezing experiments described below.
The sample array is placed onto a Peltier cooling stage
(Fig. 1c), which is part of a commercially available cooling
stage system (Linkam LTS120). Good thermal contact be-
tween the Peltier stage and the lower glass surface of the
sample array is achieved by pressing the upper glass slide
towards the stage with four fixing screws, one at each cor-
ner. When the Peltier stage is connected to a heat sink bath
at 5 ◦C (278 K), the sample array can be cooled to −40 ◦C
(233 K) at cooling rates between 0.1 and 10 Kmin−1. The
cover of the cooling stage was modified to consist of a larger
opening sealed with a thin glass window such that the result-
ing larger field of view of 40mm× 40mm allowed for the
simultaneous observation of all droplets of the sample array.
In addition, small arrays of cold-light white LEDs were fixed
to the top of the cooling chamber to yield the proper contrast
for identifying the phase state of the droplets; see below. Fi-
nally, purging of dry N2 gas into the chamber as well as onto
the top window prevents dew and frost formation from labo-
ratory humidity during cooling.
A LabVIEW™ virtual instrument is used to control the
temperature of the Peltier stage and to analyze in real time
the digital images obtained by a CCD camera (QImaging
MicroPublisher 5.0 RTV). The images are recorded and an-
Atmos. Meas. Tech., 8, 689–703, 2015 www.atmos-meas-tech.net/8/689/2015/
C. Budke and T. Koop: Optical freezing array BINARY 693
2.0 mm polymer spacer
(a) sample array top view
5.0 mm
1.6 mm
40 mm
polymerspacer
individual compartments withsingle water droplets
(b) sample array side view
(c) cooling chamber
1.7 mm glass slide
0.14 mm glass slide
individual compartments withsingle water droplets
LED
dry N
purge gas2
Peltier cooling stage
window
fixing screw
90 mm
29
mm(for 1 µL drop) sample array
Figure 1. Schematic of the Bielefeld Ice Nucleation ARraY (BINARY) setup. (a) Top view of the 6× 6 droplet array. The droplets are
separated from each other by a polymer spacer creating individual compartments. (b) Side view showing the sealing of the compartments by
top and bottom glass slides. (c) Position of the sample array on the Peltier cooling stage inside the cooling chamber.
alyzed at a frequency that depends upon the experimen-
tal cooling rate: three successive images are analyzed per
0.1 K temperature interval, i.e., one image every 0.03̄ K.
For example, the corresponding time interval |1tj−1,j | be-
tween successive images j − 1 and j at a cooling rate of 1
and 5 Kmin−1 is 2 and 0.4 s, respectively. Moreover, every
third image is stored in digital format, allowing for later re-
examination or re-analysis. These images have a temperature
resolution of 0.1 K.
Ice nucleation is determined optically based on the change
in droplet brightness when the initially transparent liquid
droplets become opaque upon freezing (see Fig. 2a and the
video of this experiment available in the Supplement). Since
we observe the droplets in reflection mode (not in transmis-
sion), in the images liquid droplets appear dark, and frozen
droplets appear bright as they scatter light into the observa-
tion light path. This change in brightness is maximized by il-
luminating the droplets by LEDs at a low sideway angle from
the top (see Fig. 1c) and also by the reflective top surface
of the Peltier stage. The 8 bit mean gray value, gv, (ranging
from gv= 0 for black to gv= 255 for white) is determined
for each compartment/droplet i in every image j . The differ-
ence in gv between successive images and, hence, tempera-
tures 1gvi,j (T )= gvi,j − gvi,j−1 is then used to determine
droplet freezing and melting.
Figure 2 shows an example experiment of water droplets
containing Snomax® at a concentration of 0.1 µgdrop−1. In
panel a three images are shown of the entire array dur-
ing cooling. At −3.5 ◦C (269.6 K) all droplets are still liq-
uid as recognized by their dark appearance, and at −5.5 ◦C
(267.6 K) all droplets are frozen and bright. At the intermedi-
ate temperature of−4.5 ◦C (268.6 K) some bright spots indi-
cate frozen or currently freezing droplets. In panel b a more
detailed analysis is exemplified for the droplet shown in the
yellow box in panel a. The droplet is first cooled and sub-
sequently reheated at rates of 1 Kmin−1. The mean gray
value gv for the droplet is determined from all pixels con-
tained in the yellow box. In the beginning the gray value in-
creases only slightly during cooling, due to condensation of
water vapor contained in the compartment onto the bottom
glass plate.1 Ice nucleation in the droplet occurs at −3.9 ◦C
(269.3 K), resulting in a steep increase of the gray value from
about 30 to nearly 70 at −4.2 ◦C (269.0 K) in the few subse-
quent images. While the largest gray value change 1gv be-
tween two consecutive images is about 10 at a temperature
slightly below −4 ◦C (269 K; see Fig. 2c for comparison),
nucleation and freezing is detected already a few images be-
fore. We set a threshold value of 1gv> 1 for the automatic
attribution of ice nucleation, since all other 1gv values dur-
ing the entire cooling procedure are significantly smaller than
1 at a typical noise level of 1gv.± 0.2 (Fig. 2c).
Following droplet freezing the previously condensed liq-
uid water then evaporates and freezes onto the frozen droplet,
leading to the formation of a frost halo and a slow decrease
in gv to about 62 in this particular case (Fig. 2b). After a
temperature of −10 ◦C is reached, the sample is reheated.
The gray value slightly decreases further since the polycrys-
talline ice slowly recrystallizes, thus reducing the amount of
1The condensing water originates from the humidity inside each
compartment from the vapor pressure of the droplet itself. At the
start of the experiment the relative humidity in each compartment
is 100 %, and, upon cooling, some of this humidity condenses onto
the cold glass slide. These droplets are much smaller than the inves-
tigated droplets and, thus, normally freeze at much colder temper-
ature, i.e., at about the homogeneous ice nucleation limit of super-
cooled water. Therefore, the condensed droplets do not affect the
heterogeneous ice nucleation processes in the microliter droplets
studied here. Only if heterogeneous ice nucleation is triggered in the
condensed droplets (e.g., by a surface impurity/irregularity) might
they subsequently seed the larger droplets. This was observed to oc-
cur only rarely at the lowest cooling rates, and, accordingly, these
data points were excluded from the analysis.
www.atmos-meas-tech.net/8/689/2015/ Atmos. Meas. Tech., 8, 689–703, 2015

694 C. Budke and T. Koop: Optical freezing array BINARY
Cooling
Heating
freezing threshold
melting threshold
0.0 °C-3.9 °C
-4.1 °C
-4.2 °C
-2.0 °C 2.0 °C
-6.0 °C
2.0 °C
0.0 °C
Cooling
Heating
-4.0 °C
-8.0 °C
1.0 °C
-2.0 °C
(a)Cooling
(b)
(c)
-3.5 °C (269.6 K)-4.5 °C (268.6 K)-5.5 °C (267.6 K)
Figure 2. Example experiment with Snomax®-containing droplets
(0.1 µgdrop−1) describing the automatic detection of nucleation
events by the change in brightness during freezing. A video of this
experiment is available in the Supplement. (a) Image series of the
6× 6 droplet array during cooling. (b) Measured gray value of the
compartment/droplet indicated by the yellow box in panel (a) dur-
ing cooling (red) and heating (green). Freezing and melting start
at −3.9 ◦C (269.3 K) and 0.0 ◦C (273.2 K), respectively. (c) Plot of
the change in gray value between successive images showing peaks
at the phase transition points. Threshold values of ±1 for the au-
tomatic attribution of freezing and melting are indicated by dashed
lines.
ice facets capable of scattering the LED light. Finally, gv in-
creases just before reaching the melting point due to forma-
tion of liquid water films in the grain boundaries of the frozen
droplet; thus LED light is reflected slightly more efficiently.
The onset of melting at 0 ◦C (273 K), most easily observed
at the halo, finally results in a decrease of gv and hence a lo-
cal minimum in 1gv; see Fig. 2c. We set a threshold value
of 1gv<−1 for automatic attribution of melting. We note
that at a heating rate of 1 Kmin−1 the melting of the entire
droplet is complete at about 2 ◦C (275 K).
The analysis described in Fig. 2 is performed automati-
cally for all droplets of a particular array. The nucleation tem-
peratures thus obtained for each droplet undergo a correction
according to a temperature calibration that is outlined in the
next section.
4 Temperature calibration
The experiment discussed in the previous section was per-
formed at a constant cooling rate of 1 Kmin−1. Investiga-
tion of time dependence of heterogeneous ice nucleation in
such constant cooling rate experiments requires performing
several experiments at different cooling rates (see, e.g., Her-
bert et al., 2014). Therefore, we conducted a comprehensive
calibration exercise that accounts for variable cooling rates
in BINARY. The calibration was performed using five ref-
erence phase transitions in the temperature range of interest
from−37 to 0 ◦C (236 to 273 K; see Table A1 and Fig. A1 in
the Appendix) and for heating rates from 0.1 to 10 Kmin−1.
The rate calibration was conducted in the heating mode be-
cause superheating of a crystal above its melting point is usu-
ally negligible. In contrast, supercooling of a liquid below
the melting point often occurs readily, and even minor su-
percooling would bias a calibration in cooling mode (Sarge
et al., 2000; Della Gatta et al., 2006). For the solid–liquid
phase transition of tridecane the rate dependence of cool-
ing vs. heating was investigated. Although crystal nucleation
temperatures of tridecane droplets in the size range from 0.1
to 1.5 µL scattered significantly more – by about 0.8 K be-
tween the 25th to 75th percentiles – than those of the melting
temperatures during calibration – about 0.2 K – the observed
dependence of nucleation temperatures with increasing cool-
ing rate was similar to that of the melting temperatures with
increasing heating rate, which were ∼ 0.02 and ∼ 0.05 min,
respectively.
For the calibration procedure the reference substances
were sprayed onto the hydrophobic glass slide, resulting in
droplets ∼ 0.6 mm in size (estimated droplet volume about
0.05 µL). The onset of melting and the subsequent, almost-
immediate full melting in such small droplets results in a
steeper 1gv, which is easier to detect and, hence, more ac-
curate than in larger droplets, which often melt entirely only
with measurable delay; see Fig. 2. The threshold value for
automatic detection of the phase transitions was adjusted
for each calibration substance, in particular for the solid–
solid phase transitions which involve smaller 1gv values.
The phase transition temperatures obtained for the reference
substances were analyzed by separating the absolute temper-
ature offset of the sample array at a heating rate of 0 (i.e.,
at static conditions) from its heating rate dependence due to
Atmos. Meas. Tech., 8, 689–703, 2015 www.atmos-meas-tech.net/8/689/2015/

C. Budke and T. Koop: Optical freezing array BINARY 695
(a)
(b)
(c)
25%50%75%
Figure 3. Temperature calibration. (a) Difference between the ex-
perimentally determined phase transition temperatures of water,
tridecane and undecane droplets and the corresponding literature
values as a function of heating rate. Linear fits to the data are indi-
cated by the solid lines. (b) Intercepts (left, red) and slopes (right,
green) of the linear fits shown in (a) above. The experimentally de-
termined data (symbols) are fitted by a linear function (intercepts,
red line) and by a second-order polynomial (slopes, green line).
(c) Residual difference between the calibrated phase transition tem-
peratures and the literature values after calibration.
thermal lag, as recommended for the calibration of thermal
devices (Sarge et al., 2000; Della Gatta et al., 2006; Riech-
ers et al., 2013). Figure 3a shows the difference between the
experimentally observed temperatures Texp and the literature
values Tlit as a function of heating rate. Points represent the
median values, and error bars indicate the 25th and 75th per-
centiles of the data from different compartments and mul-
tiple cooling–heating cycles. Each individual reference sub-
stance’s data set was fitted linearly. The absolute temperature
deviation at a heating rate of 0 corresponds to the intercept of
such a fit and the heating rate dependence to the slope. The
fitting parameters obtained are shown in Fig. 3b as a function
of Texp (intercept: red diamonds and left axis; slope: green tri-
angles and right axis). These intercepts are well represented
by a linear fit (red line) and the slopes by a second-order
polynomial (green line). These fits were then applied to the
raw data. The remaining temperature uncertainty after this
calibration step, which is the absolute difference between the
calibrated temperatures Tcal and the literature values Tlit, is
shown in Fig. 3c. The squares represent the median values
and the error bars the 25th and 75th percentiles for each cal-
ibration substance. We note that |Tcal− Tlit| is smaller than
0.3 K for 97 % of all individual data points, indicating the
quality of the calibration procedure.
5 Results
We put the new BINARY setup to the test using Snomax® as
a well-studied ice-nucleating substance (Maki et al., 1974;
Vali et al., 1976; Ward and DeMott, 1989; Turner et al.,
1990; Wood et al., 2002; Möhler et al., 2008; Hartmann
et al., 2013; Stopelli et al., 2014). Snomax® is a commer-
cial product containing freeze-dried nonviable bacterial cells
from Pseudomonas syringae, which are known to be active
INs at high temperature. First, experiments with droplets of
1 µL volume were investigated at a cooling rate of 1 Kmin−1.
Snomax® concentrations were varied over 6 orders of mag-
nitude between 1 ngmL−1 and 1 mgmL−1, corresponding to
a total mass between 1 pg per droplet and 1 µg per droplet, re-
spectively. Usually, 108 droplet freezing events (from 3×36
droplets) were analyzed at each concentration.
The results of these experiments are shown in Fig. 4 by
plotting nm(T ), the cumulative number of ice nucleators per
µg of Snomax®, as a function of temperature. Two particu-
larly strong increases in nm(T ) are observed, one at about
−3.5 ◦C (269.6 K) ±0.5 K and one at −8.5 ◦C (264.6 K)
±0.5 K, indicating the presence of two distinct classes of
ice nucleators with different activation temperatures. The two
plateaus at temperatures just below each increase of nm(T )
in Fig. 4 arise when no INs active at these temperatures are
present in the investigated suspensions. The nm(T ) values
of the plateaus differ by about 3 orders of magnitude, from
which we infer that the two classes of Snomax® INs occur at
a number ratio of about 1 to 1000 in our samples. The active
site densities per cell nn(T ) shown in Fig. 4 on the right axis
were calculated using the specific particle number of cells in
Snomax® determined by Wex et al. (2015); see Sect. 2.1.
It is already known that different types of INs or ag-
gregates of INs are responsible for ice nucleation induced
by Pseudomonas and other ice-nucleating bacteria in dif-
ferent temperature ranges (Yankofsky et al., 1981; Turner
et al., 1990; Hartmann et al., 2013). For example, Turner
et al. (1990) identified three classes of INs on the ba-
sis of the temperature at which they triggered ice nucle-
www.atmos-meas-tech.net/8/689/2015/ Atmos. Meas. Tech., 8, 689–703, 2015

696 C. Budke and T. Koop: Optical freezing array BINARY
Figure 4. Experimentally determined active site density per unit
mass of Snomax® nm(T ) vs. temperature. Symbol colors indicate
data from droplets with different Snomax® concentrations; symbol
size indicates the number of nucleating droplets per temperature in-
terval. The temperature range for different classes of INs according
to the definition by Turner et al. (1990) are also indicated by the
colored bars.
ation at various conditions: class A at high temperature
(&−4.5 ◦C' 269 K), class B in the intermediate range (ap-
prox. −4.5 to −6.5 ◦C' 269 to 267 K) and class C at lower
temperature (.−6.5 ◦C' 267 K); see the colored bars at the
top of Fig. 4. According to this definition the data shown
in Fig. 4 suggest that our sample contained class A and
class C ice-nucleating proteins or protein complexes. In con-
trast, Turner et al. (1990) identified Snomax® to contain INs
of class A and class B, but none of class C. This difference
to our study may result from varied growth or storage condi-
tions of different Snomax® samples and is in line with their
proposal that class C INs can develop into class B (and sub-
sequently into class A) INs by accumulation of larger ice-
nucleating protein complexes in the cell membranes. In fact,
our sample may also contain class B INs, but the low number
of freezing events in the corresponding temperature range of
−4.5 to−6.5 ◦C (269 to 267 K) indicates that there are fewer
INs of class B than there are of class A, the latter of which
trigger ice nucleation already at higher temperature. As men-
tioned above, in our sample the more active but less abun-
dant class A ice nucleators induce freezing at about −3.5 ◦C
(269.6 K)±0.5 K, and they dominate the freezing of droplets
at a Snomax® concentration of 1× 10⁻¹ µgdrop−1. The less
active but more abundant INs of class C nucleate ice at about
−8.5 ◦C (264.6 K) ±0.5 K. At a Snomax® concentration of
1× 10⁻⁵ µgdrop−1 almost all droplets contain such INs of
class C, but practically none of class A anymore.
The analysis shown in Fig. 4 is based on the singular ap-
proach which assumes that the results are independent of
time and, hence, cooling rate. With the new BINARY setup
we were able to challenge this assumption by performing ex-
periments at different cooling rates in the range from 0.1 to
1·10 µg dropClass A
-1 -1
1·10 µg dropClass C
-5 -1
Figure 5. Freezing temperatures of water droplets containing
Snomax® at concentrations of 1× 10⁻⁵ µgdrop−1 (red) and
1× 10⁻¹ µgdrop−1 (blue) as a function of experimental cooling
rate. The number of nucleation events at individual temperatures
is indicated by the size of the open symbols. Solid symbols indicate
the median freezing temperature (Tf,50), with error bars represent-
ing the 25th and 75th percentiles. Solid lines are linear fits to the
solid symbols; see text.
10 Kmin−1. In particular the cooling rate dependence of the
two IN classes discussed above was investigated. Figure 5
shows a decrease in the median ice nucleation temperature
Tf,50 with increasing cooling rate for both classes of INs.
The Tf,50 values are represented by filled symbols with er-
ror bars indicating the 25th and 75th percentiles. At the indi-
cated concentrations the difference between the Tf,50 values
at 10 and at 0.1 Kmin−1 is about 0.6 K for both classes of INs
(0.55 K for class A and 0.64 K for class C). These values are
small but larger than our temperature uncertainty (±0.3 K on
a 2σ level). While this degree of time dependence is proba-
bly not of atmospheric importance, we analyze and quantify
it in more detail below for two reasons: first, it is interest-
ing from a physical chemistry viewpoint regarding the fun-
damental process of heterogeneous ice nucleation; second,
such an analysis may help in characterizing the ability and
limitations of the BINARY device for measurements of time
dependence of INs more generally.
The above analysis suggests a very small time dependence
of Snomax®-induced ice nucleation. Nevertheless, we may
expect to see deviations in the active site density obtained
at different cooling rates. Figure 6a shows nm(T ) at the
two investigated Snomax® concentrations at different cool-
ing rates. Clearly, there is a systematic trend towards lower
nm(T ) with larger cooling rate; i.e., the individual nm(T )
curves are shifted to lower temperature as the cooling rate
increases. This analysis supports the interpretation of a time
dependence of ice nucleation induced by the two class A
and class C Snomax® INs. Therefore, we analyze the data
shown in Fig. 6a with the stochastic approach by determin-
ing the nucleation rate R(T ); see Eq. (6). Figure 6b shows
R(T ) for both classes of INs. Now the data points obtained
from the different cooling rates converge onto a single line,
with data obtained at larger cooling rate (yellow) represent-
Atmos. Meas. Tech., 8, 689–703, 2015 www.atmos-meas-tech.net/8/689/2015/

C. Budke and T. Koop: Optical freezing array BINARY 697
ing larger values of R than those obtained at a lower cooling
rate (blue). These data of R(T ) can be normalized to the to-
tal surface area per droplet A, using the specific surface area
S′ = 44 cm2 mg−1 of Snomax® from Wex et al. (2015); see
Sect. 2.1. For a single-component ice nucleator, R(T )/A is
equivalent to nucleation rate coefficient jhet(T ); see Eq. (6).
The results of the analysis according to Eq. (6) are the data
points plotted in Fig. 6c, which shows that R(T )/A increases
by about 3 orders of magnitude for a reduction in tempera-
ture of about 2 K for class C (circles) and by about 4 orders
of magnitude for a reduction of about 1 K for class A (trian-
gles).
The lines in Fig. 6c are fits to these data using the frame-
work of classical nucleation theory (CNT); i.e., they repre-
sent jhet(T ,α) fits in which the effective contact angle α was
either constant or allowed to have a linear temperature de-
pendence. Figure 6c shows that the measured data are not
well described by CNT when using constant effective con-
tact angle values of α = 23.9◦ and α = 35.3◦ for class A and
C, respectively (gray lines). Allowing for a linear tempera-
ture dependence of α, a much better fit of CNT to the data
results (red and blue lines). The corresponding linear equa-
tions for the temperature-dependent effective contact angles
are α(T )= 613.5−2.188 · T and α(T )= 286.5−0.9495 · T
for class A and C, respectively. (Note that the input temper-
atures are in units of kelvin.) In order to visualize the effect
of the steep increase of jhet(T ) with decreasing temperature
found for both IN classes, the parameterizations were also
used to calculate the nucleation probability Pi0 as a function
of temperature and observation time (see Fig. A2 in the Ap-
pendix).
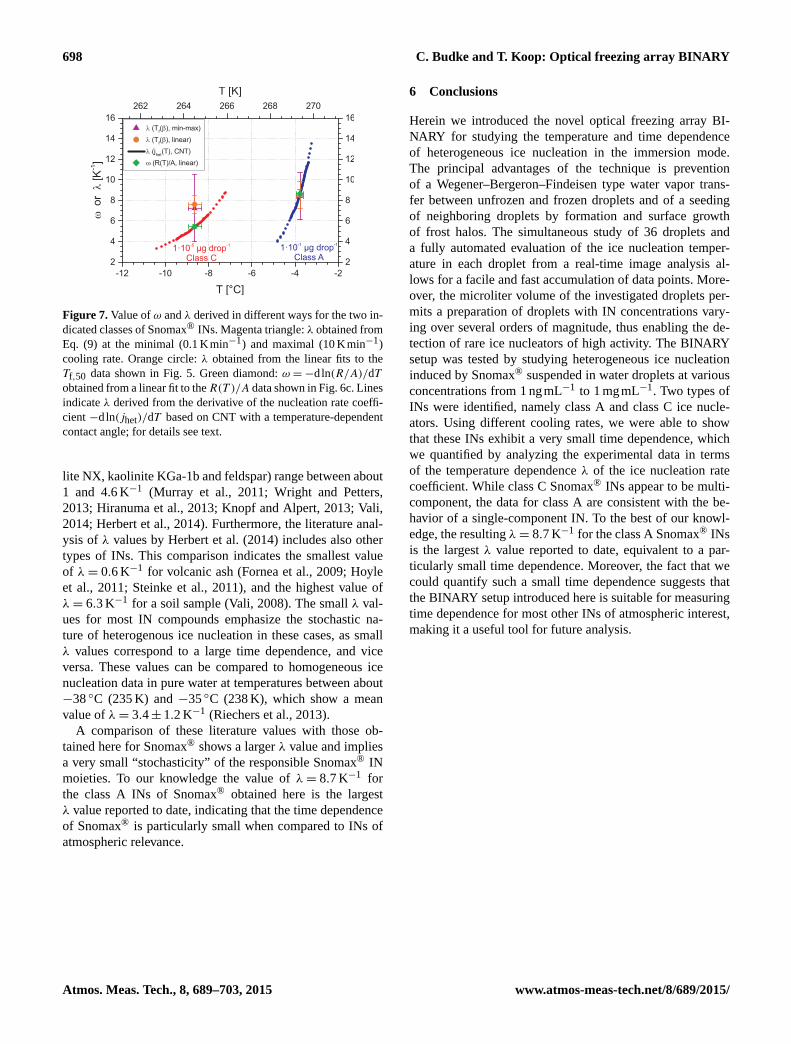
It is interesting to compare the degree of time dependence
of Snomax® with that of INs of atmospheric relevance. For
this purpose we follow the approach outlined in Herbert et al.
(2014) to quantify the time dependence of Snomax® INs; see
Sect. 2.3. Using Eq. (9) on the Tf,50 data shown in Fig. 5
at minimal (0.1 Kmin−1) and maximal (10 Kmin−1) cooling
rate yields a value of λ= 8.4 K−1 for the class A INs and λ=
7.2 K−1 for class C INs, respectively (magenta triangles in
Fig. 7; see also Table A2 in Appendix A3). Similarly, we can
linearly fit the Tf,50 data of Fig. 5 as a function of cooling rate
(orange circles in Fig. 7). We note that those two different
ways for deriving λ agree well with each other; see Fig. 7 and
Table A2. Moreover, we can also determine the parameter
ω from fitting a straight line to ln(R(T )/A) vs. T data of
Fig. 6c, resulting in the green diamonds in Fig. 7.
The nonlinear behavior of the R(T )/A data in the loga-
rithmic plot of Fig. 6c suggests that λ is not constant but in-
stead shows a temperature dependence itself. For these rea-
sons we finally derive λ(T ) by taking the derivative of the
CNT fit resulting in the red and blue lines for λ(T ) over the
investigated temperature range (Fig. 7). Clearly, the ω value
is consistent with the λ(T ) value in that it represents an av-
erage value over the investigated temperature range. How-
ever, the strong difference between ω and λ obtained for the
(a)
(b)
(c)
1·10 µg dropClass A
-1 -11·10 µg drop
Class C
-5 -1
Figure 6. (a) Cooling rate dependence of the active site densities per
mass (nm(T )) and per cell (nn(T )) vs. temperature for two classes
of INs determined from droplets containing the indicated Snomax®
concentrations. (b) Stochastic analysis of the data from (a) in terms
of the nucleation rateR(T ). (c) Normalized nucleation rateR(T )/A
data derived from the R(T ) data in (b) following Eq. (6) (data
points) and analysis of these data in terms of the heterogeneous
ice nucleation rate coefficient jhet(T ) using CNT with a constant
effective contact angle α (gray lines) and a linear temperature de-
pendence of α (colored lines).
class C INs and the fact that ω < λ indicate that class C INs
may consist of a multi-component set of INs (see discussion
in Herbert et al., 2014). In contrast, the good agreement be-
tween ω and λ obtained for the class A INs suggests that
these are indeed single-component INs; hence, ω = λ in this
case. We recommend a numerical value of ω = λ= 8.7 K−1
for class A Snomax® INs at the median freezing temperature
of −3.8 ◦C (269.4 K).
The λ values derived here can be compared to values for
other types of INs from the literature. For example, the val-
ues for various mineral dusts (Arizona Test Dust (ATD), il-
www.atmos-meas-tech.net/8/689/2015/ Atmos. Meas. Tech., 8, 689–703, 2015
698 C. Budke and T. Koop: Optical freezing array BINARY
1·10 µg dropClass A
-1 -11·10 µg drop
Class C
-5 -1
Figure 7. Value of ω and λ derived in different ways for the two in-
dicated classes of Snomax® INs. Magenta triangle: λ obtained from
Eq. (9) at the minimal (0.1 Kmin−1) and maximal (10 Kmin−1)
cooling rate. Orange circle: λ obtained from the linear fits to the
Tf,50 data shown in Fig. 5. Green diamond: ω =−dln(R/A)/dT
obtained from a linear fit to theR(T )/A data shown in Fig. 6c. Lines
indicate λ derived from the derivative of the nucleation rate coeffi-
cient −dln(jhet)/dT based on CNT with a temperature-dependent
contact angle; for details see text.
lite NX, kaolinite KGa-1b and feldspar) range between about
1 and 4.6 K−1 (Murray et al., 2011; Wright and Petters,
2013; Hiranuma et al., 2013; Knopf and Alpert, 2013; Vali,
2014; Herbert et al., 2014). Furthermore, the literature anal-
ysis of λ values by Herbert et al. (2014) includes also other
types of INs. This comparison indicates the smallest value
of λ= 0.6 K−1 for volcanic ash (Fornea et al., 2009; Hoyle
et al., 2011; Steinke et al., 2011), and the highest value of
λ= 6.3 K−1 for a soil sample (Vali, 2008). The small λ val-
ues for most IN compounds emphasize the stochastic na-
ture of heterogenous ice nucleation in these cases, as small
λ values correspond to a large time dependence, and vice
versa. These values can be compared to homogeneous ice
nucleation data in pure water at temperatures between about
−38 ◦C (235 K) and −35 ◦C (238 K), which show a mean
value of λ= 3.4± 1.2 K−1 (Riechers et al., 2013).
A comparison of these literature values with those ob-
tained here for Snomax® shows a larger λ value and implies
a very small “stochasticity” of the responsible Snomax® IN
moieties. To our knowledge the value of λ= 8.7 K−1 for
the class A INs of Snomax® obtained here is the largest
λ value reported to date, indicating that the time dependence
of Snomax® is particularly small when compared to INs of
atmospheric relevance.
6 Conclusions
Herein we introduced the novel optical freezing array BI-
NARY for studying the temperature and time dependence
of heterogeneous ice nucleation in the immersion mode.
The principal advantages of the technique is prevention
of a Wegener–Bergeron–Findeisen type water vapor trans-
fer between unfrozen and frozen droplets and of a seeding
of neighboring droplets by formation and surface growth
of frost halos. The simultaneous study of 36 droplets and
a fully automated evaluation of the ice nucleation temper-
ature in each droplet from a real-time image analysis al-
lows for a facile and fast accumulation of data points. More-
over, the microliter volume of the investigated droplets per-
mits a preparation of droplets with IN concentrations vary-
ing over several orders of magnitude, thus enabling the de-
tection of rare ice nucleators of high activity. The BINARY
setup was tested by studying heterogeneous ice nucleation
induced by Snomax® suspended in water droplets at various
concentrations from 1 ngmL−1 to 1 mgmL−1. Two types of
INs were identified, namely class A and class C ice nucle-
ators. Using different cooling rates, we were able to show
that these INs exhibit a very small time dependence, which
we quantified by analyzing the experimental data in terms
of the temperature dependence λ of the ice nucleation rate
coefficient. While class C Snomax® INs appear to be multi-
component, the data for class A are consistent with the be-
havior of a single-component IN. To the best of our knowl-
edge, the resulting λ= 8.7 K−1 for the class A Snomax® INs
is the largest λ value reported to date, equivalent to a par-
ticularly small time dependence. Moreover, the fact that we
could quantify such a small time dependence suggests that
the BINARY setup introduced here is suitable for measuring
time dependence for most other INs of atmospheric interest,
making it a useful tool for future analysis.
Atmos. Meas. Tech., 8, 689–703, 2015 www.atmos-meas-tech.net/8/689/2015/

C. Budke and T. Koop: Optical freezing array BINARY 699
Appendix A: Additional information and data analysis
A1 Calibration literature values
For the temperature calibration described in Sect. 4 informa-
tion about the literature values of the phase transitions of the
reference substances were required. Most of the values are
taken from Linstrom and Mallard (2014) and publications
cited therein. Data which were excluded from the overall av-
erage by the National Institute of Standards and Technology
(NIST) were also excluded here. In addition to the NIST data,
values were taken from Parks and Huffman (1931), Messerly
et al. (1967) and Mondieig et al. (2004). Figure A1 shows an
overview of all data used here. A summary of the particular
phase transitions and the median literature values are given
in Table A1.
Figure A1. Literature values for the phase transitions of water,
tridecane and undecane used for the temperature calibration. Sym-
bols indicate individual literature values, and the lines represent
their median used for the calibration. For data see Table A1.
Table A1. Substances and their median phase transition tempera-
tures derived from several sources which were used in the calibra-
tion of the BINARY setup. The errors indicate the 25th and 75th
percentiles.
Type of Number of Tlit,50 %
Substance Purity transition data points [◦C]
Water double-distilled solid–liquid – 0.00 +0.05−0.39
Tridecane ≥ 99.5 % solid–liquid 20 −5.41 +0.05−0.39
Tridecane ≥ 99.5 % solid–solid 3 −18.15 +0.20−0.00
Undecane ≥ 99.8 % solid–liquid 26 −25.61 +0.01−0.29
Undecane ≥ 99.8 % solid–solid 5 −36.85 +0.30−0.15
A2 Ice nucleation probability
The CNT parameterizations with a temperature-dependent
α(T ) shown as red and blue lines in Fig. 6c were used to cal-
culate the ice nucleation probability Pi0 as a function of time
and temperature for typical experimental conditions. Here
Pi0(T ,1t)=1nice(T ,1t)
nliq(T , t1)= 1− e−R(T )1t (A1)
represents the number of frozen droplets 1nice(T ,1t)=
nliq(T , t1)− nliq(T , t2) at constant temperature T in
a time interval 1t = t2− t1. Figure A2 shows the re-
sults for 1 microliter droplets containing Snomax® at
1× 10⁻¹ µgdrop−1 (class A) in the top panel a and
for droplets containing Snomax® at 1× 10⁻⁵ µgdrop−1
(class C) in the bottom panel b. The contour plots indicate
very abrupt changes of the nucleation probabilities from 0 to
1 with decreasing temperature for both classes of INs. The
corresponding temperature interval in which the transition
occurs is smaller than about 0.5 K for time intervals of 0.1 s
for class C INs. An even-smaller temperature interval of
about 0.2 K results for larger time intervals and class A INs
at 1× 10⁻¹ µgdrop−1. Figure A2 reinforces our interpreta-
tion provided in the Results section that the ice nucleation
probability of Snomax® INs also shows a very strong
temperature dependence but only a small time dependence.
(a)
(b)
1·10 µg dropClass C
-5 -1
1·10 µg dropClass A
-1 -1
Figure A2. Contour plot of the nucleation probabilities Pi0 as
a function of time and temperature for the parametrization using
CNT and temperature-dependent contact angles shown in Fig. 6c
for the two investigated concentrations of 1× 10⁻¹ µgdrop−1 (a)
and 1× 10⁻⁵ µgdrop−1 (b).
www.atmos-meas-tech.net/8/689/2015/ Atmos. Meas. Tech., 8, 689–703, 2015

700 C. Budke and T. Koop: Optical freezing array BINARY
A3 Values for time dependence of Snomax® INs
In Table A2 we provide the results of the quantification of
time dependence according to Sect. 2.3 and described in
Sect. 5. The values of this analysis for two IN classes shown
in Fig. 7 are provided in the following table.
Table A2. Values of λ and ω determined using different approaches
for the two investigated IN classes at their median freezing temper-
ature (given in brackets); for details see text. These data are shown
also in Fig. 7.
Parameter Method Class C Class A
(−8.6± 0.3 ◦C) (−3.8± 0.2 ◦C)
λ Tf(β), min-max 7.2± 3.2 K−1 8.4± 2.3 K−1
λ Tf(β), linear 7.6± 0.9 K−1 8.5± 1.4 K−1
ω R(T )/A, linear 5.4± 0.2 K−1 8.7± 0.4 K−1
Atmos. Meas. Tech., 8, 689–703, 2015 www.atmos-meas-tech.net/8/689/2015/

C. Budke and T. Koop: Optical freezing array BINARY 701
The Supplement related to this article is available online
at doi:10.5194/amt-8-689-2015-supplement.
Acknowledgements. The authors gratefully acknowledge funding
by the German Research Foundation (DFG) through the research
unit INUIT (FOR 1525) under KO 2944/2-1. We particularly thank
our INUIT partners for fruitful collaboration and sharing of ideas
and IN samples. We also thank K. Dreischmeier and D. Cherian
for testing and discussing features of the BINARY setup, and
R. Herbert and B. Murray for helpful discussions on λ analysis.
Edited by: B. Ervens
References
Atkinson, J. D., Murray, B. J., Woodhouse, M. T., Whale, T. F.,
Baustian, K. J., Carslaw, K. S., Dobbie, S., O’Sullivan, D., and
Malkin, T. L.: The importance of feldspar for ice nucleation
by mineral dust in mixed-phase clouds, Nature, 498, 355–358,
doi:10.1038/nature12278, 2013.
Attard, E., Yang, H., Delort, A.-M., Amato, P., Pöschl, U.,
Glaux, C., Koop, T., and Morris, C. E.: Effects of atmo-
spheric conditions on ice nucleation activity of Pseudomonas,
Atmos. Chem. Phys., 12, 10667–10677, doi:10.5194/acp-12-
10667-2012, 2012.
Barahona, D.: On the ice nucleation spectrum, Atmos. Chem. Phys.,
12, 3733–3752, doi:10.5194/acp-12-3733-2012, 2012.
Barlow, T. W. and Haymet, A. D. J.: ALTA: An automated lag-time
apparatus for studying the nucleation of supercooled liquids, Rev.
Sci. Instrum., 66, 2996, doi:10.1063/1.1145586, 1995.
Bigg, E. K.: The supercooling of water, Proc. Phys. Soc. Sect. B,
66, 688–694, doi:10.1088/0370-1301/66/8/309, 1953.
Cantrell, W. and Heymsfield, A.: Production of Ice in Tropo-
spheric Clouds: A Review, B. Am. Meteorol. Soc., 86, 795–807,
doi:10.1175/BAMS-86-6-795, 2005.
Connolly, P. J., Möhler, O., Field, P. R., Saathoff, H., Burgess, R.,
Choularton, T., and Gallagher, M.: Studies of heterogeneous
freezing by three different desert dust samples, Atmos. Chem.
Phys., 9, 2805–2824, doi:10.5194/acp-9-2805-2009, 2009.
Cziczo, D. J. and Froyd, K. D.: Sampling the composi-
tion of cirrus ice residuals, Atmos. Res., 142, 15–31,
doi:10.1016/j.atmosres.2013.06.012, 2014.
Della Gatta, G., Richardson, M. J., Sarge, S. M., and Stølen, S.:
Standards, calibration, and guidelines in microcalorimetry. Part
2. Calibration standards for differential scanning calorimetry
(IUPAC Technical Report), Pure Appl. Chem., 78, 1455–1476,
doi:10.1351/pac200678071455, 2006.
DeMott, P. J., Prenni, A. J., Liu, X., Kreidenweis, S. M., Petters,
M. D., Twohy, C. H., Richardson, M. S., Eidhammer, T., and
Rogers, D. C.: Predicting global atmospheric ice nuclei distribu-
tions and their impacts on climate, P. Natl. Acad. Sci. USA, 107,
11217–11222, doi:10.1073/pnas.0910818107, 2010.
Ervens, B. and Feingold, G.: On the representation of immer-
sion and condensation freezing in cloud models using differ-
ent nucleation schemes, Atmos. Chem. Phys., 12, 5807–5826,
doi:10.5194/acp-12-5807-2012, 2012.
Ervens, B. and Feingold, G.: Sensitivities of immersion freez-
ing: reconciling classical nucleation theory and deter-
ministic expressions, Geophys. Res. Lett., 40, 3320–3324,
doi:10.1002/grl.50580, 2013.
Fletcher, N. H.: Active sites and ice crystal nucleation,
J. Atmos. Sci., 26, 1266–1271, doi:10.1175/1520-
0469(1969)026<1266:ASAICN>2.0.CO;2, 1969.
Fornea, A. P., Brooks, S. D., Dooley, J. B., and Saha, A.:
Heterogeneous freezing of ice on atmospheric aerosols con-
taining ash, soot, and soil, J. Geophys. Res., 114, D13201,
doi:10.1029/2009JD011958, 2009.
Hartmann, S., Augustin, S., Clauss, T., Wex, H., Šantl-Temkiv,
T., Voigtländer, J., Niedermeier, D., and Stratmann, F.: Immer-
sion freezing of ice nucleation active protein complexes, At-
mos. Chem. Phys., 13, 5751–5766, doi:10.5194/acp-13-5751-
2013, 2013.
Heneghan, A. F., Wilson, P. W., and Haymet, A. D. J.: Het-
erogeneous nucleation of supercooled water, and the effect of
an added catalyst, P. Natl. Acad. Sci. USA, 99, 9631–9634,
doi:10.1073/pnas.152253399, 2002.
Herbert, R. J., Murray, B. J., Whale, T. F., Dobbie, S. J., and Atkin-
son, J. D.: Representing time-dependent freezing behaviour in
immersion mode ice nucleation, Atmos. Chem. Phys., 14, 8501–
8520, doi:10.5194/acp-14-8501-2014, 2014.
Hiranuma, N., Möhler, O., Bingemer, H., Bundke, U., Cziczo, D. J.,
Danielczok, A., Ebert, M., Garimella, S., Hoffmann, N., Höh-
ler, K., Kanji, Z. A., Kiselev, A., Raddatz, M., and Stet-
zer, O.: Immersion freezing of clay minerals and bacterial
ice nuclei, in: Nucleation Atmos. Aerosols (AIP Conf. Proc.
1527), edited by: DeMott, P. J. and O’Dowd, C. D., 914–917,
doi:10.1063/1.4803420, AIP Publishing, Melville, NY, USA,
2013.
Hoffer, T. E.: A laboratory investigation of droplet freez-
ing, J. Meteorol., 18, 766–778, doi:10.1175/1520-
0469(1961)018<0766:ALIODF>2.0.CO;2, 1961.
Hoose, C. and Möhler, O.: Heterogeneous ice nucleation on atmo-
spheric aerosols: a review of results from laboratory experiments,
Atmos. Chem. Phys., 12, 9817–9854, doi:10.5194/acp-12-9817-
2012, 2012.
Hoyle, C. R., Pinti, V., Welti, A., Zobrist, B., Marcolli, C., Luo, B.,
Höskuldsson, Á., Mattsson, H. B., Stetzer, O., Thorsteinsson, T.,
Larsen, G., and Peter, T.: Ice nucleation properties of volcanic
ash from Eyjafjallajökull, Atmos. Chem. Phys., 11, 9911–9926,
doi:10.5194/acp-11-9911-2011, 2011.
Iannone, R., Chernoff, D. I., Pringle, A., Martin, S. T., and Bertram,
A. K.: The ice nucleation ability of one of the most abundant
types of fungal spores found in the atmosphere, Atmos. Chem.
Phys., 11, 1191–1201, doi:10.5194/acp-11-1191-2011, 2011.
Jung, S., Tiwari, M. K., and Poulikakos, D.: Frost halos from su-
percooled water droplets, P. Natl. Acad. Sci. USA, 109, 16073–
16078, doi:10.1073/pnas.1206121109, 2012.
Knopf, D. A. and Lopez, M. D.: Homogeneous ice freezing
temperatures and ice nucleation rates of aqueous ammonium
sulfate and aqueous levoglucosan particles for relevant atmo-
spheric conditions, Phys. Chem. Chem. Phys., 11, 8056–8068,
doi:10.1039/b903750k, 2009.
Knopf, D. A. and Alpert, P. A.: A water activity based model
of heterogeneous ice nucleation kinetics for freezing of water
www.atmos-meas-tech.net/8/689/2015/ Atmos. Meas. Tech., 8, 689–703, 2015

702 C. Budke and T. Koop: Optical freezing array BINARY
and aqueous solution droplets, Faraday Discuss., 165, 513–534,
doi:10.1039/c3fd00035d, 2013.
Koop, T. and Zobrist, B.: Parameterizations for ice nucleation in
biological and atmospheric systems, Phys. Chem. Chem. Phys.,
11, 10839–10850, doi:10.1039/b914289d, 2009.
Koop, T., Luo, B., Biermann, U. M., Crutzen, P. J., and Peter, T.:
Freezing of HNO3/H2SO4/H2O solutions at stratospheric tem-
peratures: nucleation statistics and experiments, J. Phys. Chem.
A, 101, 1117–1133, doi:10.1021/jp9626531, 1997.
Koop, T., Ng, H. P., Molina, L. T., and Molina, M. J.: A new optical
technique to study aerosol phase transitions: the nucleation of
ice from H2SO4 aerosols, J. Phys. Chem. A, 102, 8924–8931,
doi:10.1021/jp9828078, 1998.
Koop, T., Luo, B., Tsias, A., and Peter, T.: Water activity as the de-
terminant for homogeneous ice nucleation in aqueous solutions,
Nature, 406, 611–614, doi:10.1038/35020537, 2000.
Kulkarni, G., Fan, J., Comstock, J. M., Liu, X., and Ovchinnikov,
M.: Laboratory measurements and model sensitivity studies of
dust deposition ice nucleation, Atmos. Chem. Phys., 12, 7295–
7308, doi:10.5194/acp-12-7295-2012, 2012.
Lamb, D. and Verlinde, J.: Physics and Chemistry of
Clouds, Cambridge University Press, Cambridge,
doi:10.1017/CBO9780511976377, 2011.
Linstrom, P. J. and Mallard, W. G. (Eds.): NIST Chemistry Web-
Book, NIST Standard Reference Database Number 69, National
Institute of Standards and Technology, Gaithersburg MD, 20899,
available at: http://webbook.nist.gov, last access: 8 September
2014.
Lohmann, U. and Diehl, K.: Sensitivity studies of the impor-
tance of dust ice nuclei for the indirect aerosol effect on
stratiform mixed-phase clouds, J. Atmos. Sci., 63, 968–982,
doi:10.1175/JAS3662.1, 2006.
Lüönd, F., Stetzer, O., Welti, A., and Lohmann, U.: Experimental
study on the ice nucleation ability of size-selected kaolinite par-
ticles in the immersion mode, J. Geophys. Res., 115, D14201,
doi:10.1029/2009JD012959, 2010.
Maki, L. R., Galyan, E. L., Chang-Chien, M. M., and Caldwell,
D. R.: Ice nucleation induced by pseudomonas syringae, Appl.
Microbiol., 28, 456–459, 1974.
Messerly, J. F., Guthrie, G. B., Todd, S. S., and Finke, H. L.:
Low-temperature thermal data for pentane, n-heptadecane,
and n-octadecane. Revised thermodynamic functions for the
n-alkanes, C5–C18, J. Chem. Eng. Data, 12, 338–346,
doi:10.1021/je60034a014, 1967.
Möhler, O., Georgakopoulos, D. G., Morris, C. E., Benz, S., Ebert,
V., Hunsmann, S., Saathoff, H., Schnaiter, M., and Wagner, R.:
Heterogeneous ice nucleation activity of bacteria: new labora-
tory experiments at simulated cloud conditions, Biogeosciences,
5, 1425–1435, doi:10.5194/bg-5-1425-2008, 2008.
Mondieig, D., Rajabalee, F., Metivaud, V., Oonk, H. A. J., and
Cuevas-Diarte, M. A.: n-alkane binary molecular alloys, Chem.
Mater., 16, 786–798, doi:10.1021/cm031169p, 2004.
Murphy, D. M. and Koop, T.: Review of the vapour pressures of ice
and supercooled water for atmospheric applications, Q. J. Roy.
Meteorol. Soc., 131, 1539–1565, doi:10.1256/qj.04.94, 2005.
Murray, B. J., Broadley, S. L., Wilson, T. W., Bull, S. J., Wills, R. H.,
Christenson, H. K., and Murray, E. J.: Kinetics of the homoge-
neous freezing of water, Phys. Chem. Chem. Phys., 12, 10380–
10387, doi:10.1039/c003297b, 2010.
Murray, B. J., Broadley, S. L., Wilson, T. W., Atkinson, J. D.,
and Wills, R. H.: Heterogeneous freezing of water droplets con-
taining kaolinite particles, Atmos. Chem. Phys., 11, 4191–4207,
doi:10.5194/acp-11-4191-2011, 2011.
Murray, B. J., O’Sullivan, D., Atkinson, J. D., and Webb, M. E.: Ice
nucleation by particles immersed in supercooled cloud droplets,
Chem. Soc. Rev., 41, 6519–6554, doi:10.1039/c2cs35200a,
2012.
Niedermeier, D., Hartmann, S., Shaw, R. A., Covert, D.,
Mentel, T. F., Schneider, J., Poulain, L., Reitz, P., Spindler, C.,
Clauss, T., Kiselev, A., Hallbauer, E., Wex, H., Mildenberger, K.,
and Stratmann, F.: Heterogeneous freezing of droplets with im-
mersed mineral dust particles – measurements and parameteriza-
tion, Atmos. Chem. Phys., 10, 3601–3614, doi:10.5194/acp-10-
3601-2010, 2010.
Niemand, M., Möhler, O., Vogel, B., Vogel, H., Hoose, C., Con-
nolly, P., Klein, H., Bingemer, H., DeMott, P., Skrotzki, J., and
Leisner, T.: A particle-surface-area-based parameterization of
immersion freezing on desert dust particles, J. Atmos. Sci., 69,
3077–3092, doi:10.1175/JAS-D-11-0249.1, 2012.
O’Sullivan, D., Murray, B. J., Malkin, T. L., Whale, T. F.,
Umo, N. S., Atkinson, J. D., Price, H. C., Baustian, K. J.,
Browse, J., and Webb, M. E.: Ice nucleation by fertile soil dusts:
relative importance of mineral and biogenic components, At-
mos. Chem. Phys., 14, 1853–1867, doi:10.5194/acp-14-1853-
2014, 2014.
Parks, G. S. and Huffman, H. M.: Some fusion and transi-
tion data for hydrocarbons, Ind. Eng. Chem., 23, 1138–1139,
doi:10.1021/ie50262a018, 1931.
Pruppacher, H. R. and Klett, J. D.: Microphysics of Clouds and Pre-
cipitation, 2nd Edn., Kluwer Academic Publishers, New York,
1997.
Pummer, B. G., Bauer, H., Bernardi, J., Bleicher, S., and Grothe,
H.: Suspendable macromolecules are responsible for ice nucle-
ation activity of birch and conifer pollen, Atmos. Chem. Phys.,
12, 2541–2550, doi:10.5194/acp-12-2541-2012, 2012.
Remmers, M. L.: Kerzenruß als Vorläufer für robuste und trans-
parente superamphiphobe Beschichtungen, Ba thesis, Bielefeld
University, Bielefeld, 2012.
Riechers, B., Wittbracht, F., Hütten, A., and Koop, T.: The homo-
geneous ice nucleation rate of water droplets produced in a mi-
crofluidic device and the role of temperature uncertainty, Phys.
Chem. Chem. Phys., 15, 5873–5887, doi:10.1039/c3cp42437e,
2013.
Salcedo, D., Molina, L. T., and Molina, M. J.: Nucleation
rates of nitric acid dihydrate in 1 : 2 HNO3/H2O solutions
at stratospheric temperatures, Geophys. Res. Lett., 27, 193,
doi:10.1029/1999GL010991, 2000.
Sarge, S. M., Höhne, G. W., Cammenga, H. K., Eysel, W., and
Gmelin, E.: Temperature, heat and heat flow rate calibration of
scanning calorimeters in the cooling mode, Thermochim. Acta,
361, 1–20, doi:10.1016/S0040-6031(00)00543-8, 2000.
Steinke, I., Möhler, O., Kiselev, A., Niemand, M., Saathoff, H.,
Schnaiter, M., Skrotzki, J., Hoose, C., and Leisner, T.: Ice nu-
cleation properties of fine ash particles from the Eyjafjallajökull
eruption in April 2010, Atmos. Chem. Phys., 11, 12945–12958,
doi:10.5194/acp-11-12945-2011, 2011.
Stopelli, E., Conen, F., Zimmermann, L., Alewell, C., and Morris,
C. E.: Freezing nucleation apparatus puts new slant on study of
Atmos. Meas. Tech., 8, 689–703, 2015 www.atmos-meas-tech.net/8/689/2015/
C. Budke and T. Koop: Optical freezing array BINARY 703
biological ice nucleators in precipitation, Atmos. Meas. Tech., 7,
129–134, doi:10.5194/amt-7-129-2014, 2014.
Turner, M. A., Arellano, F., and Kozloff, L. M.: Three separate
classes of bacterial ice nucleation structures, J. Bacteriol., 172,
2521–2526, 1990.
Vali, G.: Supercooling of water and nucleation of ice (drop freezer),
Am. J. Phys., 39, 1125–1128, doi:10.1119/1.1976585, 1971a.
Vali, G.: Quantitative Evaluation of Experimental Results
an the Heterogeneous Freezing Nucleation of Supercooled
Liquids, J. Atmos. Sci., 28, 402–409, doi:10.1175/1520-
0469(1971)028<0402:QEOERA>2.0.CO;2, 1971b.
Vali, G.: Freezing rate due to heterogeneous nucleation,
J. Atmos. Sci., 51, 1843–1856, doi:10.1175/1520-
0469(1994)051<1843:FRDTHN>2.0.CO;2, 1994.
Vali, G.: Repeatability and randomness in heterogeneous
freezing nucleation, Atmos. Chem. Phys., 8, 5017–5031,
doi:10.5194/acp-8-5017-2008, 2008.
Vali, G.: Interpretation of freezing nucleation experiments: singu-
lar and stochastic; sites and surfaces, Atmos. Chem. Phys., 14,
5271–5294, doi:10.5194/acp-14-5271-2014, 2014.
Vali, G. and Stansbury, E. J.: Time-dependet characteristics of the
heterogeneous nucleation of ice, Can. J. Phys., 44, 477–502,
doi:10.1139/p66-044, 1966.
Vali, G. and Snider, J. R.: Time-dependent freezing rate par-
cel model, Atmos. Chem. Phys. Discuss., 14, 29305–29329,
doi:10.5194/acpd-14-29305-2014, 2014.
Vali, G., Christensen, M., Fresh, R. W., Galyan, E. L., Maki,
L. R., and Schnell, R. C.: Biogenic Ice Nuclei. Part II: Bacte-
rial Sources, J. Atmos. Sci., 33, 1565–1570, doi:10.1175/1520-
0469(1976)033<1565:BINPIB>2.0.CO;2, 1976.
Vonnegut, B. and Baldwin, M.: Repeated nucleation of a su-
percooled water sample that contains silver iodide particles,
J. Clim. Appl. Meteorol., 23, 486–490, doi:10.1175/1520-
0450(1984)023<0486:RNOASW>2.0.CO;2, 1984.
Ward, P. J. and DeMott, P. J.: Preliminary experimental evaluation
of Snomax Snow Inducer, Pseudomonas syringae, as an artificial
ice nucleus for weather modification, J. Weather Modif., 21, 9–
13, 1989.
Welti, A., Lüönd, F., Kanji, Z. A., Stetzer, O., and Lohmann, U.:
Time dependence of immersion freezing: an experimental study
on size selected kaolinite particles, Atmos. Chem. Phys., 12,
9893–9907, doi:10.5194/acp-12-9893-2012, 2012.
Welz, T.: Untersuchung der Eisnukleation in wässrigen Birken-
pollensuspensionen, Ba thesis, Bielefeld University, Bielefeld,
2013.
Wex, H., Augustin-Bauditz, S., Boose, Y., Budke, C., Curtius, J.,
Diehl, K., Dreyer, A., Frank, F., Hartmann, S., Hiranuma, N.,
Jantsch, E., Kanji, Z. A., Kiselev, A., Koop, T., Möhler, O.,
Niedermeier, D., Nillius, B., Rösch, M., Rose, D., Schmidt,
C., Steinke, I., and Stratmann, F.: Intercomparing different de-
vices for the investigation of ice nucleating particles using
Snomax® as test substance, Atmos. Chem. Phys., 15, 1463–
1485, doi:10.5194/acp-15-1463-2015, 2015.
Wood, S. E., Baker, M. B., and Swanson, B. D.: Instrument for stud-
ies of homogeneous and heterogeneous ice nucleation in free-
falling supercooled water droplets, Rev. Sci. Instrum., 73, 3988,
doi:10.1063/1.1511796, 2002.
Wright, T. P. and Petters, M. D.: The role of time in heterogeneous
freezing nucleation, J. Geophys. Res. Atmos., 118, 3731–3743,
doi:10.1002/jgrd.50365, 2013.
Yankofsky, S. A., Levin, Z., Bertold, T., and Sandlerman, N.:
Some basic characteristics of bacterial freezing nuclei,
J. Appl. Meteorol., 20, 1013–1019, doi:10.1175/1520-
0450(1981)020<1013:SBCOBF>2.0.CO;2, 1981.
Zobrist, B., Koop, T., Luo, B., Marcolli, C., and Peter, T.: Hetero-
geneous ice nucleation rate coefficient of water droplets coated
by a nonadecanol monolayer, J. Phys. Chem. C, 111, 2149–2155,
doi:10.1021/jp066080w, 2007.
www.atmos-meas-tech.net/8/689/2015/ Atmos. Meas. Tech., 8, 689–703, 2015