billions in estimated medicare advantage payments from ... · billions in estimated medicare...
TRANSCRIPT

U.S. Department of Health and Human Services
Office of Inspector General
Billions in Estimated
Medicare Advantage
Payments From Chart
Reviews Raise Concerns
Joanne M. Chiedi
Acting Inspector General
OEI-03-17-00470
December 2019
oig.hhs.gov

Why OIG Did This Review
We undertook this study
because of concerns that MAOs
may use chart reviews to
increase risk-adjusted payments
inappropriately. Unsupported
risk-adjusted payments are a
major driver of improper
payments in the MA program,
which provided coverage to
21 million beneficiaries in 2018
at a cost of $210 billion.
CMS risk-adjusts payments by
using beneficiaries’ diagnoses to
pay higher capitated payments
to MAOs for sicker
beneficiaries―which may create
financial incentives for MAOs to
make beneficiaries appear as
sick as possible. MAOs report
these diagnoses via CMS’s MA
encounter data system and
RAPS based on services and
chart reviews (i.e., MAO’s
reviews of a beneficiary’s
medical record to identify
diagnoses that a provider did
not submit or submitted in
error).
To be eligible for risk
adjustment, a diagnosis must be
documented in a medical record
as a result of a face-to-face visit.
Although CMS requires MAOs
to identify chart reviews in the
encounter data, CMS does not
require MAOs to link these chart
reviews to a specific service
associated with the diagnoses.
This may provide MAOs
opportunities to circumvent
CMS’s face-to-face requirement
and inflate risk-adjusted
payments inappropriately.
Billions in Estimated Medicare Advantage Payments
From Chart Reviews Raise Concerns
The risk adjustment program is an important Medicare Advantage (MA) payment
mechanism. It levels the playing field for MA organizations (MAOs) that enroll sicker
beneficiaries who need a more costly level of care. This helps to ensure that sicker
beneficiaries have continued access to MA plans. Chart reviews can be a tool to
improve the accuracy of risk-adjusted
payments by allowing MAOs to add and
delete diagnoses in the encounter data
based on reviews of patients’ records.
However, chart reviews—particularly those
not linked to service records—may provide
MAOs opportunities to circumvent the
Centers for Medicare & Medicaid Services
(CMS) face-to-face requirement and inflate
risk-adjusted payments inappropriately.
What OIG Found
Our findings highlight potential issues about the extent to which chart reviews are
leveraged by MAOs and overseen by CMS. Based on our analysis of MA encounter
data, we found that:
• MAOs almost always used chart reviews as a tool to add, rather than to delete,
diagnoses—over 99 percent of chart reviews in our review added diagnoses.
• Diagnoses that MAOs reported only on chart reviews—and not on any service
records—resulted in an estimated $6.7 billion in risk-adjusted payments for 2017.1
• CMS based an estimated $2.7 billion in risk-adjusted payments on chart review
diagnoses that MAOs did not link to a specific service provided to the
beneficiary―much less a face-to-face visit.
• Although limited to a small number of beneficiaries, almost half of MAOs
reviewed had payments from unlinked chart reviews where there was not a single
record of a service being provided to the beneficiary in all of 2016.
These findings raise three types of potential concerns. First, there may be a data
integrity concern that MAOs are not submitting all service records as required. Second,
there may be a payment integrity concern if diagnoses are inaccurate or unsupported—
making the associated risk-adjusted payments inappropriate. Third, there may be a
quality-of-care concern that beneficiaries are not receiving needed services for
potentially serious diagnoses listed on chart reviews, but with no service records.
Report in Brief
December 2019
OEI-03-17-00470
U.S. Department of Health and Human Services
Office of Inspector General
Key Takeaway
Billions of estimated risk-adjusted
payments supported solely through
chart reviews raise potential
concerns about the completeness of
payment data submitted to CMS, the
validity of diagnoses on chart
reviews, and the quality of care
provided to beneficiaries.
1 CMS’s actual risk-adjusted payments to MAOs incorporate diagnoses from both Risk Adjustment
Processing System (RAPS) data and encounter data; however, there is no method to identify which
diagnoses in the RAPS data are from chart reviews. Risk-adjustment-eligible diagnoses in the encounter
data should be in the RAPS data. If MAOs submitted any eligible diagnoses from chart reviews only in the
RAPS or only in the encounter data system, our payment estimates could underestimate or overestimate the
actual risk-adjusted payments resulting solely from diagnoses on chart reviews.

How OIG Did This Review
We analyzed 2016 MA
encounter data to determine
the 2017 financial impact of
diagnoses reported only on
chart reviews and not on any
service record in the encounter
data that year. We also
analyzed CMS’s responses to a
structured questionnaire to
identify actions taken by CMS
to review the impact of chart
reviews on MA payments.
Key Terms
Encounter Data
Chart reviews and service
records submitted by MAOs
to CMS’s encounter data
system.
Chart Reviews
Records based on MAOs’
retrospective reviews of
beneficiaries’ medical record
documentation to (1) add
diagnoses not previously
submitted or (2) delete
diagnoses submitted in
error.
Service Records
Records based on
information that providers
submit to MAOs after
providing services or medical
items to beneficiaries
(non-chart reviews).
Despite the potential for MAOs to misuse chart reviews, CMS has not reviewed the
financial impact of chart reviews in the encounter data on risk-adjusted payments. CMS
has not assessed variation across MAOs in their chart review submissions. In addition,
CMS has not analyzed the quality of care provided to beneficiaries who may have serious
health conditions and may not be receiving needed services. Finally, CMS has not yet
performed audits that validate diagnoses reported on chart reviews in the encounter
data against beneficiaries’ medical records. CMS reported that it plans to begin audits
that would include such chart reviews later this year.
What OIG Recommends
We recommend that CMS (1) provide targeted oversight of MAOs that had risk-adjusted
payments resulting from unlinked chart reviews for beneficiaries who had no service
records in the 2016 encounter data, (2) conduct audits that validate diagnoses reported
on chart reviews in the MA encounter data, and (3) reassess the risks and benefits of
allowing chart reviews that are not linked to service records to be used as sources of
diagnoses for risk adjustment. CMS concurred with these recommendations.
Report in Brief
December 2019
OEI-03-17-00470
U.S. Department of Health and Human Services
Office of Inspector General
Full report can be found at oig.hhs.gov/oei/reports/oei-03-17-00470.asp
TABLE OF CONTENTS
BACKGROUND 1
Methodology 6
FINDINGS
Less than 1 percent of chart reviews deleted risk-adjustment-eligible diagnoses from the MA
encounter data for payment year 2017
10
Diagnoses that MAOs reported only on chart reviews―and not on any service
records―resulted in an estimated $6.7 billion in risk-adjusted payments for 2017
11
CMS based an estimated $2.7 billion in risk-adjusted payments on chart review diagnoses that
MAOs did not link to any service provided to the beneficiary
13
Although limited to a small number of beneficiaries, almost half of MAOs reviewed had
payments from unlinked chart reviews where there was not a single record of a service being
provided to the beneficiary in all of 2016
16
CMS has not validated diagnoses or reviewed the financial impact of diagnoses reported on
chart reviews in the encounter data
17
CONCLUSION AND RECOMMENDATIONS
Provide targeted oversight of MAOs that had risk-adjusted payments resulting from unlinked
chart reviews for beneficiaries who had no service records in the 2016 encounter data
19
Conduct audits that validate diagnoses reported on chart reviews in the MA encounter data 19
Reassess the risks and benefits of allowing chart reviews that are not linked to service records
to be used as sources of diagnoses for risk adjustment
19
AGENCY COMMENTS AND OIG RESPONSE 21
APPENDICES
A. Detailed Methodology 23
B. Estimated Payments Resulting From Diagnoses Reported Only on Chart Reviews, by HCC 29
C. Estimated Payments Resulting From Chart Reviews for HCCs at High Risk for Improper
Payments
34
D. Agency Comments 35
ACKNOWLEDGMENTS 39

Billions in Estimated Medicare Advantage Payments From Chart Reviews Raise Concerns 1
OEI-03-17-00470
BACKGROUND
Ensuring that MA organizations (MAOs) receive accurate payments to provide
appropriate care to Medicare beneficiaries is critically important. Toward this
end, CMS makes risk-adjusted payments by using beneficiaries’ diagnoses to
pay higher capitated rates to MAOs for sicker beneficiaries with higher risk
scores. However, this may create financial incentives for MAOs to make
beneficiaries appear as sick as possible to obtain higher payments. CMS
estimates that from 2013 through 2016, Medicare paid $40 billion in
overpayments that resulted from plan-submitted diagnoses that were not
supported by beneficiaries’ medical records. The Government Accountability
Office (GAO) and the Department of Justice (DOJ) have also identified
vulnerabilities related to MAOs inflating their beneficiaries’ risk scores. This OIG
evaluation analyzed data and trends related to chart review encounter records
(hereafter chart reviews), an allowable source of diagnoses that may provide
MAOs with opportunities to inflate risk scores inappropriately.
The Medicare Advantage Program
Under MA, also known as Medicare Part C, CMS contracts with private insurance
companies, known as MAOs, to provide coverage of Parts A and B services
through private health plan options.1 In 2018, a third of Medicare
beneficiaries—21 million—elected to enroll with approximately 700 MAOs
rather than receive services through the Medicare fee-for-service program.2
MA program costs were $210 billion of the total $711 billion in Medicare
program costs in fiscal year 2018.3
1 Each MAO may offer multiple plans. Medicare Parts A and B include hospital care, skilled
nursing facility care, hospice care, home health care, physician services, and durable medical
equipment, prosthetics, orthotics, and supplies. Many MA plans also offer prescription drug
coverage under Medicare Part D.
2 We use the term MAO to refer to a unique MA contract.
3 CMS, CMS Financial Report Fiscal Year 2018, November 2018, p.71. Accessed at
https://www.cms.gov on November 15, 2018.
Objectives
1. To determine the extent to which diagnoses reported only on chart
reviews conducted by Medicare Advantage organizations increased
Medicare Advantage (MA) risk-adjusted payments.
2. To identify actions that the Centers for Medicare & Medicaid Services
(CMS) has taken to review the impact of chart reviews on MA
risk-adjusted payments.

Billions in Estimated Medicare Advantage Payments From Chart Reviews Raise Concerns 2
OEI-03-17-00470
MA Risk-Adjusted Payments
For each beneficiary enrolled, MAOs receive a monthly capitated payment that
reflects CMS’s predicted cost of providing care to an MA beneficiary. CMS
risk-adjusts payments to pay MAOs more for beneficiaries with higher expected
healthcare costs. CMS bases risk adjustments on MA beneficiaries’
demographic information and diagnoses from the prior year. As outlined in
Exhibit 1, CMS’s risk-adjustment process relies on diagnoses reported by MAOs.
MAOs Report Diagnoses to CMS. The risk-adjustment process begins when
the beneficiary receives a service or medical item from a provider. The provider
submits claims information, including diagnoses, to the MAO based on the
service or medical item provided. The MAO submits a record of the service
(hereafter service record) to CMS’s MA encounter data system that contains this
claims information, including the diagnoses.4 CMS began collecting encounter
data from MAOs in 2012 as part of an effort to improve MA payment accuracy
and better perform MA quality reviews.
Exhibit 1: MA risk-adjustment process
The beneficiary
receives a
service
The provider submits
service information
to the MAO
The MAO submits a
service record to
CMS’s encounter
data system
CMS performs data
integrity checks on the
service record
submitted by the MAO
CMS identifies risk-
adjustment-eligible
diagnoses from the
submitted service record
CMS risk-adjusts
payments and
pays the MAO
4 MAOs also submit data on beneficiaries’ diagnoses to CMS through the Risk Adjustment
Processing System (RAPS). Ultimately, CMS plans to rely exclusively on encounter data to identify
diagnoses for risk-adjusted payments.

Billions in Estimated Medicare Advantage Payments From Chart Reviews Raise Concerns 3
OEI-03-17-00470
CMS Performs Activities To Safeguard the Integrity of Reported Diagnoses.
CMS requires MAOs to certify the accuracy, completeness, and truthfulness of
their encounter data submissions.5 In addition, CMS performs activities to
safeguard the integrity of the encounter data. During the data submission
process, CMS performs automated checks, or edits, that reject service records
containing incorrect information (e.g., service records with improperly formatted
data or missing fields) that CMS deems key to MA program payment and data
integrity. After records pass these edits, CMS conducts analyses to review the
stored data. If these analyses identify data errors, CMS may perform outreach
to MAOs or introduce new edits to prevent incorrect data from being included
in the encounter data.6
CMS Identifies Eligible Diagnoses for Risk Adjustment. For CMS to permit a
diagnosis to be eligible for risk adjustment, it must be:
(1) documented in a medical record from a hospital inpatient stay, hospital
outpatient visit, or a visit with a physician or other eligible healthcare
professional during the prior year; and
(2) documented as a result of a face-to-face visit between the beneficiary and
the provider.7
To identify which diagnoses meet these eligibility criteria, CMS extracts, or
filters, diagnoses in the encounter data based on whether the service record
contains an acceptable procedure code and/or type of bill code8, 9
CMS Risk-Adjusts Payments. To risk-adjust payments to MAOs based on
eligible diagnoses, CMS employs a health-based risk adjustment model known
as the CMS hierarchical condition category (CMS-HCC) model. The model
groups certain medical conditions into HCCs, which are categories of clinically
related diagnoses.10 The model also ranks related groups of
risk-adjustment-eligible diagnoses on the basis of disease severity and costs
associated with treatment. Each HCC has relative numerical values (i.e., relative
factors) that represent CMS’s predicted costs associated with treating the
5 42 CFR § 422.504(l).
6 CMS plans to implement additional compliance activities, such as issuing notices of
noncompliance, warning letters, and corrective action plans, for MAOs that fail to satisfy certain
performance thresholds related to the integrity of the encounter data.
7 CMS, Medicare Managed Care Manual, Pub. No. 100-16 (Rev. 118, September 19, 2014), ch. 7, § 40.
Accessed at https://www.cms.gov on December 17, 2018.
8 For institutional outpatient services, CMS uses type of bill and procedure codes to identify which
diagnoses are eligible for risk-adjusted payment. For hospital inpatient services, CMS uses type of
bill codes. For professional services, CMS uses procedure codes to identify which diagnoses are
eligible for risk-adjusted payment. For CMS’s filtering logic, the type of bill code is a value
signifying the type of claim information submitted on a record. For example, type of bill code 11X
indicates a hospital inpatient record.
9 CMS, Final Encounter Data Diagnosis Filtering Logic, December 2015. Accessed at
https://www.csscoperations.com on December 2, 2019.
10 42 CFR § 422.2.
Billions in Estimated Medicare Advantage Payments From Chart Reviews Raise Concerns 4
OEI-03-17-00470
medical conditions in the category. A beneficiary may have multiple HCCs. A
beneficiary’s risk score equals the sum of the relative factors that correspond
with his or her HCCs and demographic characteristics.11 The total risk-adjusted
payment to an MAO for an enrolled beneficiary equals the risk score multiplied
by the MA plan’s base payment rate.12
In addition to diagnoses reported by MAOs in the RAPS data, CMS began
incorporating diagnoses from the encounter data into risk scores in 2015. To
determine risk-adjusted payments for 2017, CMS calculated a blended risk score
for each beneficiary by combining 25 percent of the risk score calculated from
diagnoses in the encounter data and 75 percent of the risk score calculated
from diagnoses in the RAPS data. CMS requires MAOs to submit records to the
encounter data system for all services provided to beneficiaries. Therefore,
MAOs should report the same risk-adjustment-eligible diagnoses in both the
RAPS and encounter data.
CMS Conducts Audits To Validate Diagnoses Used in Risk Adjustment. After
making risk-adjusted payments to MAOs, CMS determines whether a sample of
diagnoses reported by MAOs can be validated by supporting medical record
documentation using contract-level and national risk-adjustment data validation
(RADV) audits.13 CMS has conducted these audits of diagnoses submitted to
CMS through RAPS since payment year 2007. When contract-level RADV audits
cannot validate a diagnosis, CMS uses this information to recover overpayments
from MAOs and calculate a payment error rate. As part of the RADV audit
process, CMS identifies the HCCs that had the highest rates of errors for that
payment year.
Chart Reviews
In addition to reporting diagnoses to CMS on service records, MAOs may also
perform retrospective reviews of beneficiaries’ medical record documentation to
identify diagnoses that (1) providers did not originally submit to the MAO or
(2) providers submitted to the MAO in error. To perform these reviews, MAOs
may employ third-party vendors to examine beneficiaries’ medical records by
using staff with clinical or coding experience or by using artificial intelligence
software. MAOs may report diagnoses identified by these reviews to the
encounter data as chart review records (hereafter chart reviews).14 CMS allows
11 The CMS-HCC model also includes relative factors for certain combinations of coexisting
diagnoses (i.e., disease interactions) and interactions between certain diseases and a beneficiary’s
disabled status (i.e., disabled interactions), which are added to a beneficiary’s risk score. For the
purposes of this evaluation, we use the term HCCs to refer to all HCCs, disease interactions, and
disabled interactions.
12 An MA plan’s base payment rate is the plan’s standardized bid adjusted by the county Intra
Service Area Rate factor for the beneficiary’s county of residence.
13 CMS, Contract-Level Risk Adjustment Data Validation Medical Record Reviewer Guidance,
September 2017, p.5. Accessed at https://www.cms.gov on November 23, 2017.
14 Although MAOs may also report diagnoses identified by chart reviews to the RAPS data, CMS
does not have a method to identify which RAPS records contain diagnoses resulting from chart
reviews.

Billions in Estimated Medicare Advantage Payments From Chart Reviews Raise Concerns 5
OEI-03-17-00470
diagnoses reported on chart reviews that are eligible for risk adjustment (i.e.,
contain an acceptable type of bill code and/or procedure code) to support
risk-adjusted payments.
MAOs may submit an unlimited number of chart reviews to the encounter data
system. However, CMS instructs MAOs that a chart review should not be the
only record in the encounter data system that contains information about an
item or service provided to a beneficiary.15 Furthermore, diagnoses reported on
chart reviews should be associated with an item or service provided to the
beneficiary.16
As with service records, CMS performs edits on chart reviews during the data
submission process. However, to reduce administrative burden for MAOs and
streamline processing of these records, CMS recently discontinued a number of
edits performed on chart reviews, including edits that would have rejected chart
reviews with institutional type of bill codes that contained unacceptable
diagnosis codes and missing dates of service on service lines.17
Linked Chart Reviews. Linking a chart review to a previously accepted service
record allows CMS and other oversight entities to identify the specific item or
service that is associated with a risk-adjustment-eligible diagnosis. MAOs link
chart reviews by identifying the previously accepted service record to which
they are adding or deleting chart review diagnoses.18 In April 2019, CMS issued
guidance to MAOs that CMS will reject linked chart reviews that do not match
certain data fields on the linked service record.19
Unlinked Chart Reviews. CMS permits MAOs to submit unlinked chart reviews
that add diagnoses to the encounter data without identifying the specific item
or service associated with the diagnoses.20 CMS instructs MAOs that all
diagnoses submitted on unlinked chart reviews must be supported by medical
record documentation from a face-to-face visit with the beneficiary. However,
when the MAO does not know the actual procedure code associated with a
diagnosis submitted on an unlinked chart review, CMS allows MAOs to submit
any procedure code of their choosing―and refers to the code as a default
procedure code. However, CMS requires MAOs to include a variable that
indicates that they used a default procedure code on the chart review. CMS
reminds MAOs that, “diagnoses that are not risk-adjustment-eligible should not
15 CMS, Encounter Data Submission and Processing Guide, Medicare Advantage Program,
March 2019, ch. 2, p.3. Accessed at https://www.csscoperations.com on June 3, 2019. 16 Ibid. 17 CMS, Encounter Data Software Release-Chart Review Record Edits, October 2018.
18 On a linked chart review, MAOs identify the previously accepted service record by reporting
that service record’s unique internal control number.
19 CMS, June 2019 Encounter Data Software Release Updates, May 2019.
20 MAOs cannot use unlinked chart reviews to delete previously accepted diagnoses.

Billions in Estimated Medicare Advantage Payments From Chart Reviews Raise Concerns 6
OEI-03-17-00470
be submitted with default [procedure] codes that would cause the diagnoses to
be allowed [for risk adjustment].”21
Concerns Reported About Chart Reviews. Federal entities have questioned
MAOs’ use of chart reviews to add diagnoses for risk adjustment. Risk
adjustment may provide opportunities for MAOs to inappropriately inflate
Medicare Advantage payments through the submission of unsupported
diagnoses. Chart reviews appear particularly vulnerable to such misuse by
MAOs. By allowing MAOs to add or delete diagnoses, chart reviews can be a
tool to improve the accuracy of risk-adjustment-eligible data submitted to CMS.
However, MAOs may use chart reviews to mainly increase their risk-adjusted
payments. In 2017, the United States joined a whistleblower lawsuit filed under
the False Claims Act alleging that an MAO used the results of chart reviews to
report diagnoses that the treating physician did not originally report but did not
use the chart review results to delete diagnoses found to be invalid by these
chart reviews.22 In 2016, GAO stated concern that diagnoses collected from
MAOs’ retrospective chart reviews may be less likely to be supported by
medical records compared to diagnoses submitted to MAOs by providers.23
Methodology We reviewed chart reviews from the 2016 MA encounter data stored in CMS’s
Integrated Data Repository (IDR) to determine the amount of 2017 MA
risk-adjusted payments that would have resulted from diagnoses reported only
on chart reviews. We did not incorporate diagnoses stored in CMS’s RAPS data
into our payment calculations, as there is no way to identify which diagnoses in
the RAPS data are from chart reviews.
We determined there were 52.6 million chart reviews submitted by 80 percent
of MAOs (553 of 690) that added or deleted diagnoses in the MA encounter
data, as outlined in Exhibit 2.24
21 CMS, Encounter Data Submission and Processing Guide, Medicare Advantage Program,
March 2019, ch. 2, p.3. Accessed at https://www.csscoperations.com on June 3, 2019.
22 Department of Justice, U.S. intervenes in Second “Whistleblower” Lawsuit Alleging UnitedHealth
Mischarged the Medicare Advantage and Prescription Drug Programs, May 16, 2017. Accessed at
https://www.justice.gov on December 17, 2018; United States ex rel. Poehling v. UnitedHealth
Group, Inc. et al., No.11-cv-8697-MWF (SSX), (C.D. Cal. filed May 16, 2017).
23 GAO, Fundamental Improvements Needed in CMS’s Effort to Recover Substantial Amounts of
Improper Payments, GAO-16-76, April 2016, p.13. Accessed at https://www.gao.gov on
December 15, 2018.
24 We use the term MAO to represent each unique MA contract number. As of January 2016, CMS
contracted with 690 MAOs to provide Parts A and B services to MA beneficiaries. CMS, Medicare
Advantage, Cost, PACE, Demo, and Prescription Drug Plan Contract Report-Monthly Summary Report
(Data as of January 2016), January 2016. Accessed at https://www.cms.gov on March 28, 2019.

Billions in Estimated Medicare Advantage Payments From Chart Reviews Raise Concerns 7
OEI-03-17-00470
Exhibit 2: The number of MAOs included in our review
690 MAOs
Enrolled all MA
beneficiaries as of
January 2016
553 MAOs
Submitted chart reviews
to the MA encounter
data for 2016
426 MAOs
Reported
risk-adjustment-eligible
diagnoses on chart
reviews included in our
review
Source: OIG analysis of 2016 MA encounter data from CMS’s IDR and CMS’s Medicare Advantage, Cost,
PACE, Demo, Prescription Drug Plan Contract Report—Monthly Summary Report (Data as of January 2016).
We included chart reviews only for beneficiaries enrolled in the same MA plan
for all 12 months of 2016 in our evaluation.25 In addition, we excluded cost
plans, demonstration plans, program of all-inclusive care for the elderly (PACE)
organizations, and Medicare medical savings account plans. We analyzed
risk-adjustment-eligible diagnoses reported on 17 million chart reviews
submitted by 426 MAOs (hereafter referred to as the MAOs reviewed) to
calculate the impact on risk-adjusted payments for 2017.26 Appendix A contains
a detailed description of our methodology.
Financial Impact of Chart Reviews
To determine the financial impact of diagnoses reported only on chart reviews
in the encounter data, we calculated the net difference between the amount of
increased payments from chart reviews that added diagnoses and the amount
of decreased payments from chart reviews that deleted diagnoses.
Increased Payments From Chart Reviews. To estimate the amount of increased
payments from chart reviews, we identified beneficiaries who had
risk-adjustment-eligible diagnoses reported on chart reviews that were not
reported on any service records in 2016.27, 28 We used the 2017 CMS-HCC
model to identify the HCCs that would not have been generated if MAOs had
not added these diagnoses. For each HCC, we calculated the increased
25 We use the term MA plan to represent each unique combination of an MA contract number
and plan number.
26 Out of the 40.6 million chart reviews that added risk-adjustment-eligible diagnoses for
beneficiaries included in our review, 16.8 million chart reviews contained diagnoses found only on
chart reviews and not on any service records. An additional 273,118 chart reviews deleted
diagnoses from service records, resulting in a total of 17 million chart reviews analyzed for
risk-adjusted payment.
27 MAOs may submit a chart review to the encounter data when a provider documents more
diagnoses than the maximum number of diagnoses allowable on a service record. Our evaluation
excluded chart reviews that MAOs linked to accepted service records that contained the
maximum number of diagnoses allowable on a service record.
28 For beneficiaries with diagnoses reported on chart reviews with dates of service in the last
quarter of 2016 (October through December), we ensured that the diagnoses were not reported
on any service records with service dates in the first quarter of 2017 (January through March).

Billions in Estimated Medicare Advantage Payments From Chart Reviews Raise Concerns 8
OEI-03-17-00470
risk-adjusted payment by multiplying the MA plan’s base payment rate by the
HCC’s relative factor. Our calculations are reasonable payment estimates if the
MAOs submitted the same risk-adjustment-eligible diagnoses reported on chart
reviews to the RAPS as they submitted to the MA encounter data system. We
cannot confirm this because there is no mechanism to identify which diagnoses
came from chart reviews in RAPS. However, MAOs are required to submit
complete and accurate data to each system. Furthermore, it is in an MAO’s
financial interest to submit all eligible diagnoses to both systems to maximize its
resulting risk-adjusted payment.
We summarized the number and type of HCCs that increased payments and
compared our list of HCCs to the high-risk HCCs that CMS identified for 2014.29
We also checked for variation across MAOs and their parent organizations to
see if certain MAOs and parent organizations had higher or lower amounts of
risk-adjusted payments due to diagnoses reported only on chart reviews.30 We
performed these same analyses separately for the subset of diagnoses reported
only on unlinked chart reviews.
Decreased Payments From Chart Reviews. To estimate the amount of
decreased payments from chart reviews, we identified beneficiaries who had
risk-adjustment-eligible diagnoses deleted by chart reviews. We removed these
diagnoses from the previously accepted service records identified by the MAOs
and determined the HCCs that would have been generated if the MAOs had
not deleted these diagnoses. We calculated the amount of decreased
payments associated with these HCCs and reviewed MAO variation by using the
same methods as outlined above for our analysis of increased payments.
CMS Oversight of the Financial Impact of Chart Reviews
To identify the actions taken by CMS to review the impact of chart reviews on
MA risk-adjusted payments, we analyzed CMS’s responses to a structured
questionnaire and reviewed documentation related to:
• instructions, procedures, and policies CMS has in place to review the
financial impact of chart reviews using MA encounter data, RADV audits,
and/or any other data sources;
• the use of encounter data, RADV audits, or any other data sources to
track and analyze the care provided to MA beneficiaries for diagnoses
added by chart reviews;
• the kinds of issues, if any, identified by CMS related to the financial
impact of chart reviews; and
• descriptions of whether and how concerns regarding the financial
impact of chart reviews were addressed by CMS.
29 We used HCCs that CMS identified as at high risk for payment errors for 2014, the most recent
year for which CMS identified high-risk HCCs. CMS, High-Risk Hierarchal Condition Categories,
November 2017.
30 A parent organization is an entity that owns or has controlling interest in one or more MAOs.
Billions in Estimated Medicare Advantage Payments From Chart Reviews Raise Concerns 9
OEI-03-17-00470
Limitations
We did not review CMS’s final payment data to MAOs for 2017. In addition, we
estimated risk-adjusted payments that resulted from chart reviews based solely
on diagnoses contained in the MA encounter data. We did this because there is
no method to identify which diagnoses in the RAPS data are from chart reviews.
CMS’s actual risk-adjusted payments to MAOs incorporate diagnoses from both
RAPS and encounter data. For 2017, CMS calculated a blended risk score for
each beneficiary by combining 25 percent of the risk score calculated from
diagnoses in the encounter data and 75 percent of the risk score calculated
from diagnoses in the RAPS data. Because CMS requires MAOs to submit
records of all services provided for beneficiaries to the encounter data system,
MAOs should submit the same risk-adjustment-eligible diagnoses in both the
RAPS and encounter data. However, if MAOs submitted any
risk-adjustment-eligible diagnoses from chart reviews only to the RAPS or only
to the encounter data system, our payment estimates could underestimate or
overestimate the actual risk-adjusted payments resulting solely from diagnoses
on chart reviews.
CMS bases risk-adjusted payments for a given year on diagnoses from specified
face-to-face visits provided to the beneficiary in the previous year. Thus, we
estimated the potential impact of chart reviews on the MA program for 2017 by
using the encounter data submitted by MAOs for 2016. CMS’s actual monthly
payments to MAOs may change each month if there are changes in certain
beneficiary characteristics, such as long-term institutional status, dual-eligibility
status, and county of residence. For analytic efficiency, our analysis calculated
payment estimates for the entire year using encounter data and beneficiaries’
characteristics as of January 2016. We believe that selecting a point in time
resulted in reasonable payment estimates because changes to these
characteristics during the year can cause both payment increases, and payment
decreases, which could balance out across the population. We also assumed
that 2016 MA beneficiaries remained enrolled in MA in 2017.
We also did not determine whether diagnoses reported only on chart reviews
were supported by documentation in beneficiaries’ medical records. Finally, we
did not determine whether each MAO had submitted all required encounter
records.
Standards We conducted this study in accordance with the Quality Standards for Inspection
and Evaluation issued by the Council of the Inspectors General on Integrity and
Efficiency.

Billions in Estimated Medicare Advantage Payments From Chart Reviews Raise Concerns 10
OEI-03-17-00470
FINDINGS
Although chart reviews can be a tool that MAOs can use to strengthen payment
accuracy by adding and deleting beneficiaries’ diagnoses, MAOs almost
exclusively added diagnoses as a result of their chart reviews. Thus, chart
reviews rarely resulted in decreased payments to the MAOs. As Exhibit 3 shows,
0.7 percent of the chart reviews reviewed deleted incorrect diagnoses from
previously accepted service records compared to the 99.3 percent that added
diagnoses. For 2017, only 218 MAOs submitted chart reviews that deleted
diagnoses. The deleted diagnoses decreased MA payments by an estimated
$196.5 million.
Less than 1 percent
of chart reviews
deleted risk-
adjustment-eligible
diagnoses from the
MA encounter data
for payment year
2017
Exhibit 3: MAOs almost always used chart reviews as a tool to add,
rather than to delete, diagnoses for risk adjustment, resulting in
increased payments to MAOs
Source: OIG analysis of 2016 MA encounter data from CMS’s IDR.
0% 25% 50% 75% 100%Percent of Chart Reviews
Deleted Diagnoses Added Diagnoses
Overall, 48 percent of the MAOs that had increased risk-adjusted payments
from chart reviews did not use a single chart review to delete an incorrect
risk-adjustment-eligible diagnosis. The highest amount of increased payments
solely from chart reviews for a single MAO was an estimated $507.3 million.
This MAO had only an estimated $779,508 in decreased payments from chart
reviews, a ratio of $651 to $1. Payments to 201 MAOs that exclusively used chart
reviews to increase payments (and never to decrease payments) totaled an
estimated $1.6 billion.

Billions in Estimated Medicare Advantage Payments From Chart Reviews Raise Concerns 11
OEI-03-17-00470
Diagnoses that
MAOs reported only
on chart reviews,
and not on any
service records,
resulted in an
estimated
$6.7 billion in
risk-adjusted
payments for 2017
Diagnoses that MAOs reported only on chart reviews in the encounter data
totaled an estimated $6.7 billion in risk-adjusted payments for 2017.31 Chart
reviews that added diagnoses increased risk-adjusted payments by an
estimated $6.9 billion, as shown in Exhibit 4. Chart reviews that deleted
diagnoses decreased risk-adjusted payment by $196.5 million, resulting in net
payments of $6.7 billion.
Exhibit 4: For 2017, increased risk-adjusted payments from chart
reviews that added diagnoses far exceeded decreased payments from
chart reviews that deleted diagnoses
-$196.5 Million$6.9 Billion
Payments from Chart Reviews
Increased Payments Decreased Payments
Source: OIG estimation of 2017 payment amounts using 2016 MA encounter data from CMS’s IDR.
For the beneficiaries reviewed, MAOs submitted 40.6 million chart reviews to
add risk-adjustment-eligible diagnoses. For 16.8 million, or 41 percent, of these
chart reviews, there were no service records of visits, procedures, tests, or
supplies that contained the diagnosis reported on the chart review. This means
that, for the entire year, these beneficiaries may not have received any other
services for the medical conditions indicated by the diagnoses. However, we
estimated that Medicare paid MAOs billions in MA risk-adjusted payments to
provide care for these beneficiaries.
Overall, 426 MAOs used chart reviews to add and/or delete
risk-adjustment-eligible diagnoses in the encounter data. Almost all of these
MAOs (410 of 426) had a payment resulting solely from chart reviews, as shown
in Exhibit 5.32 For these 410 MAOs, risk-adjusted payments due solely to
diagnoses reported on chart reviews varied significantly, ranging from a high of
$506.6 million to a low of $195 across MAOs. Ten MAOs drove almost a third of
these risk-adjusted payments, totaling an estimated $2.2 billion. Of the
137 parent organizations reviewed, 10 parent organizations drove 79 percent of
31 Risk-adjustment-eligible diagnoses reported by MAOs in the encounter data should be
reported in the RAPS data. However, if MAOs submitted any risk-adjustment-eligible diagnoses
from chart reviews only in the RAPS or only in the encounter data system, our payment estimates
could underestimate or overestimate the actual risk-adjusted payments resulting solely from
diagnoses on chart reviews. If all the diagnoses included in our analysis were submitted only in
the encounter data and not in the RAPS data, actual risk-adjusted payments resulting solely from
chart reviews would total an estimated $1.7 billion.
32 Eight MAOs had net decreases in risk-adjusted payments from diagnoses reported on chart
reviews. An additional 8 of the 426 MAOs reported risk-adjustment-eligible diagnoses on chart
reviews that did not impact their payments.
Billions in Estimated Medicare Advantage Payments From Chart Reviews Raise Concerns 12
OEI-03-17-00470
the risk-adjusted payments from chart reviews. These 10 parent organizations
enrolled 70 percent of MA beneficiaries.
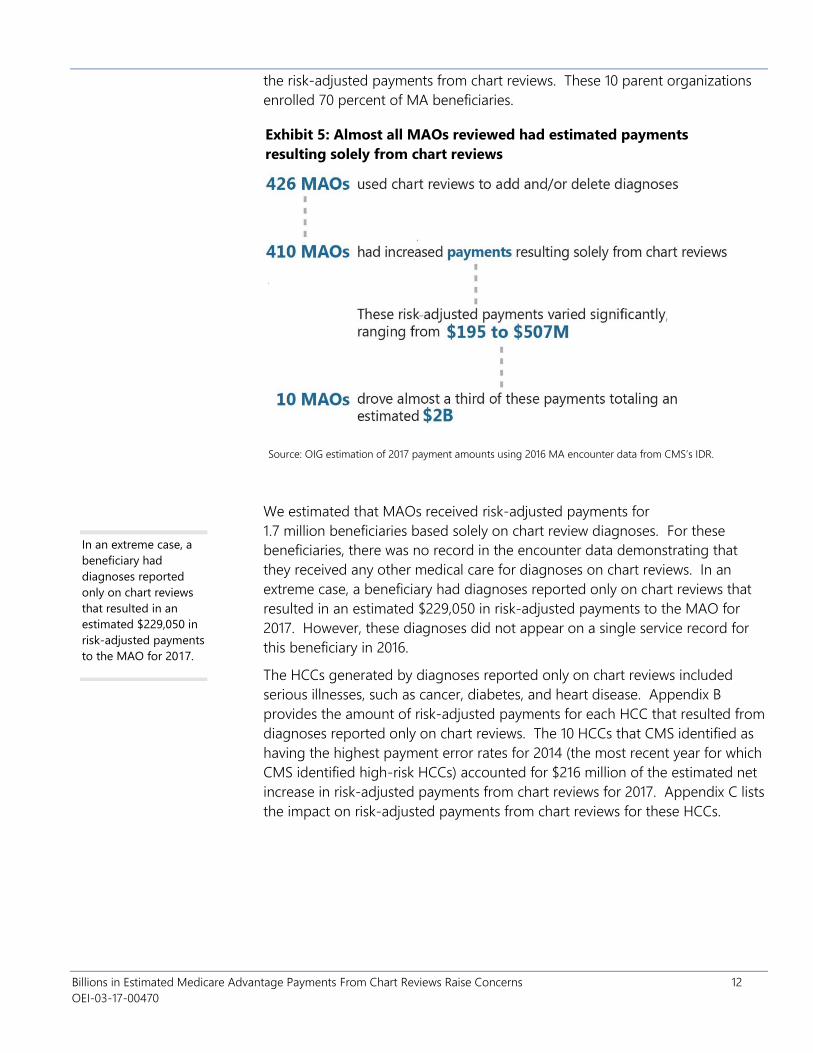
Exhibit 5: Almost all MAOs reviewed had estimated payments
resulting solely from chart reviews
Source: OIG estimation of 2017 payment amounts using 2016 MA encounter data from CMS’s IDR.
We estimated that MAOs received risk-adjusted payments for
1.7 million beneficiaries based solely on chart review diagnoses. For these
beneficiaries, there was no record in the encounter data demonstrating that
they received any other medical care for diagnoses on chart reviews. In an
extreme case, a beneficiary had diagnoses reported only on chart reviews that
resulted in an estimated $229,050 in risk-adjusted payments to the MAO for
2017. However, these diagnoses did not appear on a single service record for
this beneficiary in 2016.
The HCCs generated by diagnoses reported only on chart reviews included
serious illnesses, such as cancer, diabetes, and heart disease. Appendix B
provides the amount of risk-adjusted payments for each HCC that resulted from
diagnoses reported only on chart reviews. The 10 HCCs that CMS identified as
having the highest payment error rates for 2014 (the most recent year for which
CMS identified high-risk HCCs) accounted for $216 million of the estimated net
increase in risk-adjusted payments from chart reviews for 2017. Appendix C lists
the impact on risk-adjusted payments from chart reviews for these HCCs.
In an extreme case, a
beneficiary had
diagnoses reported
only on chart reviews
that resulted in an
estimated $229,050 in
risk-adjusted payments
to the MAO for 2017.
- ,

Billions in Estimated Medicare Advantage Payments From Chart Reviews Raise Concerns 13
OEI-03-17-00470
CMS based an
estimated
$2.7 billion in
risk-adjusted
payments on chart
review diagnoses
that MAOs did not
link to any service
provided to the
beneficiary
Diagnoses that MAOs reported only on unlinked chart reviews (i.e., those that
add diagnoses to the encounter data without identifying the specific item or
service associated with the diagnoses) generated an estimated $2.7 billion in
risk-adjusted payments for 2017.33 This amount represents 41 percent of the
estimated $6.7 billion in net risk-adjusted payments from diagnoses only on
chart reviews. Estimated payments to MAOs for diagnoses reported only on
unlinked chart reviews ranged from a high of $146.4 million to a low of $2,346.
Seven MAOs drove almost a quarter of these payments, totaling an estimated
$650.9 million. Among parent organizations, 10 parent organizations drove
two-thirds of all payments resulting from unlinked chart reviews, totaling an
estimated $1.8 billion.
For a diagnosis to be eligible for risk adjustment, it must be (1) documented in a
medical record from a hospital inpatient stay, hospital outpatient visit, or a visit
with an eligible healthcare professional during the prior year; and
(2) documented as a result of a face-to-face visit between the beneficiary and
the provider.34 However, as a result of our encounter data analysis, we estimate
that CMS based billions in risk-adjusted payments on diagnoses that MAOs did
not link to a specific face-to-face visit provided to the beneficiary. Although
CMS allows unlinked chart reviews, the extent to which MAOs used them to
drive higher risk-adjusted payments raises concerns about why so many chart
reviews were not linked back to the service from which the MAO used the
medical record to support the chart review diagnoses.
Although CMS uses procedure codes to identify which diagnoses in the
encounter data are eligible for inclusion in risk adjustment, CMS allows MAOs to
enter any procedure code of their choosing as a default procedure code on
unlinked chart reviews. MAOs are allowed to do this when they are unable to
determine the actual procedure code documented by the provider for services
with the diagnoses. MAOs are not allowed to use default procedure codes on
other service records that are used for risk adjustment. For the unlinked chart
reviews where procedure codes are used to identify diagnoses for risk
adjustment, we found that 67 percent (5.3 million of 7.9 million) contained
default procedure codes—suggesting that MAOs were unable to determine the
actual procedure code associated with the chart review, for the majority of
services with these diagnoses.
33 If all the diagnoses included in our analysis were submitted only in the encounter data and not
in the RAPS data, the actual risk-adjusted payments resulting solely from unlinked chart reviews
would total an estimated $676.8 million.
34 CMS, Medicare Managed Care Manual, Pub. No. 100-16 (Rev. 118, September 19, 2014),
ch. 7, § 40. Accessed at https://www.cms.gov on December 17, 2018.
Billions in Estimated Medicare Advantage Payments From Chart Reviews Raise Concerns 14
OEI-03-17-00470
Allowing MAOs to submit default procedure codes on chart reviews creates an
opportunity for MAOs to circumvent the face-to-face visit requirement for risk
adjustment. CMS instructs MAOs not to use default procedure codes that
would trigger an adjustment when diagnoses are not from
risk-adjustment-eligible services. However, CMS does not have safeguards in
place to ensure that MAOs comply with this requirement. The decision as to
which default procedure code to submit is left entirely up to the MAO. As such,
nothing prevents an MAO from receiving payment for a diagnosis that is not
risk-adjustment-eligible when it chooses to submit a default procedure code
that is risk-adjustment-eligible.
The diagnoses that MAOs reported only on unlinked chart reviews
corresponded to some serious and chronic health conditions
Unlinked chart reviews that resulted in risk-adjusted payments provided the
only source of diagnoses associated with some serious and chronic medical
conditions for beneficiaries. There were no service records in the encounter
data of visits, procedures, tests, or supplies that contained the diagnoses
reported on these unlinked chart reviews. This means that these beneficiaries
may not have received services throughout 2016 for the medical conditions
indicated by the diagnoses. For 105,607 beneficiaries, diagnoses that MAOs
reported only on unlinked chart reviews corresponded to having vascular
disease. However, their MAOs did not identify which service record was
associated with these diagnoses and there were no service records directly
demonstrating that they received treatment for these serious health diagnoses.
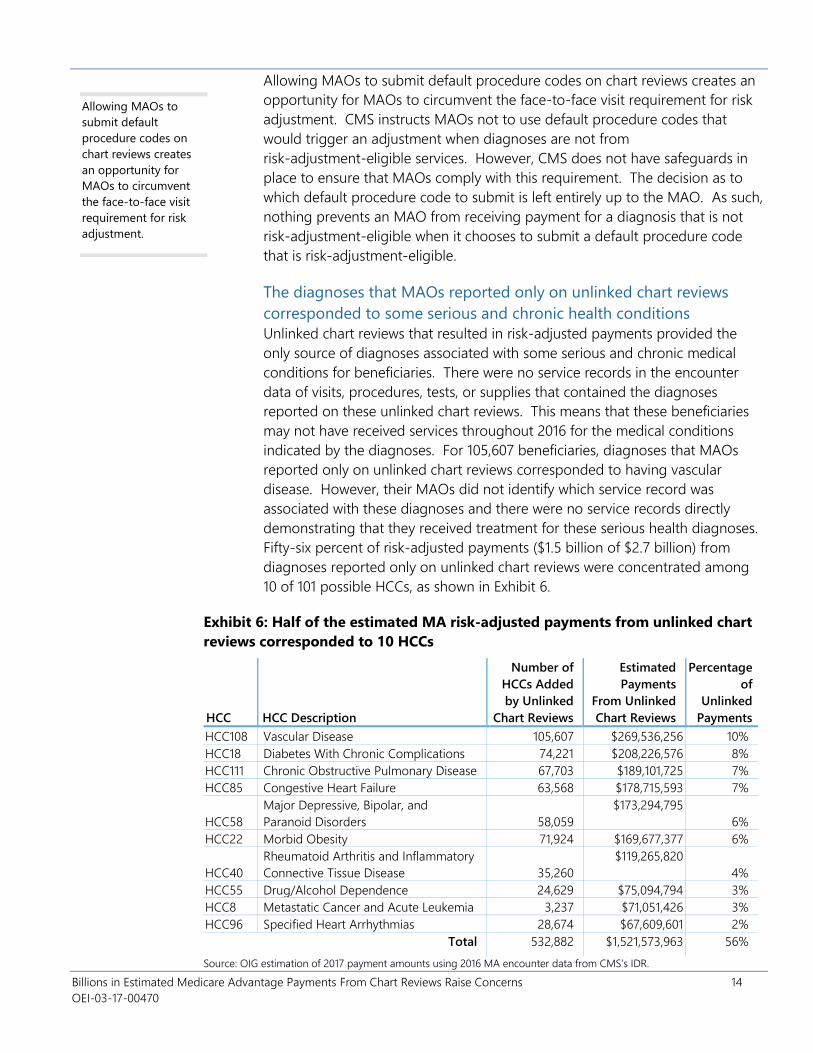
Fifty-six percent of risk-adjusted payments ($1.5 billion of $2.7 billion) from
diagnoses reported only on unlinked chart reviews were concentrated among
10 of 101 possible HCCs, as shown in Exhibit 6.
Exhibit 6: Half of the estimated MA risk-adjusted payments from unlinked chart
reviews corresponded to 10 HCCs
HCC HCC Description
Number of
HCCs Added
by Unlinked
Chart Reviews
Estimated
Payments
From Unlinked
Chart Reviews
Percentage
of
Unlinked
Payments
HCC108 Vascular Disease 105,607 $269,536,256 10%
HCC18 Diabetes With Chronic Complications 74,221 $208,226,576 8%
HCC111 Chronic Obstructive Pulmonary Disease 67,703 $189,101,725 7%
HCC85 Congestive Heart Failure 63,568 $178,715,593 7%
HCC58
Major Depressive, Bipolar, and
Paranoid Disorders 58,059
$173,294,795
6%
HCC22 Morbid Obesity 71,924 $169,677,377 6%
HCC40
Rheumatoid Arthritis and Inflammatory
Connective Tissue Disease 35,260
$119,265,820
4%
HCC55 Drug/Alcohol Dependence 24,629 $75,094,794 3%
HCC8 Metastatic Cancer and Acute Leukemia 3,237 $71,051,426 3%
HCC96 Specified Heart Arrhythmias 28,674 $67,609,601 2%
Total 532,882 $1,521,573,963 56%
Allowing MAOs to
submit default
procedure codes on
chart reviews creates
an opportunity for
MAOs to circumvent
the face-to-face visit
requirement for risk
adjustment.
Source: OIG estimation of 2017 payment amounts using 2016 MA encounter data from CMS’s IDR.
Billions in Estimated Medicare Advantage Payments From Chart Reviews Raise Concerns 15
OEI-03-17-00470
Almost a third of MAOs reviewed had estimated risk-adjusted
payments driven by only unlinked chart reviews, totaling nearly
$1 billion
For 125 of 426 MAOs, diagnoses reported only on unlinked chart reviews drove
all of their risk-adjusted payments from chart reviews. Risk-adjusted payments
for these 125 MAOs totaled an estimated $986.5 million of the $2.7 billion in
risk-adjusted payments from unlinked chart reviews. The highest risk-adjusted
payment for a single MAO based solely on unlinked chart reviews totaled an
estimated $146.4 million. For 33 MAOs, all risk-adjusted payments resulted
from linked chart reviews. For 258 MAOs, risk-adjusted payments resulted from
a combination of linked and unlinked chart reviews. The remaining 10 MAOs
did not increase their risk-adjusted payments from diagnoses reported only on
chart reviews.
CMS does not require MAOs to link chart reviews to service records
due to concerns of burden on MAOs
According to CMS’s responses to our questionnaire, it would be extraordinarily
burdensome for some MAOs to link information collected from annual or
periodic chart reviews with the claims information the MAOs continuously
collect from providers in their electronic databases. CMS reported that the
process of linking findings from chart reviews to claims information is difficult to
automate and thus can be labor-intensive. The burden may differ among plans,
requiring some to overhaul data collection systems or billing systems. In
addition, CMS noted that in some cases, beneficiaries’ medical record
documentation may not contain sufficient information to identify the previously
accepted service record associated with the diagnosis. CMS stated concern that
requiring MAOs to submit linked chart reviews to the service record may limit
the completeness of the submitted data.
Despite CMS’s concerns about the burden of linking chart reviews, more than a
third of MAOs (156 of 426) reviewed linked all or most of their chart reviews to
service records. We found that 32 of these MAOs were able to link all of their
chart reviews to service records. An additional 124 MAOs linked at least
75 percent of their chart reviews to service records, as shown in Exhibit 7.
The highest
risk-adjusted payment
for a single MAO
based solely on
unlinked chart reviews
totaled an estimated
$146.4 million.

Billions in Estimated Medicare Advantage Payments From Chart Reviews Raise Concerns 16
OEI-03-17-00470
Exhibit 7: Despite CMS’s concerns about the burden of linking chart
reviews, more than a third of MAOs linked all or most of their chart
reviews to service records1
Source: OIG analysis of 2016 MA encounter data from CMS’s IDR.1 This analysis is based on the 17 million
chart reviews submitted by MAOs (i.e., contract numbers) included in this review.
8%
29%
38%
25%
MAOs that linked all chart
reviews
MAOs that linked some, but
less than 75% of chart reviews
MAOs that did not link any
chart reviews
MAOs that linked at least 75%,
but not all chart reviews
Although limited to
a small number of
beneficiaries, almost
half of MAOs had
payments from
unlinked chart
reviews where there
was not a single
record of a service
being provided to
the beneficiary in all
of 2016
Almost half of MAOs (196 of 426) received risk-adjusted payments based on
diagnoses from unlinked chart reviews where not a single item or service was
provided to the beneficiary by the MAO in 2016. These MAOs submitted only
unlinked chart reviews and no service records for 4,616 beneficiaries. CMS
states that a chart review must be based on a review of the medical record for a
service or item provided to the beneficiary during a face-to-face encounter. For
the 4,616 beneficiaries with no service records for the year, the source of the
chart reviews is unclear. These chart reviews resulted in an estimated
$21.9 million in risk-adjusted payments for 2017. Most of these payments
($18.4 million) were concentrated among 35 MAOs and the top 6 MAOs
accounted for half ($11.8 million) of these payments. One MAO submitted only
unlinked chart reviews and no service records for 4 percent of its beneficiaries,
resulting in $3.9 million in risk-adjusted payments.
Although CMS has instructed all MAOs that a chart review should not be the
only record in the MA encounter data that contains information about an item
or service provided to a beneficiary, CMS does not verify MAOs’ compliance
with this instruction. The total lack of any record aside from an unlinked chart
review that triggered a risk-adjusted payment raises concerns that these MAOs:
• may not have ensured that the MA encounter data contains all records
of items and services provided to beneficiaries,
• may not have provided appropriate treatments and services to
MA beneficiaries who have serious and chronic health problems, or
• may have submitted diagnoses on the chart review that were not
documented in the beneficiary’s medical record—and, therefore, may
have received inappropriate payments from CMS.

Billions in Estimated Medicare Advantage Payments From Chart Reviews Raise Concerns 17
OEI-03-17-00470
CMS has not
validated diagnoses
or reviewed the
financial impact of
diagnoses reported
on chart reviews in
the encounter data
At the time of this review, CMS had not performed audits that validate the
diagnoses reported on chart reviews in the encounter data against beneficiaries’
medical record documentation to identify the extent to which overpayments
resulted from these diagnoses. CMS had not yet conducted audits of
2015 risk-adjusted payments, which is the first payment year that CMS
incorporated diagnoses from encounter data along with RAPS data. However,
CMS reported that it plans to begin audits of 2015 risk-adjusted payments later
this year.
Although CMS has the ability to identify which diagnoses in the encounter data
were added or deleted by MAOs as the result of chart reviews, CMS has not
used—and has no plans to use—the encounter data to review the financial
impact of chart reviews on risk-adjusted payments to MAOs. For example, CMS
has not determined the increase or decrease in MA payments due to chart
reviews. Also, CMS has not assessed variation across MAOs in their chart review
submissions. According to CMS, there is no reason to conduct such reviews
because linked and unlinked chart reviews are acceptable methods to submit
risk-adjustment-eligible diagnoses. CMS also has not tracked or analyzed the
care provided to beneficiaries who had diagnoses added only through chart
reviews.

Billions in Estimated Medicare Advantage Payments From Chart Reviews Raise Concerns 18
OEI-03-17-00470
CONCLUSION AND RECOMMENDATIONS
The risk adjustment program is an important mechanism for accurately
reimbursing MAOs based on the differences in health status across
beneficiaries. It levels the playing field for MA organizations (MAOs) that enroll
sicker beneficiaries who need a more costly level of care. This helps to ensure
that sicker beneficiaries have continued access to MA plans. Chart reviews can
be a tool to improve the accuracy of risk-adjusted payments by allowing MAOs
to add and delete diagnoses in the encounter data based on reviews of
patients’ records. We found that MAOs’ chart reviews almost always resulted in
added diagnoses (over 99 percent of chart reviews), and almost never deleted
diagnoses (less than 1 percent).
CMS uses the diagnoses from chart reviews to determine risk-adjusted
payments―as long as the diagnoses are based on a face-to-face visit between
beneficiaries and their providers. Diagnoses that MAOs reported only on chart
reviews—and not on any service records—resulted in an estimated $6.7 billion
in risk-adjusted payments for 2017.
Of the $6.7 billion in risk-adjusted payments, CMS based an estimated
$2.7 billion on diagnoses that MAOs did not link to any service provided to the
beneficiary in 2016. Allowing unlinked chart reviews provides opportunities for
MAOs to circumvent CMS’ face-to-face requirement and inflate risk-adjusted
payments inappropriately. Although limited to a small number of beneficiaries,
almost half of MAOs reviewed had risk-adjusted payments from unlinked chart
review for beneficiaries where there was not a single record of any service being
provided to them in all of 2016. For beneficiaries with unlinked chart reviews,
and no records of services in all of 2016, it is not at all clear what services were
used to generate diagnoses added on these chart reviews.
These findings raise three types of potential concerns. First, there may be a
data integrity concern that MAOs are not submitting all service records as
required. Second, there may be a payment integrity concern if diagnoses are
inaccurate or unsupported—making the associated risk-adjusted payments
inappropriate. Third, there may be a quality of care concern that beneficiaries
are not receiving needed services for potentially serious diagnoses listed on
chart reviews but no service records. Despite the potential for MAOs to misuse
chart reviews, CMS has not yet validated the diagnoses reported on chart
reviews and has not reviewed the financial impact of chart reviews on
risk-adjusted payments.
We understand that MAOs need a mechanism to add diagnoses to the
encounter data that providers have neglected to include in the service
information submitted to the MAO. However, in the absence of monitoring and
oversight by CMS, our findings raise questions about the vulnerabilities
associated with using chart reviews, particularly unlinked chart reviews, as this
mechanism.

Billions in Estimated Medicare Advantage Payments From Chart Reviews Raise Concerns 19
OEI-03-17-00470
Based on these findings we recommend that CMS:
Provide targeted oversight of MAOs that had risk-adjusted
payments resulting from unlinked chart reviews for beneficiaries
who had no service records in the 2016 encounter data
CMS should take actions to perform targeted oversight of MAOs that had
risk-adjusted payments from unlinked chart reviews for beneficiaries who had
no service records whatsoever in the 2016 encounter data. To do this, OIG will
provide CMS with a list of the 4,616 beneficiaries who had unlinked chart
reviews and no records to show that any services were provided in all of 2016.
CMS should use this information to perform targeted reviews of the MAOs who
had payments resulting from these beneficiaries’ unlinked chart reviews. These
reviews could include outreach to the MAOs to determine whether they
submitted records for all services, as required. If CMS identifies problems with
the completeness of these MAOs’ encounter data submissions, or if CMS
identifies that an MAO submitted a chart review without a service to support
the creation of that chart review, CMS should take action to remedy these
problems.
Conduct audits that validate diagnoses reported on chart reviews
in the MA encounter data
Risk-adjusted payments for diagnoses reported only on chart reviews raise
concerns regarding payment integrity. Risk-adjustment data validation audits
provide an important opportunity for CMS to determine whether diagnoses
reported in the MA encounter data that resulted in risk-adjusted payments were
supported by medical record documentation. CMS began collecting the
encounter data in 2012 and began using diagnoses from the encounter data for
calculating 2015 risk-adjusted payments. CMS has not yet conducted RADV
audits of 2015 payments. CMS should incorporate risk-adjustment-eligible
diagnoses from the MA encounter data, including chart reviews, into
contract-level RADV audits of 2015 payments. In addition, CMS should ensure
that audits include a representative sample of diagnoses reported on chart
reviews. After conducting these contract-level RADV audits and any other
assessments of chart reviews, CMS should take steps to mitigate any
vulnerabilities identified in its audits and oversight of chart reviews. For
example, CMS might flag certain diagnoses or MAOs for enhanced review.
Reassess the risks and benefits of allowing chart reviews that are
not linked to service records to be used as sources of diagnoses for
risk adjustment
Identifying the service associated with diagnoses reported on chart reviews is
critical to safeguard the integrity of MA payments and ensure that MA
beneficiaries receive needed care. CMS should use data gathered during
risk-adjustment data validation audits and targeted MA reviews to determine
the impact of unlinked chart reviews on MA data integrity and overpayments. If
contract-level RADV audits do not include a sufficient number of beneficiaries

Billions in Estimated Medicare Advantage Payments From Chart Reviews Raise Concerns 20
OEI-03-17-00470
with diagnoses reported only on unlinked chart reviews, CMS should conduct a
separate review of unlinked chart reviews. These audits and/or reviews should
identify the risks and benefits associated with unlinked chart reviews by
(1) determining the validity of diagnoses reported only on unlinked chart
reviews, (2) analyzing the care provided to beneficiaries for diagnoses
documented only on unlinked chart reviews, (3) assessing the completeness of
encounter data service records submitted by MAOs for beneficiaries with
unlinked chart reviews, and (4) measuring the potential burden to MAOs of
linking all chart reviews.
After assessing the risks and benefits, CMS should reconsider allowing MAOs to
submit unlinked chart reviews. If CMS ultimately demonstrates that the benefits
of allowing unlinked chart reviews outweigh the risks, CMS should conduct an
additional assessment to determine the risks and benefits of eliminating the use
of default procedure codes on chart reviews.

Billions in Estimated Medicare Advantage Payments From Chart Reviews Raise Concerns 21
OEI-03-17-00470
AGENCY COMMENTS AND OIG RESPONSE
CMS concurred with all three of our recommendations. However, in reference
to our finding that diagnoses reported only on chart reviews resulted in an
estimated $6.7 billion in risk-adjusted payments for 2017,35 CMS stated that this
payment estimate seems inaccurate because we only used encounter data and
did not apply CMS’s blended calculation using the RAPS data. As noted in the
report, there is no method to identify which diagnoses in the RAPS data are
from chart reviews. We believe our calculations resulted in reasonable payment
estimates because CMS requires MAOs to submit the same
risk-adjustment-eligible diagnoses in both RAPS and encounter data. If MAOs
submitted any risk-adjustment-eligible diagnoses from chart reviews only in the
RAPS or only in the encounter data system, our payment estimates could
underestimate or overestimate the actual risk-adjusted payments resulting
solely from diagnoses on chart reviews, as we noted in our findings and
methodology. In a scenario in which all of the diagnoses included in our
analysis were submitted only in the encounter data and not in the RAPS data,
the actual risk-adjusted payments resulting solely from chart reviews would
total an estimated $1.7 billion. However, such a discrepancy between the RAPS
and the encounter data would raise serious concerns regarding the integrity of
MA risk adjustment data.
In response to our first recommendation, CMS stated that it will review the
beneficiaries we identified as having unlinked chart reviews and no service
records in the 2016 encounter data. CMS will provide targeted outreach to the
MAOs where these beneficiaries were enrolled, if appropriate. CMS noted that
it will also provide targeted outreach to MAOs that submitted unlinked chart
reviews but no service records for beneficiaries that CMS identified in the
2018 encounter data.
In response to our second recommendation, CMS agreed to include diagnoses
submitted on chart reviews in the MA encounter data in their RADV audits
beginning with payment year 2015. CMS stated that it anticipates launching
payment year 2015 RADV audits in late 2019.
Finally, in response to our third recommendation, CMS noted that it will
conduct a review of unlinked chart reviews to determine whether they should
be used as sources of diagnoses for risk adjustment. CMS will use RADV audits
to determine whether beneficiaries have the diagnoses that were reported on
unlinked chart reviews. In addition, CMS will analyze the extent to which the
2018 encounter data include the service records associated with unlinked chart
35 CMS’s comments reference $6.6 billion in risk-adjustment payments for diagnoses resulting
only from chart reviews, as that was our preliminary calculation in the draft report that CMS
reviewed. In our final calculations, that estimate is $6.7 billion.

Billions in Estimated Medicare Advantage Payments From Chart Reviews Raise Concerns 22
OEI-03-17-00470
reviews. Finally, CMS will assess the burden to MAOs of linking chart reviews to
service records.
For the full text of CMS’s comments, see Appendix D.
Billions in Estimated Medicare Advantage Payments From Chart Reviews Raise Concerns 23
OEI-03-17-00470
APPENDIX A: Detailed Methodology
This appendix provides a more detailed description of the methodology that we
used to determine the amount of 2017 MA risk-adjusted payments that resulted
from diagnoses reported only on chart reviews with 2016 service dates. We did
not review CMS’s final 2017 risk-adjusted payments to MAOs. In addition, we
estimated risk-adjusted payments that resulted from chart reviews based solely
on diagnoses contained in MA encounter data.36 We did this because there is
no method to identify which diagnoses in the RAPS data are from chart reviews.
CMS’s actual risk-adjusted payments to MAOs incorporate diagnoses from both
RAPS and encounter data. Because CMS bases risk-adjusted payments for a
given year on diagnoses from services provided to the beneficiary in the
previous year, we estimated the potential impact of chart reviews on
2017 payments based on encounter data that MAOs submitted for 2016.
Analyses of All Chart Reviews
We determined the chart reviews that added and deleted diagnoses in the
2016 MA encounter data, as shown in Exhibit A-1 and described below.37 In
October 2018, after the September deadline for MAOs to submit data for
payment year 2017, we identified chart reviews in the 2016 MA encounter data
in CMS’s IDR as records containing:
• a claim type code between 4000 and 4800, indicating that the record is
MA encounter data;
• a claim through date between January 1, 2016, and December 31, 2016;
• a submission date between January 1, 2016, and September 14, 2018;
• a chart review switch value of “Y,” indicating that the record is a chart
review; and
• a chart review effective switch of “Y,” indicating that the record is the
most recently accepted version of the chart review.
For chart reviews that added diagnoses, we identified diagnoses reported only
on chart reviews and not on any service record in the 2016 MA encounter data.
For beneficiaries with diagnoses reported on chart reviews with dates of service
in the last quarter of 2016 (October through December), we also ensured that
the diagnoses were not reported on any service records with dates of service in
the first quarter of 2017 (January through March).
36 If MAOs reported any risk-adjustment-eligible diagnoses from chart reviews only in the RAPS or
only in the encounter data system, our payment estimates could underestimate or overestimate
the actual risk-adjusted payments resulting solely from diagnoses on chart reviews.
37 MAOs may submit a chart review to the encounter data when a provider documents more
diagnoses than the maximum number of diagnoses allowable on a service record. Therefore, we
did not include 1.3 million chart reviews that added diagnoses and were linked to accepted
service records that contained the maximum number of diagnoses allowed on a service record.
Billions in Estimated Medicare Advantage Payments From Chart Reviews Raise Concerns 24
OEI-03-17-00470
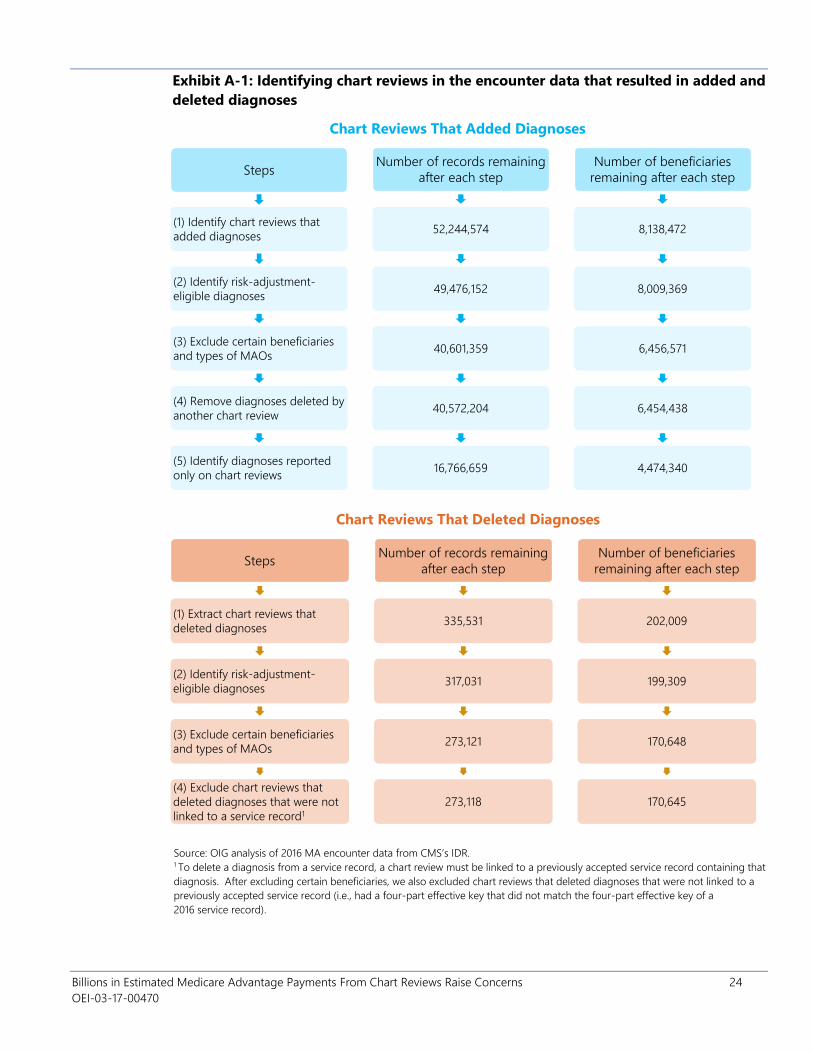
Exhibit A-1: Identifying chart reviews in the encounter data that resulted in added and
deleted diagnoses
Chart Reviews That Added Diagnoses
Steps
(1) Identify chart reviews that
added diagnoses
(2) Identify risk-adjustment-
eligible diagnoses
(3) Exclude certain beneficiaries
and types of MAOs
(4) Remove diagnoses deleted by
another chart review
(5) Identify diagnoses reported
only on chart reviews
Number of records remaining
after each step
52,244,574
49,476,152
40,601,359
40,572,204
16,766,659
Number of beneficiaries
remaining after each step
8,138,472
8,009,369
6,456,571
6,454,438
4,474,340
Chart Reviews That Deleted Diagnoses
Steps
(1) Extract chart reviews that
deleted diagnoses
(2) Identify risk-adjustment-
eligible diagnoses
(3) Exclude certain beneficiaries
and types of MAOs
(4) Exclude chart reviews that
deleted diagnoses that were not
linked to a service record1
Number of records remaining
after each step
335,531
317,031
273,121
273,118
Number of beneficiaries
remaining after each step
202,009
199,309
170,648
170,645
Source: OIG analysis of 2016 MA encounter data from CMS’s IDR. 1 To delete a diagnosis from a service record, a chart review must be linked to a previously accepted service record containing that
diagnosis. After excluding certain beneficiaries, we also excluded chart reviews that deleted diagnoses that were not linked to a
previously accepted service record (i.e., had a four-part effective key that did not match the four-part effective key of a
2016 service record).
Billions in Estimated Medicare Advantage Payments From Chart Reviews Raise Concerns 25
OEI-03-17-00470
Identification of Risk-Adjustment-Eligible Diagnoses. We then identified which
diagnoses reported on chart reviews in the MA encounter data met CMS’s
eligibility criteria for risk adjustment by using the same methods used by CMS.38
For each chart review, we identified whether it contained a
risk-adjustment-eligible claim type code (which corresponds to the type of bill
code on institutional inpatient and outpatient encounter data) and/or a
procedure code listed on CMS’s filtering list for 2016.39 Because MAOs may
submit chart reviews to delete diagnoses from a previously accepted chart
review, we also removed diagnoses added by chart reviews and subsequently
deleted by chart reviews.
Exclusion of Beneficiaries With Certain Characteristics. We excluded
beneficiaries who had end-stage renal disease, were receiving hospice care, or
did not reside in a U.S. State based on information contained in the IDR’s MA
prescription drug (MARx) data, because CMS uses different methods to
calculate these payments. We included only beneficiaries enrolled with the
same MA plan for all 12 months of 2016.40 We excluded beneficiaries with
inconsistencies between their MA encounter data, Medicare beneficiary data,
and MARx data contained in the IDR to ensure data accuracy. For example, we
did not include beneficiaries whose MAO contract number was not the same
across all three IDR data sources.
Identification of Diagnoses Reported Only on Chart Reviews. For each
beneficiary with a diagnosis added by chart reviews, we identified all of their
service records contained in the IDR’s 2016 MA encounter data. For
beneficiaries with diagnoses reported on chart reviews with a claim through
date between October 1, 2016, and December 31, 2016, we also identified all
service records that had claim through dates between January 1, 2017, and
March 31, 2017. We then compared the diagnoses reported on the chart
reviews to the diagnoses reported on the service records. We kept the
diagnoses reported on chart reviews that were not reported on any service
record in 2016 and, if applicable, the first quarter of 2017.
Identification of Linked and Unlinked Chart Reviews. We separated chart
reviews that added diagnoses into groups of linked versus unlinked chart
reviews. We identified linked chart reviews as chart reviews that contained an
original control number and had a four-part effective key that matched the
38 CMS requires risk-adjustment-eligible diagnoses to be based on a face-to-face visit between
the beneficiary and certain types of providers. CMS identifies risk-adjustment-eligible diagnoses
in the encounter data based on whether the service record contains an acceptable procedure
code and/or type of bill code. CMS, Final Encounter Data Diagnosis Filtering Logic, December
2015. Accessed at https://www.csscoperations.com on December 2, 2019.
39 CMS, 2016 Medicare Risk-Adjustment-Eligible CPT/HCPCS Codes. Accessed at
https://www.cms.gov/Medicare/Health-Plans/MedicareAdvtgSpecRateStats/Risk-Adjustors.html
on May 2, 2018.
40 We use the term MAO to represent each unique MA contract number. We excluded from our
review all cost plans, demonstration plans, PACE organizations, and Medicare medical savings
account plans.
Billions in Estimated Medicare Advantage Payments From Chart Reviews Raise Concerns 26
OEI-03-17-00470
four-part effective key of an accepted service record with a date of service in
2016.41 We considered all other chart reviews unlinked. Of the 16.8 million chart
reviews that added a risk-adjustment-eligible diagnoses code reported only on
chart reviews, 8.2 million were unlinked chart reviews. Of these, 7.9 million were
non-inpatient unlinked chart reviews (i.e., did not have a hospital inpatient type
of bill code). We determined the number of non-inpatient unlinked chart
reviews that contained default data reason code 056, indicating that the chart
review contained default procedure codes.42
Identification of HCCs Generated by Diagnoses Reported on Chart
Reviews
HCCs Added by Chart Reviews. For beneficiaries who had
risk-adjustment-eligible diagnoses reported only on chart reviews, we used the
2017 CMS-HCC model and CMS’s CMS-HCC mapping software to identify the
HCCs generated by the diagnoses reported only on chart reviews.43 To identify
these HCCs, we first mapped all of a beneficiary’s risk-adjustment-eligible
diagnoses (i.e., diagnoses reported on both service records and chart reviews)
to HCCs. Then, we mapped just the risk-adjustment-eligible diagnoses
reported on service records to HCCs. Finally, we compared the two sets of
HCCs to determine the HCCs generated from mapping the diagnoses reported
only on chart reviews.
HCCs Deleted by Chart Reviews. For beneficiaries who had a chart review that
deleted a risk-adjustment-eligible diagnosis, we identified the HCCs that would
have been generated if the MAOs had not deleted these diagnoses. To
determine these HCCs, we first mapped all of a beneficiary’s
risk-adjustment-eligible diagnoses without removing the diagnoses deleted by
chart reviews. Then, we removed the diagnoses that the chart reviews deleted
from the previously accepted service records identified by the MAOs and
mapped only the risk-adjustment-eligible diagnoses that remained for the
beneficiary. We compared the two sets of HCCs to determine the HCCs
generated from mapping the diagnoses deleted by chart reviews.
Assignment of Relative Factors to HCCs. We assigned relative factors to each
HCC based on the segment of the 2017 CMS-HCC model that applied to each
41 As instructed by CMS, we used a four-part effective key to link chart reviews to previously
accepted service records. The four-part effective key includes the claim type effective code, the
claim date signature effective key, the claim number effective key, and the geographic beneficiary
effective key.
42 For chart reviews with a hospital inpatient type of bill code, CMS does not use the procedure
codes to determine risk adjustment eligibility. Therefore, we excluded inpatient unlinked chart
reviews from this analysis.
43 CMS, Announcement of Calendar Year (CY) 2017 Medicare Advantage Capitation Rates and
Medicare Advantage and Part D Payment Policies and Final Call Letter, Table VI-1. 2017 CMS-HCC
Model Relative Factors for Community and Institutional Beneficiaries, April 2016,
p.78-84. Accessed at https://www.cms.gov on December 19, 2018; and CMS, 2017 Model
Software/ICD-10 Mappings, V2217.79.O1. Accessed at https://www.cms.gov/Medicare/Health
-Plans/MedicareAdvtgSpecRateStats/Risk-Adjustors.html on May 9, 2018.

Billions in Estimated Medicare Advantage Payments From Chart Reviews Raise Concerns 27
OEI-03-17-00470
beneficiary based on their characteristics as of January 2016. These
characteristics included the beneficiaries’ long-term institutional status, age,
original reason for Medicare entitlement, and dual-eligibility status. We used
Medicare beneficiary data from the IDR to identify beneficiaries’ age, original
reason for Medicare entitlement, and dual-eligibility status. We used MARx
data from the IDR to identify beneficiaries’ long-term institutional status. We
adjusted each HCC’s relative factor by CMS’s normalization and coding
adjustment factors for 2017 prior to calculating payment estimates.44
Calculation of Payment Estimates
We calculated estimates of the amount of increased and decreased annual
risk-adjusted payments associated with each added and deleted HCC,
respectively, by multiplying the MA plan’s monthly base payment rate by the
HCC’s relative factor. We then multiplied monthly amounts of increased or
decreased payments by 12 to determine annual payment estimates.
We determined the base payment rate for each beneficiary’s plan by using
information gathered from several data sources. For MA plans that submit bids
to CMS, we identified base payment rates for December 2017 in the Approved
Bid Pricing Tool Extract from CMS’s Health Plan Management System. For
Employer-Group Waiver Plans (EGWPs), which do not submit bids to CMS, we
identified base payment rates using CMS’s EGWP county-level rate books for
regional and local EGWPs and information on each EGWP’s star rating.45, 46 We
then determined base payment rates for each beneficiary’s plan based on each
beneficiary’s plan contract number, plan number, plan segment number, Part A
and B entitlement status, and county of residence as of January 2016 in the
MARx data.
For a small percentage of beneficiaries, we used an alternative method to
determine their plans’ base payment rates. For 11 percent of beneficiaries
included in our analysis, we calculated payment estimates based on a median
base payment rate for all non-EGWPs, instead of each plan’s actual base
payment rate. For 10.9 percent of these beneficiaries, the MA plan enrollment
information (i.e., the contract number, plan number, segment number, or
county of residence) contained in the IDR for January 2016 did not match the
44 CMS adjusts the risk score by a normalization factor and a coding-adjustment factor. The
normalization factor reduces risk scores to ensure that the average beneficiary risk score in any
given year remains 1.0, despite annual increases in risk scores. The coding adjustment factor
reduces risk scores to account for differences in coding patterns between MA and Medicare
fee-for-service.
45 CMS, 2017 Medicare Advantage Ratebook and Prescription Drug Rate Information, 2017.
Accessed at https://www.cms.gov/Medicare/Health-Plans/MedicareAdvtgSpecRateStats/
Ratebooks-and-Supporting-Data.html on January 5, 2018.
46 We identified EGWPs’ 2017 star ratings using the Approved Bid Pricing Tool Extract and the MA
Quality Bonus Payment Rating files from CMS’s Health Plan Management System.

Billions in Estimated Medicare Advantage Payments From Chart Reviews Raise Concerns 28
OEI-03-17-00470
2017 MA plan information used in our analysis.47 In addition, 0.1 percent of
beneficiaries were enrolled in an EGWP and were covered only by either
Medicare Part A or Medicare Part B (and not covered by both Medicare Parts A
and B). For these beneficiaries, we determined the median Part A and/or Part B
base payment rate for December 2017 for all plans in the Approved Bid Pricing
Tool Extract.
We conducted summary analysis of estimated payment amounts and HCCs
from linked and unlinked chart reviews. We calculated the net difference
between the amount of increased and decreased payments from chart reviews.
We summarized the number and type of HCCs that increased and decreased
payments and compared our list of HCCs to the high-risk HCCs that CMS
identified as having the highest rates of errors for 2014.48 We also checked for
variation across MAOs (i.e., contract numbers) and their parent organizations to
see if certain organizations had higher or lower payments due to diagnoses
reported on chart reviews.
47 The 2017 MA plan information used in our analysis included information from the Approved Bid
Pricing Tool Extract and the Plan Benefit Package Extract in CMS’s Health Plan Management
System, as well as CMS’s EGWP county-level rate books.
48 We used HCCs that CMS identified as at high risk for payment errors for 2014, the most recent year
of payment error data. CMS, High-Risk Hierarchal Condition Categories, November 2017.
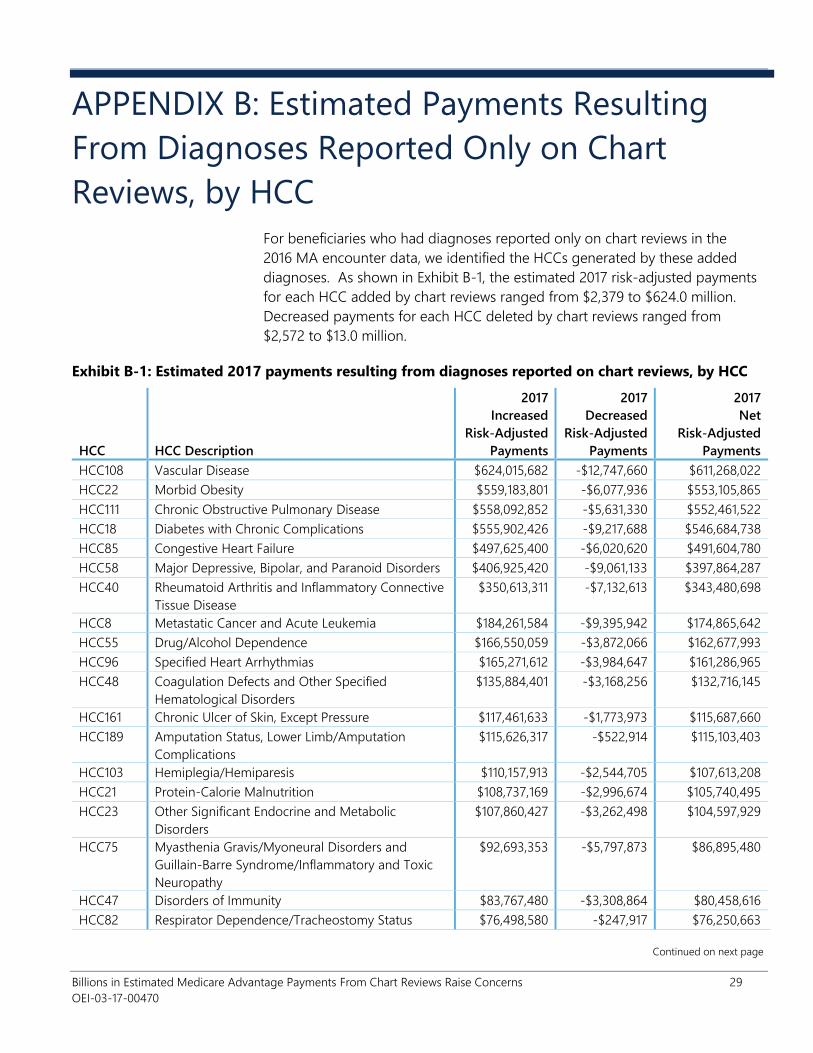
Billions in Estimated Medicare Advantage Payments From Chart Reviews Raise Concerns 29
OEI-03-17-00470
APPENDIX B: Estimated Payments Resulting
From Diagnoses Reported Only on Chart
Reviews, by HCC
For beneficiaries who had diagnoses reported only on chart reviews in the
2016 MA encounter data, we identified the HCCs generated by these added
diagnoses. As shown in Exhibit B-1, the estimated 2017 risk-adjusted payments
for each HCC added by chart reviews ranged from $2,379 to $624.0 million.
Decreased payments for each HCC deleted by chart reviews ranged from
$2,572 to $13.0 million.
Exhibit B-1: Estimated 2017 payments resulting from diagnoses reported on chart reviews, by HCC
HCC HCC Description
2017
Increased
Risk-Adjusted
Payments
2017
Decreased
Risk-Adjusted
Payments
2017
Net
Risk-Adjusted
Payments
HCC108 Vascular Disease $624,015,682 -$12,747,660 $611,268,022
HCC22 Morbid Obesity $559,183,801 -$6,077,936 $553,105,865
HCC111 Chronic Obstructive Pulmonary Disease $558,092,852 -$5,631,330 $552,461,522
HCC18 Diabetes with Chronic Complications $555,902,426 -$9,217,688 $546,684,738
HCC85 Congestive Heart Failure $497,625,400 -$6,020,620 $491,604,780
HCC58 Major Depressive, Bipolar, and Paranoid Disorders $406,925,420 -$9,061,133 $397,864,287
HCC40 Rheumatoid Arthritis and Inflammatory Connective
Tissue Disease
$350,613,311 -$7,132,613 $343,480,698
HCC8 Metastatic Cancer and Acute Leukemia $184,261,584 -$9,395,942 $174,865,642
HCC55 Drug/Alcohol Dependence $166,550,059 -$3,872,066 $162,677,993
HCC96 Specified Heart Arrhythmias $165,271,612 -$3,984,647 $161,286,965
HCC48 Coagulation Defects and Other Specified
Hematological Disorders
$135,884,401 -$3,168,256 $132,716,145
HCC161 Chronic Ulcer of Skin, Except Pressure $117,461,633 -$1,773,973 $115,687,660
HCC189 Amputation Status, Lower Limb/Amputation
Complications
$115,626,317 -$522,914 $115,103,403
HCC103 Hemiplegia/Hemiparesis $110,157,913 -$2,544,705 $107,613,208
HCC21 Protein-Calorie Malnutrition $108,737,169 -$2,996,674 $105,740,495
HCC23 Other Significant Endocrine and Metabolic
Disorders
$107,860,427 -$3,262,498 $104,597,929
HCC75 Myasthenia Gravis/Myoneural Disorders and
Guillain-Barre Syndrome/Inflammatory and Toxic
Neuropathy
$92,693,353 -$5,797,873 $86,895,480
HCC47 Disorders of Immunity $83,767,480 -$3,308,864 $80,458,616
HCC82 Respirator Dependence/Tracheostomy Status $76,498,580 -$247,917 $76,250,663
Continued on next page

Billions in Estimated Medicare Advantage Payments From Chart Reviews Raise Concerns 30
OEI-03-17-00470
Exhibit B-1: Estimated 2017 payments resulting from diagnoses reported on chart reviews, by HCC
(continued)
HCC HCC Description
2017
Increased
Risk-Adjusted
Payments
2017
Decreased
Risk-Adjusted
Payments
2017
Net
Risk-Adjusted
Payments
HCC88 Angina Pectoris $78,566,216 -$2,940,818 $75,625,398
HCC10 Lymphoma and Other Cancers $75,884,098 -$3,227,194 $72,656,904
HCC79 Seizure Disorders and Convulsions $71,524,374 -$1,002,701 $70,521,673
HCC19 Diabetes without Complication $69,256,511 -$1,379,037 $67,877,474
HCC188 Artificial Openings for Feeding or Elimination $67,633,105 -$552,126 $67,080,979
HCC46 Severe Hematological Disorders $59,967,818 -$1,406,728 $58,561,090
HCC78 Parkinson's and Huntington's Diseases $57,755,804 -$955,947 $56,799,857
HCC135 Acute Renal Failure $51,846,788 -$4,392,214 $47,454,574
HCC84 Cardio-Respiratory Failure and Shock $42,027,142 -$2,670,446 $39,356,696
HCC27 End-Stage Liver Disease $36,059,563 -$667,199 $35,392,364
HCC106 Atherosclerosis of the Extremities With Ulceration or
Gangrene
$39,197,346 -$4,030,133 $35,167,213
HCC35 Inflammatory Bowel Disease $34,397,104 -$559,974 $33,837,130
HCC107 Vascular Disease With Complications $37,873,851 -$6,254,858 $31,618,993
HCC57 Schizophrenia $31,610,792 -$220,284 $31,390,508
HCC112 Fibrosis of Lung and Other Chronic Lung Disorders $29,077,393 -$443,450 $28,633,943
HCC28 Cirrhosis of Liver $28,669,099 -$571,934 $28,097,165
HCC72 Spinal Cord Disorders/Injuries $29,090,320 -$1,470,668 $27,619,652
HCC186 Major Organ Transplant or Replacement Status $25,562,992 -$355,549 $25,207,443
HCC9 Lung and Other Severe Cancers $30,632,704 -$6,436,584 $24,196,120
HCC158 Pressure Ulcer of Skin With Full Thickness Skin Loss $23,009,366 -$902,403 $22,106,963
HCC2 Septicemia, Sepsis, Systemic Inflammatory Response
Syndrome/Shock
$22,377,064 -$1,032,119 $21,344,945
HCC77 Multiple Sclerosis $18,536,609 -$164,752 $18,371,857
HCC39 Bone/Joint/Muscle Infections/Necrosis $19,173,836 -$889,730 $18,284,106
HCC71 Paraplegia $17,651,393 -$225,207 $17,426,186
HCC124 Exudative Macular Degeneration $17,428,482 -$445,905 $16,982,577
HCC176 Complications of Specified Implanted Device or
Graft
$18,264,506 -$2,513,591 $15,750,915
HCC134 Dialysis Status $15,883,440 -$166,930 $15,716,510
HCC137 Chronic Kidney Disease, Severe (Stage 4) $15,059,826 -$608,940 $14,450,886
HCC169 Vertebral Fractures Without Spinal Cord Injury $17,340,191 -$2,990,413 $14,349,778
HCC87 Unstable Angina and Other Acute Ischemic Heart
Disease
$16,245,743 -$2,171,216 $14,074,527
HCC70 Quadriplegia $13,793,142 -$469,489 $13,323,653
HCC34 Chronic Pancreatitis $12,203,694 -$403,020 $11,800,674
HCC29 Chronic Hepatitis $12,013,143 -$388,234 $11,624,909
Continued on next page

Billions in Estimated Medicare Advantage Payments From Chart Reviews Raise Concerns 31
OEI-03-17-00470
Exhibit B-1: Estimated 2017 payments resulting from diagnoses reported on chart reviews, by HCC
(continued)
HCC HCC Description
2017
Increased
Risk-Adjusted
Payments
2017
Decreased
Risk-Adjusted
Payments
2017
Net
Risk-Adjusted
Payments
HCC122 Proliferative Diabetic Retinopathy and Vitreous
Hemorrhage
$11,954,165 -$331,571 $11,622,594
HCC104 Monoplegia, Other Paralytic Syndromes $12,037,509 -$460,910 $11,576,599
HCC12 Breast, Prostate, and Other Cancers and Tumors $12,733,378 -$2,289,158 $10,444,220
HCC33 Intestinal Obstruction/Perforation $11,279,410 -$1,122,810 $10,156,600
HCC114 Aspiration and Specified Bacterial Pneumonias $11,385,876 -$1,439,746 $9,946,130
HCC136 Chronic Kidney Disease, Stage 5 $8,370,840 -$849,894 $7,520,946
HCC6 Opportunistic Infections $7,393,274 -$585,605 $6,807,669
HCC157 Pressure Ulcer of Skin With Necrosis Through to
Muscle, Tendon, or Bone
$5,738,216 -$315,268 $5,422,948
HCC115 Pneumococcal Pneumonia, Empyema, Lung
Abscess
$5,701,524 -$358,048 $5,343,476
HCC80 Coma, Brain Compression/Anoxic Damage $5,615,122 -$644,290 $4,970,832
HCC11 Colorectal, Bladder, and Other Cancers $11,246,919 -$6,281,339 $4,965,580
HCC1 HIV/AIDS $4,438,303 -$60,778 $4,377,525
HCC86 Acute Myocardial Infarction $7,770,769 -$3,498,486 $4,272,283
HCC54 Drug/Alcohol Psychosis $4,081,699 -$90,415 $3,991,284
HCC17 Diabetes with Acute Complications $4,269,503 -$608,995 $3,660,508
HCC170 Hip Fracture/Dislocation $4,176,285 -$869,601 $3,306,684
HCC76 Muscular Dystrophy $2,880,618 -$43,896 $2,836,722
HCC110 Cystic Fibrosis $2,818,485 -$74,680 $2,743,805
HCC73 Amyotrophic Lateral Sclerosis and Other Motor
Neuron Disease
$2,646,642 -$67,279 $2,579,363
HCC167 Major Head Injury $2,669,608 -$326,694 $2,342,914
HCC74 Cerebral Palsy $2,264,214 -$25,335 $2,238,879
HCC99 Cerebral Hemorrhage $3,632,171 -$1,455,800 $2,176,371
HCC173 Traumatic Amputations and Complications $2,137,805 -$462,633 $1,675,172
HCC162 Severe Skin Burn or Condition $487,287 -$40,779 $446,508
HCC166 Severe Head Injury $103,238 -$19,067 $84,171
HCC83 Respiratory Arrest $1,286,777 -$1,400,586 -$113,809
HCC100 Ischemic or Unspecified Stroke $9,252,840 -$13,007,907 -$3,755,067
Continued on next page

Billions in Estimated Medicare Advantage Payments From Chart Reviews Raise Concerns 32
OEI-03-17-00470
Exhibit B-1: Estimated 2017 payments resulting from diagnoses reported on chart reviews, by HCC
(continued)
HCC HCC Description
2017
Increased
Risk-Adjusted
Payments
2017
Decreased
Risk-Adjusted
Payments
2017
Net
Risk-Adjusted
Payments
Disease Interactions
HCC85_gCopdCF Congestive Heart Failure*Chronic
Obstructive Pulmonary Disease Group
$153,167,321 -$1,583,709 $151,583,612
HCC85_gDiabetes
Mellit
Congestive Heart Failure*Diabetes Group $128,721,969 -$1,655,531 $127,066,438
HCC85_HCC96 Congestive Heart Failure*Specified Heart
Arrhythmias
$82,167,702 -$1,129,385 $81,038,317
HCC85_gRenal Congestive Heart Failure*Renal Group $63,949,989 -$1,803,179 $62,146,810
gRespDepandArre
_gCopdCF
Cardiorespiratory Failure Group*Chronic
Obstructive Pulmonary Disease Group
$51,995,057 -$2,217,217 $49,777,840
HCC47_gCancer Immune Disorders*Cancer Group $47,451,848 -$1,305,906 $46,145,942
gSubstanceAbuse
_gPsychiatric
Substance Abuse Group*Psychiatric Group $19,928,643 -$355,855 $19,572,788
SEPSIS_ARTIF_
OPENINGS
Sepsis*Artificial Openings for Feeding or
Elimination
$488,349 $0 $488,349
SCHIZOPHRENIA_
gCopdCF
Schizophrenia*Chronic Obstructive
Pulmonary Disease
$371,680 -$3,321 $368,359
SCHIZOPHRENIA_
SEIZURES
Schizophrenia*Seizure Disorders and
Convulsions
$261,654 $0 $261,654
gCopdCF_ASP_SP
EC_BACT_PNEUM
Chronic Obstructive Pulmonary
Disease*Aspiration and Specified Bacterial
Pneumonias
$264,046 -$2,572 $261,474
SEPSIS_ASP_SPEC
_BACT_PNEUM
Sepsis*Aspiration and Specified Bacterial
Pneumonias
$248,487 $0 $248,487
ART_OPENINGS_
PRESSURE_ULCER
Artificial Openings for Feeding or
Elimination*Pressure Ulcer
$206,807 -$2,798 $204,009
SCHIZOPHRENIA_
CHF
Schizophrenia*Congestive Heart Failure $171,321 $0 $171,321
SEPSIS_PRESSURE
_ULCER
Sepsis*Pressure Ulcer $135,185 $0 $135,185
ASP_SPEC_BACT_
PNEUM_PRES_
ULC
Aspiration and Specified Bacterial
Pneumonias*Pressure Ulcer
$117,653 -$3,655 $113,998
Continued on next page

Billions in Estimated Medicare Advantage Payments From Chart Reviews Raise Concerns 33
OEI-03-17-00470
Exhibit B-1: Estimated 2017 payments resulting from diagnoses reported on chart reviews, by HCC
(continued)
HCC HCC Description
2017
Increased
Risk-Adjusted
Payments
2017
Decreased
Risk-Adjusted
Payments
2017
Net
Risk-Adjusted
Payments
Disabled/Disease Interactions
DISABLED_
HCC85 Disabled, Congestive Heart Failure $134,778 $0 $134,778
DISABLED_
HCC161
Disabled, Chronic Ulcer of the Skin, Except
Pressure Ulcer $92,421 -$2,624 $89,797
DISABLED_
PRESSURE_
ULCER
Disabled, Pressure Ulcer $77,628 $0 $77,628
DISABLED_
HCC77 Disabled, Multiple Sclerosis $40,271 $0 $40,271
DISABLED_
HCC39
Disabled, Bone/Joint Muscle
Infections/Necrosis $25,246 $0 $25,246
DISABLED_
HCC6 Disabled, Opportunistic Infections $2,379 $0 $2,379
TOTAL $6,861,135,786 -$196,472,424 $6,664,663,362
Source: OIG estimation of 2017 payment amounts using 2016 MA encounter data from CMS’s IDR.

Billions in Estimated Medicare Advantage Payments From Chart Reviews Raise Concerns 34
OEI-03-17-00470
APPENDIX C: Estimated Payments From Chart
Reviews for HCCs at High Risk for Improper
Payments When conducting audits of a sample of risk adjustment data submitted by MAOs,
CMS determines whether the diagnoses that resulted in risk-adjusted payments can
be validated by medical record documentation. When audits cannot validate
diagnoses, CMS uses this information to recover overpayments from MAOs and
calculate a payment error rate. The 2014 payment year is the most recent payment
year that CMS identified HCCs at a high risk for payment errors (including both
overpayments and underpayments).49 The 10 HCCs that CMS identified as having
the highest payment error rates for 2014 accounted for $216 million of the
estimated net payments solely from chart reviews for 2017.50 Exhibit C-1 outlines
the estimated amount of 2017 risk-adjusted payments attributed to each of these
high-risk HCCs.
Exhibit C-1: Estimated payments from chart reviews for HCCs that CMS previously identified as at a
high risk for improper payments totaled $216 million for 2017
HCC
Identified
by CMS as
High-risk HCC Description
2017
Increased
Risk-Adjusted
Payments
2017
Decreased
Risk-Adjusted
Payments
2017
Net
Risk-Adjusted
Payments
HCC75 Myasthenia Gravis/Myoneural Disorders and
Guillain-Barre Syndrome/Inflammatory and Toxic
Neuropathy
$92,693,353 -$5,797,873 $86,895,480
HCC27 End-Stage Liver Disease $36,059,563 -$667,199 $35,392,364
HCC106 Atherosclerosis of the Extremities with Ulceration or
Gangrene
$39,197,346 -$4,030,133 $35,167,213
HCC9 Lung and Other Severe Cancers $30,632,704 -$6,436,584 $24,196,120
HCC87 Unstable Angina and Other Acute Ischemic Heart
Disease
$16,245,743 -$2,171,216 $14,074,527
HCC114 Aspiration and Specified Bacterial Pneumonias $11,385,876 -$1,439,746 $9,946,130
HCC136 Chronic Kidney Disease (Stage 5) $8,370,840 -$849,894 $7,520,946
HCC54 Drug/Alcohol Psychosis $4,081,699 -$90,415 $3,991,284
HCC99 Cerebral Hemorrhage $3,632,171 -$1,455,800 $2,176,371
HCC100 Ischemic or Unspecified Stroke $9,252,840 -$13,007,907 -$3,755,067
TOTAL $251,552,135 -$35,946,767 $215,605,368
49 CMS, High-Risk Hierarchal Condition Categories, November 2017. 50 We compared our list of HCCs from the 2017 CMS-HCC model that were added by chart reviews to the HCCs that CMS identified as
at high risk for payment errors from the 2014 CMS-HCC model. Across the 2014 and 2017 models, there may be differences in the
relative factor assigned to each HCC.
Source: OIG estimation of 2017 payment amounts using 2016 MA encounter data from CMS’s IDR and CMS’s list of HCCs at a high risk for payment errors for
2014.

Billions in Estimated Medicare Advantage Payments From Chart Reviews Raise Concerns 35
OEI-03-17-00470
APPENDIX D: Agency Comments

Billions in Estimated Medicare Advantage Payments From Chart Reviews Raise Concerns 36
OEI-03-17-00470

Billions in Estimated Medicare Advantage Payments From Chart Reviews Raise Concerns 37
OEI-03-17-00470

Billions in Estimated Medicare Advantage Payments From Chart Reviews Raise Concerns 38
OEI-03-17-00470

Billions in Estimated Medicare Advantage Payments From Chart Reviews Raise Concerns 39
OEI-03-17-00470
ACKNOWLEDGMENTS
Jacqualine Reid served as the team leader for this study. Office of Evaluation
and Inspections staff who provided support include Tara Bernabe, San Le, and
Conswelia McCourt.
We would also like to acknowledge the contributions of other Office of
Inspector General staff, including Julie Brown, Rodney Brown, Berivan Demir
Neubert, and Jessica Swanstrom.
This report was prepared under the direction of Linda Ragone, Regional
Inspector General for Evaluation and Inspections in the Philadelphia regional
office, and Joanna Bisgaier, Deputy Regional Inspector General.
To obtain additional information concerning this report or to obtain copies,
contact the Office of Public Affairs at [email protected].
ABOUT THE OFFICE OF INSPECTOR GENERAL
The mission of the Office of Inspector General (OIG), as mandated by Public
Law 95-452, as amended, is to protect the integrity of the Department of
Health and Human Services (HHS) programs, as well as the health and
welfare of beneficiaries served by those programs. This statutory mission is
carried out through a nationwide network of audits, investigations, and
inspections conducted by the following operating components:
The Office of Audit Services (OAS) provides auditing services for HHS, either
by conducting audits with its own audit resources or by overseeing audit
work done by others. Audits examine the performance of HHS programs
and/or its grantees and contractors in carrying out their respective
responsibilities and are intended to provide independent assessments of
HHS programs and operations. These assessments help reduce waste,
abuse, and mismanagement and promote economy and efficiency
throughout HHS.
The Office of Evaluation and Inspections (OEI) conducts national evaluations
to provide HHS, Congress, and the public with timely, useful, and reliable
information on significant issues. These evaluations focus on preventing
fraud, waste, or abuse and promoting economy, efficiency, and
effectiveness of departmental programs. To promote impact, OEI reports
also present practical recommendations for improving program operations.
The Office of Investigations (OI) conducts criminal, civil, and administrative
investigations of fraud and misconduct related to HHS programs,
operations, and beneficiaries. With investigators working in all 50 States
and the District of Columbia, OI utilizes its resources by actively
coordinating with the Department of Justice and other Federal, State, and
local law enforcement authorities. The investigative efforts of OI often lead
to criminal convictions, administrative sanctions, and/or civil monetary
penalties.
The Office of Counsel to the Inspector General (OCIG) provides general
legal services to OIG, rendering advice and opinions on HHS programs and
operations and providing all legal support for OIG’s internal operations.
OCIG represents OIG in all civil and administrative fraud and abuse cases
involving HHS programs, including False Claims Act, program exclusion, and
civil monetary penalty cases. In connection with these cases, OCIG also
negotiates and monitors corporate integrity agreements. OCIG renders
advisory opinions, issues compliance program guidance, publishes fraud
alerts, and provides other guidance to the healthcare industry concerning
the anti-kickback statute and other OIG enforcement authorities.
Office of Audit
Services
Office of Evaluation
and Inspections
Office of
Investigations
Office of Counsel to
the Inspector
General