bill longbrake may, 2011 i. economic recovery is ... · i. economic recovery is progressing but...
TRANSCRIPT
The Longbrake Letter∗
Bill Longbrake
May, 2011
I. Economic Recovery Is Progressing But RemainsFragile
This is the same headline as last month. Little has changed, either for thebetter or worse. There have been no new global economic shocks and therehave been no new significant policy interventions in the economy. Reflectingthis, the U.S. stock market has been treading water — the S&P 500 stockindex has traded in a tight band from 1305 to 1364 over the last month.The risks to the economy discussed in last month’s letter remain and theirpotential to impede economic recovery has not diminished.
In this month’s letter I include a short update on each of the majorrisks and also discuss U.S. GDP growth and employment trends. In the lastsection I turn to a discussion of the principal policy issue — increasing theU.S. debt ceiling — which is percolating and will most likely dominate U.S.politics until a resolution is forged in a brinksmanship-like finale in mid tolate summer. The risks posed to U.S. economic activity will turn in theshort run upon whether the increase in the debt ceiling is accompanied bysignificant and immediately-implemented spending cuts and in the long runby whether politicians delay grappling with the truly tough issue of enti-tlement reform (social security and, in particular, Medicare and Medicaid)until after the 2012 presidential election. Delay often results from politicalstalemate, but delay comes not without cost. Initiating and implementingentitlement reform must occur to avoid running large federal budget deficits,which left unchecked, could eventually threaten U.S. solvency. While deal-ing with entitlement reform will have painful consequences, the severity ofthose consequences will only grow with delay. History and the nature of the
∗The information contained in this newsletter does not constitute legal advice. Thisnewsletter is intended for educational and informational purposes only.
1

Longbrake The Longbrake Letter 2
current political debate suggest that we should expect symbolic spendingcuts and delay on entitlement reform, which is not an optimal outcome forthe U.S. economy in the long run but is politically expedient in the shortrun.
Following are observations I offered in my April letter, which I feel bearrepeating as they still aptly describe the differences in the current weakeconomic recovery from more robust historical recoveries and explain themalaise and pessimism that dominates much of the country.
1. Abundant Policy Stimulus Has Not Fostered Strong EconomicRecovery
Extraordinarily accommodative monetary and fiscal policies in the U.S. andelsewhere, combined with strong growth in emerging markets, have under-pinned a modest economic recovery in the U.S. In another era these factorswould have lead to much stronger growth than has occurred over the last22 months. But it takes time and a lot of stimulus to climb out of the deepeconomic hole that the financial meltdown and Great Recession created.
2. Optimism Dominates Financial Markets, But PessimismAbounds Elsewhere
Nonetheless, for the time being economic data reports confirm that recov-ery is underway. Optimism dominates financial markets. Federal Reserveofficials publish optimistic economic outlooks and some fret about the riskof inflation. If one looked no further than this it would seem as though theeconomy is strengthening rapidly so that underperformance will soon be aworry of the past to be replaced by concerns of overheating and inflation.But ask the average American. There is little optimism. Consumer senti-ment and confidence surveys remain mired near recession lows. The same istrue for small business confidence surveys, which reveal declining confidencefrom a level that had not rebounded materially from the recession low.
How does one explain the optimism of financial markets and the pes-simism of most Americans? Company earnings results support stock marketoptimism. But, a great deal of economic data describing employment and
c©2011 Barnett Sivon & Natter, P.C.

Longbrake The Longbrake Letter 3
income growth, residential housing prices and consumer spending are morein sync with consumer pessimism.
An objective of the Federal Reserve’s non-traditional monetary policy ofquantitative easing has been to provide sufficient liquidity to drive up pricesof financial assets. And, this is exactly what has happened. This createsadditional wealth, part of which can be spent on current consumption, thusaccelerating economic recovery. Were we to probe no further, we wouldconclude that the Federal Reserve’s monetary policy has accomplished whatwas intended, which is to create a strong enough economic base for a self-sustaining expansion to take hold. What is missing, when we probe a bitdeeper, is that the benefit of the Federal Reserve’s policy in creating financialasset wealth is limited to a small fraction of the American populace. In otherwords, quantitative easing mostly benefits the wealthy in the short-run andrelies on “trickle down” to have broader favorable impacts on the economyover time.
Strong company earnings growth has benefited not so much from eco-nomic recovery in the U.S. as it has from strong international growth andcost containment, including falling unit labor costs, which result from pro-ductivity increasing at a faster rate than nominal wage growth. Althoughstrong productivity growth is good for company earnings, it weighs againstjob creation. While domestic sales revenues are recovering, the level of realconsumer spending is up only 1.0% since December 2007 and it would actu-ally be down were it not for the significant increase in government transferpayments such as unemployment insurance. In fact, it is down 1.7% on aper capita basis, which means that real consumer spending has not kept upwith growth in the population. Moreover, consumer spending growth is stillwell below the long-term average as consumers struggle with unemployment,underemployment and high debt burdens.
Strong international growth, lead by emerging markets, and a declinein the value of the dollar have combined to fuel a strong recovery in man-ufacturing and trade. Unfortunately, manufacturing and trade account fora very small portion of economic activity in the U.S. and productivity hasbeen particularly robust in the manufacturing sector. So, again, this devel-opment has been an engine driving profit growth but not much employmentgrowth.
c©2011 Barnett Sivon & Natter, P.C.

Longbrake The Longbrake Letter 4
3. Forecast Risk
Put this all together and what it tells us is that the economic recovery isnot broad-based. There are pockets of strength, but considerable weaknessprevails in many sectors. Given time and the absence of unexpected negativeshocks it would be reasonable to expect the economy to strengthen graduallyand for the weak sectors to improve. GDP growth would be sufficient toreduce the output gap slowly and the unemployment rate would fall ashiring picks up. However, the pace of improvement would be sufficientlygradual that a sharp and sustained increase in inflation would not threatenfor a long time. This outlook forms the base case for most forecasters. Icount myself among them, but my conviction is not strong. That is becausea fragile economy is particularly vulnerable to negative shocks.
Increasingly, the persistence of the recent oil price shock seems likely toslow growth a little. The Federal Reserve adjusted its forecast downwarda smidgen and Goldman Sachs reduced its 2011 GDP growth forecast from3.5% to 3.0% and its 2012 forecast from 3.7% to 3.3%, primarily because ofthe contractionary impact of higher gas prices on consumer spending.
Several other risks have been in place for a while. Some, such as theproblems of peripheral countries in the European Union, and housing inthe U.S. are worsening. Others, such as federal fiscal policy and monetarypolicy are transitioning from positive to negative impacts. There are otherrisks, such as overheating of emerging market economies, particularly China,which could lead to cyclical reversal and thus bear watching.
II. Significant Risks Threaten Economic Recovery
1. Global Oil Price Shock
Political turmoil continues to roil the Middle East. However, so far theonly serious interruption in oil supplies stems from the civil war in Libya,which currently appears to be stalemated. This has reduced oil supplyby 1.5 million barrels per day, which equals about 30% of OPEC’s sparecapacity of 5.2 million barrels per day. This and accentuated uncertaintyabout what might happen in other oil-producing Middle Eastern countries
c©2011 Barnett Sivon & Natter, P.C.

Longbrake The Longbrake Letter 5
has been sufficient to push the price of oil up by more than 20% in a fewweeks time. There is little doubt there are uncertainty and speculativepremiums embedded in the spot price of oil. There was hope recently thatthe speculative premium had been purged when oil prices dropped nearly10% in a single day. This turned out to be a massive short-covering rallyand, unfortunately, most of the price decline has disappeared in recent daysas risk appetite returned to the market.
Thus, while there is diminished risk of further price increases, prospectsfor oil prices to decline on a sustained basis in the near term seem limited.Libya’s production appears to be lost for a very long time. The politicalrisk premium now embedded in the price of oil will remain until tensionsease in the Middle East and that prospect seems a long ways off. Furtherinterruptions in oil supply appear to be unlikely, but as long as politicalinstability remains the order of the day the balance of risks tilts in thenegative direction.
An offsetting factor to this risk is a drop in the demand for oil. If thedrop is significant enough, it would bring the price of oil down. There isalready evidence in the U.S. of demand destruction.
2. Japanese Economy Severely Wounded — Negative SupplyChain Impacts
While the Japanese economy is clearly in trouble and will take much longerthan typical to return to normal functioning, it is increasingly apparentthat global supply chain disruptions will have only a modest and temporarynegative impact on global growth.
3. European Sovereign Debt Crisis
In the continuing saga of the European sovereign debt crisis the spotlighthas shifted from Portugal back to Greece. The market reaction to the Por-tuguese bailout was hardly a ringing endorsement as reflected in an increasein interest rates on Portuguese debt following the announcement. That re-sponse indicates that the market does not feel that the bailout terms willbe sufficient in the longer run and that Portugal will need further financial
c©2011 Barnett Sivon & Natter, P.C.
Longbrake The Longbrake Letter 6
assistance sometime in the future. But, as has been the case for Greece,Portugal can probably limp along for many months before a state of crisisre-emerges.
As for Greece, a year has passed since the original bailout was put inplace. The bailout required Greece to take drastic action to reduce thegovernment budget deficit within a compressed time period. Predictably,austerity has thrown the Greek economy into deep recession. And, not sur-prisingly, the economic decline has been more severe than optimistic fore-casts made at the time of the bailout. Because of that less progress has beenmade in reducing the budget deficit and the public debt to GDP ratio hasrisen more than expected. The debt ratio is rising because GDP is fallingand the amount of public debt is rising because the level of the budgetdeficit remains high and above the requirements established by the bailout.It is clear to most analysts that fiscal consolidation/austerity cannot resolveGreece’s problems simply because the debt burden was too great to beginwith. However, European authorities have been unwilling to consider alter-natives to fiscal consolidation because of fear of contagion for other countrieswith top-heavy sovereign debt loads and anxiety about potential insolvencyof many European banks which are heavily invested in European sovereigndebt.
The latest developments affecting Greece involved yet another round ofrating agency downgrades of its sovereign debt and a magazine article in DerSpiegel, a German publication, speculating that Greece might exit from theEuropean Union. Both developments reflect that the current policy of fiscalconsolidation will likely fail. Nonetheless, European authorities categoricallyare unwilling to consider or discuss the possibility of debt restructuringwhich would require bondholders to suffer a loss.
Thus, another policy band-aid is probable, which will likely buy a lit-tle time, but will merely postpone the inevitable need to restructure Greekdebt. Greek exit from the European monetary union would enable it todevalue its currency which would make it more competitive, but this actionwould only be a partial solution. Exit would not address the debt burdenproblem because the debt would continue to be denominated in euros, notin drachmas. Exit from the European Union, while it would provide greaterflexibility to Greece to manage its way out of its fiscal problems, wouldresult in enormous and costly adjustments and would trigger severe finan-cial repercussions. Furthermore, it would be an extremely risky precedent
c©2011 Barnett Sivon & Natter, P.C.

Longbrake The Longbrake Letter 7
that could very well destabilize the integrity of the European Union. Forall of these reasons, European authorities and, notably, Greek authoritiesand politicians as well, are immediately and emphatically dismissive of exitspeculation.
A likely policy band-aid would involve debt rescheduling, as opposed torestructuring. When debt rescheduling takes place, debt holders exchangeshort-dated bonds for longer-dated bonds, presumably at the same interestrate. This avoids bondholders incurring a principal loss and it reduces theamount of debt that is rolling over and must be refinanced. The policyband-aid could also include additional European Central Bank loans at lowinterest rates, which would reduce the negative impact of high debt servicecosts on Greece’s budget deficit and debt to GDP ratio.
Discussions about next steps for Greece began at an informal meetingon May 6, 2011 in Luxembourg and will continue on a formal basis on May16, 2011 when the euro-area finance ministers are scheduled to meet. Afterthe May 6th meeting, Luxembourg’s prime minister, Jean-Claude Juncker,reportedly stated that Greece’s financial assistance program “does need afurther adjustment”.
There are strong reasons for European policymakers to play this gameof “pretend and extend” or less charitably known as “kick the can downthe road”. First, because much of the sovereign debt is held by Europeanbanks, a debt restructuring involving principal forgiveness would depletebank capital and perhaps even threaten insolvency for a few. This mostcertainly would trigger a liquidity crisis for European banks as investorsseek to move funds to safer climes. European authorities do not relish theprospect of dealing with contagion. This remains a problem and becauserestructuring appears to be inevitable, European authorities will have tofigure out how to handle the consequences of contagion. There is not yetany plan for how to do so. It is likely that a plan will emerge in a crisisatmosphere when time has run out and this will raise the risk of a significantpolicy mistake. But, that time still seems a long ways off.
Second, France and particularly Germany want other member countriesof the European Union to agree to fiscal policy constraints — the so-calledcompetitiveness pact. By agreeing to such a policy regime, member countrieswould give up a large measure of sovereignty over taxing and spending.Economists point out that this is a necessary component to make a monetary
c©2011 Barnett Sivon & Natter, P.C.

Longbrake The Longbrake Letter 8
union work as intended. Indeed, this imperative has always been recognizedin the treaty that formed the foundation for the European Union. But it isa policy of words with no enforcement mechanism and obviously the lack ofan effective enforcement mechanism permitted individual country behaviorswhich have lead to the current sovereign debt problem.
Bailing out Portugal and renegotiating Greece’s assistance package willbuy some more time, but time is running out and it will be necessary forEurope in a few months time to deal directly rather than indirectly with thesovereign debt crisis. And, don’t forget about Ireland. It’s not getting anybetter there either. And, while all is quiet in Spain for the time period, it isa candidate ripe to suffer financial market wrath should contagion take hold.The stark reality is that the European sovereign debt problem is steadilyworsening. Delay in devising meaningful and effective policies will only makethe ultimate necessary resolution more difficult and risky. Because of theinterconnectedness of the global financial system and Europe’s importance inthe system, the manner in which Europe’s sovereign debt crisis is ultimatelyresolved will have repercussions for U.S. financial markets . . . and they willnot be positive ones. But, for now, the risks to the U.S. economy are notyet front and center.
4. Declining Housing Prices
In a typical economic cycle housing is a key sector that contributes to re-covery. Low interest rates spur housing demand and stimulate new con-struction. That is not the case now. Interest rates are at all time lows andmeasures of residential housing affordability are at record highs, conditionswhich in other cycles were sufficient to launch a strong housing recovery.And now, when a turnaround ought to be underway, home prices are declin-ing once again and housing construction and sales activity is plumbing newlows.
According to the S&P/Case-Shiller index of housing prices, prices de-clined 0.2% in February marking the eighth consecutive monthly declineand bringing the price decline over the last 12 months to 3.3%. Bank ofAmerica/Merrill Lynch recently downgraded its 2011 housing price declineforecast to 6.4%, and added that risks are skewed in the direction of a largerdecline.
c©2011 Barnett Sivon & Natter, P.C.

Longbrake The Longbrake Letter 9
There is nothing in the outlook to give cause for optimism. The simplyreality is too many houses were built during the bubble years leading to ex-tremely high levels of vacant homes which will take years to absorb throughpopulation growth and new household formation.
Chart 1 shows the number of single-family and multi-family housing
units above the 1994-2000 average based on data compiled by the U.S. Cen-sus Bureau. These data indicate a modest reduction in single family homeexcess inventory to about 750,000 homes. Total vacant inventory is about2.8 million, but “normal friction” inventory is about 2.0 million. However,Goldman Sachs believes that Census Bureau data greatly understate thereal amount of excess inventory, which it calculates to be about 3.5 millionunits, because the Census Bureau does not estimate the number of vacanthomes which discouraged owners have not placed on the market for sale.
Falling home prices obviously will continue to depress housing demand.Who wants to buy a home when its value is likely to fall. But, there are twoother risks that bear close watching. First, falling home prices will reduceconsumer wealth. Because perceptions of wealth affect consumer confidenceand spending, declining housing wealth will have a negative impact on eco-nomic activity. Whether this impact will be significant will depend upon theextent of housing price declines during 2011. A worst case scenario entailsa combination of stagnant or declining stock prices and decreases in homeprices that exceed the widely forecast 5.0% decline, an outcome which seems
c©2011 Barnett Sivon & Natter, P.C.
Longbrake The Longbrake Letter 10
a bit more probable than a month ago.
Another issue is the abundance of mortgages that exceed the currentsale value of a home. The risk of potentially substantial additional lossesby holders of defaulting mortgages is not yet a significant issue, but de-velopments are moving in the wrong direction and could turn the financialconsequences of further declines in housing prices into a significant prob-lem later on in 2011. Financial institutions can slow down realization offinancial losses by delaying foreclosure activity. This is exactly what hasbeen occurring. Unfortunately, delaying foreclosures is a solution that willalso postpone housing market stabilization. In that respect the financialhandling of the housing problem is the same as the “kick the can down theroad” approach to dealing with the European sovereign debt problems. Ul-timately, losses must be realized and debt restructured before the housingmarket will return to health. But the interim consequences of doing so areenormous and no policy has been crafted yet to contain the potential forcontagion. Residential housing continues to be an unhealthy situation withrisks tilted decidedly to the downside.
There is one bright spot in the housing market and that involves multi-family rental units. As can be seen in Chart 1, rental vacancies are nowshrinking rapidly thanks to a falling homeownership rate and extremelylimited new construction. While excess multi-family inventory remains, ithas fallen from a peak of 1.4 million units in the third quarter of 2009 toabout 800,000 units in the first quarter of 2011. This market tighteningis already putting very moderate upward pressure on rental rates. Risingrental rates have contributed to stabilizing the core rate of consumer priceinflation and will probably contribute to small increases in core inflationin coming months. But, more importantly, rising rental rates improve thefinancial economics of new multi-family construction and will surely lead toan increase in economic activity in this sector later on during 2011.
5. Monetary Policy
Monetary policy is currently extraordinarily accommodative thanks bothto the Federal Reserve’s zero-interest-rate policy and its large scale assetpurchase (LSAP) program, better known as quantitative easing (QE II).QE II involves purchase of an additional $600 billion in U.S. Treasury se-curities and maintenance of mortgage backed securities balances through
c©2011 Barnett Sivon & Natter, P.C.

Longbrake The Longbrake Letter 11
replacement purchases.
QE II will be completed by June and the Federal Open Market Commit-tee (FOMC) has stated that it intends to maintain the Fed’s balance sheetthereafter. By simply completing the purchase program and doing nothingelse, monetary policy will become somewhat less accommodative after June.
The longer term issue is when the Federal Reserve will begin to takeaction to tighten policy. One’s answer to that question depends upon one’sforecast of economic activity. Optimists, who expect GDP growth to accel-erate, the unemployment rate to continue falling and inflation expectationsto edge up, forecast that the Federal Reserve will begin to tighten policy assoon as the fourth quarter of 2011. However, forecasters who expect recov-ery to proceed gradually, which includes myself, believe the Federal Reservewill not begin tightening monetary policy until late 2012 or early 2013.
6. Fiscal Policy
There is little doubt that political momentum has swung in the direction ofreducing federal budget deficits. The questions now are ones of how muchand how soon.
With the political drama of approving the fiscal year 2011 budget reso-lution now history, political attention is focused next on raising the federaldebt ceiling. The Treasury Department has announced that the ceiling willofficially be reached on May 16, 2011. However, the Treasury Departmenthas also stated that it will be able to engage in a variety of accounting ad-justments that will postpone the actual date for running short of cash tooperate the government until August 2, 2011.
In addition, payroll tax cuts and extension of unemployment insurancebenefits, which were enacted last December, and which have contributedsignificantly and favorably to economic activity during the first quarter of2011, are scheduled to expire at the end of the year. It is too early to forecastwhether any or all of these measures will be renewed for 2012. Extensionwill probably depend on the strength of the economy later this year, themood of the public, and presidential electioneering. If economic recovery isgrinding along, odds tilt in the direction of letting these measures expire asscheduled, given the current mood of Congress.
c©2011 Barnett Sivon & Natter, P.C.

Longbrake The Longbrake Letter 12
So, on balance, fiscal policy is already in the process of shifting fromstimulus to restriction. The risk going forward is tilted in the direction ofeven greater fiscal restrictiveness rather than less.
7. Summary
Each of these risks on an individual basis will likely have a moderate re-straining impact on acceleration in the economic recovery that is underway.What is uncertain and worrisome is the possibility that several of these riskswill impact the economy in the same time frame and trigger reinforcing andnegative feedback loops that slow or even derail economic recovery. I remainoptimistic that recovery will proceed slowly but I believe the recovery willcontinue to be much weaker than previous recoveries, and so far the dataflow confirms that belief. I am not worried about near-term inflation risks.Overall, the economy should grow gradually, but risks to that view are tiltedto the downside.
III. U.S. GDP Growth
1. Forecasts
Various GDP forecasts are shown in Chart 2. The Federal Reserve’s mostrecent forecast decreased the expected range of GDP growth in 2011 from3.4% to 3.9% to 3.1% to 3.3%. This downward adjustment reflected theweak GDP growth in the first quarter but also anticipates that higher foodand energy prices will retard economic growth during the remainder of 2011.The Fed reduced the upper bound of its forecast for 2012 GDP growth from4.4% to 3.5% to 4.2% to 3.5%, most likely because of impacts stemmingfrom the withdrawal of monetary and fiscal stimulus by the end of 2011.The Fed also reduced its forecast range for 2013 GDP growth from 4.6%to 3.7% to 4.3% to 3.5%. These downward adjustments follow a pattern ofconsistent downward adjustments and are not surprising given that the Fedforecasts tend to be more optimistic than those of many analysts.
Following a fairly consistent pattern, the Fed’s forecast is at the opti-mistic end of the forecast range. The Bank of America/Merrill Lynch (B of
c©2011 Barnett Sivon & Natter, P.C.

Longbrake The Longbrake Letter 13
A) forecast, Goldman Sachs (GS) forecast and my forecast, labeled “WALEst.”, all fall below the lower end of the Fed’s forecast range. There is verylittle difference between my forecast and those of B of A and GS throughthe end of 2012. While B of A and GS have not yet released forecasts for2013, my forecast indicates a gradual increase in GDP growth to about 3.5%in 2013, which is similar to the lower bound of the Fed’s forecast for 2013.
2. Output Gap
Based upon the Congressional Budget Office’s full potential GDP estimates,the output gap was 6.26% in the first quarter of 2011, a level it has beenstuck at for the last three quarters. GS’s revised real GDP forecast putsthe output gap at a still very sizable 4.26% by the end of 2012 and B of A’sforecast is slightly more pessimistic with an output gap of 4.81% at the endof 2012. My own GDP forecast puts the output gap at 4.43% at the end of2012 and 3.61% at the end of 2013. The CBO’s estimate of the output gapduring the 1980-82 recession peaked at 7.54% in the fourth quarter of 1982and then fell rapidly to 1.15% six quarters later by the second quarter of1984. The output gap peaked at 7.76% during the Great Recession duringthe third quarter of 2009, but in the six quarters since has fallen only to6.26%.
c©2011 Barnett Sivon & Natter, P.C.

Longbrake The Longbrake Letter 14
Clearly, this recovery bears little resemblance to the one that followedthe deep recession of 1980-82. This is troubling because a persistent largeoutput gap weighs cumulatively on optimism. Also, the persistence of a largeoutput gap argues strongly against an inflationary outbreak and maintainsthe potential for deflation. The deflation threat has been corralled for themoment by aggressive monetary policy, but I think the threat has simplybeen contained; it has not been eliminated.
3. 2011 Q1 GDP
The “advance estimate” of first quarter GDP growth was 1.8% (see Table1).
Table 12010 Fourth Quarter GDP Estimates
Advance Second Final
Estimate Estimate Estimate
Personal Consumption 1.91%
Private Investment
Nonresidential .18%
Residential -.09%
Inventories .93%
Net Exports - .08%
Government -1.09%
Total 1.76%
Personal consumption declined from 2.79% in the fourth quarter to 1.91%in the first quarter. At first blush, because consumption accounts for morethan 70% of GDP growth, this would appear to be a negative development.At the very least it reflects the on-going weakness of the economic recov-ery and challenges that consumers confront. Consumer spending should beincreasing at an annual rate of slightly more than 3%. If it were, the contri-bution to 3% GDP growth would be 2.1% (70% of 3%). Viewed in this way,
c©2011 Barnett Sivon & Natter, P.C.
Longbrake The Longbrake Letter 15
an increase of 1.9% is not significantly below 2.1%. Growth in consumerspending has been rising steadily quarter-by-quarter since the end of theGreat Recession two years ago. Over the last four quarters real consumerspending has risen 2.59% and is nearing the long-term average of 3.0%. Inaddition, quarterly data move around a lot, so one has to be careful notto over interpret one quarter’s number. So, while a pull back in consumerspending in the first quarter was disappointing, it was not disastrous and infact is consistent with a gradual, but weak, economic recovery.
Investment in inventories was stronger than desirable, as overstockingwill eventually lead to production cutbacks. However, in this instance stronginventory growth followed an unusually large contraction in the fourth quar-ter, suggesting that there was statistical noise in both quarters’ numbers.
Perhaps most surprising was the extraordinarily large decline in govern-ment expenditures. As a reminder, GDP only measures government spend-ing on goods and services. It omits all transfer payments which have beenthe primary component of government spending that has driven the bud-get deficit up. Most all government transfer payments are accounted for inGDP through consumer spending. Again, it seems that the large decline ingovernment spending was a statistical anomaly.
All-in-all first quarter GDP growth was not nearly as bad as it looked.Yet, the story it tells is consistent with the overall story of a weak economythat is struggling to gather sustainable momentum.
4. Prospects for GDP During the Rest of 2011
GDP growth is likely to be somewhat better during the remainder of 2011and so, hopefully, the 1.8% reported in the first quarter will mark the lowpoint for the year. However, the improvement is likely to be modest as isindicated in the various forecasts shown in Chart 2.
c©2011 Barnett Sivon & Natter, P.C.

Longbrake The Longbrake Letter 16
IV. U.S. Employment
1. April Data
Payroll employment rose a solid 244,000 in April following an equally strongrevised advance of 221,000 in March and 235,000 in February. If one were tolook no further than the payroll data, one would conclude that employmentis in a strong recovery mode.
However, other employment data paint a less rosy picture. The onestatistic which usually receives the greatest amount of attention, the un-employment rate, rose to 9.0% in April from 8.8% in March. The unem-ployment rate is calculated from the household employment survey ratherthan from the payroll survey. The number of people looking for work, whoare counted as unemployed, rose 205,000 in April while the labor force rose15,000, which means that the number employed fell by 190,000. This reflectsa very weak labor market and is contradictory to the “good news” containedin the payroll employment survey.
Over the last year, the number of people eligible to work has increased1.8 million. Many of those eligible to work voluntarily choose not to doso. The household employment survey asks those eligible to work whetherthey are either employed or looking for work. This measure is called thelabor force. The labor force decreased 1.1 million over the last 12 months.The relationship between those eligible to work and those willing to workis termed the “participation rate”. During the last 12 months the partici-pation rate decreased from 65.11% to 64.15% (see Chart 3) and it is downapproximately 2% since the start of the Great Recession. A 1% change inthe participation rate equals approximately 2.4 million people who have cho-sen not to seek employment either voluntarily or because they have becomediscouraged.
Generally, over long periods of time the payroll employment survey andthe household survey of those employed track each other relatively closely(see Chart 4). However, the two surveys, because of differences in samplingmethods, will sometimes diverge on a month-to-month basis. This was thecase in April. While payroll employment increased 244,000, household sur-vey employment decreased 190,000. Actually the divergence between thetwo reports has persisted over the last 12 months during which payroll em-
c©2011 Barnett Sivon & Natter, P.C.

Longbrake The Longbrake Letter 17
ployment rose 1.3 million, but household employment rose a much smaller292,000. A possible explanation for this sustained difference, which is un-usual, could be embedded in the payroll survey estimation methodologyused to account for self-employed individuals and persons employed by smallbusinesses. Generally, the payroll survey underestimates the number of suchemployees during the recovery phase of the economic cycle, as can be seen inChart 4 during the economic recovery that followed the 2001 recession. Therecent result is exactly opposite to what happened after the 2001 recession.
c©2011 Barnett Sivon & Natter, P.C.

Longbrake The Longbrake Letter 18
It could be that the continued extremely weak small business survey datamight be telling us that the typical recovery in self-employment and smallbusiness employment is not occurring this time. Since the payroll survey fo-cuses on combining data from large employers and with estimates the smallbusiness and self-employed workers, it is possible that the supplemental es-timates are overstating the true situation. Payroll data are benchmarkedannually on a retrospective basis. Household data are never revised. Thus,it is reasonable to posit that in times of potentially significant structuralchange in labor markets, the household survey will be more reliable thanthe payroll survey.
2. Labor Force Participation
Falling labor force participation is responsible for the simultaneous shrink-age in the labor force and the falling rate of unemployment. Participationchanges over time because of demographic changes and cultural consider-ations, such as greater entry of women into the labor force. Over shorterperiods of time labor participation is also influenced by workers who exitthe labor force during difficult times only to re-enter the labor force duringgood times.
Demographic factors have driven a slow decline in labor force participa-tion since it peaked just prior to the 2001 recession. There was a bit of arebound in the late part of the cyclical expansion prior to the start of theGreat Recession in December 2007. As can be seen in Chart 3, however,the decline in participation over the last three years is much greater thancan be explained by demographic factors alone. The primary demographicreasons for declining participation are an aging workforce with a lower par-ticipation rate in the oldest cohorts and a declining participation rate amongyoung workers, probably reflecting a larger proportion going to college. De-mographic considerations have accounted for about a 0.5% decline in theparticipation rate since the start of the Great Recession. Other factors havecontributed to the remaining 1.5% decline from the peak of 66.0% at theonset of the Great Recession. Principal among these other factors is dis-couragement, which prompts workers to give up looking for work and dropout of the work force. Such workers could well re-enter the labor force whenjob prospects improve and the labor market tightens. However, some ofthe decline could also stem from structural unemployment for workers that
c©2011 Barnett Sivon & Natter, P.C.

Longbrake The Longbrake Letter 19
are simply unemployable because they do not have skill sets any employerneeds.
There are currently approximately 2.1 million workers who have droppedout of the labor force for reasons unrelated to demographic considerations.If all of these workers are discouraged and plan to re-enter the labor force asthe labor market improves the April unemployment rate would have been10.3% rather than the reported rate of 9.0% (see Chart 5).
A steady, but gradual, decline in the labor force participation rate meansthat employment will grow more slowly in the future, but it will probably notaffect the unemployment rate or, for that matter, other growth rates to anymaterial extent. What it will affect, however, is the level of personal income,the level of retail sales and any other aggregate measures of household incomeand spending. This trend will matter in the following way. A 2% to 3%permanent decline in the labor participation rate means that householdincome, and probably spending as well, will be approximately 2% to 3%lower for the same population base. This is a decline in the level. It doesnot affect growth rates. Growth rates, which are how most all economicdata are reported, describe changes in levels. A 3% change from a low levelappears to be the same as a 3% change from a high level. But, it should beobvious that a 3% change from a high level is better than a 3% change froma low level. Overall, this is not good news for nominal tax collections thatare geared to levels of income or retail sales that are at lower levels because
c©2011 Barnett Sivon & Natter, P.C.

Longbrake The Longbrake Letter 20
of the reduced level of employment.
3. Wage Growth
Average hourly wage growth, which is an indicator of the intensity of excesslabor supply relative to demand, has stabilized over the last year. Chart 6shows the annual rate of change in the hourly average employee wage rate
and the annual rate of change in weekly wages. The growth rate in averageweekly wages adjusts for the average number of hours worked. The growthrate in weekly wage earnings is a measure of spending power of consumers.Weekly wages had grown since mid-2009 as average hours worked slowlyincreased, but now appear to be converging downward toward the growthrate in average hourly wages. Overall Chart 6 tells a story of a very weaklabor market that is in the process of stabilizing.
In the long run, the more important of the two measures is growth inthe average hourly wage rate. Average weekly hours fluctuate with thestrength of the business cycle, falling during recessions and rising whenthe economy is expanding. Early in the recovery phase of the businesscycle, employers increase the number of hours worked by employees. But, asemployers gain confidence in the sustainability of the expansion, they beginto hire additional workers. We appear to be at the transition point. What
c©2011 Barnett Sivon & Natter, P.C.

Longbrake The Longbrake Letter 21
that means is that the number of people hired should begin to increase ata more rapid rate as the payroll employment survey seems to be indicating.It also means that the expansion in the number of hours worked per weekshould begin to flatten out and that is what has happened over the lastseveral months. That means that growth in the average hourly wage rate isonce again the better indicator of the tightness of labor supply relative todemand.
The rate of growth in the average hourly wage rate is also a leadingindicator of inflationary pressures. As long as it remains at a very low andstable level there will be little to no upward pressure on inflation.
V. The Great Federal Budget Debate - Impact ofthe U.S. Federal Budget Deficit and Level of Debton the US Economy
1. Budget Deficits Left Unchecked Will Result in Increasesin the U.S. Federal Public Debt to GDP Ratio That CouldThreaten U.S. Solvency
Since the Great Depression of the 1930s and pursuant to the analysis of JohnMaynard Keynes, it has been government policy to fight the negative con-sequences of a decline in aggregate demand during a recession by increasingspending and cutting taxes. This policy results in huge increases in bud-getary deficits. Economic theory posits that cyclically-neutral stabilizationfiscal policy requires offsetting budgetary surpluses during the expansionpart of the economic cycle. Whether policy is cyclically neutral can be ob-served by tracking the ratio of the stock of federal debt to nominal GDP(debt ratio) over time. If policy is cyclically neutral, the value of the debtratio will fluctuate around a constant value, rising above that value duringrecessions and falling below during expansions.
Chart 7 shows the progression of the federal public debt ratio since1975. Prior to the Reagan presidency the debt ratio fluctuated around25%. During the Reagan administration “supply-side” fiscal policy lead tohuge deficits and the debt ratio rose to a peak of 49% in 1993. During theClinton administration, a time of steady economic growth, the debt ratio
c©2011 Barnett Sivon & Natter, P.C.

Longbrake The Longbrake Letter 22
fell to 33% in 2001. In the aftermath of the 2001 recession the debt ratiorose moderately, but did not fall back much when the economy began togrow again due to the Bush administration’s tax reduction policy. At thestart of the Great Recession, the debt ratio was 36% and in the thirteenquarters since its start the ratio has risen to 64%. It is currently on acourse to rise to 70% or a little higher by the end of 2012, depending uponthe strength of the economy in coming months and the extent of potentialCongressionally-mandated spending cuts.
The rapid increase in the debt ratio and the prospect of further increaseshas prompted concern about the ability of the government to service this in-creasing stock of debt in the future without inducing a rapid rise in inflationor depressing the standard of living.
Kenneth Rogoff and Carmen Reinhart, based on their historical studyof credit collapses and sovereign debt crises, suggest that the tipping pointwhen the size of the debt to GDP ratio is in the “red zone” where the risk ofa debt crisis rises substantially is in the vicinity of a 90% debt to GDP ratio.There is some uncertainty about the definitional basis of the 90% trigger.If it pertains to debt held by the public in the U.S., then the current 64%debt ratio is not yet at a worrisome level; but if it is based on the total debtratio, the U.S. total debt ratio of 95% is definitely troublesome. Once thedebt ratio reaches a certain level, the interest costs tend to accelerate therate of growth in the debt ratio and solvency concerns act as an accelerant
c©2011 Barnett Sivon & Natter, P.C.
Longbrake The Longbrake Letter 23
because interest rates rise along with solvency concerns.
In any event, the primary deficit (see definition in Section 6 below) ex-ceeds $1.1 trillion currently and federal debt held by the public is growingat about 16% annually compared to a 4% growth rate in nominal GDP.This means that the debt ratio will continue to rise to much higher levels incoming months unless measures are taken to reduce the size of the budgetdeficit substantially and sooner than later.
2. Fiscal Policy Tools
Policymakers can reduce the federal budget deficit by reducing spending;limiting tax expenditures, raising taxes and limiting benefits from the socialsecurity, Medicare and Medicaid entitlement programs.
Spending
While cutting spending is talked about incessantly — let’s eliminatewasteful government spending — the opportunities for limiting discretionaryspending are not as great as imagined unless federal employment and wagesand defense spending are all targeted.
With respect to defense spending, which of course includes spendingin Iraq and Afghanistan, there is interest among both Republicans andDemocrats in examining opportunities for reducing spending.
Cutting pork barrel projects — “earmarks” — would save $16 billion.Some other spending cut opportunities include NASA’s missions to the moonand Mars ($4 billion) and reducing farm subsidies ($10 billion).
Tax Expenditures
There are approximately 250 tax expenditures. In more common par-lance the term “tax loophole” is used rather than the term “tax expendi-ture”. If all tax expenditures were eliminated, tax revenues would increaseapproximately $1 trillion annually. This would amount to a 46% increase intax revenues which were $2.16 trillion in fiscal year 2010.
c©2011 Barnett Sivon & Natter, P.C.

Longbrake The Longbrake Letter 24
The most significant tax expenditures, accounting for approximately 50%of the total lost tax revenue impact, include:
• Employer provided health insurance exclusion
• Mortgage interest deduction
• State and local tax deduction
• Charitable contributions
Each of these tax expenditures has well-financed and powerful interestgroups. None likely could ever be addressed individually, but as part of acomprehensive package the outcome could be different.
Tax Rates and Tax Base
Tax rates pertain to the rate paid on income and tax base encompasseswho pays the tax. Lowering tax rates has been a cardinal tenet of Republicanpolitical policy.
Entitlements
Payroll taxes and the accumulated trust fund will be sufficient to coversocial security obligations through 2037. Thereafter payroll taxes will coverabout 75% of obligations. The insolvency date projection has fluctuatedbetween 2032 and 2042 in recent years and depends upon how fast inflation-adjusted wages are assumed to grow. If the rate of growth is higher, it willtake a longer time before the fund becomes insolvent. The current very largeGDP output gap, should it persist for any length of time, will accelerate thetiming of social security insolvency.
The most significant problem is rapid escalation in health care costs,which have been growing much more rapidly than taxable wages. Thisproblem also intersects with a growing aging population of beneficiaries. Itis well understood that substantial revisions to Medicare benefits will berequired and this should entail not just benefits reform but also health carecost containment.
c©2011 Barnett Sivon & Natter, P.C.

Longbrake The Longbrake Letter 25
3. Budgetary Options
There are three primary options on the table: President’s Fiscal Commis-sion; Republican (Paul Ryan); President Obama’s budgetary framework.There are other variants in play, including the yet to be released “Gang ofSix” Senators proposal.
President’s Fiscal Commission
Spending. The Fiscal Commission proposed reducing discretionaryspending in 2012 to the level that prevailed in fiscal year 2010. Then, dis-cretionary spending would be reduced 1% each year for the next three fiscalyears. Between 2015 and 2020 discretionary spending would be indexedto inflation. If these proposals were adopted, fiscal-year 2012 discretionaryspending would be $1.094 billion. By 2020 discretionary spending would be$267 billion less annually. The proposal contains an illustration of where$100 billion in cuts could come from domestic spending programs. $28 bil-lion would come from cuts in federal employment and salaries; $18 billionfrom eliminating 250,000 federal contractors; $16 billion from eliminatingall earmarks; and $37 billion from a variety of other sources.
Tax Expenditures, Tax Rates and Tax Base. The Commissionproposed reducing the number of tax brackets and reducing tax rates toeven lower levels than exist currently. This would be accomplished by ei-ther eliminating (Option 1 — The Zero Plan) tax expenditures or greatlydiminishing tax expenditures (Option 2). There is a third option whichwould limit itemized deductions while Congress determines how to struc-ture broader-based tax reform. The Commission’s proposal would also raisethe gas tax by 15 cents per gallon gradually beginning in 2013.
Entitlements. The Commission’s proposal would broaden the payrolltax base on a phased basis to capture 90% of wages by 2050 (86% of thebase was covered in 2009 but that is projected to fall to 82.5% by 2020under current law). The Commission’s proposal focuses both on containinghealth care cost escalation and paying for the “Doc Fix”. In the long-term, beginning in 2020, the proposal sets a goal of limiting health care costgrowth to nominal GDP growth plus 1%. This would be accomplished byestablishing a process to evaluate cost growth and mandate that steps totaken to contain costs, if savings are not being realized as expected.
c©2011 Barnett Sivon & Natter, P.C.

Longbrake The Longbrake Letter 26
Republican — Paul Ryan
Republicans are adamant that tax rates should not be raised and thatthe entirety of deficit reduction needs to be achieved through spending cuts.Significantly, however, Representative Paul Ryan’s 10-year budget proposalbegins the necessary process of downsizing entitlement programs by focusingon restructuring Medicare and Medicaid. Importantly, Ryan’s proposal doesnot touch Social Security. As is well known by all, the developing U.S.sovereign debt problem cannot be brought under long-term control withoutdealing with entitlements.
Unfortunately, the American public is in love with its entitlements. Sur-veys reveal that Americans are concerned about the budget deficit and wantit to be addressed but surveys also indicate that Americans do not wantmany federal programs to be cut and this applies emphatically to entitle-ment programs. Democrats were quick to take advantage of this by savagingRyan’s Medicare proposal. Unfortunately, the Democrats political postur-ing resonated to the extent that the Republicans have back pedaled on thisparticular proposal, at least for the time being.
President Obama’s Budgetary Framework
President Obama at last long has entered the budget debate with hisown proposal. After studiously ignoring the work and recommendations ofhis own fiscal commission after it submitted its report last December andthen subsequently submitting a budget proposal to Congress that in essencedenied the severity of the long-term debt problem, the president has finallyjoined the debate. Of course, the president’s proposal differs considerablyfrom Paul Ryan’s, reflecting differing imperatives of each one’s political con-stituency. Importantly, the president’s proposal also addresses the need torestructure entitlement programs, but the projected deficit reduction overten years is much smaller than the number targeted by Ryan.
Spending. About half of the president’s deficit reduction would comefrom spending cuts.
Tax Expenditures. About a quarter of the president’s deficit reduc-tion would come from curtailments in tax expenditures. However, this is aconcept that is not backed up with any specific proposals.
c©2011 Barnett Sivon & Natter, P.C.

Longbrake The Longbrake Letter 27
Tax Rates. While the president’s framework does not address tax ratesin general, it proposes that rate reductions for upper-income earners shouldbe allowed to expire.
Entitlements. The framework includes a number of reforms intendedto reduce federal health care spending. While there is no specifics pertainingto social security, the framework endorses that reforms should be adoptedthat maintain the long-term solvency of the program.
Budget Enforcement. The framework includes a “Debt Failsafe” pro-vision. It would require that by 2014 the debt to GDP ratio must be pro-jected to be on a stable or declining trend for the remainder of the decadeand, if this case is not met, across the board spending cuts in some, but notall federal spending programs and tax expenditures would occur. Exemptedprograms would include social security, Medicare and certain low-incomeprograms.
4. Estimated 10-Year Deficit Reduction
Each proposal included an estimated aggregate reduction in budget deficitsover time. Unfortunately these estimates are not aligned in terms of a com-mon baseline and they aggregate savings over different time periods. TheCommittee for a Responsible Federal Budget has attempted to cre-ate an apples-to-apples comparison of the three proposals. It establishes abaseline based on Congressional Budget Office assumptions and establishesa uniform 10-year assessment period (President Obama’s budgetary frame-work used a 12-year time period which is a convenient means of increasingthe size of the number, particularly when savings are back-loaded to yearsfar in the future). The 10-year savings are as follows:
· President’s Budgetary Framework $2.48 trillion· President’s original budget $0.00 trillion· Republican — Paul Ryan $4.02 trillion· President’s Fiscal Commission $4.06 trillion
The impact of each of these proposals on the federal debt to GDP ratio isshown in Chart 9 below. President Obama’s budgetary framework merelyholds the ratio constant at about 77%, while the other two proposals resultin a modest decrease in the ratio to about 68% by 2021.
c©2011 Barnett Sivon & Natter, P.C.

Longbrake The Longbrake Letter 28
5. Debt Ceiling and Budgetary Debate
What is important is that the political debate is no longer a matter ofwhether but a matter of what and when. Although Ryan’s proposal wouldbegin the fiscal consolidation process in fiscal 2012, most of its firepowerwould not take effect until after the presidential election, which means fiscal2013. My best sense is that there will be a lot of political posturing anddebate over the next two years but little significant action until after the 2012election. However, that will depend upon how hard Republicans choose topress their agenda for spending cuts and longer-term budget reforms. Boththe debt ceiling and the fiscal year 2012 continuing budget resolution are inplay and could lead to more restrictive fiscal policy sooner than later.
While reducing budget deficits is essential to restoration of long-termfiscal health of the United States, and the sooner this process is commencedthe better, let there be no doubt that fiscal consolidation will have short-term negative consequences for economic recovery and growth. This fact isnot reason for engaging in further delay because as long as the U.S. federaldebt problem remains unaddressed imbalances will continue to grow andwhen fiscal consolidation is ultimately addressed, as it will have to be, thecure will be even more painful. One has only to consider what is happeningto Greece, Ireland and Portugal to appreciate the risks of delay.
Thus, it would be better to address the budget problem now, and perhapsit will be. But, it seems more likely that serious action will be delayed foranother two years. This will not be fatal by any means, but, as I have said,the problem doesn’t get any easier with the passage of time — it gets worse.
6. Concepts and Definitions
Before exploring these concerns, let me begin by defining what constitutesthe stock of federal government debt held by the public and how the debtratio is affected over time by the annual federal budget deficit.
Total Federal Public Debt
In March 2011 the total stock of federal debt was $14.27 trillion or 95.1%of GDP. However, $4.62 trillion was intragovernmental debt, which includes
c©2011 Barnett Sivon & Natter, P.C.

Longbrake The Longbrake Letter 29
$2.43 trillion for the social security trust fund, $.54 trillion for the disabilityand the hospital and medical insurance trust funds, $1.11 trillion for federalemployee pensions and health care, and $.54 trillion for other miscellaneouspurposes. The actual amount of debt held by the public was $9.65 trillion or64.3% of GDP. It is this latter figure that best reflects the current effect ofthe government debt ratio on the economy. It is this measure that is shownin Chart 7 and it is this measure that is used in the analysis that follows.This is because intragovernmental debt does not involve actual borrowingin financial markets. Intragovernmental debt is an accounting statement offuture obligations that eventually will need to be financed through taxes orborrowing from the public.
Contingent Unfunded Obligations
The federal government’s accounting entries for the various trust fundsconstituting the bulk of intragovernmental debt reflect accumulated pasttaxes net of disbursements for benefits under the programs. Importantly,these amounts understate the present value of future benefit obligationsunder the terms of the various programs.
In an analysis (April 22, 2010), Goldman Sachs estimated the presentvalue of these off balance sheet contingent obligations. Total unfunded obli-gations amount to 187.5% of current nominal GDP. The largest amount is129.4% for unfunded entitlement payments for income security and healthbenefits. The remaining 58.1% include unfunded federal government pen-sion liabilities (26.1%), intragovernmental net debt (30.0%), and governmentsponsored enterprises net liabilities (2.1%).
While contingent obligations have no current direct impact on financialmarkets, they will have future impacts as benefit payments eventually willhave to be made and financed through tax increases or borrowing. It isimportant to understand that the term “unfunded obligations” means thatthe present value of future taxes mandated by current statutes have alreadybeen netted out.
Unfunded entitlement obligations from the social security, Medicaid andMedicare programs are driven by demographic and definable actuarial fac-tors. Thus, the timing and amount of these future obligations can be esti-mated with a reasonably high degree of precision. It is no secret that as the
c©2011 Barnett Sivon & Natter, P.C.

Longbrake The Longbrake Letter 30
baby boom generation ages and moves into retirement funding these obli-gations will either require enormous increases in tax rates or extraordinaryexpansion of borrowing. The latter would result in an explosive increase inthe public debt ratio in the future. There is a third alternative and that isto revise existing programs to scale back the amount of benefits that willhave to be paid out. That would be the most prudent course of action, butit is a difficult alternative to pursue from a political standpoint.
State and Local Governments
State and local governments are required to balance their budgets throughtax revenues. Borrowing is only permissible for capital infrastructure expen-ditures or in anticipation of defined and certain future tax receipts.
Total state and local government debt has edged up very slowly overtime from 12.8% of nominal GDP in 1975 to 16.6% at the end of 2010. Inthis respect state and local governments are not part of the incipient debtexplosion problem. However, where finances are on shaky footing in manystates involves public employee pension and health care benefits. Unlike thefederal government, states actually fund these obligations. Studies indicatethat state and local government pension plans are underfunded anywherefrom $500 billion to $3 trillion, which would be a range of 3% to 20% ofGDP. The large variation in estimated funding shortfalls stems primarilyfrom what discount rate assumption is used. The lower shortfall amountreflects an assumed perpetual annual rate of return on invested assets ofabout 8% while the larger shortfall arises when the long-term Treasury orcorporate bond rate is applied to discount future benefit obligations. Theformer rate is sanctioned by GASB, while the latter rate is required byGAAP. The likely eventual shortfall probably falls between $500 billion and$3 trillion as the earning rate on pension fund assets is likely to exceed thelow-risk long-term bond rate, but in a low-inflation, low-growth economy isunlikely to average as high as 8% on an annual basis.
Primary Deficit
The total annual budget deficit includes interest on the outstanding stockof publicly-held debt. The primary deficit omits interest payments on the
c©2011 Barnett Sivon & Natter, P.C.

Longbrake The Longbrake Letter 31
outstanding stock of debt, so that it is measured as the difference betweenannual tax revenues and expenditures.
Generally speaking, the public debt ratio will be constant when the pri-mary deficit is zero, increasing when it is positive and decreasing when itis negative. This relationship exists because the average interest rate onpublic debt tracks the level of nominal GDP growth closely over time. If theinterest rate on the debt exceeds the nominal growth rate in GDP, then thedebt ratio will increase and, of course, the opposite occurs when the interestrate on the debt is less than the growth rate in nominal GDP.
As long as market participants believe that the government will be ableto fund its debt, interest rates will remain low and closely track the nominalgrowth rate in GDP. However, as the stock of debt outstanding relative toGDP, the debt ratio, rises solvency concerns will emerge and will escalatein proportion to increases in the debt ratio. This risk can now be trackedfor various countries through the pricing for country-specific credit defaultswaps.
Public Debt Ratio
Chart 8 shows the trajectory the U.S. debt ratio will take, given as-
sumptions about nominal GDP growth embedded in my econometric model
c©2011 Barnett Sivon & Natter, P.C.
Longbrake The Longbrake Letter 32
and Goldman Sachs (2011 and 2012) and my (2013-2015) assumptions aboutannual budget deficits. At the risk of indulging in false optimism my fed-eral deficit assumptions for 2013-2015 assume that a combination of tax andspending initiatives is adopted by Congress that produces deficit and debtratio outcomes similar to what President Obama’s Fiscal Commission rec-ommended last December. The deficit would decline to 3% of GDP by theend of 2015. Given these assumptions, the debt ratio rises to 72% by the endof 2014 before stabilizing and beginning a very gradual descent. Accordingto the CBO unless Congress acts, this descent will not occur under currentlaw, but the ratio would stabilize at about 75%.
Federal Public Debt to GDP Projections for Various DeficitReduction Proposals
There are several deficit reduction proposals in play:
• President Obama’s Fiscal Commission
• Paul Ryan (Republican) Proposal
• President Obama’s Budgetary Framework
CBO publishes two budget deficit forecasts — “current law” and “ad-justed baseline”. The “current law” public debt ratio estimate assumes thattax rates return to the pre-Bush tax-cut levels and assumes that the alter-native minimum tax (AMT) is not adjusted. This is not realistic, givencurrent political considerations. CBO’s “adjusted baseline” includes an ex-tension of tax cuts for all but those with annual incomes above $250,000,assumes annual AMT and “doc” fixes, and assumes declining war costs.
Chart 9 shows the federal public debt to GDP ratio from 1975-2011 andprojections for this ratio from 2012 through 2021 for the CBO “adjustedbaseline” and the three alternative deficit-reduction proposals.
There are several things that stand out in Chart 9. First, not addressingexpenditures, entitlements and tax rates will result in the federal public debtto GDP ratio approaching the “red zone” of 90% by 2021 — “CBO adjustedbaseline”. Second, President Obama’s “budget framework” merely stabilizes
c©2011 Barnett Sivon & Natter, P.C.

Longbrake The Longbrake Letter 33
the debt ratio, while his original budget proposal (not shown in Chart 9)would result in an increasing debt ratio mirroring the trajectory shown forthe “CBO adjusted baseline”. Third, while the Fiscal Commission and PaulRyan proposals would reduce the debt ratio, surprisingly, the improvementis quite limited.
7. Effect of Deficit Spending on Economic Activity
Deficit spending can boost GDP growth temporarily but if the primarydeficit is positive, the boost in nominal GDP growth will eventually beoffset by higher inflation so that real GDP growth is unaffected by deficitspending in the long run. However, there are long time lags involved inthis process. In addition, there is some evidence that the GDP real growthbenefit diminishes as deficits grow as a percentage of GDP and as the debtratio rises.
Real GDP
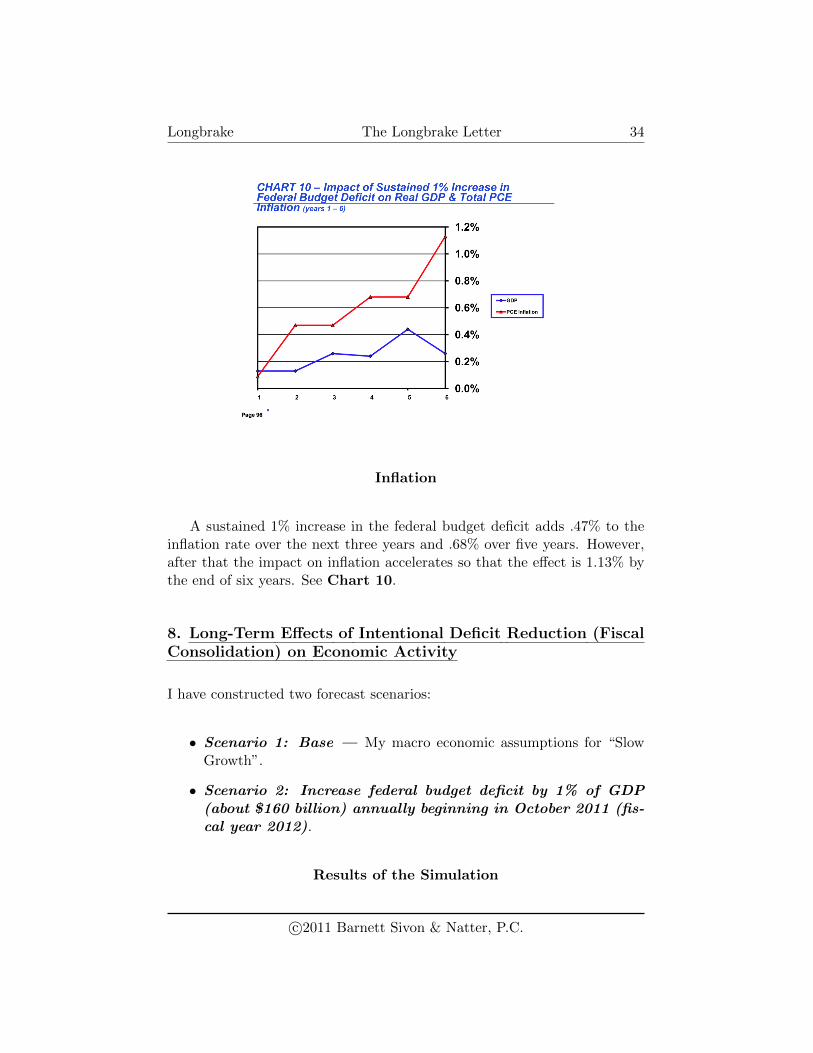
Based upon my econometric model, a sustained 1% increase in the federalbudget deficit adds 0.26% to real GDP growth over the next 3 years. Thebenefit hits a maximum after 5 years equal to 0.44% and then begins to fadeas inflation builds. See Chart 10.
c©2011 Barnett Sivon & Natter, P.C.
Longbrake The Longbrake Letter 34
Inflation
A sustained 1% increase in the federal budget deficit adds .47% to theinflation rate over the next three years and .68% over five years. However,after that the impact on inflation accelerates so that the effect is 1.13% bythe end of six years. See Chart 10.
8. Long-Term Effects of Intentional Deficit Reduction (FiscalConsolidation) on Economic Activity
I have constructed two forecast scenarios:
• Scenario 1: Base — My macro economic assumptions for “SlowGrowth”.
• Scenario 2: Increase federal budget deficit by 1% of GDP(about $160 billion) annually beginning in October 2011 (fis-cal year 2012).
Results of the Simulation
c©2011 Barnett Sivon & Natter, P.C.

Longbrake The Longbrake Letter 35
Chart 11 — Federal Budget Deficit: About 40% of the initial 1%increase in the annual federal budget deficit is offset by 2015 by increasedeconomic activity.
Chart 12 — Employment: Employment increases by 735,000, or
0.6%, by the end of 2015.
c©2011 Barnett Sivon & Natter, P.C.
Longbrake The Longbrake Letter 36
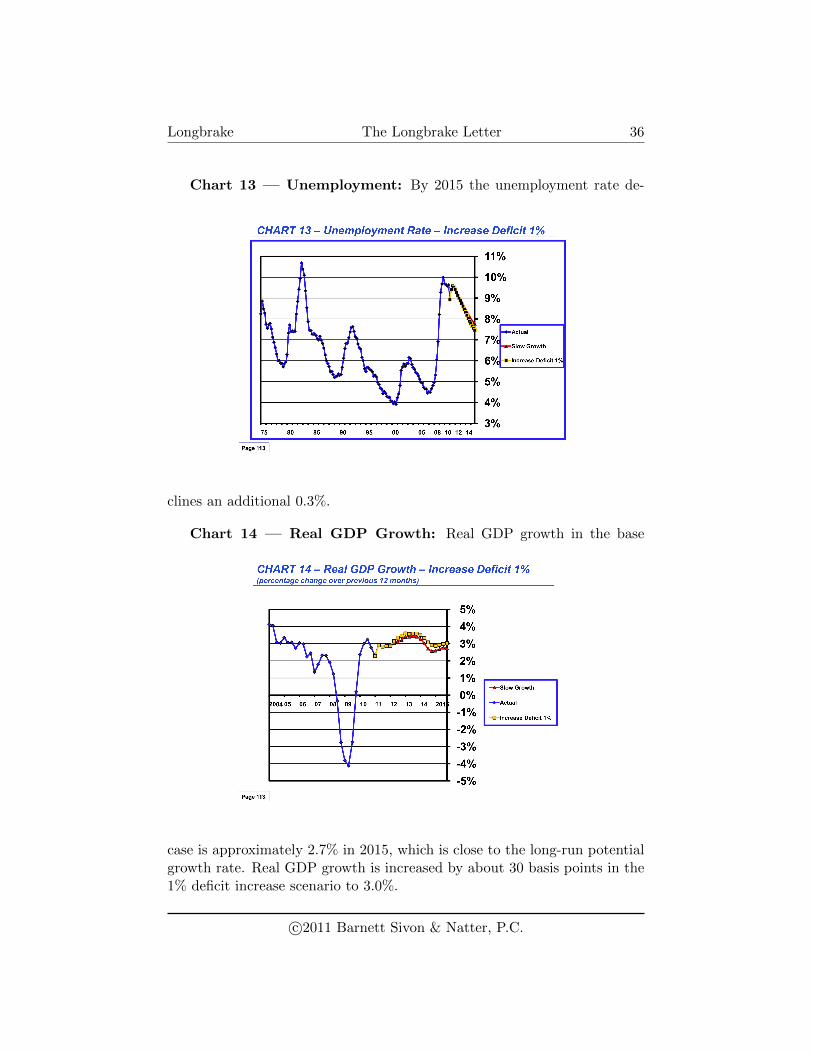
Chart 13 — Unemployment: By 2015 the unemployment rate de-
clines an additional 0.3%.
Chart 14 — Real GDP Growth: Real GDP growth in the base
case is approximately 2.7% in 2015, which is close to the long-run potentialgrowth rate. Real GDP growth is increased by about 30 basis points in the1% deficit increase scenario to 3.0%.
c©2011 Barnett Sivon & Natter, P.C.

Longbrake The Longbrake Letter 37
Chart 15 — Core PCE Inflation: In the base case core PCE inflation
accelerates sharply in early 2014 before peaking over 6% in mid-2015. It thanbegins to decline gradually. When the deficit is increased 1% annually theincrease in inflation follows the same pattern, peaking in mid-2015 at about25 basis points higher.
Chart 16 — Debt Ratio (Total Federal Debt Held by the Publicas a Percentage of GDP): The debt ratio peaks in the base case at 72.5%in early 2014 and then begins to decline gradually to 69.7% by the end of2015. Increasing the annual deficit by 1% of GDP beginning in October2011 results in a debt ratio which peaks at 73.9% in early 2014 and thendeclines to 71.0% by the end of 2015. If GDP growth were unaffected bythe 1% increase in the annual deficit, the debt ratio would be approximately74.0% at the end of 2015 rather than 71.0%. In other words, because ofpositive feedbacks of the increased deficit on GDP growth, the debt ratioincreases only from 69.7% to 71.0% rather than to 74.0%. Unfortunately,this compression in impact also works in reverse when the annual deficitis reduced — the debt ratio does not fall by the amount of the reductionin the deficit because GDP growth slows and tax expenditures increase asunemployment rises. This explains why it will be very hard to reduce thedebt ratio very quickly even if the deficit reduction policy ultimately put inplace is substantial, as can be seen in Chart 9.
c©2011 Barnett Sivon & Natter, P.C.

Longbrake The Longbrake Letter 38
The debt ratio came down considerably during the Clinton administra-tion without visible negative economic consequences because the economywas strong and got stronger as time passed. What this suggests is thatstarting conditions matter a great deal. When the private sector is robust,intentional shrinkage of the public sector can easily be absorbed and mayeven have a favorable impact on growth. However, when the economy is frag-ile and weak, as it is now, withdrawal of government stimulus will negativelyimpact economic activity and will not result in a very rapid improvement inthe debt ratio.
9. Long-Term Options for Resolving the Problem of TooMuch Debt
Austerity (Fiscal Consolidation) Option
Decreasing the federal deficit through either spending reductions or taxincreases — the austerity or fiscal consolidation option — will extendeconomic weakness for a considerable period of time. Austerity and defla-tion go hand in hand. This is the option that Greece has been forced toimplement. However, in the case of Greece the medicine is a reduction of a14% deficit to about 3% over three years. One year into austerity, GDP hasfallen more than projected and the annual deficit and debt ratios have not
c©2011 Barnett Sivon & Natter, P.C.

Longbrake The Longbrake Letter 39
fallen as much as expected. Simply put, trying to work down a huge debtburden through spending cuts and tax increases depresses economic activityand reduces tax revenues.
In the case of Greece, the debt load was so large to begin with and thefiscal consolidation requirements were so draconian that it is hardly surpris-ing that the economy has been devastated and little substantive progress hasbeen made. That is the point of the Rogoff and Reinhart study — abovesome level of debt to GDP fiscal consolidation will not work. The conse-quences of the austerity option are high unemployment, numerous bankrupt-cies and significant credit defaults and losses. Restructuring of the debt inGreece to 30% to 50% of its nominal value is inevitable. The rating agen-cies have just engaged in another round of downgrades and ratings are nowdeeply in junk territory. Two-year Greek debt is now returning in excessof 25%, which means that a substantial default premium is now embedded.Yet, members of the European Union refuse to discuss any alternatives otherthan Greece continuing to pursue fiscal consolidation.
In the case of the U.S. Congress increasingly recognizes the risks of in-action but there is not yet a collective sense of urgency. Political advantageis guiding the current debate rather than the parties acknowledging thatthe situation is so serious that a bipartisan approach is essential. Thus, themost likely result until after the 2012 presidential election is a lot of noiseand little substantive action to reduce the deficit and stabilize the debt toGDP ratio. What is underappreciated is that the cost of delaying action willbe an escalating debt ratio. And, the deeper the hole becomes, the harderand more painful it will become to extricate ourselves from that hole. Timeis not our friend.
Inflation Option
An alternative to austerity and fiscal consolidation is the inflation op-tion. This option involves, either intentionally or by default through inac-tion, letting inflation escalate to very high levels. Inflation results in shrink-ing the real value of debt relative to the nominal value of GDP, providedthat the primary deficit is kept to zero or is negative. There are two prob-lems with this option. First all debt would be affected, not just sovereigndebt. This would involve a destabilizing transfer of wealth from savers todebtors. Second, sovereign debt to GDP ratios would shrink a bit at first,
c©2011 Barnett Sivon & Natter, P.C.

Longbrake The Longbrake Letter 40
but this improvement would end quickly as the interest rates on sovereigndebt skyrocket in lockstep with the increase in inflation. Thus, private debtwould be destroyed but public debt would balloon.
The value of all financial assets, not just public debt, is debased andthe standard of living of those dependent upon fixed incomes will decline,perhaps dramatically.
Default Option
A final, last resort, option is to default on debt. The default optionis unthinkable for the United States because of the global reserve currencystatus of the dollar. However, this option is not unthinkable for other coun-tries. Indeed, many believe that it is only a matter of time before Greecewill be forced into the default option. The default option involves eitherrepudiating sovereign debt obligations altogether or renegotiating a signifi-cantly reduced principal amount. The consequences of this option are thatcountries that default find access to global credit markets restricted for anextended period of time and this impairs their ability to finance economicactivity and trade.
10. Summary
Needless to say, none of the options are particularly attractive. But, clearlythe best is that of fiscal consolidation, provided that the federal debt toGDP ratio has not entered the “red zone”. And, I will say it one more time:the sooner the process is commenced to reduce the size of the budget deficitto no more than the cost of interest carry the better. This would stabilizethe debt ratio at its current level so that at the very least the fiscal situationwould not worsen. However, a better policy would be to run a primarybudget surplus that would result in a gradual reduction in the federal debtto GDP ratio. It needs to be understood that running a primary budgetsurplus will dampen economic activity, so care should be exercised to limitthe size of the primary budget surplus. And, again repeating an obviousbut too-oft ignored truth, delay is an enemy not a friend. Delay will resultin an ever increasing federal debt to GDP ratio. And, the high the ratio themore painful will be the medicine required to bring it down to a tolerablelevel. And, if the ratio gets too high, the fiscal consolidation option will no
c©2011 Barnett Sivon & Natter, P.C.

Longbrake The Longbrake Letter 41
longer be viable and default option will be the only realistic choice. That iswhere Greece is heading. The U.S. is a long ways from being close to suchan outcome but it is no longer a risk that can safely be ignored.
Bill Longbrake is an Executive in Residence at the Robert H. SmithSchool of Business at the University of Maryland.
c©2011 Barnett Sivon & Natter, P.C.