bigtel digital tv - api.dare2compete.com · the case study is an intellectual property of bharti...
TRANSCRIPT
Bigtel Digital TV
Industry Highlights
The Entertainment Market in India is going through rapid and major shifts with new innovations,
technology and corresponding Governmental policies kicking in, assisted by several macroeconomic
changes. A country that knew only “Doordarshan” as the only source of entertainment nearly about 3
decades ago, is now spoilt for choice across several TV channels, Internet and OTT options.
There are approximately 29.0 Cr households, of which 64.5% have television sets. Around 15% of these
households do not spend for the content – they typically use the broadcasting services provided by the
Government that goes by the name DD FreeDish. Out of the remaining, 35% of the customers are DTH
subscribers and the remaining subscribe to analog and digital cable services.
The other growing and major form of entertainment comes via internet (YouTube, etc.) that cannot be
directly monetized for content. However, on the back of rapid penetration of fiber and mobile based
broadband and newer players entering the telecom arena, data costs have come down and usages spiraled
up. Taking advantage of the same, several domestic TV content broadcasters have launched their apps
globally as well as several OTT providers like Amazon Video and Netflix have caught the frenzy of the
youth. These have definitely carved out a niche for themselves in the market and certainly taken away a
sizeable wallet-share from the pay TV customers, leading to a fall in ARPU for the same. While the PayTV
revenues are currently around 65200 Cr as of 2017, OTT revenues have shot up to 1475 Cr in about a couple
of years. Market Scenario
The PayTV market is scheduled to grow at a CAGR of 7% from 2017 to 2022. Subscriber base is forecasted
to grow by 3.7% CAGR. Cable TV ARPUs (Average Revenue per User) have typically been on the lower
side compared to DTH – the latter making more than 230 INR per month on the back of better services like
recording and video on demand and HD offerings. Overall ARPU stands at INR 200 as of 2017. With the Government’s push towards digitalization (Digital Access System), many analog cable subscribers were
actively brought to the DTH fold. This further levelled the field for DTH players as cable TV players were earlier
able to under-report revenues without set top boxes at the subscriber end. However Doordarshan’s Free-to-Air
(FTA) platform ‘Freedish’ has been gaining massive popularity in the rural areas primarily due to its appeal of
no recurring monthly charges. This has been preventing DTH operators to gain significantly post digitization in
the Phase 4 areas. Further, GST subsumed entertainment taxes, which benefited the DTH industry as the overall
tax outgo on revenue fell from an average of 23% to 18%. About Bigtel
Indian DTH Market reported 15000 Cr INR of revenues in 2017. 90% of the market is dominated by 4
players, Bigtel being one of them. Bigtel Digital TV is a pioneer in the Indian DTH category with many
industry firsts to its credit. It has always been at the forefront of introducing new technology products in
an enriching manner to its customers. Currently, Bigtel has a 20% CMS (Customer Market Share, defined
as Bigtel customer base divided by the total DTH market base) and 24% RMS (Revenue Market Share,
defined as Bigtel revenue divided by the total DTH market revenue) in the DTH market. Typically, the
2 The case study is an intellectual property of Bharti Airtel Ltd. No part of this text can be put to any commercial use except from the written permission from the owners. The data provided here is illustrative and may not correspond to the actual market conditions.
company sees itself catering to 4 market segments; Basic (Rs200), Value (Rs300), Economy (Rs400) and
Premium (Rs500), named basis increasing ARPU.
Bigtel has 3 types of set-top boxes (STB) – Standard Definition (SD), High Definition (HD) and HD-DVR
(with in-built recording of 500GB). A new android based STB has just been launched by Bigtel which allows
customers to watch regular linear TV along with downloading apps from the Android Play store and watch
OTT/ online videos and content on their TV screens.
Bigtel is currently in the process of formulating its strategy for the next 3 years and is facing the following
challenges:
Existing customers are slowly migrating from the Value and Economy segments to the Basic segment.
Gross acquisitions are coming on the Basic segment. A big reason behind this could be the fact that today
the opportunity majorly lies in the remotest rural areas coming under the phase IV of the Government’s
digitization push. However these customers come at a significantly lower ARPU.
In the Urban areas, the customer growth will primarily come from the cable users, but these
customers are in the habit of paying much lower charges compared to DTH and want all channels
for the lowest price possible. At the other extreme, the Premium segment is gradually shifting its content consumption from
traditional linear TV to online, on-demand and OTT apps.
Given the above context you are required to speak to ~500 consumers across various segments to
understand their needs, current and evolving, and comment on the following areas:
1. What are the key trends which are impacting the revenue growth of Bigtel over the last 1 year? 2. What are the key challenges that Bigtel is facing in each customer segment – Basic, Value,
Economy & Premium? 3. How do you see the market evolving over the next 3-5 years? Which customer segment(s) would
you recommend Bigtel to focus on over the next 3 years and why? What will be your recommended
product strategy to cater to each segment?
3 The case study is an intellectual property of Bharti Airtel Ltd. No part of this text can be put to any commercial use except from the written permission from the owners. The data provided here is illustrative and may not correspond to the actual market conditions.
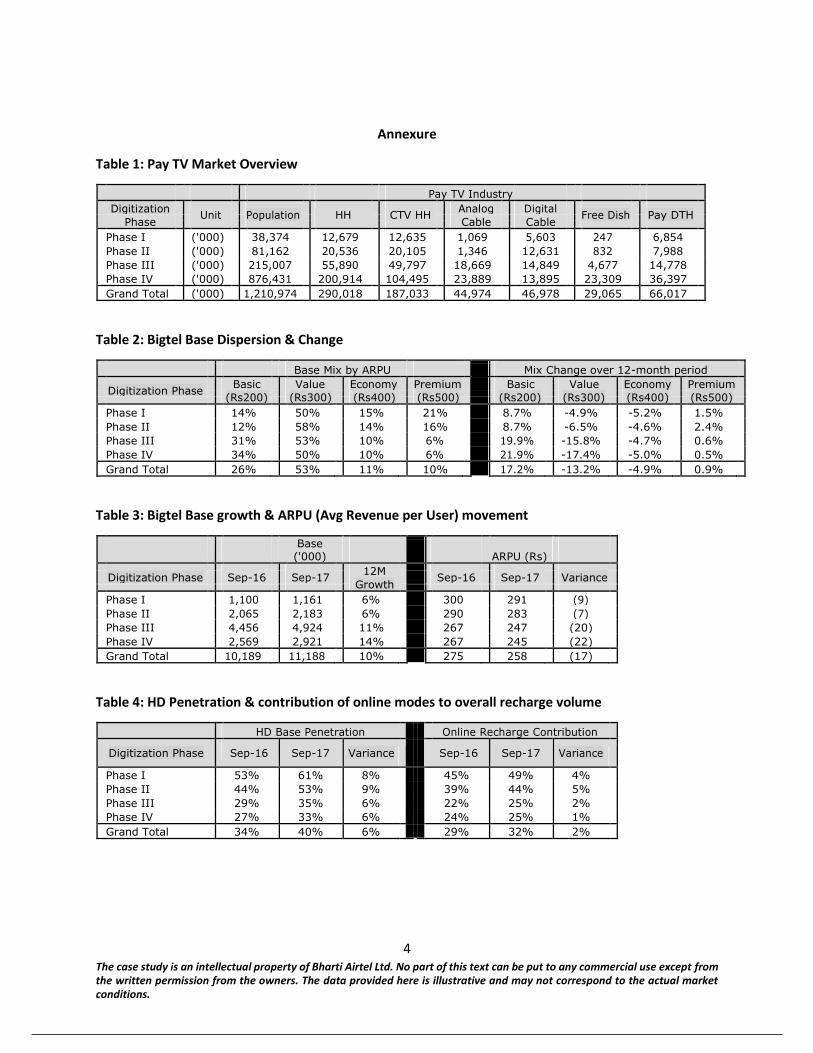
Annexure
Table 1: Pay TV Market Overview
Pay TV Industry
Digitization
Unit
Population
HH
CTV HH
Analog Digital
Free Dish
Pay DTH
Phase
Cable
Cable
Phase I ('000) 38,374 12,679 12,635 1,069 5,603 247 6,854
Phase II ('000) 81,162 20,536 20,105 1,346 12,631 832 7,988
Phase III ('000) 215,007 55,890 49,797 18,669 14,849 4,677 14,778
Phase IV ('000) 876,431 200,914 104,495 23,889 13,895 23,309 36,397
Grand Total ('000) 1,210,974 290,018 187,033 44,974 46,978 29,065 66,017
Table 2: Bigtel Base Dispersion & Change
Base Mix by ARPU
Mix Change over 12-month period
Digitization Phase
Basic Value Economy Premium Basic Value Economy Premium
(Rs200)
(Rs300)
(Rs400)
(Rs500)
(Rs200)
(Rs300)
(Rs400)
(Rs500)
Phase I 14% 50% 15% 21% 8.7% -4.9% -5.2% 1.5%
Phase II 12% 58% 14% 16% 8.7% -6.5% -4.6% 2.4%
Phase III 31% 53% 10% 6% 19.9% -15.8% -4.7% 0.6%
Phase IV 34% 50% 10% 6% 21.9% -17.4% -5.0% 0.5%
Grand Total 26% 53% 11% 10% 17.2% -13.2% -4.9% 0.9%
Table 3: Bigtel Base growth & ARPU (Avg Revenue per User) movement
Base ('000)
ARPU (Rs)
Digitization Phase
Sep-16
Sep-17
12M
Sep-16
Sep-17
Variance
Growth
Phase I 1,100 1,161 6% 300 291 (9)
Phase II 2,065 2,183 6% 290 283 (7)
Phase III 4,456 4,924 11% 267 247 (20)
Phase IV 2,569 2,921 14% 267 245 (22)
Grand Total 10,189 11,188 10% 275 258 (17)
Table 4: HD Penetration & contribution of online modes to overall recharge volume
HD Base Penetration
Online Recharge Contribution
Digitization Phase Sep-16 Sep-17 Variance Sep-16 Sep-17 Variance
Phase I 53% 61% 8% 45% 49% 4%
Phase II 44% 53% 9% 39% 44% 5%
Phase III 29% 35% 6% 22% 25% 2%
Phase IV 27% 33% 6% 24% 25% 1%
Grand Total 34% 40% 6% 29% 32% 2%
4 The case study is an intellectual property of Bharti Airtel Ltd. No part of this text can be put to any commercial use except from the written permission from the owners. The data provided here is illustrative and may not correspond to the actual market conditions.
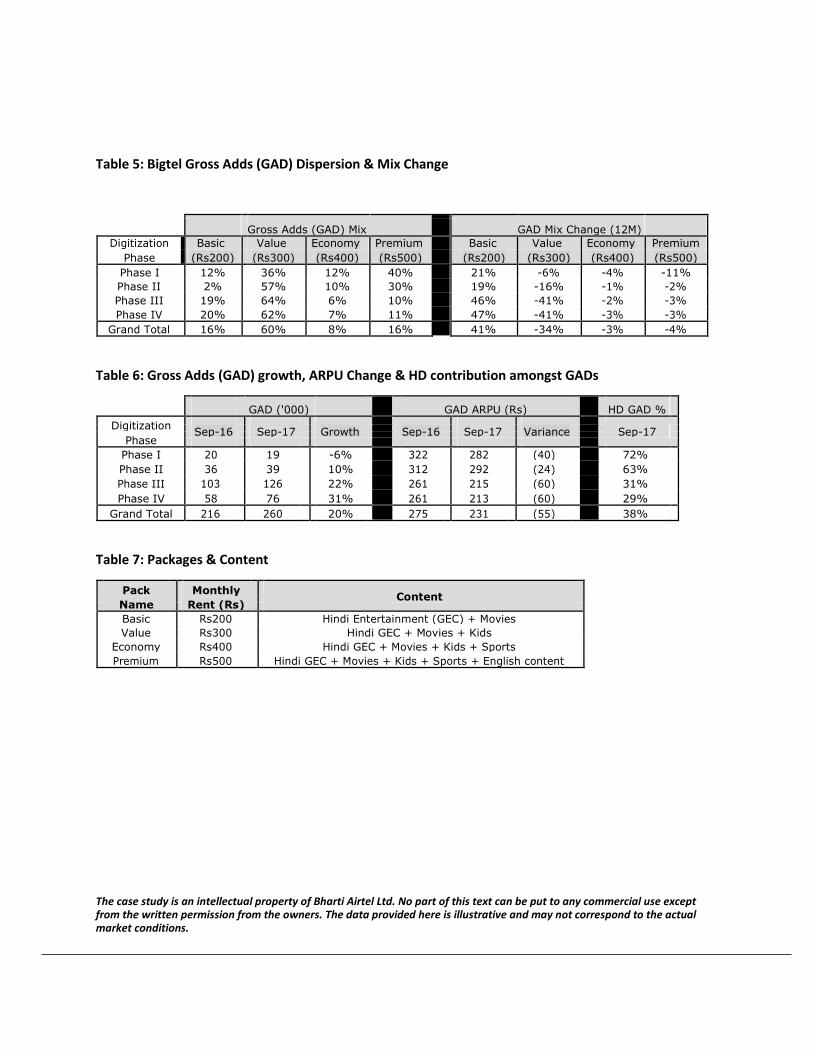
Table 5: Bigtel Gross Adds (GAD) Dispersion & Mix Change
Gross Adds (GAD) Mix
GAD Mix Change (12M)
Digitization Basic Value Economy Premium Basic Value Economy Premium
Phase (Rs200) (Rs300) (Rs400) (Rs500) (Rs200) (Rs300) (Rs400) (Rs500)
Phase I 12% 36% 12% 40% 21% -6% -4% -11%
Phase II 2% 57% 10% 30% 19% -16% -1% -2%
Phase III 19% 64% 6% 10% 46% -41% -2% -3%
Phase IV 20% 62% 7% 11% 47% -41% -3% -3%
Grand Total 16% 60% 8% 16% 41% -34% -3% -4%
Table 6: Gross Adds (GAD) growth, ARPU Change & HD contribution amongst GADs
GAD ('000) GAD ARPU (Rs) HD GAD % Digitization
Sep-16
Sep-17
Growth
Sep-16
Sep-17
Variance
Sep-17
Phase
Phase I 20 19 -6% 322 282 (40) 72%
Phase II 36 39 10% 312 292 (24) 63%
Phase III 103 126 22% 261 215 (60) 31%
Phase IV 58 76 31% 261 213 (60) 29%
Grand Total 216 260 20% 275 231 (55) 38%
Table 7: Packages & Content
Pack Monthly Content
Name
Rent (Rs)
Basic Rs200 Hindi Entertainment (GEC) + Movies
Value Rs300 Hindi GEC + Movies + Kids
Economy Rs400 Hindi GEC + Movies + Kids + Sports
Premium Rs500 Hindi GEC + Movies + Kids + Sports + English content
The case study is an intellectual property of Bharti Airtel Ltd. No part of this text can be put to any commercial use except from the written permission from the owners. The data provided here is illustrative and may not correspond to the actual market conditions.
Submission Guidelines
The deadline for submission is 23:59 hrs, Nov 2, 2018
Round 1:
A 1-page executive summary or 2 slide presentation has to be submitted. Use of
tables, etc. is allowed
Additional information from online and offline sources can be used to solve your
case and is encouraged in order to make your plan more implementable
Font style to be used is Arial and font size should be 10
The submission should be a PDF file at dare2compete.com
Naming convention to be followed: <Team Name>_<College Name>_Stratatel_R1
Round 2 (on campus final round):
The final presentation will be a Power-point deck (.pdf/.ppt/.pptx)
The presentation should not be more than 5 slides
Further details will be informed in due course
Evaluation Criteria
Exhaustive understanding of the case scenario and context
Depth of analysis of industry & key challenges - Novelty, feasibility and
practicality of ideas proposed
Structure of presentation & clarity of ideas conveyed