big idea! - quia
TRANSCRIPT
BIG IDEA! Big Idea 1: The process of evolution drives the diversity and unity of life
Key Terms for this section:
□ adaptation □ evolution □ population
□ adaptive radiation □ fertility □ protobiont
□ allele □ founder effect □ random mating
□ allopatric speciation □ gene flow □ reproductive isolation
□ analogous structures □ gene pool □ serial endosymbiosis
□ antibiotic resistance □ genetic drift □ sexual selection
□ artificial selection □ homologous structures □ speciation
□ bottleneck effect □ hybrid □ species
□ cladograrns □ immigration □ stabilizing selection
□ clade □ isolation types □ sterility
□ common ancestor □ limited resources □ sympatric speciation
□ convergent evolution □ mutation □ variation
□ directional selection □ natural selection □ vestigial organs
□ disruptive selection □ outgroup □ viability
□ divergent evolution □ phenotype
□ emigration □ phylogenetic tree
1
ro 0,
~ "' ., 0,
"' a. "' £ 0
" "' a. >, C:
"' 0, C:
·~ ~ 0 g, ·;;.. a. 0 u 'C ., N ·g ~ "' C: :::,

2 I BIG IDEA 1
1.A Change in the genetic makeup of a population over time is evolution.
• Natural selection is a major mechanism of evolution. • Natural selection acts on phenotypic variations in populations. • Evolutionary change is also driven by random processes. • Biological evolution is supported by scientific evidence from many disciplines, including
mathematics.
Survival and reproduction are necessary.for variation that Leads to changes in allele frequencies. • Ecosystems possess unique carrying capacities that address limited resources, competition, and
reproductive potential. Organisms that survive and reproduce will pass on traits to the next generation.
• Variation occurs w ithin a population and is heritable. • Evolution occurs as traits accumulate in a population. • The size of the gene pool affects the rate of mutation.
Each oval represents a single individual.
Three alleles- X1, X2 and Xr -exist at locus X in this population. Each diploid individual carries two copies of the gene, which may be the same
_,.~---, or different alleles. No diploid individual can have more than two of the alleles.
Gene pool of population
Natural selection is a driving.force.for evolution and may act upon a population in a variety of ways. • Natural selection describes a process where the organisms with the most favorable traits in an
environment have an increased reproductive fitness. • Mutation introduces new alleles. A mutation is an error in the DNA that happens during DNA
replication or meiosis. • Emigration and immigration impact allele frequency. As individuals move into or out of an area,
alleles move in and out of the gene poo l. This movement of alle les is called gene flow. • Genetic drift can affect alle le frequencies by random chance altering allele frequencies when
populations are small. It often occurs following a bottleneck or founder effect. Mating patterns, such as inbreeding and sexual selection, affect allele frequency.
• Sexual selection occurs when mating is not completely random. Individuals that are selected more often as mates w ill contribute more alleles to future generations than the less desirable mates.

BIG IDEA 1 I 3
Specific phenotypes provide adaptations to populations which make them more likely to survive and reproduce in a given ecosystem.
• Stabilizing selection favors individuals with inte1mediate phenotypes and extreme phenotypes are selected against; heterozygote advantage is an example of stabilizing selection.
• Directional selection favors individuals with one extreme phenotype while the other extreme is selected against.
• Distruptive or diversifying selection favors the extreme phenotypes while the intermediate
phenotypes are selected against.
I , I
Evolved populatin /
(a) Directional selection
Phenotypes (fur color)
+
(b) Diversifying selection ( c) Stabilizing selection
Evolution follows several different patterns based upon different selective pressures. • Convergent evolution occurs when two populations of dissimilar organisms evolve similar
morphological traits because they are exposed to similar selective pressures. • Parallel evolution is similar to convergent evolution; the organisms however, do not need to occupy
the same niches. • Divergent evolution occurs when organisms have evolved new traits in their environment that
cause them to phenotypically diverge from a common ancestor. • Adaptive radiation occurs as a species diverges across several different ecosystems and there are
many new species that accumulate very rapidly.
Variation within a population is a necessary condition for natural selection to occur. This variation occurs through several processes.
• Mutations are errors that result in genetic changes that can occur during DNA replication or during
me1os1s. • Crossing over occurs during meiosis. Homologous chromosomes pair up during synapsis and
exchange a piece of genetic material at the chiasmata

4 I BIG IDEA 1
• Independent assortment occurs during meiosis. Pairs of homologous chromosomes align randomly along the equatorial plate. Paternal and maternal chromosomes are separated randomly during anaphase I of meiosis.
• Random fertilization occurs when any one spenn from the many possibilities fuses with any one egg (there may also be many egg possibilities).
• Diploidy occurs in eukaryotes when cells carry two copies of each chromosome type yielding two sets of chromosomes. This allows members of populations to have alleles that are not expressed yet which can be passed on to offspring.
The Hardy-Weinberg equilibrium provides a mathematical way to study the allele.frequency changes within a population.
• If the following Hardy-Weinberg conditions are maintained, the population's allele and genotype frequencies will remain constant: ✓ Large breeding population is necessa1y to avoid genetic drift. ✓ Random mating is necessary to avoid sexual selection. ✓ No mutation of alleles can cause the emergence of new alleles. ✓ No differential migration can bring alleles in and out of the population. ✓ No selection can occur that alters the allele frequencies.
• If A and a are alleles for a gene and each individual ( diploid) caITies nvo alleles, then p is the frequency of the A (dominant) allele and q is the frequency of the a (recessive) allele.
• Populations in genetic equilibrium are represented by the following equations: p+q= 1.0 (100%) p2 + 2pq + q2 = 1
where: p 2 = frequency of the homozygous dominant genotype 2pq = frequency of the heterozygote genotype q2 = frequency of homozygote recessive genotype
Evidence for evolution spans several scientific disciplines and helps us to determine evolutionary relationships.
• Examination of the amino acid sequences of proteins and nucleotide sequences of DNA through molecular biology techniques reveals that closely related species exhibit similar nucleotide sequences and proteins. • In addition, closely related species share a higher percentage of the amino acid sequence than
distantly related species. • Structural similarities of body parts give rise to the understanding of evolutionary relationships.
• Analogous structures: structures that appear similar in two umelated organisms and may have similar functions but different structural anatomy
■ Vestigial organs: organs that have no apparent function, but resemble ancestral structures • Homologous structures: structures with different apparent functions, but similar structural
anatomy; due to a the presence of a common ancestor.
0can you ... D identify the mechanisms of how variation occurs in a given population?
D explain how the effects of genetic drift vary based upon population size?
BIG IDEA 1 I 5
D discuss the different types of selection, and describe how each drives evolution?
D determine the frequency of the dominant allele if the frequency of the recessive allele is given?
D detennine the frequency of the recessive allele if the percentage of the population with the recessive phenotype is given?
D calculate the percentage of the population with recessive allele if the percentage of the population expressing the dominant allele is given?
D differentiate between the frequency of an allele and the frequency of a genotype?
D interpret a graph showing how evolution favors d ifferent phenotypes?
D explain the changes in a gene pool as a result of emigration and inunigration?
D explain how certain selective pressures can increase or decrease the fitness of a particular population?
6 I BIG IDEA 1
1.B Organisms are linked by lines of descent from common ancestry.
• Organisms share many conserved core processes and features that evolved and are widely distributed among organisms today.
• Phylogenetic trees and cladograms are graphical representations of evolutionary history that can be tested.
Similarities within the genetic code of all organisms support structural and functional similarities between organisms.
• There are striking similarities between DNA, RNA and amino acids across all domains. • Molecular similarities suppo1i the central biological premise that living organisms share common
ancest1y.
Specific cellular similarities support relatedness between organisms. • Cytoskeletal elements, membrane bound organelles including mitochondria and chloroplasts,
chromosome structure and the endomembrane system maintain similarities across many different species.
• Ribosome structure, and membrane structures support common ancestry. • Mitochondrion and chloroplast structures support prokaryotic ancestry.
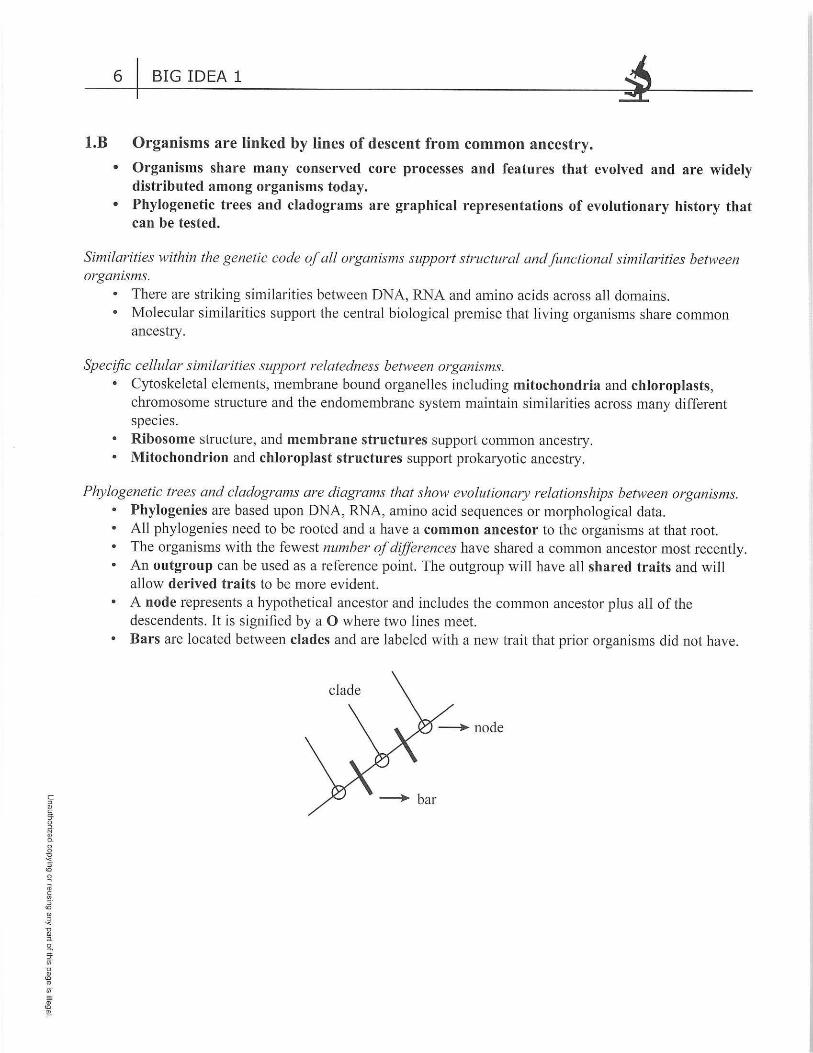
Phylogenetic trees and cladograms are diagrams that show evolutionary relationships between organisms. • Phylogenies are based upon DNA, RNA, amino acid sequences or morphological data. • All phylogenies need to be rooted and a have a common ancestor to the organisms at that root. • The organisms with the fewest number of differences have shared a common ancestor most recently. • An outgroup can be used as a reference point. The outgroup will have all shared traits and will
allow derived traits to be more evident. • A node represents a hypothetical ancestor and includes the common ancestor plus all of the
descendents. It is signified by a O where two lines meet. • Bars are located between clades and are labeled with a new trait that prior organisms did not have.
BIG IDEA 1 I 7
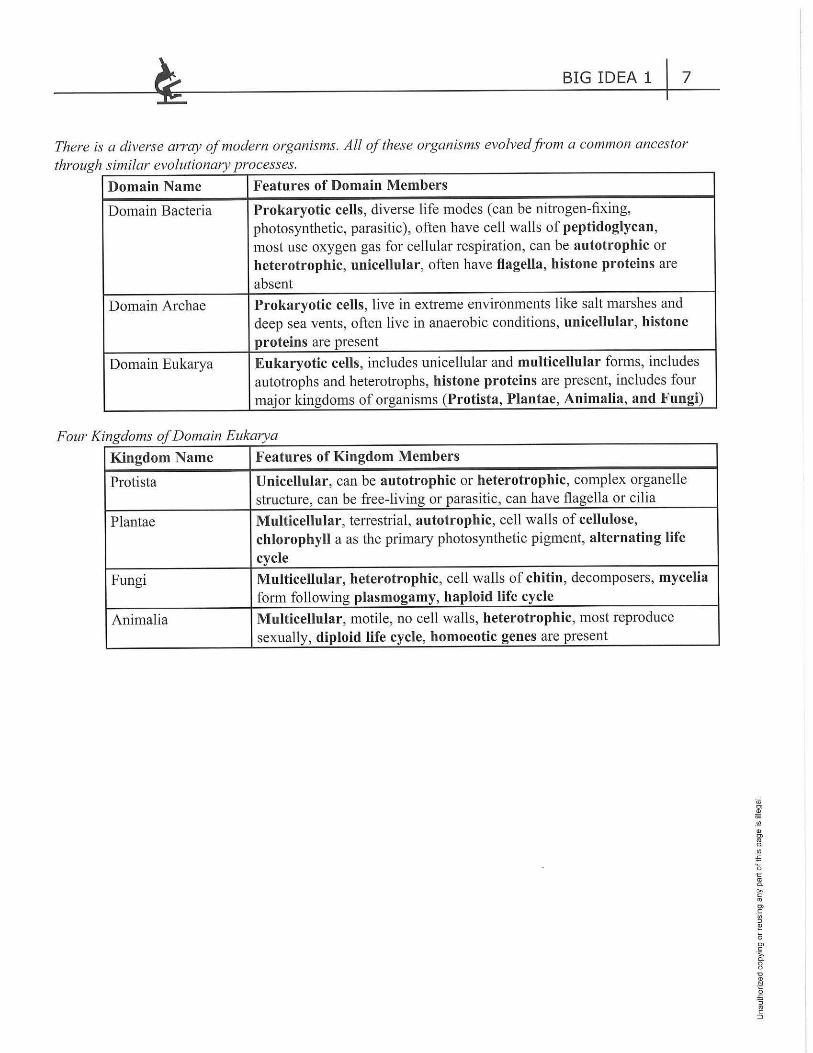
There is a diverse array of modern organisms. All of these organisms evolved from a common ancestor through similar evolutionary processes.
Domain Name Features of Domain Members
Domain Bacteria Prokaryotic cells, diverse life modes ( can be nitrogen-fixing, photosynthetic, parasitic), often have cell walls of peptidoglycan, most use oxygen gas for cellular respiration, can be autotrophic or heterotrophic, unicellular, often have flagella, histone proteins are absent
Domain Archae Prokaryotic cells, live in extreme environments like salt marshes and deep sea vents, often live in anaerobic conditions, unicellular, histone proteins are present
Domain Eukaiya Eukaryotic cells, includes unicellular and multicellular fo1ms, includes autotrophs and heterotrophs, histone proteins are present, includes four major kingdoms of organisms (Protista, Plantae, Animalia, and Fungi)
Four Kingdoms of Domain Euka,ya
Kingdom Name Features of Kingdom Members
Protista Unicellular, can be autotrophic or heterotrophic, complex organelle structure, can be free- living or parasitic, can have flagella or cilia
Plantae Multicellular, ten-estrial , autotrophic, cell walls of cellulose, chlorophyll a as the primaiy photosynthetic pigment, alternating life cycle
Fungi Multicellular, heterotrophic, cell walls of chitin, decomposers, mycelia form following plasmogamy, haploid life cycle
Animalia Multicellular, motile, no cell walls, heterotrophic, most reproduce sexually, diploid life cycle, homoeotic genes are present
"' Cl
~ "' Q) Cl
"' C.
"' £ 0 t "' C. >, <= "' Cl <= ·.,; :, I!! 1i Cl <= ·;;:. C.
8
~ i "' <= ::,
8 I BIG IDEA 1
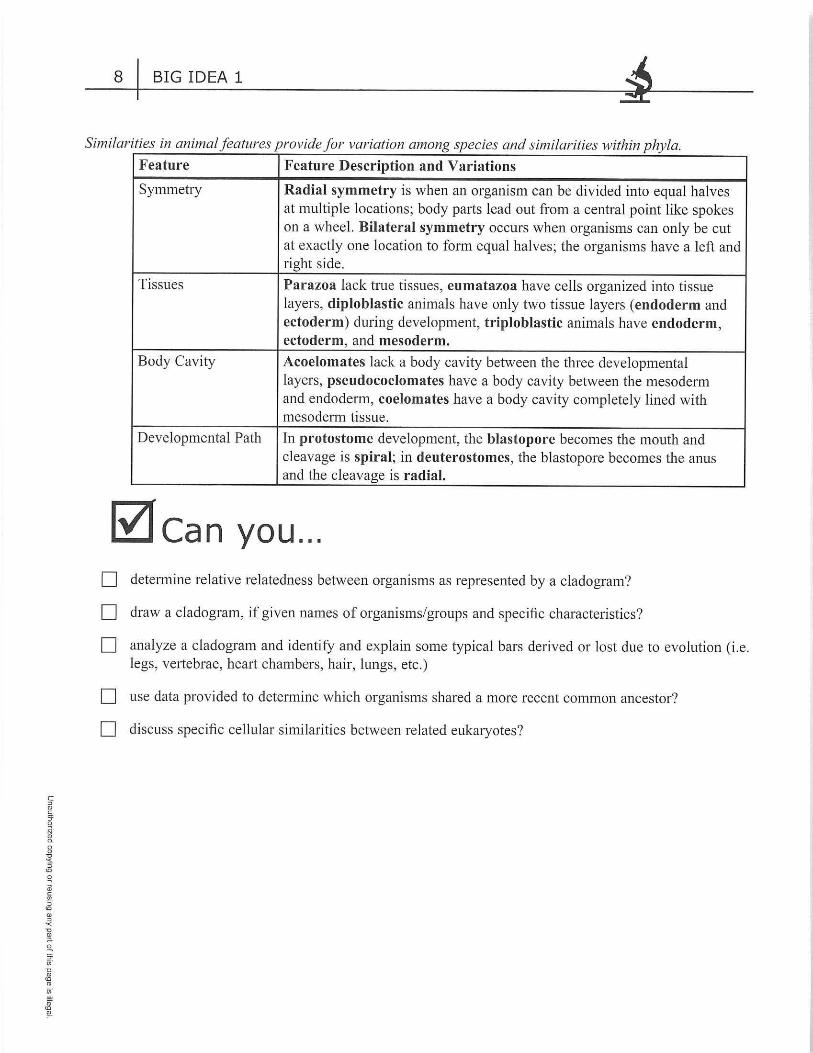
Similarities in animal features provide for variation among species and similarities within phyla.
Feature Feature Description and Variations
Symmetry Radial symmetry is when an organism can be divided into equal halves at multiple locations; body parts lead out from a central point like spokes on a wheel. Bilateral symmetry occurs when organisms can only be cut at exactly one location to form equal halves; the organisms have a left and right side.
Tissues Parazoa lack true tissues, eumatazoa have cells organized into tissue layers, diploblastic animals have only two tissue layers (endoderm and ectoderm) during development, triploblastic animals have endoderm, ectoderm, and mesoderm.
Body Cavity Acoelomates lack a body cavity between the three developmental layers, pseudocoelomates have a body cavity between the mesoderm and endoderm, coelomates have a body cavity completely lined with mesoderrn tissue.
Developmental Path In protostome development, the blastopore becomes the mouth and cleavage is spiral; in deuterostomes, the blastopore becomes the anus and the cleavage is radial.
ltlcan you ... D detennine relative relatedness between organisms as represented by a cladogram?
D draw a cladogram, if given names of organisms/groups and specific characteristics?
D analyze a cladogram and identify and explain some typical bars derived or lost due to evolution (i.e. legs, vertebrae, heart chambers, hair, lungs, etc.)
D use data provided to determine which organisms shared a more recent common ancestor?
D discuss specific cellular similarities between related eukaryotes?
BIG IDEA 1 I 9
1.C Life continues to evolve within a changing environment.
• Speciation and extinction have occurred throughout the Earth's history. • Speciation may occur when two populations become reproductively isolated from each other. • Populations of organisms continue to evolve.
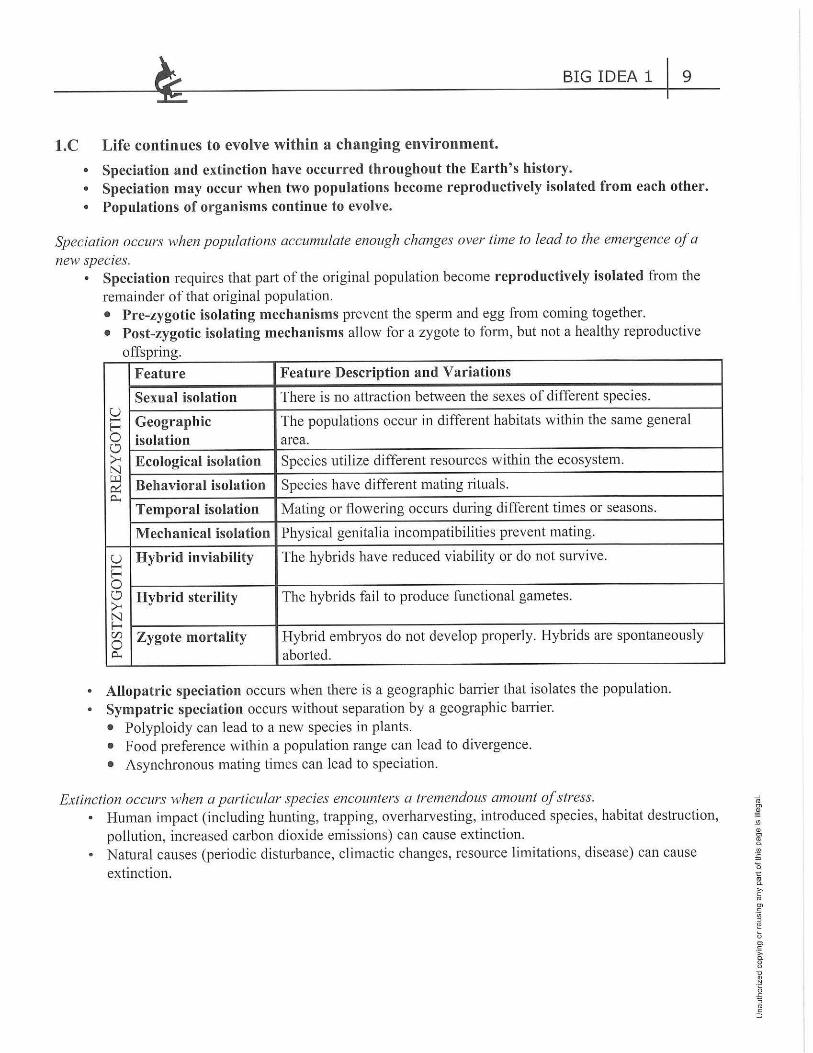
Speciation occurs when populations accumulate enough changes over time to lead to the emergence of a new species.
• Speciation requires that part of the original population become reproductively isolated from the remainder of that original population. • Pre-zygotic isolating mechanisms prevent the sperm and egg from coming together. • Post-zygotic isolating mechanisms allow for a zygote to form, but not a healthy reproductive
offspring.
Feature Feature Description and Variations
Sexual isolation There is no attraction between the sexes of different species. u
Geographic The populations occur in different habitats within the same general -E--0 isolation area. 0 >< Ecological isolation Species utilize different resources within the ecosystem. N µ.l
Behavioral isolation Species have different mating rituals. 0::: 0...
Temporal isolation Mating or flowering occurs during different times or seasons.
Mechanical isolation Physical genitalia incompatibilities prevent mating.
u Hybrid inviability The hybrids have reduced viability or do not survive. -E--0 0 Hybrid sterility The hybrids fail to produce functional gametes. >< N E--ifJ Zygote mortality Hybrid embryos do not develop properly. Hybrids are spontaneously 0 0... aborted.
• Allopatric speciation occurs when there is a geographic baITier that isolates the population. • Sympatric speciation occurs without separation by a geographic ba1Tier.
• Polyploidy can lead to a new species in plants. • Food preference within a population range can lead to divergence. • Asynchronous mating times can lead to speciation.
Extinction occurs when a particular species encounters a tremendous amount of stress. • Human impact (including hunting, trapping, overharvesting, introduced species, habitat destruction,
pollution, increased carbon dioxide emissions) can cause extinction. • Natural causes (periodic disturbance, climactic changes, resource limitations, disease) can cause
extinction.
~ ~ ,,, <l> g> C. ,,, £ 0 t:'. ro C. >. C ro C1) C ·;;; => ~ 5 C1) C ·;;, C.
8 ,, Q)
.~ _g "5 ro C =>

10 I BIG IDEA 1
0can you ... D explain the difference between allopatric and sympatric speciation?
D discuss how polyploidy can lead to a new species in plants?
D explain how a patiicular type of stress can cause extinction of a species?
D differentiate between prezygotic and postzygotic mechanisms of reproductive isolation?
BIG IDEA 1 111
1.D The origin of living systems is explained by natural processes.
• There are several hypotheses about the natural origin of life on Earth, each with supporting scientific evidence.
• Scientific evidence from many different disciplines supports models of the origin of life.
Biological Classification provides a means of grouping organisms that share physiological, structural and molecular similarities. Analysis of these similarities or differences helps to develop hypotheses about evolutionary relationships.
• Prokaryotic organisms had previously been placed into one bacterial kingdom. Recent analysis of molecular genetics has shown that there is much divergence in this group. These differences were so great that it wan-anted the separation of that one kingdom into two different domains: Bacteria and Archae. Members of all other kingdoms have more molecular similarities than members of these two domains, so, all other kingdoms were placed into a common domain: Eukarya.
• Modern Classification System from most inclusive to most exclusive: ✓ Domain ✓ Kingdom ✓ Phylum ✓ Class ✓ Order ✓ Family ✓ Genus ✓ Species
• The domain was added because in previous systems, all prokaryotic organisms were placed together in one Kingdom. With advances in molecular techniques, it was found that true bacteria and Arcbaea are very diverse.
The first living cell evolved nearly four billion years ago through a process of chemical evolution or abiotic synthesis.
• The early earth had a very volatile atmosphere with many small inorganic gases like H2O, CO, CO2, CH4, N 2, NH3 and H2. There wasn' t any oxygen gas in the early earth ' s atmosphere. It was hypothesized to be a reducing or electron adding atmosphere.
• Given this reducing atmosphere and the extreme amounts of energy due to lightning, UV rays, and volcanic activity, small inorganic molecules could have formed organic monomers.
• Miller and Urey showed, under laboratory conditions, that amino acids could be formed from the small inorganic molecules in the atmosphere with the highly energetic conditions believed to be present on the early earth.
• Panspermia hypothesis says that organic monomers could have been introduced on a meteor from space.
• Small organic monomers with negative charges bound to clay and iron pyrite particles. The excess energy linked the monomers and built the first organic polymers.
• Protobionts formed when proteins became enclosed in lipid bubbles for protection. • RNA was trapped inside a protobiont to fonn the first living cell (RNA hypothesis). • The first living cell had a simple lipid membrane, proteins, RNA as the genetic material, and was
unicellular, heterotrophic and prokaryotic.
" C)
~ "' Q) C) ro a. .<!! 5 0 t: 1l. >, C ro 0, C ·.;; :,
~ 0 0, C ·s:. a. 8 j _g :, ro C :::,
12 I BIG IDEA 1
• Autotrophs caused for the production of oxygen gas and the introduction of oxygen gas in the atmosphere 2 billion years ago
The theory of serial endosymbiosis explains the evolution of euka,yotic cells from the prokaryotic ancestors. • Two prokaryotic cells began as symbionts. • A smaller prokaryotic cell was engulfed by a larger prokaiyotic cell. • Each cell gained a benefit from the association; perhaps the smaller one was protected from the
environment and perhaps the larger one gained some nutrient support. • Over time, the two became one cel l; the smaller one becoming a mitochondrion if it was
heterotrophic and a chloroplast if it was autotrophic. • Evidence to support this theo1y is that both mitochondria and chloroplasts have their own DNA
and ribosomes. In addition, the membranes of mitochondria and chloroplasts are more like the membrane of a prokatyote.
0can you ... D explain the the01y of serial endosymbiosis?
D correctly identify potential heterotrophic and autotrophic eukaryotic ancestors?
D identify and describe characteristics of the first living cell?
D use proper taxonomy when describing relatedness of organisms within phylogenetic trees and cladograms?
D discuss similarities and differences between the three domains in order to justify relatedness between organisms?
MULTIPLE-CHOICE QUESTIONS
Directions: Each of the following questions is followed by.four possible answers. Select the best answer for each question.
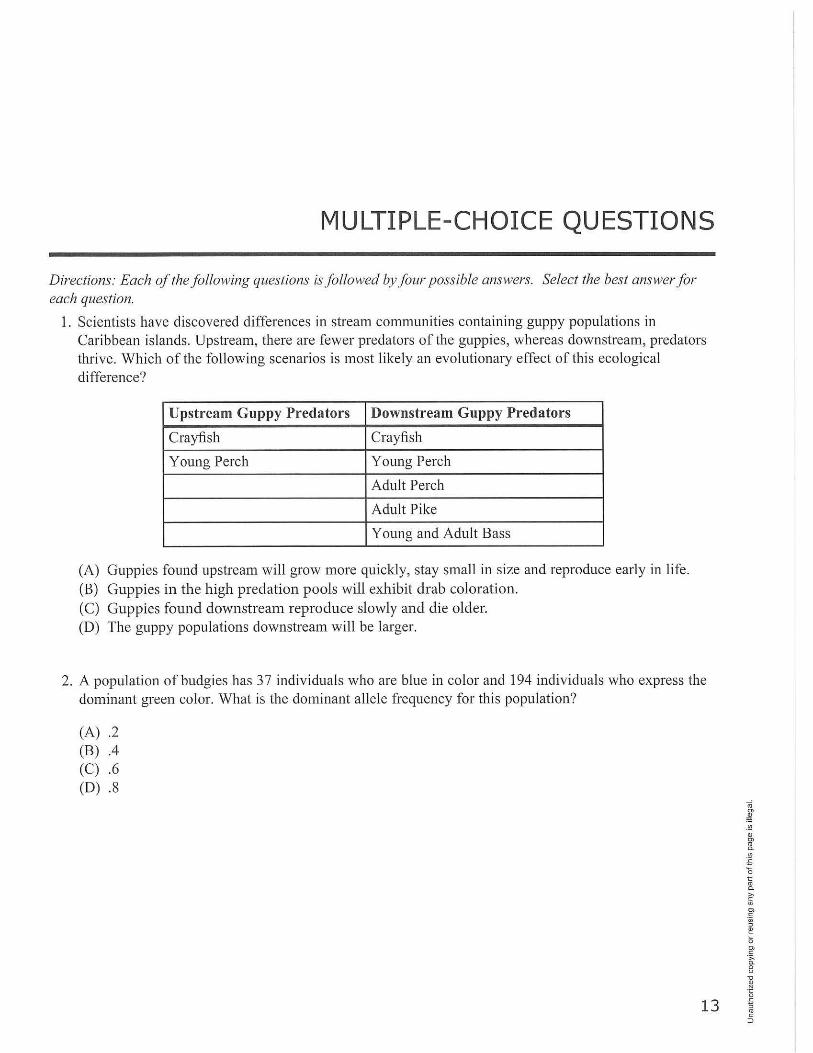
1. Scientists have discovered differences in stream communities containing guppy populations in Caribbean islands. Upstream, there are fewer predators of the guppies, whereas downstream, predators thrive. Which of the following scenarios is most likely an evolutionary effect of this ecological difference?
Upstream Guppy Predators Downstream Guppy Predators
Crayfish Crayfish
Young Perch Young Perch
Adult Perch
Adult Pike
Young and Adult Bass
(A) Guppies found upstream will grow more quickly, stay small in size and reproduce early in life. (B) Guppies in the high predation pools will exhibit drab coloration. (C) Guppies found downstream reproduce slowly and die older. (D) The guppy populations downstream will be larger.
2. A population of budgies has 3 7 individuals who are blue in color and 194 individuals who express the dominant green color. What is the dominant allele frequency for this population?
(A) .2 (B) .4 (C) .6 (D) .8
13
C ::,
~ S' 0 ~· Cl> 0.
" 0 :;1 5 · (Q
Q ., ~ 5· (Q
~ '"' " Q) ;i
Q.
=r .;;·
" Q) (Q Cl> .;;·
'" (Q
~
14 I BIG IDEA 1
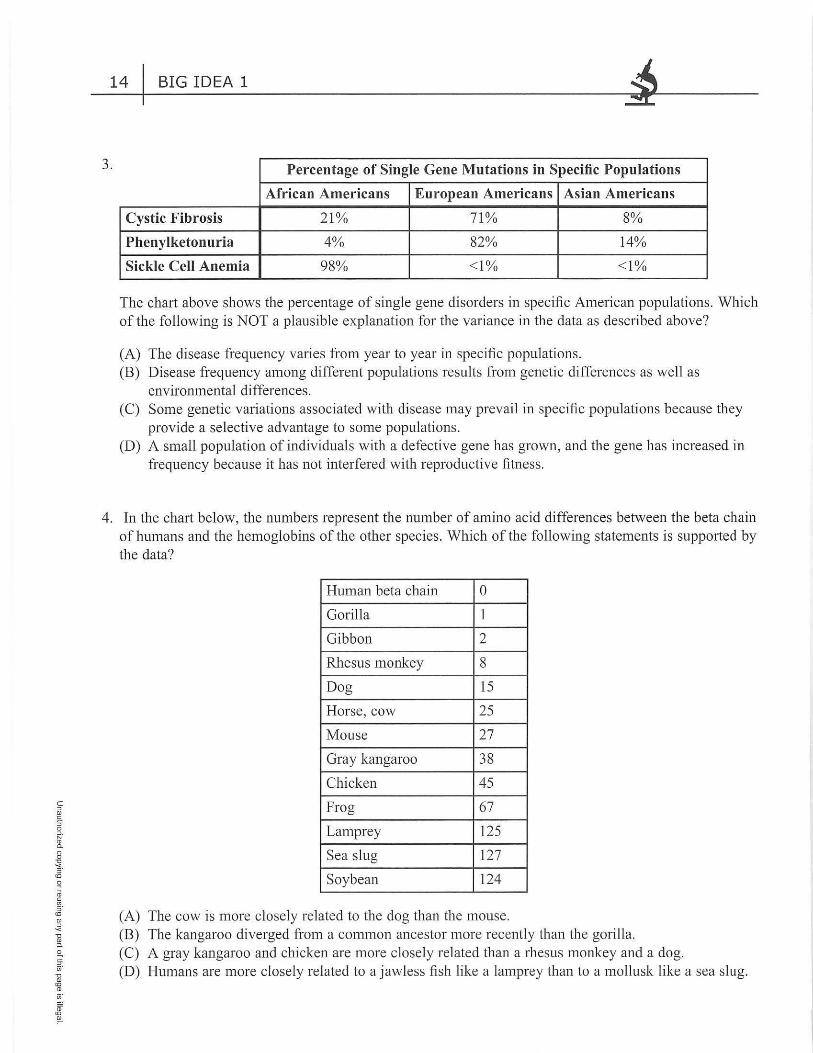
3. Percentage of Single Gene Mutations in Specific Populations
African Americans European Americans Asian Americans
Cystic Fibrosis 21% 71% 8%
Phenylketonuria 4% 82% 14%
Sickle Cell Anemia 98% <1% <1%
The chart above shows the percentage of single gene disorders in specific American populations. Which of the following is NOT a plausible explanation for the variance in the data as described above?
(A) The disease frequency varies from year to year in specific populations. (B) Disease frequency among different populations results from genetic differences as well as
environmental differences. (C) Some genetic variations associated with disease may prevail in specific populations because they
provide a selective advantage to some populations. (D) A small population of individuals with a defective gene has grown, and the gene has increased in
frequency because it bas not interfered with reproductive fitness.
4. In the chart below, the numbers represent the number of amino acid differences between the beta chain of humans and the hemoglobins of the other species. Which of the following statements is supported by the data?
Human beta chain 0
Gorilla 1
Gibbon 2
Rhesus monkey 8
Dog 15
Horse, cow 25
Mouse 27
Gray kangaroo 38
Chicken 45
Frog 67
Lamprey 125
Sea slug 127
Soybean 124
(A) The cow is more closely related to the dog than the mouse. (B) The kangaroo diverged from a common ancestor more recently than the gorilla. (C) A gray kangaroo and chicken are more closely related than a rhesus monkey and a dog. (D) Humans are more closely related to a jawless fish like a lamprey than to a mollusk like a sea slug.
BIG IDEA 1 115
Question 5 refers to the graph below:
(/"J
~ ..... Q)
80 Q)
P'.:l "c; ..... ~ '-+-<
60 0 Q) 01) Clj ..... ~ Q) (J ....
40 Q)
0...
0 --
1700
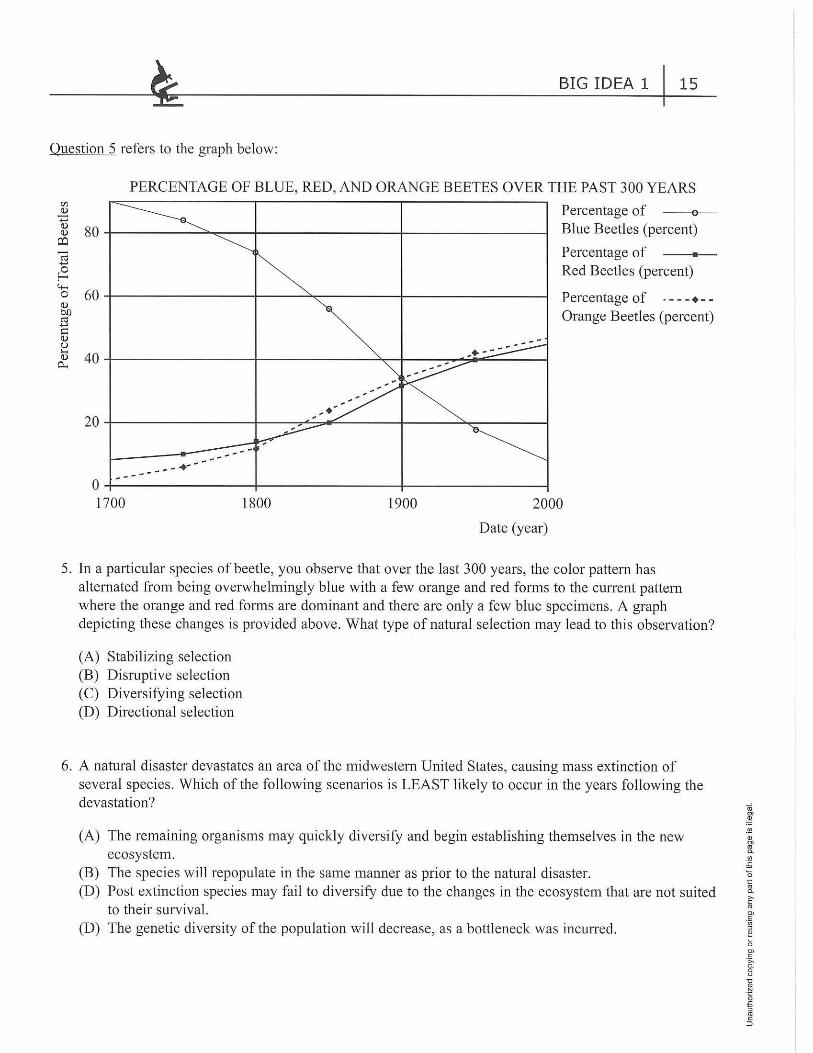
PERCENTAGE OF BLUE, RED, AND ORANGE BEETES OVER THE PAST 300 YEARS
------♦----
1800 1900
Percentage of Blue Beetles (percent)
Percentage of Red Beetles (percent)
Percentage of . - - -•- -Orange Beetles (percent)
2000
Date (year)
5. In a particular species of beetle, you observe that over the last 300 years, the color pattern has alternated from being overwhelmingly blue with a few orange and red fo1111S to the current pattern where the orange and red forms are dominant and there are only a few blue specimens. A graph depicting these changes is provided above. What type of natural selection may lead to this observation?
(A) Stabilizing selection (B) Disruptive selection (C) Diversifying selection (D) Directional selection
6. A natural disaster devastates an area of the midwestern United States, causing mass extinction of several species. Which of the fo llowing scenarios is LEAST likely to occur in the years following the devastation?
(A) The remaining organisms may quickly diversify and begin establishing themselves in the new ecosystem.
(B) The species will repopulate in the same manner as prior to the natural disaster. (D) Post extinction species may fail to diversify due to the changes in the ecosystem that are not suited
to their survival. (D) The genetic diversity of the population will decrease, as a bottleneck was incurred.
16 I BIG IDEA 1
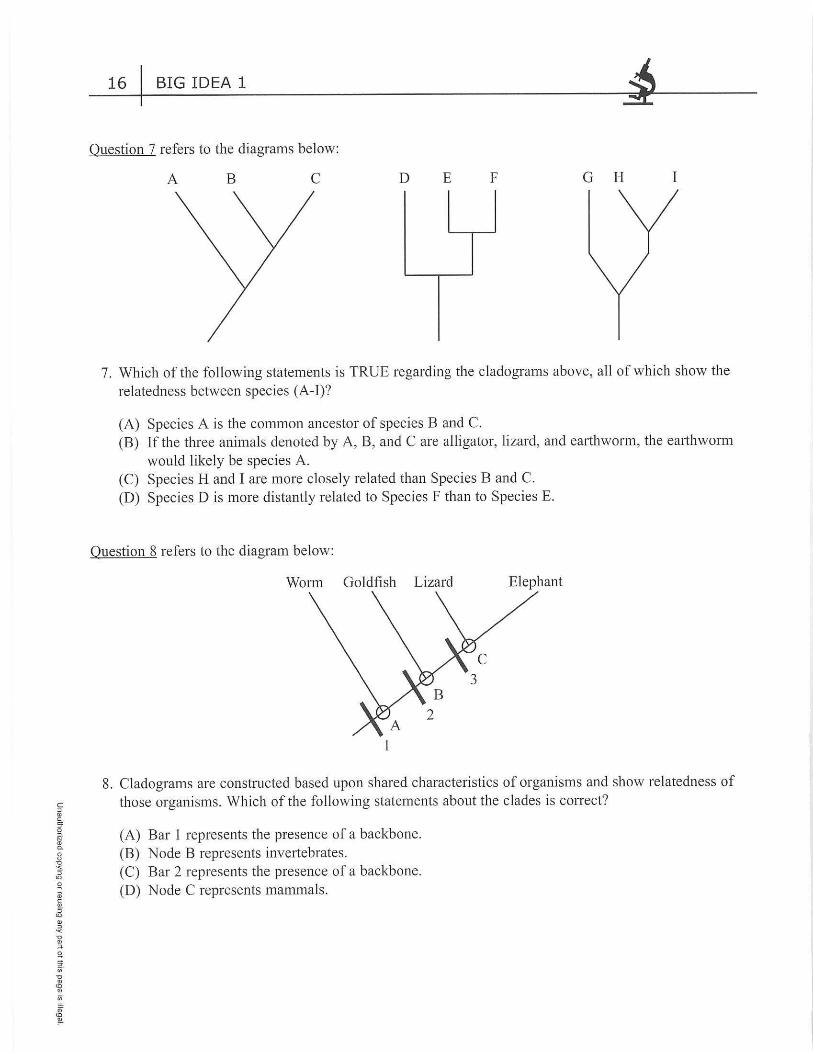
Question 7 refers to the diagrams below:
A B C D E F G H I
7. Which of the following statements is TRUE regarding the cladograms above, all of which show the relatedness between spec ies (A-I)?
(A) Species A is the common ancestor of species B and C. (B) If the three animals denoted by A, B, and C are alligator, lizard, and earthworn1, the earthworm
would likely be species A. (C) Species H and I are more closely related than Species B and C. (D) Species D is more distantly related to Species F than to Species E .
Question 8 refers to the diagram below:
Worm Goldfish Lizard Elephant
8. Cladograms are constructed based upon shared characteristics of organisms and show relatedness of those organisms. Which of the following statements about the clades is correct?
(A) Bar I represents the presence of a backbone. (B) Node B represents invertebrates. (C) Bar 2 represents the presence of a backbone. (D) Node C represents mammals.
~ BIG IDEA 1 117
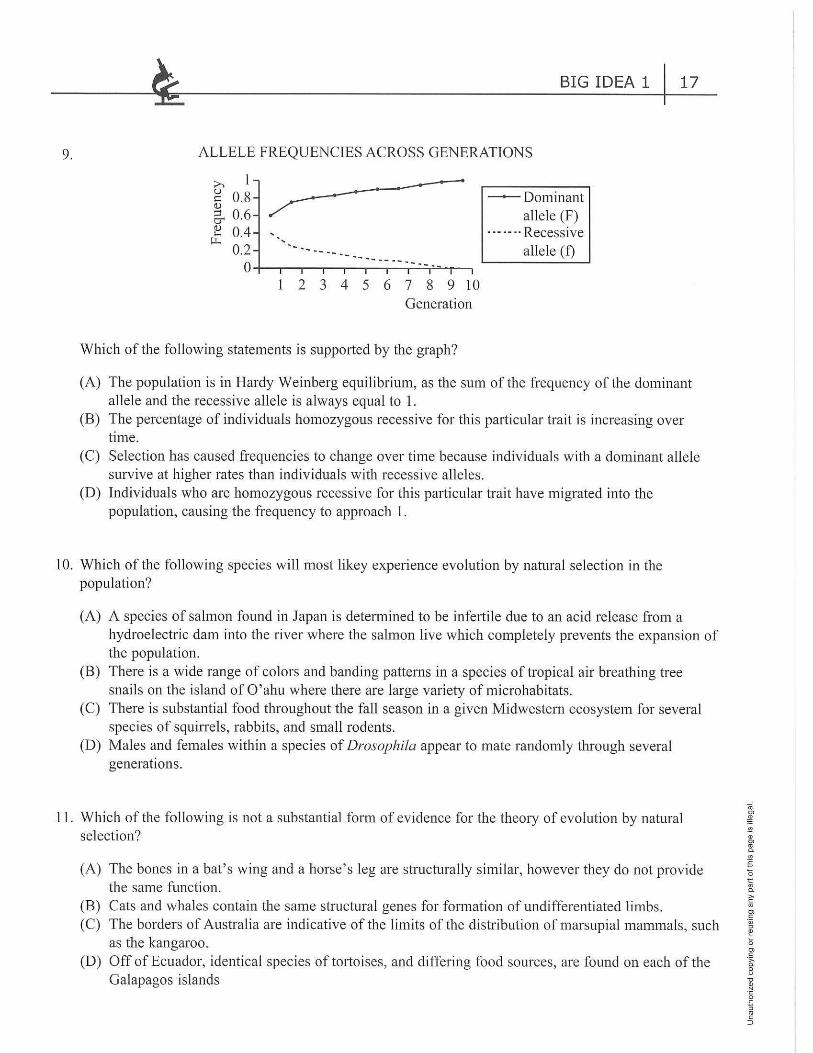
9. ALLELE FREQUENCIES ACROSS GENERATIONS
>--. I ~ 0.8 Q)
g. 0.6 ~ 0.4 ~ ·, ·- .
0.2 ------- .. -------0-+----.--.--.....-~----.-~~-~-_ . .,.:.,,.-.....--,
1 2 3 4 5 6 7 8 9 10 Generation
Which of the following statements is supported by the graph?
-Dominant allele (F)
· -- -- ·· Recessive allele (f)
(A) The population is in Hardy Weinberg equilibrium, as the sum of the frequency of the dominant allele and the recessive allele is always equal to I.
(B) The percentage of individuals homozygous recessive for this pa1iicular trait is increasing over time.
(C) Selection has caused frequencies to change over time because individuals with a dominant allele survive at higher rates than individuals with recessive alle les.
(D) Individuals who are homozygous recessive for this particular trait have migrated into the population, causing the frequency to approach I.
10. Which of the following species w ill most likey experience evolution by natural selection in the population?
(A) A species of salmon found in Japan is determined to be infertile due to an acid release from a hydroelectric dam into the river where the salmon live which completely prevents the expansion of the population.
(B) There is a wide range of colors and banding patterns in a species of tropical air breathing tree snails on the island of O ' ahu where there are large variety of rnicrohabitats.
(C) There is substantial food throughout the fall season in a given Midwestern ecosystem for several species of squiJTels, rabbits, and small rodents.
(D) Males and females within a species of Drosophila appear to mate randomly through several generations.
11. Which of the following is not a substantial form of evidence for the theory of evolution by natural selection?
(A) The bones in a bat's w ing and a horse's leg are structurally similar, however they do not provide the same function.
(B) Cats and whales contain the same structural genes for formation of undifferentiated limbs. (C) The borders of Australia are indicative of the limits of the distribution of marsupial mammals, such
as the kangaroo. (D) Off of Ecuador, identical species of to1ioises, and differing food sources, are found on each of the
Galapagos islands
18 I BIG IDEA 1
12. 100
90
80
~ 70
<I)
60 ..c: (/J
~ 50 2
~ 40
~ 30
20
10
0 0
0
0
0 0
0
0 e 0 0
0o 0 0
0 00 0
• 0 0
0
• 0 0o
0
0 0 0 oOo
0 o)0o0 0
0
0
0 0 o oo o&•
0
000 • . ,
0 •• • • • •
• • • •
• • •
0 0
0
• , • I
10 20 30 40 50 60 70 80 90 100 % with One or No Band
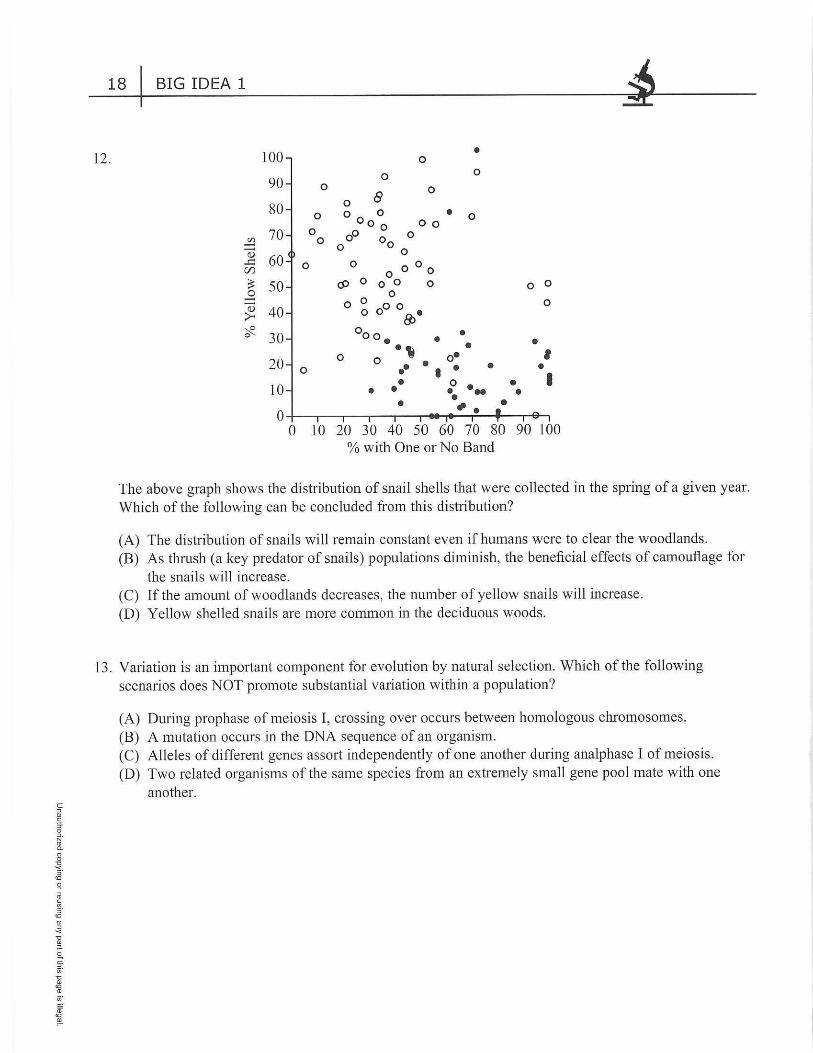
The above graph shows the distribution of snail shells that were collected in the spring of a given year. Which of the following can be concluded from this distribution?
(A) The distribution of snails wi IL remain constant even if humans were to clear the woodlands. (B) As thrush (a key predator of snails) populations diminish, the beneficial effects of camouflage for
the snails will increase. (C) If the amount of woodlands decreases, the number of yellow snails will increase. (D) Yellow shelled snails are more common in the deciduous woods.
13. Variation is an imp011ant component for evolution by natural selection. Which of the following scenarios does NOT promote substantial variation within a population?
(A) During prophase of meiosis I, crossing over occurs between homologous chromosomes. (B) A mutation occurs in the DNA sequence of an organism. (C) Alleles of different genes asso11 independently of one another during analphase I of meiosis. (D) Two related organisms of the same species from an extremely small gene pool mate with one
another.

BIG IDEA 1 119
14. A particular vim s that affects the white blood cells of cats occurs in the larger domesticated cat population at a rate of approximately 1- 5%, whereas the disease rate in the significantly smaller cheetah population is nearly 60%. Which of the fo llowing explains the difference in disease rate in these two populations?
(A) The gene pool of the cheetah is extremely small, therefore the DNA is very similar throughout the population, limiting the ability to survive new pathogens.
(B) The increased genetic diversity of the cheetah population makes it more susceptible to the virus. (C) Cheetahs drive off their young after birth to avoid interbreeding. (D) Domesticated cats are administered a highly ineffective vaccine against the virus.
15. Natural selection works in many ways in various populations. There are three primary patterns to natural selection. All of the fo llowing scenarios cause selection to work in a directional sense EXCEPT
(A) bees visit plants with larger petals more frequently. (B) peahens preferentially mate with peacocks who have large, symmetrical fans. (C) female birds select their mate based upon the complexity and beauty of a male designed nest. (D) humans select mates without knowledge of their blood types.
16. Serial endosymbiosis is a theory that describes how eukaryotic cells evolved from prokaryotic ancestors. Which of the following does not suppo1t the theory of serial endosymbiosis?
(A) Both mitochondria and chloroplasts contain a single loop of DNA that does not have histones. (B) M itochondria and chloroplasts are synthesized through a process quite similar to binary fission. (C) Mitochondria and chloroplasts contain double cell membranes with phospholipid bilayers that
resembLe those bilayers found in bacteria. (D) Mitochondria and chloroplasts do not contain ribosomes, which is similar to bacterial structure.
17. Which of the following is an example of convergent evolution?
(A) The kit fox lives in the dese1i and its tan coat helps it to disguise it from its predators and the red fox lives in the forest, where the red coat helps to camouflage the fox.
(B) A group of birds migrating end up in a new environment due to abnormal winds. If the food source is such that a particular beak is an advantage to survival, then this trait will increase in the population. In the birds' former location, perhaps this beak is not advantageous, and the beak traits will have a different frequency in that population.
(C) The eyes of squid and octopus are strikingly similar to those of mammals, although both groups evolved entirely separately from one another.
(D) Apple maggot flies once infested hawthorns. However, some flies began to infest apples and reproduced very quickly due to the abundant food source. Two species evolved, one that infests the native hawthorn and one that reproduces when apples are ripe.
<ii C>
~ "" ., C> Ill a.
."1 £ 0 t: Ill a. >,
" Ill C>
" ·;;; ::, !: 0 C>
" ·;;, a. 8 'O
~
2 5 Ill
" :::,
C :,
1! 3' Q ;;·
" Cl. n 0
" '< 5 · "' Q
" C:
"' 5· "' ] " ., :,
2. 3' .;·
" ., "' " .;·
io "' !11-
20 I BIG IDEA 1
18. Northern elephant seals were hunted by humans in the 1890s and their population was reduced to approximately 20 individuals. Which of the following is true about this population?
(A) The population of seals will be more able to adapt to new pressures, such as a change in climate. (B) They have greater genetic variation than a population of southern elephant seals who were not
hunted. (C) The no,thern seals will be less susceptible to disease and pollution than the southern elephant
seals. (D) As the gene pool decreases, the chance of inbreeding will increase within the population of seals.
Question I 9 refers to the table below:
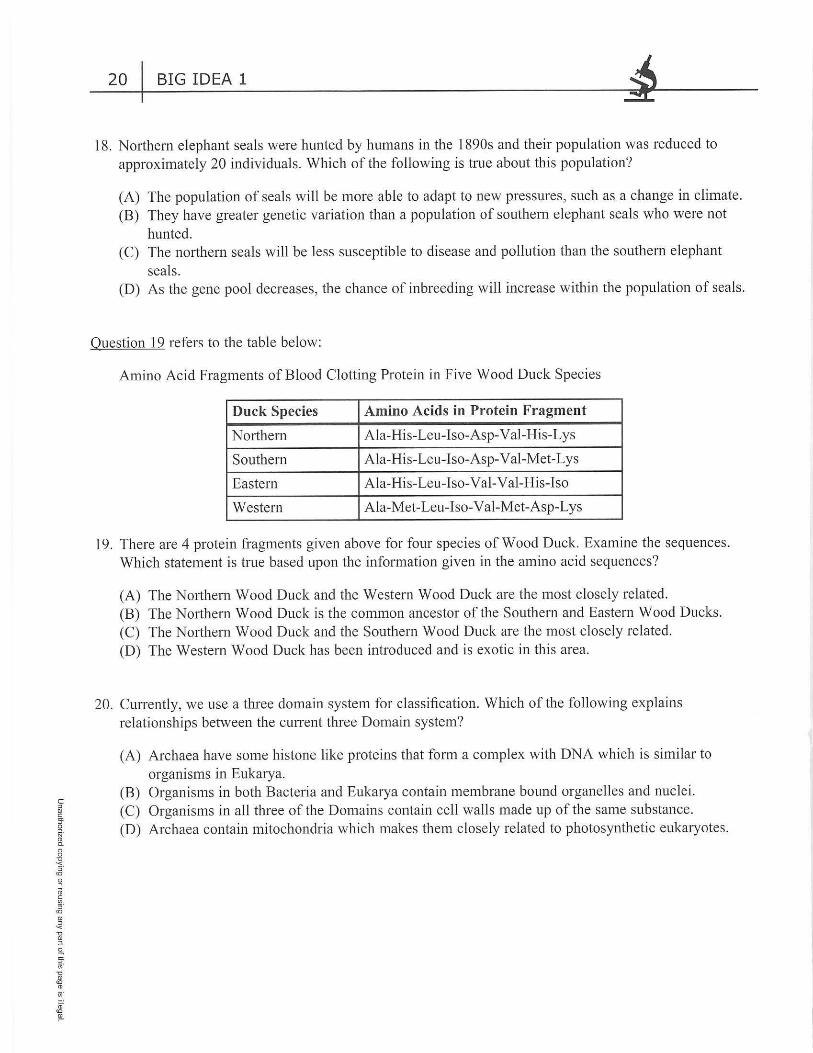
Amino Acid Fragments of Blood Clotting Protein in Five Wood Duck Species
Duck Species Amino Acids in Protein Fragment
Northern A la-His-Leu-lso-Asp-Val-His-Lys
Southern Ala-His-Leu-lso-Asp-Val-Met-Lys
Eastern Ala-His-Leu-Iso-Val-Val-His-Iso
Western Ala-Met-Leu-Iso-Val-Met-Asp-Lys
19. There are 4 protein fragments given above for four species of Wood Duck. Examine the sequences. Which statement is true based upon the information given in the amino acid sequences?
(A) The Northern Wood Duck and the Western Wood Duck are the most closely related. (B) The No1them Wood Duck is the common ancestor of the Southern and Eastern Wood Ducks. (C) The Northern Wood Duck and the Southern Wood Duck are the most closely related. (D) The Western Wood Duck has been introduced and is exotic in this area.
20. Currently, we use a three domain system for classification. Which of the following explains relationships between the current three Domain system?
(A)
(B) (C) (D)
Archaea have some histone like proteins that form a complex with DNA which is similar to organisms in Eukarya. Organisms in both Bacteria and Eukarya contain membrane bound organelles and nuclei. Organisms in al l three of the Domains contain cell walls made up of the same substance. Archaea contain mitochondria which makes them closely related to photosynthetic eukaryotes.
BIG IDEA 1 I 21
2 1. When a population is at Hardy-Weinberg Equilibrium, the allele frequencies should remain constant. Which of the following populations is most likely experiencing Hardy-Weinberg Equilibrium?
(A) In a bluebird species, the males with the longest mating song mate much more frequently than the males with short mating songs.
(B) In a spider population, the males with the most intricate courtship dance get selected as mates more quickly than other male spiders .
(C) In a mosquito population, being heterozygous for a given trait makes the individuals resistant to four viral infections.
(D) In a large moth population, both red and orange moths are consistently abundant.
22. Often, new plant and animal species begin to inhabit new, remote islands located off of the mainland. This is an extremely random process. Which of the following species is least likely to colon ize remote islands?
(A) Egg laying terrestrial mammals (B) Birds, bats, flying insects, and seeds that use wind dispersal (C) Small lizards and insects that can survive without water (D) Rats, fruits and vegetables that travel with humans
23. As new islands are colonized, which of the fo llowing is LEAST likely to happen?
(A) If the island is completely isolated, the new island population will diverge quickly resulting in endemic species.
(B) Disease will be less likely to impact the endemic species due to the small size of the population. (C) Endemic species will become less likely to survive if other species colonize the island. (D) If the island is close, more species will migrate to the island, reducing the effects of genetic drift.
C :,
I!! 5' 0 ~· C1) ci 0 0 "O "< 5 ·
<O
g iii ~ 5 ·
<O
~ "O
" " 2. :,-.;· "O
" <O C1)
.;·
ro <O
!!!-
22 I BIG IDEA 1
Question 24 refers to the table below:
Year
2002 2003 2004
Ciprofloxacin Penicillin Ciprofloxacin Penicillin Ciprofloxacin Penicillin
% of population
1.6 0.9 1.9 1.0 4.6 1.1 displaying resistance
2005 2006
Ciprofloxacin Penicillin Ciprofloxacin Penicillin
% of population
6.5 4.7 9.4 8.6 displaying resistance
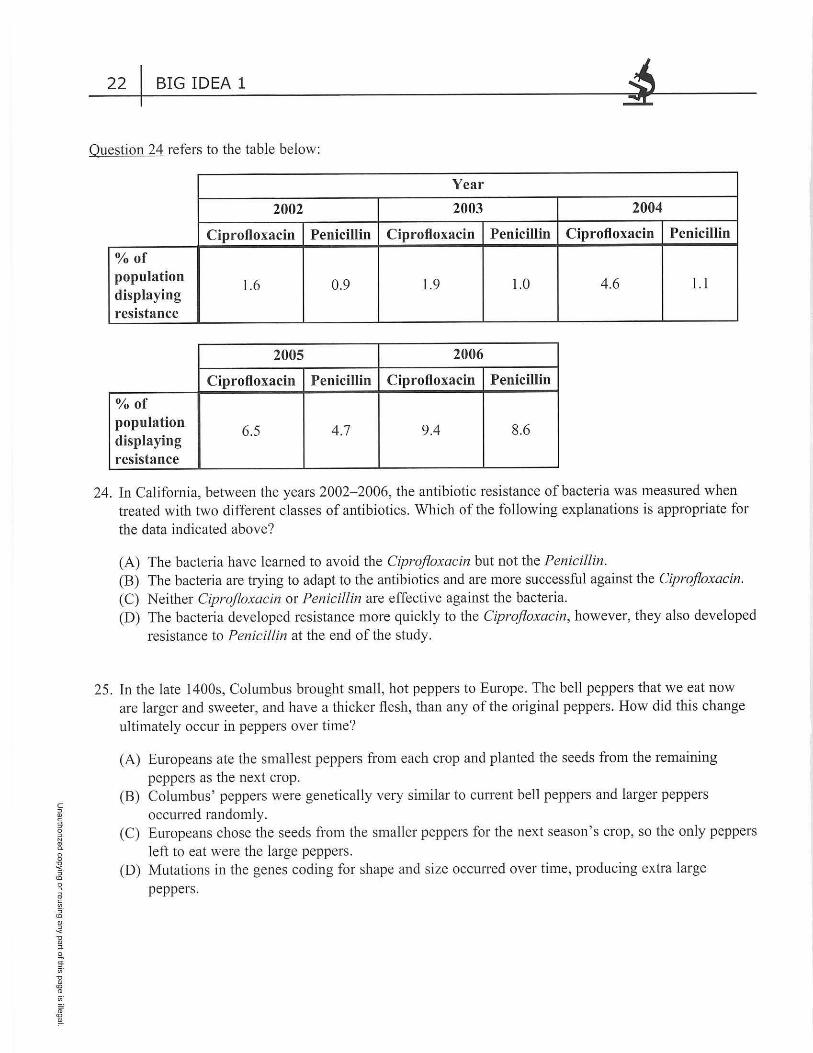
24. In California, between the years 2002- 2006, the antibiotic resistance of bacteria was measured when treated with two different classes of antibiotics. Which of the following explanations is appropriate for the data indicated above?
(A) The bacteria have learned to avoid the Ciprofioxacin but not the Penicillin. (B) The bacteria are trying to adapt to the antibiotics and are more successful against the Ciprofioxacin. (C) Neither Ciprofioxacin or Penicillin are effective against the bacteria. (D) The bacteria developed resistance more quickly to the Ciprofioxacin, however, they also developed
resistance to Penicillin at the end of the study.
25. In the late 1400s, Columbus brought small, hot peppers to Europe. The bell peppers that we eat now are larger and sweeter, and have a thicker flesh, than any of the original peppers. How did this change ultimately occur in peppers over time?
(A)
(B)
(C)
(D)
Europeans ate the smallest peppers from each crop and planted the seeds from the remaining
peppers as the next crop. Columbus' peppers were genetically very similar to current bell peppers and larger peppers occurred randomly. Europeans chose the seeds from the smaller peppers for the next season's crop, so the only peppers
left to eat were the large peppers. Mutations in the genes coding for shape and size occmTed over time, producing extra large
peppers.
BIG IDEA 1 I 23
26. A tigon forms from a mating between a male tiger and a lioness. A tigon has a standard body size and life expectancy. Although it is possible for tigons to be ferti le, they are generally sterile. The type of isolating mechanism present between the tigers and the lions is
(A) gametic mortality. (B) temporal isolation. (C) habitat isolation. (D) hybrid sterility.
Question 27 refers to the table below:
Percentage of White and Gray Rats in London at Different Times
Date Percentage of White Rats in London Percentage of Gray Rats in London
1850 48 52
2000 0 100
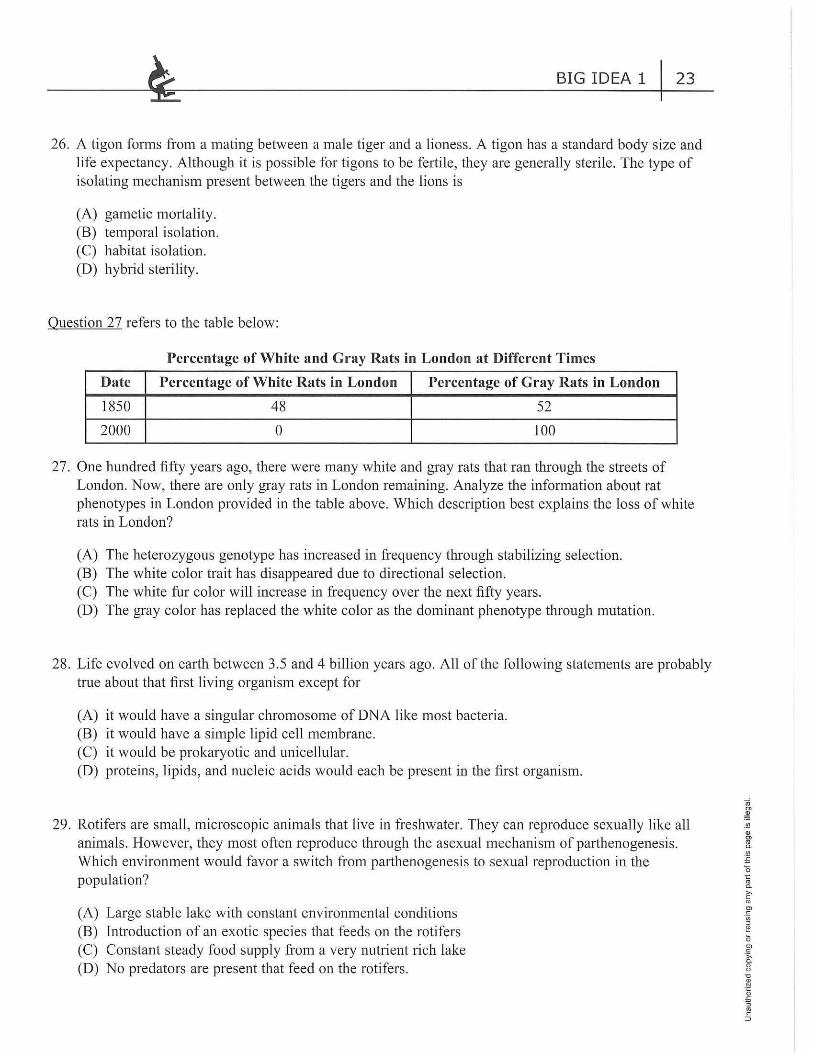
27. One hundred fifty years ago, there were many white and gray rats that ran through the streets of London. Now, there are only gray rats in London remaining. Analyze the information about rat phenotypes in London provided in the table above. Which description best explains the loss of white rats in London?
(A) The heterozygous genotype has increased in frequency through stabilizing selection. (B) The white color trait has disappeared due to directional selection. (C) The white fur color will increase in frequency over the next fifty years. (D) The gray color has replaced the white color as the dominant phenotype through mutation.
28. Life evolved on earth between 3.5 and 4 billion years ago. All of the following statements are probably true about that first living organism except for
(A) it would have a singular chromosome of DNA like most bacteria. (B) it would have a simple lipid cell membrane. (C) it would be prokaryotic and unicellular. (D) proteins, lipids, and nucleic acids would each be present in the first organism.
29. Rotifers are small, microscopic animals that live in freshwater. They can reproduce sexually like all animals. However, they most often reproduce through the asexual mechanism of parthenogenesis. Which environment would favor a switch from parthenogenesis to sexual reproduction in the population?
(A) Large stable lake with constant environmental conditions (B) Introduction of an exotic species that feeds on the rotifers (C) Constant steady food supply from a very nutrient rich lake (D) No predators are present that feed on the rotifers.
C :, Q) C:
5' 0
~-a.
8 ~ 5·
co Q
iii C:
"' 5· co
] " Q) ::,.
'2. 5' ;;;
il co (1)
;;;·
I
24 I BIG IDEA 1
Question 30 refers to the table below:
Year Frequency of Tongue Rolling Frequency of Inability to roll tongue
1925 65% 35%
1950 68% 32%
1975 66% 34%
2000 67% 33%
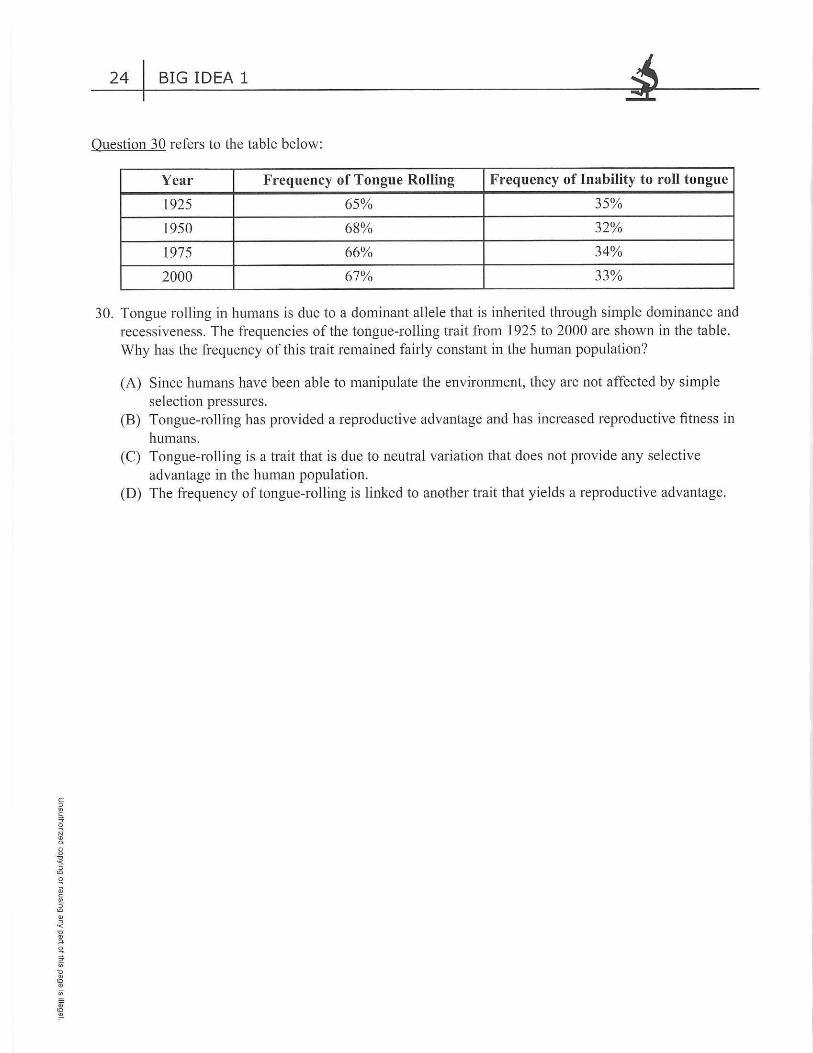
30. Tongue rolling in humans is due to a dominant allele that is inherited through simple dominance and recessiveness. The frequencies of the tongue-rolling trait from 1925 to 2000 are shown in the table. Why has the frequency of this trait remained fairly constant in the human population?
(A) Since humans have been able to manipulate the environment, they are not affected by simple selection pressures.
(B) Tongue-rolling has provided a reproductive advantage and has increased reproductive fitness in humans.
(C) Tongue-rolling is a trait that is due to neutral variation that does not provide any selective advantage in the human population.
(D) The frequency of tongue-roll ing is linked to another trait that yields a reproductive advantage.
GRID-IN QUESTIONS
Directions: In this section, you will be presented with questions that require calculation. Use calculators to compute the value and write the answer for each one.
1.
2.
3.
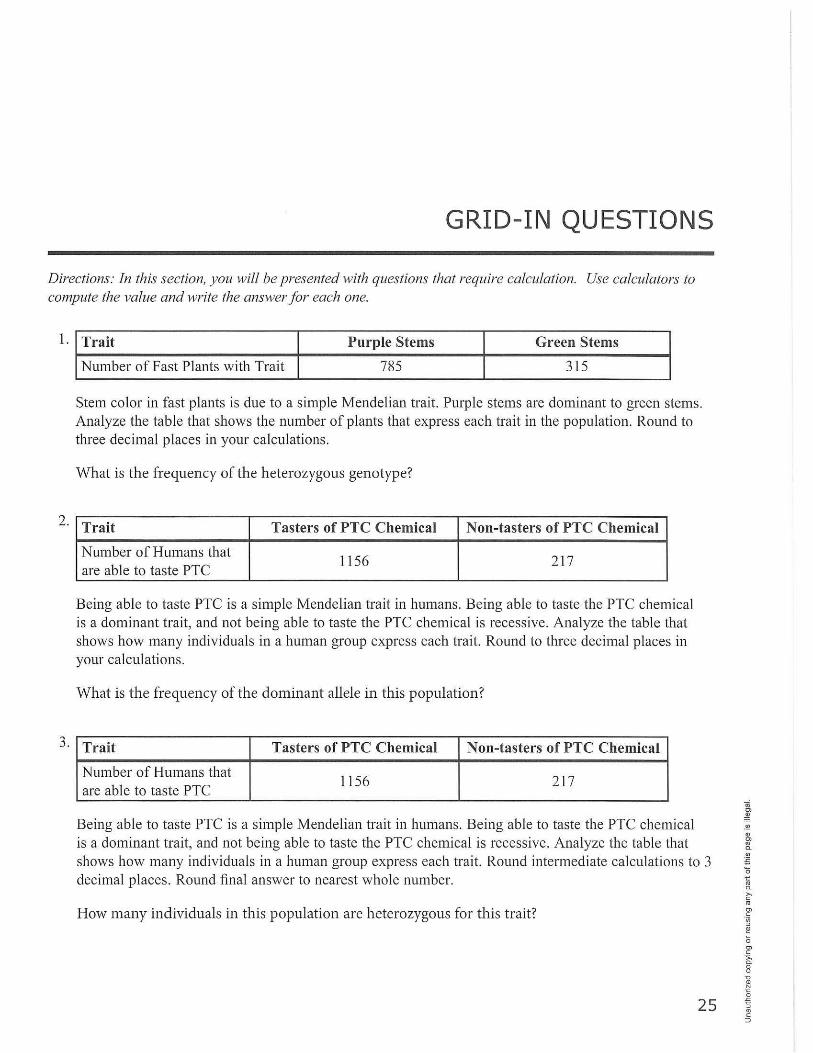
Trait Purple Stems Green Stems
Number of Fast Plants with Trait 785 315
Stem color in fast plants is due to a simple Mendelian trait. Purple stems are dominant to green stems. Analyze the table that shows the number of plants that express each trait in the population. Round to thJee decimal places in your calculations.
What is the frequency of the heterozygous genotype?
Trait Tasters of PTC Chemical Non-tasters of PTC Chemical
Number of Humans that 1156 2 17
are able to taste PTC
Being able to taste PTC is a s imple Mendelian trait in humans. Being able to taste the PTC chemical is a dominant trait, and not being able to taste the PTC chemical is recessive. Analyze the table that shows how many individuals in a human group express each trait. Round to three decimal places in your calculations.
What is the frequency of th e dominant allele in this population ?
Trait Tasters of PTC Chemical Non-tasters of PTC Chemical
Number of Humans that 11 56 2 17
are able to taste PTC
Being able to taste PTC is a simple Mendelian trait in humans. Being able to taste the PTC chemical is a dominant trait, and not being able to taste the PTC chemical is recessive. A nalyze the table that shows how many individuals in a human group express each trait. Round intermediate calculations to 3 decimal p laces. Round final answer to nearest whole number.
How many individuals in this population are heterozygous for this trait?
25

26 I BIG IDEA 1
4. There are RNA fragments for 3 species of Hissing Cockroaches provided. Analyze these three RNA fragments. Answer the question with a numerical answer.
Madagascar Hissing Cockroach 5' AACCGUUCCGAAUUCCAG 3'
South African Hissing Cockroach 5'AACCUUUCCGAACCGCAG 3'
Brazilian Hissing Cockroach 5'AACGGUUCCGAAUCACAG 3'
How many nucleotide differences are present in this RNA fragment between the Madagascar Hissing Cockroach and the Brazilian Hissing Cockroach? Give answer as a whole number.
5. In a particular species of beetle, you observe that over the last 300 years, the color pattern has alternated from being overwhelmingly blue with a few orange and red forms to the current pattern where the orange and red forms are dominant and there are only a few blue specimens. A graph depicting these changes is provided.
C/l
~ ...., <I) <I)
O'.:l ~ ...., ~ 4-, 0 <I) 01)
~ c:: <I) (.) .... <I)
p..
PERCENTAGE OF BLUE, RED, AND ORANGE BEETES OVER THE PAST 300 YEARS
80
60
40
L------------♦-----
Percentage of Blue Beetles (percent)
Percentage of Red Beetles (percent)
Percentage of -- - -•- - -Orange Beetles (percent)
0+----------4---------+-----------l 1700 1800 1900 2000
Date (year)
Predict the percent frequency of the blue trait in the year 2050.
CONSTRUCTED-RESPONSE QUESTIONS
Directions: On the AP biology exam, there will be eight free-response questions. There will be two ten-point free-response questions, three four-point free-response questions, and three three-point freeresponse questions. Write clear complete responses in complete sentences for each question. Grading rubrics for these practice free-response questions are provided in the teacher's manual that accompanies this review book.
(10 points are possible on this question.) 1. The frequency of the sickle cell disease in paiis of Central Africa is as high as 10% compared to a
frequency of .5% in the United States. The sickle cell allele is inherited as a recessive allele. However, the heterozygotes do have some sickle-shaped red blood cells.
(a) Why are the frequencies of these traits different in these two areas? Explain why these differences are possible.
(b) Use the percentage for the Central African population and the US population to calculate the frequency of the heterozygous and homozygous dominant genotypes in each of these areas.
( c) Is there evidence of heterozygote advantage in either one of these populations? Explain the evidence or lack of evidence.
(10 points are possible on this question.) 2. The most widely accepted theory about how the first eukaryotic cells evolved from prokaryotic
ancestors is through a process called serial endosymbiosis.
(a) Explain the process of serial endosymbiosis. (b) Describe the evidence for serial endosymbiosis. ( c) There are three domains of life. Draw a phylogeny that shows the evolutionary relationships of
these three domains. ( d) Describe the common ancestor of these three domains.
27
C :,
" ~ Q ,.-C1) a.
" 0
~ 5 · co Q iii [; 5· co
] "O
" ::i
8-:T .;; "O
" co C1) .. -.. co !'l-
28 I BIG IDEA 1
(4 points are possible on this question.) 3. A population of crickets feeds on two species of weedy plant (A and B). Both plants are spread across
the habitat range of this population. There are no physical barriers to prevent crickets from moving between the plants. After many generations, the crickets that were born on plant A have begun to only eat plant A and mate with other plant A crickets. The crickets born on plant B have begun to eat only plant B and mate with only plant B crickets.
(a). Is there evidence for speciation in this population? Explain the evidence. (b) Is this an example of sympatric or allopatric speciation? Explain your response. What kinds of
isolating mechanisms are present in this population?
(4 points are possible on this question.) 4. Natural selection is the major mechanism for evolution as described in the Ori gin of Species by Charles
Darwin.
(a). Explain evolution by natural selection. (b) Use one of the following examples to explain the process of natural selection.
1. Many species of finches being present on the Galapagos Islands 11. Annadillos and extinct giant armadillo-like mammals that have many similar traits 111. Standard sloths and extinct giant sloths that have many similar traits 1v. Horses and zebras
(3 points are possible on this question.)
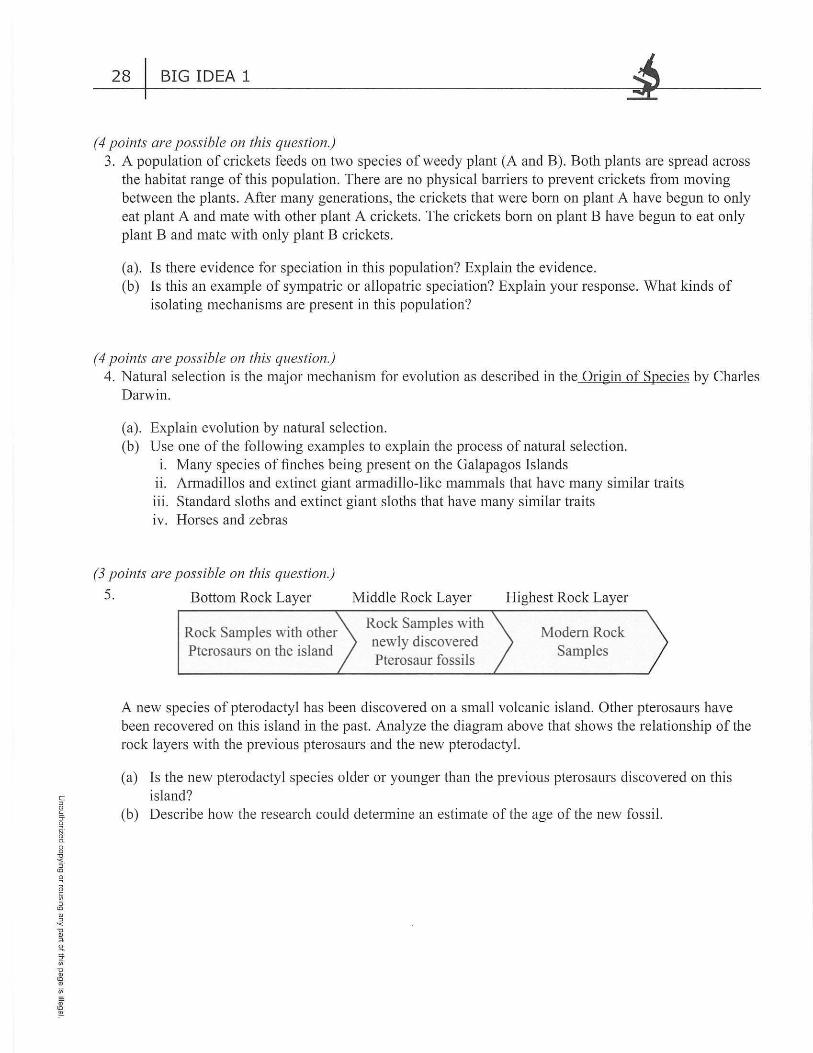
5. Bottom Rock Layer Middle Rock Layer Highest Rock Layer
Rock Samples with other Pterosaurs on the island
Rock Samples with newly discovered Pterosaur fossils
Modem Rock Samples
A new species of pterodactyl has been discovered on a small volcanic island. Other pterosaurs have been recovered on this island in the past. Analyze the diagram above that shows the relationship of the rock layers with the previous pterosaurs and the new pterodactyl.
(a)
(b)
ls the new pterodactyl species older or younger than the previous pterosaurs discovered on this island? Describe how the research could determine an estimate of the age of the new fossil.

BIG IDEA 1 I 29
(3 points are possible on this question.) 6.
en (1)
v (1)
r:o «i ..... ~ '-H 0 (1) oJ)
"' ..... s= (1) (J '-(1)
0...
PERCENTAGE OF BLUE, RED, AND ORANGE BEETES OVER THE PAST 300 YEARS
80
60
40
---- -♦--
Percentage of Blue Beetles (percent)
Percentage of Red Beetles (percent)
Percentage of -- - -•- - -Orange Beetles (percent)
---0----------------------------t 1700 1800 1900 2000
Date (year)
The graph shows the frequency of tlu·ee beetle phenotypes over the past several years. The three phenotypes present in the population are blue, red, and orange.
(a) There are three patterns of natural selection: stabilizing, directional and disruptive selection. Which selection type is represented by this graph?
(b) Explain what happens during directional selection.
~ ~ V>
" I? C. V>
£ 0 t "' C. >, C:
"' g> -~ I!! ls g> ·;;_ C.
8 "O Q) N ·c: 0 .c: "5 "' C:
::,

NO TESTING MATERIAL ON THIS PAGE