big data analytics · wiley & sas business series the wiley & sas business series presents...
TRANSCRIPT

ffirs 22 October 2012; 18:18:2

Big Data Analytics
ffirs 22 October 2012; 18:18:2

WILEY & SAS BUSINESS SERIES
The Wiley & SAS Business Series presents books that help senior-level managers withtheir critical management decisions.
Titles in the Wiley and SAS Business Series include:
Activity-Based Management for Financial Institutions: Driving Bottom-Line Results by Brent Bahnub
Advanced Business Analytics: Creating Business Value from Your Data by Jean Paul Isson and JesseHarriott
Branded! How Retailers Engage Consumers with Social Media and Mobility by Bernie Brennan andLori Schafer
Business Analytics for Customer Intelligence by Gert Laursen
Business Analytics for Managers: Taking Business Intelligence beyond Reporting by Gert Laursen andJesper Thorlund
The Business Forecasting Deal: Exposing Bad Practices and Providing Practical Solutions by MichaelGilliland
Business Intelligence Success Factors: Tools for Aligning Your Business in the Global Economy by OliviaParr Rud
CIO Best Practices: Enabling Strategic Value with Information Technology, Second Edition by JoeStenzel
Connecting Organizational Silos: Taking Knowledge Flow Management to the Next Level with SocialMedia by Frank Leistner
Credit Risk Assessment: The New Lending System for Borrowers, Lenders, and Investors by ClarkAbrahams and Mingyuan Zhang
Credit Risk Scorecards: Developing and Implementing Intelligent Credit Scoring by Naeem Siddiqi
The Data Asset: How Smart Companies Govern Their Data for Business Success by Tony Fisher
Demand-Driven Forecasting: A Structured Approach to Forecasting by Charles Chase
Executive’s Guide to Solvency II by David Buckham, Jason Wahl, and Stuart Rose
The Executive’s Guide to Enterprise Social Media Strategy: How Social Networks Are Radically Trans-forming Your Business by David Thomas and Mike Barlow
Fair Lending Compliance: Intelligence and Implications for Credit Risk Management by ClarkR. Abrahams and Mingyuan Zhang
Foreign Currency Financial Reporting from Euros to Yen to Yuan: A Guide to Fundamental Conceptsand Practical Applications by Robert Rowan
Human Capital Analytics: How to Harness the Potential of Your Organization’s Greatest Asset by GenePease, Boyce Byerly, and Jac Fitz-enz
Information Revolution: Using the Information Evolution Model to Grow Your Business by Jim Davis,Gloria J. Miller, and Allan Russell
Manufacturing Best Practices: Optimizing Productivity and Product Quality by Bobby Hull
Marketing Automation: Practical Steps to More Effective Direct Marketing by Jeff LeSueur
Mastering Organizational Knowledge Flow: How to Make Knowledge Sharing Work by Frank Leistner
The New Know: Innovation Powered by Analytics by Thornton May
Performance Management: Integrating Strategy Execution, Methodologies, Risk, and Analytics by GaryCokins
Retail Analytics: The Secret Weapon by Emmett Cox
Social Network Analysis in Telecommunications by Carlos Andre Reis Pinheiro
Statistical Thinking: Improving Business Performance, Second Edition by Roger W. Hoerl and RonaldD. Snee
Taming the Big Data Tidal Wave: Finding Opportunities in Huge Data Streams with Advanced Analyticsby Bill Franks
The Value of Business Analytics: Identifying the Path to Profitability by Evan Stubbs
Visual Six Sigma: Making Data Analysis Lean by Ian Cox, Marie A. Gaudard, Philip J. Ramsey,Mia L. Stephens, and Leo Wright
For more information on any of the above titles, please visit www.wiley.com.
ffirs 22 October 2012; 18:18:2

Big DataAnalytics
Turning Big Data into Big Money
Frank Ohlhorst
John Wiley & Sons, Inc.
ffirs 22 October 2012; 18:18:2

Cover image: @liangpv/iStockphotoCover design: Michael Rutkowski
Copyright © 2013 by John Wiley & Sons, Inc. All rights reserved.
Published by John Wiley & Sons, Inc., Hoboken, New Jersey.Published simultaneously in Canada.
No part of this publication may be reproduced, stored in a retrieval system, or trans-mitted in any form or by any means, electronic, mechanical, photocopying, recording,scanning, or otherwise, except as permitted under Section 107 or 108 of the 1976 UnitedStates Copyright Act, without either the prior written permission of the Publisher, orauthorization through payment of the appropriate per-copy fee to the CopyrightClearance Center, Inc., 222 Rosewood Drive, Danvers, MA 01923, (978) 750-8400, fax(978) 646-8600, or on the Web at www.copyright.com. Requests to the Publisher forpermission should be addressed to the Permissions Department, John Wiley & Sons, Inc.,111 River Street, Hoboken, NJ 07030, (201) 748-6011, fax (201) 748-6008, or online athttp://www.wiley.com/go/permissions.
Limit of Liability/Disclaimer of Warranty: While the publisher and author have usedtheir best efforts in preparing this book, they make no representations or warranties withrespect to the accuracy or completeness of the contents of this book and specificallydisclaim any implied warranties of merchantability or fitness for a particular purpose. Nowarranty may be created or extended by sales representatives or written sales materials.The advice and strategies contained herein may not be suitable for your situation. Youshould consult with a professional where appropriate. Neither the publisher nor authorshall be liable for any loss of profit or any other commercial damages, including but notlimited to special, incidental, consequential, or other damages.
For general information on our other products and services or for technical support,please contact our Customer Care Department within the United States at (800)762-2974, outside the United States at (317) 572-3993 or fax (317) 572-4002.
Wiley publishes in a variety of print and electronic formats and by print-on-demand.Some material included with standard print versions of this book may not be includedin e-books or in print-on-demand. If this book refers to media such as a CD or DVDthat is not included in the version you purchased, you may download this materialat http://booksupport.wiley.com. For more information about Wiley products,visit www.wiley.com.
Library of Congress Cataloging-in-Publication Data:
Ohlhorst, Frank, 1964–Big data analytics : turning big data into big money / Frank Ohlhorst.p. cm. — (Wiley & SAS business series)
Includes index.ISBN 978-1-118-14759-7 (cloth) — ISBN 978-1-118-22582-0 (ePDF) —ISBN 978-1-118-26380-8 (Mobi) — ISBN 978-1-118-23904-9 (ePub)1. Business intelligence. 2. Data mining. I. Title.
HD38.7.O36 2013658.4'72—dc23
2012030191Printed in the United States of America
10 9 8 7 6 5 4 3 2 1
ffirs 22 October 2012; 18:18:2
Contents
Preface ix
Acknowledgments xiii
Chapter 1 What Is Big Data?......................................................1
The Arrival of Analytics 2
Where Is the Value? 3
More to Big Data Than Meets the Eye 5
Dealing with the Nuances of Big Data 6
An Open Source Brings Forth Tools 7
Caution: Obstacles Ahead 8
Chapter 2 Why Big Data Matters.............................................11
Big Data Reaches Deep 12
Obstacles Remain 13
Data Continue to Evolve 15
Data and Data Analysis Are Getting More Complex 17
The Future Is Now 18
Chapter 3 Big Data and the Business Case.............................21
Realizing Value 22
The Case for Big Data 22
The Rise of Big Data Options 25
Beyond Hadoop 27
With Choice Come Decisions 28
ftoc 23 October 2012; 12:36:54
v

Chapter 4 Building the Big Data Team ....................................29
The Data Scientist 29
The Team Challenge 30
Different Teams, Different Goals 31
Don’t Forget the Data 32
Challenges Remain 32
Teams versus Culture 34
Gauging Success 35
Chapter 5 Big Data Sources .....................................................37
Hunting for Data 38
Setting the Goal 39
Big Data Sources Growing 40
Diving Deeper into Big Data Sources 42
A Wealth of Public Information 43
Getting Started with Big Data Acquisition 44
Ongoing Growth, No End in Sight 46
Chapter 6 The Nuts and Bolts of Big Data ..............................47
The Storage Dilemma 47
Building a Platform 52
Bringing Structure to Unstructured Data 57
Processing Power 59
Choosing among In-house, Outsourced, or Hybrid Approaches 61
Chapter 7 Security, Compliance, Auditing,and Protection.........................................................63
Pragmatic Steps to Securing Big Data 64
Classifying Data 65
Protecting Big Data Analytics 66
Big Data and Compliance 67
The Intellectual Property Challenge 72
ftoc 23 October 2012; 12:36:54
vi ⁄ C O N T E N T S
Chapter 8 The Evolution of Big Data .......................................77
Big Data: The Modern Era 80
Today, Tomorrow, and the Next Day 84
Changing Algorithms 90
Chapter 9 Best Practices for Big Data Analytics ....................93
Start Small with Big Data 94
Thinking Big 95
Avoiding Worst Practices 96
Baby Steps 98
The Value of Anomalies 101
Expediency versus Accuracy 103
In-Memory Processing 104
Chapter 10 Bringing It All Together.......................................111
The Path to Big Data 112
The Realities of Thinking Big Data 113
Hands-on Big Data 115
The Big Data Pipeline in Depth 116
Big Data Visualization 121
Big Data Privacy 122
Appendix Supporting Data.....................................................125
“The MapR Distribution for Apache Hadoop” 126
“High Availability: No Single Points of Failure” 142
About the Author 151
Index 153
ftoc 23 October 2012; 12:36:54
C O N T E N T S¥ vii

ftoc 23 October 2012; 12:36:54

Preface
What are data? This seems like a simple enough question; however,
depending on the interpretation, the definition of data can be anything
from “something recorded” to “everything under the sun.” Data can be
summed up as everything that is experienced, whether it is a machine
recording information from sensors, an individual taking pictures, or a
cosmic event recorded by a scientist. In other words, everything is
data. However, recording and preserving that data has always been
the challenge, and technology has limited the ability to capture and
preserve data.
The human brain’s memory storage capacity is supposed to be
around 2.5 petabytes (or 1 million gigabytes). Think of it this way:
If your brain worked like a digital video recorder in a television, 2.5
petabytes would be enough to hold 3 million hours of TV shows. You
would have to leave the TV running continuously for more than 300
years to use up all of that storage space. The available technology for
storing data fails in comparison, creating a technology segment called
Big Data that is growing exponentially.
Today, businesses are recording more and more information, and
that information (or data) is growing, consuming more and more
storage space and becoming harder to manage, thus creating Big Data.
The reasons vary for the need to record such massive amounts of
information. Sometimes the reason is adherence to compliance reg-
ulations, at other times it is the need to preserve transactions, and in
many cases it is simply part of a backup strategy.
Nevertheless, it costs time and money to save data, even if it’s only
for posterity. Therein lies the biggest challenge: How can businesses
continue to afford to save massive amounts of data? Fortunately, those
who have come up with the technologies to mitigate these storage
fpref 22 October 2012; 18:25:28
ix
concerns have also come up with a way to derive value from what
many see as a burden. It is a process called Big Data analytics.
The concepts behind Big Data analytics are actually nothing new.
Businesses have been using business intelligence tools for many dec-
ades, and scientists have been studying data sets to uncover the secrets
of the universe for many years. However, the scale of data collection is
changing, and the more data you have available, the more information
you can extrapolate from them.
The challenge today is to find the value of the data and to explore
data sources in more interesting and applicable ways to develop
intelligence that can drive decisions, find relationships, solve problems,
and increase profits, productivity, and even the quality of life.
The key is to think big, and that means Big Data analytics.
This book will explore the concepts behind Big Data, how to
analyze that data, and the payoff from interpreting the analyzed data.
Chapter 1 deals with the origins of Big Data analytics, explores the
evolution of the associated technology, and explains the basic
concepts behind deriving value.
Chapter 2 delves into the different types of data sources and
explains why those sources are important to businesses that
are seeking to find value in data sets.
Chapter 3 helps those who are looking to leverage data analytics to
build a business case to spur investment in the technologies
and to develop the skill sets needed to successfully extract
intelligence and value out of data sets.
Chapter 4 brings the concepts of the analytics team together,
describes the necessary skill sets, and explains how to integrate
Big Data into a corporate culture.
Chapter 5 assists in the hunt for data sources to feed Big Data ana-
lytics, covers the various public and private sources for data, and
identifies the different types of data usable for analytics.
Chapter 6 deals with storage, processing power, and platforms by
describing the elements that make up a Big Data analytics
system.
fpref 22 October 2012; 18:25:28
x ⁄ P R E F A C E
Chapter 7 describes the importance of security, compliance, and
auditing—the tools and techniques that keep large data sources
secure yet available for analytics.
Chapter 8 delves into the evolution of Big Data and discusses the
short-term and long-term changes that will materialize as Big
Data evolves and is adopted by more and more organizations.
Chapter 9 discusses best practices for data analysis, covers some of
the key concepts that make Big Data analytics easier to deliver,
and warns of the potential pitfalls and how to avoid them.
Chapter 10 explores the concept of the data pipeline and how
Big Data moves through the analysis process and is then
transformed into usable information that delivers value.
Sometimes the best information on a particular technology comes
from those who are promoting that technology for profit and growth,
hence the birth of the white paper. White papers are meant to edu-
cate and inform potential customers about a particular technology
segment while gently goading those potential customers toward the
vendor’s product.
That said, it is always best to take white papers with a grain of
salt. Nevertheless, white papers prove to be an excellent source for
researching technology and have significant educational value. With
that in mind, I have included the following white papers in the appendix
of this book, and each offers additional knowledge for those who are
looking to leverage Big Data solutions: “The MapR Distribution for
Apache Hadoop” and “High Availability: No Single Points of Failure,”
both from MapR Technologies.
fpref 22 October 2012; 18:25:28
P R E F A C E¥ xi

fpref 22 October 2012; 18:25:28
Acknowledgments
Take it fromme, writing a book takes time, patience, and motivation in
equal measures. At times the challenges can be overwhelming, and it
becomes very easy to lose focus. However, analytics, patterns, and
uncovering the hidden meaning behind data have always attracted
me. When one considers the possibilities offered by comprehensive
analytics and the inclusion of what may seem to be unrelated data sets,
the effort involved seems almost inconsequential.
The idea for this book came from a brief conversation with John
Wiley & Sons editor Timothy Burgard, who contacted me out of the
blue with a proposition to build on some articles I had written on Big
Data. Tim explained that comprehensive information that could be
consumed by C-level executives and those entering the data analytics
arena was sorely lacking, and he thought that I was up to the challenge
of creating that information. So it was with Tim’s encouragement that I
started down the path to create a book on Big Data.
I would be remiss if I didn’t mention the excellent advice and
additional motivation that I received from John Wiley & Sons devel-
opment editor Stacey Rivera, who was faced with the challenge of
keeping me on track and moving me along in the process—a chore
that I would not wish on anyone!
Putting together a book like this is a long journey that introduced
me to many experts, mentors, and acquaintances who helped me to
shape my ideology on how large data sets can be brought together for
processing to uncover trends and other valuable bits of information.
I also have to acknowledge the many vendors in the Big Data
arena who inadvertently helped me along my journey to expose the
value contained in data. Those vendors, who number in the dozens,
have made concentrated efforts to educate the public about the value
behind Big Data, and the events they have sponsored as well as the
flast 22 October 2012; 18:21:7
xiii

information they have disseminated have helped to further define the
market and give rise to conversations that encouraged me to pursue
my ultimate goal of writing a book.
Writing takes a great deal of energy and can quickly consume all
of the hours in a day. With that in mind, I have to thank the numerous
editors whom I have worked with on freelance projects while concur-
rently writing this book. Without their understanding and flexibility,
I could never have written this book, or any other. Special thanks
go out to Mike Vizard, Ed Scannell, Mike Fratto, Mark Fontecchio,
James Allen Miller, and Cameron Sturdevant.
When it comes to providing the ultimate in encouragement and
support, no one can compare with my wife, Carol, who understood
the toll that writing a book would take on family time and was still
willing to provide me with whatever I needed to successfully complete
this book. I also have to thank my children, Connor, Tyler, Sarah, and
Katelyn, for understanding that Daddy had to work and was not
always available. I am very thankful to have such a wonderful and
supportive family.
flast 22 October 2012; 18:21:8
xiv ⁄ A C K N O W L E D G M E N T S
C H A P T E R 1What Is Big Data?
What exactly is Big Data? At first glance, the term seems rather
vague, referring to something that is large and full of infor-
mation. That description does indeed fit the bill, yet it provides
no information on what Big Data really is.
Big Data is often described as extremely large data sets that have
grown beyond the ability to manage and analyze them with traditional
data processing tools. Searching the Web for clues reveals an almost
universal definition, shared by the majority of those promoting the
ideology of Big Data, that can be condensed into something like this:
Big Data defines a situation in which data sets have grown to such
enormous sizes that conventional information technologies can no
longer effectively handle either the size of the data set or the scale and
growth of the data set. In other words, the data set has grown so large
that it is difficult to manage and even harder to garner value out of it.
The primary difficulties are the acquisition, storage, searching, sharing,
analytics, and visualization of data.
There is much more to be said about what Big Data actually is. The
concept has evolved to include not only the size of the data set but also
the processes involved in leveraging the data. Big Data has even
become synonymous with other business concepts, such as business
intelligence, analytics, and data mining.
Paradoxically, Big Data is not that new. Although massive data sets
have been created in just the last two years, Big Data has its roots in
the scientific and medical communities, where the complex analysis of
c01 22 October 2012; 17:52:19
1

massive amounts of data has been done for drug development, physics
modeling, and other forms of research, all of which involve large data
sets. Yet it is these very roots of the concept that have changed what
Big Data has come to be.
THE ARRIVAL OF ANALYTICS
As analytics and research were applied to large data sets, scientists came
to the conclusion that more is better—in this case, more data, more
analysis, and more results. Researchers started to incorporate related
data sets, unstructured data, archival data, and real-time data into the
process, which in turn gave birth to what we now call Big Data.
In the business world, Big Data is all about opportunity. According
to IBM, every day we create 2.5 quintillion (2.5 3 1018) bytes of data,
so much that 90 percent of the data in the world today has been
created in the last two years. These data come from everywhere:
sensors used to gather climate information, posts to social media sites,
digital pictures and videos posted online, transaction records of online
purchases, and cell phone GPS signals, to name just a few. That is the
catalyst for Big Data, along with the more important fact that all of
these data have intrinsic value that can be extrapolated using analytics,
algorithms, and other techniques.
Big Data has already proved its importance and value in several
areas. Organizations such as the National Oceanic and Atmospheric
Administration (NOAA), the National Aeronautics and Space Admin-
istration (NASA), several pharmaceutical companies, and numerous
energy companies have amassed huge amounts of data and now
leverage Big Data technologies on a daily basis to extract value
from them.
NOAA uses Big Data approaches to aid in climate, ecosystem,
weather, and commercial research, while NASA uses Big Data for
aeronautical and other research. Pharmaceutical companies and
energy companies have leveraged Big Data for more tangible results,
such as drug testing and geophysical analysis. The New York Times has
used Big Data tools for text analysis and Web mining, while the Walt
Disney Company uses them to correlate and understand customer
behavior in all of its stores, theme parks, and Web properties.
c01 22 October 2012; 17:52:19
2 ⁄ B I G D A T A A N A L Y T I C S
Big Data plays another role in today’s businesses: Large organi-
zations increasingly face the need to maintain massive amounts of
structured and unstructured data—from transaction information in
data warehouses to employee tweets, from supplier records to regu-
latory filings—to comply with government regulations. That need has
been driven even more by recent court cases that have encouraged
companies to keep large quantities of documents, e-mail messages,
and other electronic communications, such as instant messaging and
Internet provider telephony, that may be required for e-discovery if
they face litigation.
WHERE IS THE VALUE?
Extracting value is much more easily said than done. Big Data is full of
challenges, ranging from the technical to the conceptual to the oper-
ational, any of which can derail the ability to discover value and
leverage what Big Data is all about.
Perhaps it is best to think of Big Data in multidimensional terms, in
which four dimensions relate to the primary aspects of Big Data. These
dimensions can be defined as follows:
1. Volume. Big Data comes in one size: large. Enterprises are
awash with data, easily amassing terabytes and even petabytes
of information.
2. Variety. Big Data extends beyond structured data to include
unstructured data of all varieties: text, audio, video, click
streams, log files, and more.
3. Veracity. The massive amounts of data collected for Big Data
purposes can lead to statistical errors and misinterpretation of the
collected information. Purityof the information is critical for value.
4. Velocity. Often time sensitive, Big Data must be used as it is
streaming into the enterprise in order to maximize its value to
the business, but it must also still be available from the archival
sources as well.
These 4Vs of Big Data lay out the path to analytics, with each
having intrinsic value in the process of discovering value.
c01 22 October 2012; 17:52:19
WH A T I S B I G D A T A ?¥ 3
Nevertheless, the complexity of Big Data does not end with just four
dimensions. There are other factors at work as well: the processes that
Big Data drives. These processes are a conglomeration of technologies
and analytics that are used to define the value of data sources, which
translates to actionable elements that move businesses forward.
Many of those technologies or concepts are not new but have
come to fall under the umbrella of Big Data. Best defined as analysis
categories, these technologies and concepts include the following:
j Traditional business intelligence (BI). This consists of a
broad category of applications and technologies for gathering,
storing, analyzing, and providing access to data. BI delivers
actionable information, which helps enterprise users make
better business decisions using fact-based support systems. BI
works by using an in-depth analysis of detailed business data,
provided by databases, application data, and other tangible
data sources. In some circles, BI can provide historical, current,
and predictive views of business operations.
j Data mining. This is a process in which data are analyzed from
different perspectives and then turned into summary data that
are deemed useful. Data mining is normally used with data at
rest or with archival data. Data mining techniques focus on
modeling and knowledge discovery for predictive, rather than
purely descriptive, purposes—an ideal process for uncovering
new patterns from large data sets.
j Statistical applications. These look at data using algorithms
based on statistical principles and normally concentrate on data
sets related to polls, census, and other static data sets. Statistical
applications ideally deliver sample observations that can be used
to study populated data sets for the purpose of estimating,
testing, and predictive analysis. Empirical data, such as surveys
and experimental reporting, are the primary sources for ana-
lyzable information.
j Predictive analysis. This is a subset of statistical applications in
which data sets are examined to come up with predictions,
based on trends and information gleaned from databases. Pre-
dictive analysis tends to be big in the financial and scientific
c01 22 October 2012; 17:52:19
4 ⁄ B I G D A T A A N A L Y T I C S
worlds, where trending tends to drive predictions, once external
elements are added to the data set. One of the main goals of
predictive analysis is to identify the risks and opportunities for
business process, markets, and manufacturing.
j Data modeling. This is a conceptual application of analytics
in which multiple “what-if” scenarios can be applied via algo-
rithms to multiple data sets. Ideally, the modeled information
changes based on the information made available to the algo-
rithms, which then provide insight to the effects of the change
on the data sets. Data modeling works hand in hand with data
visualization, in which uncovering information can help with a
particular business endeavor.
The preceding analysis categories constitute only a portion of
where Big Data is headed and why it has intrinsic value to business.
That value is driven by the never-ending quest for a competitive
advantage, encouraging organizations to turn to large repositories of
corporate and external data to uncover trends, statistics, and other
actionable information to help them decide on their next move. This
has helped the concept of Big Data to gain popularity with technolo-
gists and executives alike, along with its associated tools, platforms,
and analytics.
MORE TO BIG DATA THAN MEETS THE EYE
The volume and overall size of the data set is only one portion of the
Big Data equation. There is a growing consensus that both semi-
structured and unstructured data sources contain business-critical
information and must therefore be made accessible for both BI and
operational needs. It is also clear that the amount of relevant
unstructured business data is not only growing but will continue to
grow for the foreseeable future.
Data can be classified under several categories: structured data,
semistructured data, and unstructured data. Structured data are nor-
mally found in traditional databases (SQL or others) where data are
organized into tables based on defined business rules. Structured data
usually prove to be the easiest type of data to work with, simply
c01 22 October 2012; 17:52:19
WH A T I S B I G D A T A ?¥ 5

because the data are defined and indexed, making access and filtering
easier.
Unstructured data, in contrast, normally have no BI behind them.
Unstructured data are not organized into tables and cannot be natively
used by applications or interpreted by a database. A good example of
unstructured data would be a collection of binary image files.
Semistructured data fall between unstructured and structured data.
Semistructured data do not have a formal structure like a database with
tables and relationships. However, unlike unstructured data, semi-
structured data have tags or other markers to separate the elements and
provide a hierarchy of records and fields, which define the data.
DEALING WITH THE NUANCES OF BIG DATA
Dealing with different types of data is converging, thanks to utilities
and applications that can process the data sets using standard XML
formats and industry-specific XML data standards (e.g., ACORD in
insurance, HL7 in health care). These XML technologies are expanding
the types of data that can be handled by Big Data analytics and inte-
gration tools, yet the transformation capabilities of these processes are
still being strained by the complexity and volume of the data, leading
to a mismatch between the existing transformation capabilities and the
emerging needs. This is opening the door for a new type of universal
data transformation product that will allow transformations to be
defined for all classes of data (structured, semistructured, and
unstructured), without writing code, and able to be deployed to any
software application or platform architecture.
Both the definition of Big Data and the execution of the related
analytics are still in a state of flux; the tools, technologies, and pro-
cedures continue to evolve. Yet this situation does not mean that those
who seek value from large data sets should wait. Big Data is far too
important to business processes to take a wait-and-see approach.
The real trick with Big Data is to find the best way to deal with the
varied data sources and still meet the objectives of the analytical
process. This takes a savvy approach that integrates hardware, soft-
ware, and procedures into a manageable process that delivers results
within an acceptable time frame—and it all starts with the data.
c01 22 October 2012; 17:52:20
6 ⁄ B I G D A T A A N A L Y T I C S

Storage is the critical element for Big Data. The data have to be
stored somewhere, readily accessible and protected. This has proved to
be an expensive challenge for many organizations, since network-
based storage, such as SANS and NAS, can be very expensive to pur-
chase and manage.
Storage has evolved to become one of the more pedestrian ele-
ments in the typical data center—after all, storage technologies have
matured and have started to approach commodity status. Neverthe-
less, today’s enterprises are faced with evolving needs that can put the
strain on storage technologies. A case in point is the push for Big Data
analytics, a concept that brings BI capabilities to large data sets.
The Big Data analytics process demands capabilities that are
usually beyond the typical storage paradigms. Traditional storage
technologies, such as SANS, NAS, and others, cannot natively deal
with the terabytes and petabytes of unstructured information pre-
sented by Big Data. Success with Big Data analytics demands some-
thing more: a new way to deal with large volumes of data, a new
storage platform ideology.
AN OPEN SOURCE BRINGS FORTH TOOLS
Enter Hadoop, an open source project that offers a platform to work
with Big Data. Although Hadoop has been around for some time, more
and more businesses are just now starting to leverage its capabilities.
The Hadoop platform is designed to solve problems caused by massive
amounts of data, especially data that contain a mixture of complex
structured and unstructured data, which does not lend itself well to
being placed in tables. Hadoop works well in situations that require the
support of analytics that are deep and computationally extensive, like
clustering and targeting.
For the decision maker seeking to leverage Big Data, Hadoop
solves the most common problem associated with Big Data: storing and
accessing large amounts of data in an efficient fashion.
The intrinsic design of Hadoop allows it to run as a platform that is
able to work on a large number of machines that don’t share any
memory or disks. With that in mind, it becomes easy to see how
Hadoop offers additional value: Network managers can simply buy a
c01 22 October 2012; 17:52:20
WH A T I S B I G D A T A ?¥ 7
whole bunch of commodity servers, slap them in a rack, and run the
Hadoop software on each one.
Hadoop also helps to remove much of the management overhead
associated with large data sets. Operationally, as an organization’s data
are being loaded into a Hadoop platform, the software breaks down
the data into manageable pieces and then automatically spreads them
to different servers. The distributed nature of the data means there is
no one place to go to access the data; Hadoop keeps track of where the
data reside, and it protects the data by creating multiple copy stores.
Resiliency is enhanced, because if a server goes offline or fails, the data
can be automatically replicated from a known good copy.
The Hadoop paradigm goes several steps further in working
with data. Take, for example, the limitations associated with a
traditional centralized database system, which may consist of a large
disk drive connected to a server class system and featuring multiple
processors. In that scenario, analytics is limited by the performance
of the disk and, ultimately, the number of processors that can be
bought to bear.
With a Hadoop cluster, every server in the cluster can participate in
the processing of the data by utilizing Hadoop’s ability to spread the
work and the data across the cluster. In other words, an indexing job
works by sending code to each of the servers in the cluster, and each
server then operates on its own little piece of the data. The results are
then delivered back as a unified whole. With Hadoop, the process is
referred to as MapReduce, in which the code or processes are mapped
to all the servers and the results are reduced to a single set.
This process is what makes Hadoop so good at dealing with large
amounts of data: Hadoop spreads out the data and can handle complex
computational questions by harnessing all of the available cluster
processors to work in parallel.
CAUTION: OBSTACLES AHEAD
Nevertheless, venturing into the world of Hadoop is not a plug-and-play
experience; there are certain prerequisites, hardware requirements, and
configuration chores that must be met to ensure success. The first step
c01 22 October 2012; 17:52:20
8 ⁄ B I G D A T A A N A L Y T I C S
consists of understanding and defining the analytics process. Most chief
information officers are familiar with business analytics (BA) or BI
processes and can relate to the most common process layer used: the
extract, transform, and load (ETL) layer and the critical role it plays
when building BA or BI solutions. Big Data analytics requires that
organizations choose the data to analyze, consolidate them, and then
apply aggregation methods before the data can be subjected to the ETL
process. This has to occur with large volumes of data, which can be
structured, unstructured, or from multiple sources, such as social net-
works, data logs, web sites, mobile devices, and sensors.
Hadoop accomplishes that by incorporating pragmatic processes
and considerations, such as a fault-tolerant clustered architecture, the
ability to move computing power closer to the data, parallel and/or
batch processing of large data sets, and an open ecosystem that sup-
ports enterprise architecture layers from data storage to analytics
processes.
Not all enterprises require what Big Data analytics has to offer;
those that do must consider Hadoop’s ability to meet the challenge.
However, Hadoop cannot accomplish everything on its own. Enter-
prises will need to consider what additional Hadoop components are
needed to build a Hadoop project.
For example, a starter set of Hadoop components may consist of
the following: HDFS and HBase for data management, MapReduce
and OOZIE as a processing framework, Pig and Hive as development
frameworks for developer productivity, and open source Pentaho for
BI. A pilot project does not require massive amounts of hardware. The
hardware requirements can be as simple as a pair of servers with
multiple cores, 24 or more gigabytes of RAM, and a dozen or so hard
disk drives of 2 terabytes each. This should prove sufficient to get a
pilot project off the ground.
Data managers should be forewarned that the effective manage-
ment and implementation of Hadoop requires some expertise and
experience, and if that expertise is not readily available, information
technology management should consider partnering with a service
provider that can offer full support for the Hadoop project. Such
expertise proves especially important for security; Hadoop, HDFS, and
c01 22 October 2012; 17:52:20
WH A T I S B I G D A T A ?¥ 9

HBase offer very little in the form of integrated security. In other
words, the data still need to be protected from compromise or theft.
All things considered, an in-house Hadoop project makes the most
sense for a pilot test of Big Data analytics capabilities. After the pilot, a
plethora of commercial and/or hosted solutions are available to those
who want to tread further into the realm of Big Data analytics.
c01 22 October 2012; 17:52:20
10 ⁄ B I G D A T A A N A L Y T I C S

C H A P T E R 2Why Big DataMatters
Knowing what Big Data is and knowing its value are two different
things. Even with an understanding of Big Data analytics, the
value of the information can still be difficult to visualize. At first
glance, the well of structured, unstructured, and semistructured data
seems almost unfathomable, with each bucket drawn being little more
than a mishmash of unrelated data elements.
Finding what matters and why it matters is one of the first steps
in drinking from the well of Big Data and the key to avoid drowning in
information. However, this question still remains: Why does Big Data
matter? It seems difficult to answer for small and medium businesses,
especially those that have shunned business intelligence solutions in
the past and have come to rely on other methods to develop their
markets and meet their goals.
For the enterprise market, Big Data analytics has proven its
value, and examples abound. Companies such as Facebook,
Amazon, and Google have come to rely on Big Data analytics as part
of their primary marketing schemes as well as a means of servicing
their customers better.
For example, Amazon has leveraged its Big Data well to create an
extremely accurate representation of what products a customer should
buy. Amazon accomplishes that by storing each customer’s searches
and purchases and almost any other piece of information available,
c02 22 October 2012; 17:53:9
11

and then applying algorithms to that information to compare one
customer’s information with all of the other customers’ information.
Amazon has learned the key trick of extracting value from a large
data well and has applied performance and depth to a massive amount
of data to determine what is important and what is extraneous. The
company has successfully captured the data “exhaust” that any cus-
tomer or potential customer has left behind to build an innovative
recommendation and marketing data element.
The results are real and measurable, and they offer a practical
advantage for a customer. Take, for example, a customer buying a
jacket in a snowy region. Why not suggest purchasing gloves to match,
or boots, as well as a snow shovel, an ice melt, and tire chains? For an
in-store salesperson, those recommendations may come naturally; for
Amazon, Big Data analytics is able to interpret trends and bring
understanding to the purchasing process by simply looking at what
customers are buying, where they are buying it, and what they have
purchased in the past. Those data, combined with other public data
such as census, meteorological, and even social networking data,
create a unique capability that services the customer and Amazon
as well.
Much the same can be said for Facebook, where Big Data comes
into play for critical features such as friend suggestions, targeted ads,
and other member-focused offerings. Facebook is able to accumulate
information by using analytics that leverage pattern recognition, data
mash-ups, and several other data sources, such as a user’s preferences,
history, and current activity. Those data are mined, along with the data
from all of the other users, to create focused recommendations, which
are reported to be quite accurate for the majority of users.
BIG DATA REACHES DEEP
Google leverages the Big Data model as well, and it is one of the ori-
ginators of the software elements that make Big Data possible. How-
ever, Google’s approach and focus is somewhat different from that of
companies like Facebook and Amazon. Google aims to use Big Data to
its fullest extent, to judge search results, predict Internet traffic usage,
and service customers with Google’s own applications. From the
c02 22 October 2012; 17:53:9
12 ⁄ B I G D A T A A N A L Y T I C S

advertising perspective, Web searches can be tied to products that fit
into the criteria of the search by delving into a vast mine of Web search
information, user preferences, cookies, histories, and so on.
Of course, Amazon, Google, and Facebook are huge enterprises
and have access to petabytes of data for analytics. However, they are
not the only examples of how Big Data has affected business processes.
Examples abound from the scientific, medical, and engineering com-
munities, where huge amounts of data are gathered through experi-
mentation, observation, and case studies. For example, the Large
Hadron Collider at CERN can generate one petabyte of data per sec-
ond, giving new meaning to the concept of Big Data. CERN relies on
those data to determine the results of experiments using complex
algorithms and analytics that can take significant amounts of time and
processing power to complete.
Many pharmaceutical and medical research firms are in the same
category as CERN, as well as organizations that research earthquakes,
weather, and global climates. All benefit from the concept of Big Data.
However, where does that leave small and medium businesses? How
can these entities benefit from Big Data analytics? These businesses do
not typically generate petabytes of data or deal with tremendous
volumes of uncategorized data, or do they?
For small and medium businesses (SMB), Big Data analytics can
deliver value for multiple business segments. That is a relatively recent
development within the Big Data analytics market. Small and medium
businesses have access to scores of publicly available data, including
most of the Web and social networking sites. Several hosted services
have also come into being that can offer the computing power, storage,
and platforms for analytics, changing the Big Data analytics market into
a “pay as you go, consume what you need” entity. This proves to be
very affordable for the SMB market and allows those businesses to take
it slow and experiment with what Big Data analytics can deliver.
OBSTACLES REMAIN
With the barriers of data volume and costs somewhat eliminated, there
are still significant obstacles for SMB entities to leverage Big Data.
Those obstacles include the purity of the data, analytical knowledge,
c02 22 October 2012; 17:53:9
WH Y B I G D A T A M A T T E R S¥ 13

an understanding of statistics, and several other philosophical and
educational challenges. It all comes down to analyzing the data not just
because they are there but for a specific business purpose.
For SMBs looking to gain experience in analytics, the first place to
turn to is the Web—namely, for analyzing web site traffic. Here an
SMB can use a tool like Blekko (http://www.blekko.com) to look at
traffic distribution to a web site. This information can be very valuable
for SMBs that rely on a company web site to disseminate marketing
information, sell items, or communicate with current and potential
customers. Blekko fits the Big Data paradigm because it looks at
multiple large data sets and creates visual results that have meaningful,
actionable information. Using Blekko, a small business can quickly
gather statistics about its web site and compare it with a competitor’s
web site.
Although Blekko may be one of the simplest examples of Big Data
analytics, it does illustrate the point that even in its simplest form, Big
Data analytics can benefit SMBs, just as it can benefit large enterprises.
Of course, other tools exist, and new ones are coming to market all of
the time. As those tools mature and become accessible to the SMB
market, more opportunities will arise for SMBs to leverage the Big
Data concept.
Gathering the data is usually half the battle in the analytics game.
SMBs can search the Web with tools like 80Legs, Extractiv, and Nee-
dlebase, all of which offer capabilities for gathering data from the Web.
The data can include social networking information, sales lists, real
estate listings, product lists, and product reviews and can be gathered
into structured storage and then analyzed. The gathered data prove to
be a valuable resource for businesses that look to analytics to enhance
their market standings.
Big Data, whether done in-house or on a hosted offering, provides
value to businesses of any size—from the smallest business looking to
find its place in its market to the largest enterprise looking to identify
the next worldwide trend. It all comes down to discovering and
leveraging the data in an intelligent fashion.
The amount of data in our world has been exploding, and ana-
lyzing large data sets is already becoming a key basis of competition,
underpinning new waves of productivity growth, innovation, and
c02 22 October 2012; 17:53:9
14 ⁄ B I G D A T A A N A L Y T I C S
consumer surplus. Business leaders in every sector are going to have to
deal with the implications of Big Data, either directly or indirectly.
Furthermore, the increasing volume and detail of information
acquired by businesses and government agencies—paired with the rise
of multimedia, social media, instant messaging, e-mail, and other
Internet-enabled technologies—will fuel exponential growth in data
for the foreseeable future. Some of that growth can be attributed to
increased compliance requirements, but a key factor in the increase in
data volumes is the increasingly sensor-enabled and instrumented
world. Examples include RFID tags, vehicles equipped with GPS sen-
sors, low-cost remote sensing devices, instrumented business pro-
cesses, and instrumented web site interactions.
The question may soon arise of whether Big Data is too big, leading
to a situation in which determining value may prove more difficult.
This will evolve into an argument for the quality of the data over the
quantity. Nevertheless, it will be almost impossible to deal with ever-
growing data sources if businesses don’t prepare to deal with the
management of data head-on.
DATA CONTINUE TO EVOLVE
Before 2010, managing data was a relatively simple chore: Online
transaction processing systems supported the enterprise’s business
processes, operational data stores accumulated the business transac-
tions to support operational reporting, and enterprise data warehouses
accumulated and transformed business transactions to support both
operational and strategic decision making.
The typical enterprise now experiences a data growth rate of 40 to
60 percent annually, which in turn increases financial burdens and
data management complexity. This situation implies that the data
themselves are becoming less valuable and more of a liability for many
businesses, or a low-commodity element.
Nothing could be further from the truth. More data mean more
value, and countless companies have proved that axiom with Big Data
analytics. To exemplify that value, one needs to look no further than at
how vertical markets are leveraging Big Data analytics, which leads to
a disruptive change.
c02 22 October 2012; 17:53:9
WH Y B I G D A T A M A T T E R S¥ 15
For example, smaller retailers are collecting click-stream data from
web site interactions and loyalty card data from traditional retailing
operations. This point-of-sale information has traditionally been used
by retailers for shopping basket analysis and stock replenishment, but
many retailers are now going one step further and mining the data for
a customer buying analysis. Those retailers are then sharing those data
(after normalization and identity scrubbing) with suppliers and
warehouses to bring added efficiency to the supply chain.
Another example of finding value comes from the world of sci-
ence, where large-scale experiments create massive amounts of data
for analysis. Big science is now paired with Big Data. There are far-
reaching implications in how big science is working with Big Data; it is
helping to redefine how data are stored, mined, and analyzed. Large-
scale experiments are generating more data than can be held at a lab’s
data center (e.g., the Large Hadron Collider at CERN generates over 15
petabytes of data per year), which in turn requires that the data be
immediately transferred to other laboratories for processing—a true
model of distributed analysis and processing.
Other scientific quests are prime examples of Big Data in action,
fueling a disruptive change in how experiments are performed and
data interpreted. Thanks to Big Data methodologies, continental-scale
experiments have become both politically and technologically feasible
(e.g., the Ocean Observatories Initiative, the National Ecological Obser-
vatory Network, and USArray, a continental-scale seismic observatory).
Much of the disruption is fed by improved instrument and sensor
technology; for instance, the Large Synoptic Survey Telescope has a
3.2-gigabyte pixel camera and generates over 6 petabytes of image
data per year. It is the platform of Big Data that is making such lofty
goals attainable.
The validation of Big Data analytics can be illustrated by advances
in science. The biomedical corporation Bioinformatics recently
announced that it has reduced the time it takes to sequence a genome
from years to days, and it has also reduced the cost, so it will be feasible
to sequence an individual’s genome for $1,000, paving the way for
improved diagnostics and personalized medicine.
The financial sector has seen how Big Data and its associated
analytics can have a disruptive impact on business. Financial services
c02 22 October 2012; 17:53:9
16 ⁄ B I G D A T A A N A L Y T I C S
firms are seeing larger volumes through smaller trading sizes,
increased market volatility, and technological improvements in auto-
mated and algorithmic trading.
DATA AND DATA ANALYSIS ARE GETTINGMORE COMPLEX
One of the surprising outcomes of the Big Data paradigm is the shift of
where the value can be found in the data. In the past, there was an
inherent hypothesis that the bulk of value could be found in structured
data, which usually constitute about 20 percent of the total data stored.
The other 80 percent of data is unstructured in nature and was often
viewed as having limited or little value.
That perception began to change once the successes of search
engine providers and e-retailers showed otherwise. It was the analysis
of that unstructured data that led to click-stream analytics (for
e-retailers) and search engine predictions that launchedmuch of the Big
Data movement. The first examples of the successful processing of large
volumes of unstructured data led other industries to take note, which in
turn has led to enterprises mining and analyzing structured and
unstructured data in conjunction to look for competitive advantages.
Unstructured data bring complexity to the analytics process.
Technologies such as image processing for face recognition, search
engine classification of videos, and complex data integration during
geospatial processing are becoming the norm in processing unstruc-
tured data. Add to that the need to support traditional transaction-
based analysis (e.g., financial performance), and it becomes easy to see
complexity growing exponentially. Moreover, other capabilities are
becoming a requirement, such as web click-stream data driving
behavioral analysis.
Behavioral analytics is a process that determines patterns of
behavior from human-to-human and human-to-system interaction
data. It requires large volumes of data to build an accurate model. The
behavioral patterns can provide insight into which series of actions led
to an event (e.g., a customer sale or a product switch). Once these
patterns have been determined, they can be used in transaction pro-
cessing to influence a customer’s decision.
c02 22 October 2012; 17:53:9
WH Y B I G D A T A M A T T E R S¥ 17
While models of transactional data analytics are well understood
and much of the value is realized from structured data, it is the value
found in behavioral analytics that allows the creation of a more pre-
dictive model. Behavioral interactions are less understood, and they
require large volumes of data to build accurate models. This is another
case where more data equal more value; this is backed by research that
suggests that a sophisticated algorithm with little data is less accurate
than a simple algorithm with a large amount of data. Evidence of this
can be found in the algorithms used for voice and handwriting rec-
ognition and crowd sourcing.
THE FUTURE IS NOW
New developments for processing unstructured data are arriving on
the scene almost daily, with one of the latest and most significant
coming from the social networking site Twitter. Making sense of its
massive database of unstructured data was a huge problem—so huge,
in fact, that it purchased another company just to help it find the value
in its massive data store. The success of Twitter revolves around how
well the company can leverage the data that its users generate. This
amounts to a great deal of unstructured information from the more
than 200 million accounts the site hosts, which generates 230 million
Twitter messages a day.
To address the problem, the social networking giant purchased
BackType, the developer of Storm, a software product that can parse
live data streams such as those created by the millions of Twitter feeds.
Twitter has released the source code of Storm, making it available to
others who want to pursue the technology. Twitter is not interested in
commercializing Storm.
Storm has proved its value for Twitter, which can now perform
analytics in real time and identify trends and emerging topics as they
develop. For example, Twitter uses the software to calculate how
widely Web addresses are shared by multiple Twitter users in real time.
With the capabilities offered by Storm, a company can process Big
Data in real time and garner knowledge that leads to a competitive
advantage. For example, calculating the reach of a Web address could
take up to 10 minutes using a single machine. However, with a Storm
c02 22 October 2012; 17:53:9
18 ⁄ B I G D A T A A N A L Y T I C S

cluster, that workload can be spread out to dozens of machines, and a
result can be discovered in just seconds. For companies that make
money from emerging trends (e.g., ad agencies, financial services, and
Internet marketers), that faster processing can be crucial.
Like Twitter, many organizations are discovering that they have
access to a great deal of data, and those data, in all forms, could
be transformed into information that can improve efficiencies, maxi-
mize profits, and unveil new trends. The trick is to organize and
analyze the data quickly enough, a process that can now be accom-
plished using open source technologies and lumped under the heading
of Big Data.
Other examples abound of how unstructured, semistructured, and
structured Big Data stores are providing value to business segments.
Take, for example, the online shopping service LivingSocial, which
leverages technologies such as the Apache Hadoop data processing
platform to garner information about what its users want.
The process has allowed LivingSocial to offer predictive analysis in
real time, which better services its customer base. The company is not
alone in its quest for squeezing the most value out of its unstructured
data. Other major shopping sites, shopping comparison sites, and
online versions of brick-and-mortar stores have also implemented
technologies to bring real-time analytics to the forefront of customer
interaction.
However, in that highly competitive market, finding new ways to
interpret the data and process them faster is proving to be the critical
competitive advantage and is driving Big Data analytics forward with
new innovations and processes. Those enterprises and many others
learned that data in all forms cannot be considered a commodity item,
and just as with gold, it is through mining that one finds the nuggets of
value that can affect the bottom line.
c02 22 October 2012; 17:53:9
WH Y B I G D A T A M A T T E R S¥ 19

c02 22 October 2012; 17:53:9
C H A P T E R 3Big Data and theBusiness Case
B ig Data is quickly becoming more than just a buzzword. A
plethora of organizations have made significant investments in
the technology that surrounds Big Data and are currently starting
to leverage the content within to find real value.
Even so, there is still a great deal of confusion about Big Data,
similar to what many information technology (IT) managers have
experienced in the past with disruptive technologies. Big Data is dis-
ruptive in the way that it changes how business intelligence (BI) is
used in a business—and that is a scary proposition for many senior
executives.
That situation puts chief technology officers, chief information
officers, and IT managers in the unenviable position of trying to prove
that a disruptive technology will actually improve business operations.
Further complicating this situation is the high cost associated with in-
house Big Data processing, as well as the security concerns that sur-
round the processing of Big Data analytics off-site.
Perhaps some of the strife comes from the term Big Data itself.
Nontechnical people may think of Big Data literally, as something
associated with big problems and big costs. Presenting Big Data as “Big
Analytics” instead may be the way to win over apprehensive decision
makers while building a business case for the staff, technology, and
results that Big Data relies upon.
c03 22 October 2012; 17:55:52
21
The trick is to move beyond the accepted definition of Big Data—
which implies that it is nothing more than data sets that have become
too large to manage with traditional tools—and explain that Big Data is
a combination of technologies that mines the value of large databases.
And large is the key word here, simply because massive amounts of
data are being collected every second—more than ever imaginable—
and the size of these data is greater than can be practically managed by
today’s current strategies and technologies.
That has created a revolution in which Big Data has become
centered on the tsunami of data and how it will change the execution
of businesses processes. These changes include introducing greater
efficiencies, building new processes for revenue discovery, and fueling
innovation. Big Data has quickly grown from a new buzzword being
tossed around technology circles into a practical definition for what it is
really all about, Big Analytics.
REALIZING VALUE
A number of industries—including health care, the public sector, retail,
and manufacturing—can obviously benefit from analyzing their rap-
idly growing mounds of data. Collecting and analyzing transactional
data gives organizations more insight into their customers’ pre-
ferences, so the data can then be used as a basis for the creation of
products and services. This allows the organizations to remedy
emerging problems in a timely and more competitive manner.
The use of Big Data analytics is thus becoming a key foundation for
competition and growth for individual firms, and it will most likely
underpin new waves of productivity, growth, and consumer surplus.
THE CASE FOR BIG DATA
Building an effective business case for a Big Data project involves
identifying several key elements that can be tied directly to a business
process and are easy to understand as well as quantify. These elements
are knowledge discovery, actionable information, short-term and long-
term benefits, the resolution of pain points, and several others that are
aligned with making a business process better by providing insight.
c03 22 October 2012; 17:55:52
22 ⁄ B I G D A T A A N A L Y T I C S

In most instances, Big Data is a disruptive element when intro-
duced into an enterprise, and this disruption includes issues of scale,
storage, and data center design. The disruption normally involves costs
associated with hardware, software, staff, and support, all of which
affect the bottom line. That means that return on investment (ROI)
and total cost of ownership (TCO) are key elements of a Big Data
business plan. The trick is to accelerate ROI while reducing TCO. The
simplest way to do this is to associate a Big Data business plan with
other IT projects driven by business needs.
While that might sound like a real challenge, businesses are
actually investing in storage technologies and improved processing to
meet other business goals, such as compliance, data archiving, cloud
initiatives, and continuity planning. These initiatives can provide the
foundation for a Big Data project, thanks to the two primary needs of
Big Data: storage and processing.
Lately the natural growth of business IT solutions has been focused
on processes that take on a distributed nature in which storage and
applications are spread out over multiple systems and locations. This
also proves to be a natural companion to Big Data, further helping to
lay the foundation for Big Analytics.
Building a business case involves using case scenarios and providing
supporting information. An extensive supply of examples exists, with
several draft business cases, case scenarios, and other collateral, all
courtesy of the major vendors involved with Big Data solutions. Notable
vendorswithmassive amounts of collateral include IBM,Oracle, and HP.
While there is no set formula for building a business case, there are
some critical elements that can be used to define how a business case
should look, which helps to ensure the success of a Big Data project.
A solid business case for Big Data analytics should include the
following:
j The complete background of the project. This includes the
drivers of the project, how others are using Big Data, what
business processes Big Data will align with, and the overall goal
of implementing the project.
j Benefits analysis. It is often difficult to quantify the benefits of
Big Data as static and tangible. Big Data analytics is all about the
c03 22 October 2012; 17:55:52
B I G D A T A A N D T H E B U S I N E S S C A S E¥ 23

interpretation of data and the visualization of patterns, which
amounts to a subjective analysis, highly dependent on humans
to translate the results. However, that does not prevent a
business case from including benefits driven by Big Data in
nonsubjective terms (e.g., identifying sales trends, locating
possible inventory shrinkage, quantifying shipping delays, or
measuring customer satisfaction). The trick is to align the ben-
efits of the project with the needs of a business process or
requirement. An example of that would be to identify a business
goal, such as 5 percent annual growth, and then show how Big
Data analytics can help to achieve that goal.
j Options. There are several paths to take to the destination of
Big Data, ranging from in-house big iron solutions (data centers
running large mainframe systems) to hosted offerings in the
cloud to a hybrid of the two. It is important to research these
options and identify how each may work for achieving Big Data
analytics, as well as the pros and cons of each. Preferences and
benefits should also be highlighted, allowing a financial decision
to be tied to a technological decision.
j Scope and costs. Scope is more of a management issue than a
physical deployment issue. It all comes down to how the
implementation scope affects the resources, especially personnel
and staff. Scope questions should identify the who and the when
of the project, in which personnel hours and technical expertise
are defined, as well as the training and ancillary elements. Costs
should also be associated with staffing and training issues,
which helps to create the big picture for TCO calculations and
provides the basis for accurate ROI calculations.
j Risk analysis. Calculating risk can be a complex endeavor.
However, since Big Data analytics is truly a business process that
provides BI, risk calculations can include the cost of doing
nothing compared to the benefits delivered by the technology.
Other risks to consider are security implications (where the
data live and who can access it), CPU overhead (whether the
analytics will limit the processing power available for a line
of business applications), compatibility and integration issues
c03 22 October 2012; 17:55:52
24 ⁄ B I G D A T A A N A L Y T I C S
(whether the installation and operation will work with the
existing technology), and disruption of business processes
(installation creates downtime). All of these elements can be
considered risks with a large-scale project and should be
accounted for to build a solid business case.
Of course, the most critical theme of a business case is ROI. The
return, or benefit, that an organization is likely to receive in relation to
the cost of the project is a ratio that can change as more research is
done and information is gathered while building a business case.
Ideally, the ROI-to-cost ratio improves as more research is done and
the business case writers discover additional value from the imple-
mentation of a Big Data analytics solution. Nevertheless, ROI is usually
the most important factor in determining whether a project will ulti-
mately go forward. The determination of ROI has become one of the
primary reasons that companies and nonprofit organizations engage in
the business case process in the first place.
THE RISE OF BIG DATA OPTIONS
Teradata, IBM, HP, Oracle, and many other companies have been
offering terabyte-scale data warehouses for more than a decade, but
those offeringswere tuned for processes inwhich datawarehousingwas
the primary goal. Today, data tend to be collected and stored in a wider
variety of formats and can include structured, semistructured, and
unstructured elements, which each tend to have different storage
and management requirements. For Big Data analytics, data must be
able to be processed in parallel acrossmultiple servers. This is a necessity,
given the amounts of information being analyzed.
In addition to having exhaustively maintained transactional
data from databases and carefully culled data residing in data ware-
houses, organizations are reaping untold amounts of log data from
servers and forms of machine-generated data, customer comments
from internal and external social networks, and other sources of loose,
unstructured data.
Such data sets are growing at an exponential rate, thanks to
Moore’s Law. Moore’s Law states that the number of transistors that
c03 22 October 2012; 17:55:52
B I G D A T A A N D T H E B U S I N E S S C A S E¥ 25
can be placed on a processor wafer doubles approximately every 18
months. Each new generation of processors is twice as powerful as its
most recent predecessor. Similarly, the power of new servers also
doubles every 18 months, which means their activities will generate
correspondingly larger data sets.
The Big Data approach represents a major shift in how data are
handled. In the past, carefully culled data were piped through the
network to a data warehouse, where they could be further examined.
However, as the volume of data increases, the network becomes a
bottleneck. That is the kind of situation in which a distributed plat-
form, such as Hadoop, comes into play. Distributed systems allow the
analysis to occur where the data reside.
Traditional data systems are not able to handle Big Data effectively,
either because those systems are not designed to handle the variety of
today’s data, which tend to have much less structure, or because the
data systems cannot scale quickly and affordably. Big Data analytics
works very differently from traditional BI, which normally relies on a
clean subset of user data placed in a data warehouse to be queried in
a limited number of predetermined ways.
Big Data takes a very different approach, in which all of the data an
organization generates are gathered and interacted with. That allows
administrators and analysts to worry about how to use the data later.
In that sense, Big Data solutions prove to be more scalable than tra-
ditional databases and data warehouses.
To understand how the options around Big Data have evolved, one
must go back to the birth of Hadoop and the dawn of the Big Data
movement. Hadoop’s roots can be traced back to a 2004 Google white
paper that described the infrastructure Google built to analyze data on
many different servers, using an indexing system called Bigtable.
Google kept Bigtable for internal use, but Doug Cutting, a developer
who had already created the Lucene and Solr open source search
engine, created an open source version of Bigtable, naming the tech-
nology Hadoop after his son’s stuffed elephant.
One of Hadoop’s first adopters was Yahoo, which dedicated large
amounts of engineering work to refine the technology around 2006.
Yahoo’s primary challenge was to make sense of the vast amount of
interesting data stored across separated systems. Unifying those data
c03 22 October 2012; 17:55:52
26 ⁄ B I G D A T A A N A L Y T I C S

and analyzing them as a whole became a critical goal for Yahoo, and
Hadoop turned out to be an ideal platform to make that happen. Today
Yahoo is one of the biggest users of Hadoop and has deployed it on
more than 40,000 servers.
The company uses the technology for multiple business cases and
analytics chores. Yahoo’s Hadoop clusters hold massive log files of
what stories and sections users click on; advertisement activity is also
stored, as are lists of all of the content and articles Yahoo publishes. For
Yahoo, Hadoop has proven to be well suited for searching for patterns
in large sets of text.
BEYOND HADOOP
Another name to become familiar with in the Big Data realm is the
Cassandra database, a technology that can store 2 million columns in a
single row. That makes Cassandra ideal for appending more data onto
existing user accounts without knowing ahead of time how the data
should be formatted.
Cassandra’s roots can also be traced to an online service provider,
in this case Facebook, which needed a massive distributed database
to power the service’s inbox search. Like Yahoo, Facebook wanted to
use the Google Bigtable architecture, which could provide a column-
and row-oriented database structure that could be spread on a large
number of nodes.
However, Bigtable had a serious limitation: It used a master node–
oriented design. Bigtable depended on a single node to coordinate all
read-and-write activities on all of the nodes. This meant that if the
head node went down, the whole system would be useless.
Cassandra was built on a distributed architecture called Dynamo,
which the Amazon engineers who developed it described in a 2007
white paper. Amazon uses Dynamo to keep track of what its millions
of online customers are putting in their shopping carts.
Dynamo gave Cassandra an advantage over Bigtable, since
Dynamo is not dependent on any one master node. Any node can
accept data for the whole system, as well as answer queries. Data are
replicated on multiple hosts, creating resiliency and eliminating the
single point of failure.
c03 22 October 2012; 17:55:52
B I G D A T A A N D T H E B U S I N E S S C A S E¥ 27

WITH CHOICE COME DECISIONS
Many of the tools first developed by online service providers are
becoming more available for enterprises as open source software.
These days, Big Data tools are being tested by a wider range of orga-
nizations, beyond the large online service providers. Financial insti-
tutions, telecommunications, government agencies, utility companies,
retail, and energy companies all are testing Big Data systems.
Naturally, more choices can make a decision harder, which is
perhaps one of the biggest challenges associated with putting together
a business plan that meets project needs while not introducing any
additional uncertainty into the process. Ideally, a Big Data business
plan will exemplify the primary goal of supporting both long-term
strategic analysis and one-off transactional and behavioral analysis,
which delivers both immediate benefits and long-term benefits.
While Hadoop is applicable to the majority of businesses, it is not
the only game in town (at least when it comes to open source imple-
mentations). Once an organization has decided to leverage its heaps of
machine-generated and social networking data, setting up the infra-
structure will not be the biggest challenge. The biggest challenge may
come from deciding to go it alone with an open source or to turn to one
of the commercial implementations of Big Data technology. Vendors
such as Cloudera, Hortonworks, and MapR are commercializing Big
Data technologies, making them easier to deploy and manage.
Add to that the growing crop of Big Data on-demand services from
cloud services providers, and the decision process becomes that much
more complex. Decision makers will have to invest in research and
perform due diligence to select the proper platform and implementa-
tion methodology to make a business plan successful. However, most
of that legwork can be done during the business plan development
phase, when the pros and cons of the various Big Data methodologies
can be weighed and then measured against the overall goals of the
business plan. Which technology will get there the fastest, with the
lowest cost, and without mortgaging future capabilities?
c03 22 October 2012; 17:55:52
28 ⁄ B I G D A T A A N A L Y T I C S
C H A P T E R 4Building the BigData Team
One of the most important elements of a Big Data project is a
rather obvious but often overlooked item: people. Without
human involvement or interpretation, Big Data analytics
becomes useless, having no purpose and no value. It takes a team to
make Big Data work, and even if that team consists of only two
individuals, it is still a necessary element.
Bringing people together to build a team can be an arduous process
that involves multiple meetings, perhaps recruitment, and, of course,
personnel management. Several specialized skills in Big Data are
required, and that is what defines the team. Determining those skills is
one of the first steps in putting a team together.
THE DATA SCIENTIST
One of the first concepts to become acquainted with is the data sci-
entist; a relatively new title, it is not readily recognized or accepted by
many organizations, but it is here to stay.
A data scientist is normally associated with an employee or a
business intelligence (BI) consultant who excels at analyzing data,
particularly large amounts of data, to help a business gain a competi-
tive edge. The data scientist is usually the de facto team leader during a
Big Data analytics project.
c04 22 October 2012; 17:56:34
29
The title data scientist is sometimes disparaged because it lacks
specificity and can be perceived as an aggrandized synonym for data
analyst. Nevertheless, the position is gaining acceptance with large
enterprises that are interested in deriving meaning from Big Data, the
voluminous amount of structured, unstructured, and semistructured
data that a large enterprise produces or has access to.
A data scientist must possess a combination of analytic, machine
learning, data mining, and statistical skills as well as experience with
algorithms and coding. However, the most critical skill a data scientist
should possess is the ability to translate the significance of data in a
way that can be easily understood by others.
THE TEAM CHALLENGE
Finding and hiring talented workers with analytics skills is the first step
in creating an effective data analytics team. Organizing that team is the
next step; the relationship between IT and BI groups must be incor-
porated into the team design, leading to a determination of how much
autonomy to give to Big Data analytics professionals.
Enterprises with highly organized and centralized corporate
structures will lean toward placing an analytics team under an IT
department or a business intelligence competency center. However,
many experts have found that successful Big Data analytics projects
seem to work better using a less centralized approach, giving team
members the freedom to interpret results and define new ways of
looking at data.
For maximum effectiveness, Big Data analytics teams can be
organized by business function or placed directly within a specific
business unit. An example of this would be placing an analytics team
that focuses on customer churn (the turnover of customer accounts)
and other marketing-related analysis in a marketing department,
while a risk-focused data analytics project team would be better suited
to a finance department.
Ideally, placing the Big Data analytics team into a department
where the resulting data have immediate value is the best way to
accelerate findings, determine value, and deliver results in an action-
able fashion. That way the analyst and the departmental decision
c04 22 October 2012; 17:56:34
30 ⁄ B I G D A T A A N A L Y T I C S
makers are speaking the same language and working in a collaborative
fashion to eke out the best results.
It all depends on scale. A small business may have different ana-
lytical needs than a large business does, and that obviously affects the
relationship with the data analysis professionals and the departments
they work with.
DIFFERENT TEAMS, DIFFERENT GOALS
A case in point would be an engineering firm that is examining large
volumes of unstructured data for a technical analysis. The firm itself
may be quite small, but the data set may be quite large. For example, if
an engineering firm was designing a bridge, the components of Big
Data analytics could involve everything from census data to traffic
patterns to weather factors, which could be used to uncover load and
traffic trends that would affect the design of the bridge. If other ele-
ments are added, such as market data (materials costs and anticipated
financial growth for the area), the definition of a data scientist may
change. That individual may need an engineering background and a
keen understanding of economics and may work only with the pri-
mary engineers on the project and not with any other company
departments.
This can mean that the firm’s marketing and sales departments
are left out in the cold. The question then is how important is that style
of analytics to those departments—arguably, it is not important at all.
In a situation like that, market analysis, competition, government
funding, infrastructure age andusage, and populationdensitymaynot be
as applicable to the in-place data scientist but may require a different
individual skill set to successfully interpret the results.
As analytics needs and organizational size increase, roles may
change, as well as the processes and the relationships involved. Larger
organizations tend to have the resources and budgets to better leverage
their data. In those cases, it becomes important to recognize the pri-
mary skills needed by a Big Data analytics team and to build the team
around core competencies. Fortunately, it is relatively easy to identify
those core competencies, because the tasks of the team can be broken
down into three capabilities.
c04 22 October 2012; 17:56:34
B U I L D I N G T H E B I G D A T A T E A M¥ 31

DON’T FORGET THE DATA
There are three primary capabilities needed in a data analytics team: (1)
locating the data, (2) normalizing the data, and (3) analyzing the data.
For the first capability, locating the data, an individual has to be
able to find relevant data from internal and external sources and work
with the IT department’s data governance team to secure access to the
data. That individual may also need to work with external businesses,
government agencies, and research firms to gain access to large data
sets, as well as understand the difference between structured and
unstructured data.
For the second capability, normalizing the data, an individual has
to prepare the raw data before they are analyzed to remove any
spurious data. This process requires technical skills as well as analytics
skills. The individual may also need to know how to combine the data
sets, load those data sets on the storage platform, and build a matrix of
fields to normalize the contents.
The third capability, analyzing the data, is perhaps the team’s most
important chore. For most organizations, the analytic process is con-
ducted by the data scientist, who accesses the data, designs algorithms,
gathers the results, and then presents the information.
These three primary chores define a data analytics team’s func-
tions. However, there are several subsets of tasks that fall under each
category, and these tasks can vary based on scope and other elements
specific to the required data analytics process.
Much like the data themselves, the team should not be static in
nature and should be able to evolve and adapt to the needs of the
business.
CHALLENGES REMAIN
Locating the right talent to analyze data is the biggest hurdle in building
a team. Such talent is in high demand, and the need for data analysts
and data scientists continues to grow at an almost exponential rate.
Finding this talent means that organizations will have to focus on
data science and hire statistical modelers and text data–mining pro-
fessionals as well as people who specialize in sentiment analysis.
c04 22 October 2012; 17:56:34
32 ⁄ B I G D A T A A N A L Y T I C S
Success with Big Data analytics requires solid data models, statistical
predictive models, and test analytic models, since these will be the core
applications needed to do Big Data.
Locating the appropriate talent takes more than just a typical IT job
placement; the skills required for a good return on investment are not
simple and are not solely technology oriented. Some organizations may
turn to consulting firms to meet the need for talent; however, many
consulting firms also have trouble finding the experts that can make Big
Data pay off.
Nevertheless, there is a silver lining to the Big Data storm cloud.
Big Data is about business as much as it is about technology, which
means that it requires a hybrid talent. This allows the pool of potential
experts to be much deeper than just the IT professional workforce. In
fact, a Big Data expert could be developed from other departments that
are not IT centered but that do have a significant need for research,
analysis, and interpretation of facts.
The potential talent pool may grow to include any staffers who
have an inherent interest in the Big Data technology platforms in play,
who have a tools background from web site development work earlier
in their careers, or who are just naturally curious, talented, and self-
taught in a quest to be better at their jobs. These are typically indivi-
duals who can understand the value of data and the ideology of how to
interpret the data.
But organizations should not hire just anyone who shows a spark
of interest in or a basic understanding of data analytics. It is important
to develop a litmus test of sorts to determine if an individual has the
appropriate skills to succeed in what may be a new career. The can-
didates should possess a foundation of five critical skills to immediately
bring value to a Big Data team:
1. Data mining
2. Data visualization
3. Data analysis
4. Data manipulation
5. Data discovery
These define what a data scientist should be able to accomplish.
c04 22 October 2012; 17:56:34
B U I L D I N G T H E B I G D A T A T E A M¥ 33
TEAMS VERSUS CULTURE
Arguably, finding and hiring talented workers with analytics skills is
the first step in establishing an advanced data analytics team. If that
is indeed the case, then the second step would be determining how to
structure the team in relation to existing IT and BI groups, as well as
determining how much autonomy to give the analytics professionals.
That process may require building a new culture of technology
professionals who also have significant business skills. Developing that
culture depends on many factors, such as making sure that the teams
are educated in the ways of the business culture in place and
emphasizing measurements and results.
Starting at the top proves to be one of the best ways to transform
an IT-centered culture into an internal business culture that thrives on
advanced data analytics technology and fact-based decision making.
Businesses that have experienced a change in senior management
often clear the path for the development of a data analytics business
culture and a data warehousing, BI, and advanced analytics program.
Instituting a change in cultural ideology is one of the most
important chores associated with leveraging analytics. Many compa-
nies have become accustomed to running operations based on gut
feelings and what has worked in the past, both of which lead to a
formulaic way of conducting business.
Nowhere has this been more evident than in major retail chains,
which usually pride themselves on consistency across locations. That
cultural perspective can prove to be the antithesis of a dynamic,
competitive business. Instituting a culture that uses the ideology of
analytics can transform business operations. For example, the business
can better serve markets by using data mining and predictive analytics
tools to automatically set plans for placing inventory into individual
retail locations. The key is putting the needed products in front of
potential customers, such as by knowing that snow shovels will not sell
in Florida and that suntan lotion sells poorly in Alaska.
Another potential way to foster an analytics business culture
within an organization is to set up a dedicated data analytics group. An
analytics group with its own director could develop an analytics
strategy and project plan, promote the use of analytics within the
c04 22 October 2012; 17:56:34
34 ⁄ B I G D A T A A N A L Y T I C S
company, train data analysts on analytics tools and concepts, and work
with the IT, BI, and data warehousing teams on deployment projects.
GAUGING SUCCESS
Success has to be measured, and measuring a team’s contribution to
the bottom line can be a difficult process. That is why it is important
to build objectives, measurements, and milestones that demonstrate
the benefits of a team focused on Big Data analytics. Developing
performance measurements is an important part of designing a busi-
ness plan. With Big Data, those metrics can be assigned to the specific
goal in mind.
For example, if an organization is looking to bring efficiency to a
warehouse, a performance metric may be measuring the amount of
empty shelf space and what the cost of that empty shelf space means to
the company. Analytics can be used to identify product movement,
sales predictions, and so forth to move product into that shelf space to
better service the needs of customers. It is a simple comparison of the
percentage of space used before the analytics process and the per-
centage of space used after the analytics team has tackled the issue.
c04 22 October 2012; 17:56:34
B U I L D I N G T H E B I G D A T A T E A M¥ 35

c04 22 October 2012; 17:56:34

C H A P T E R 5Big Data Sources
One of the biggest challenges for most organizations is finding data
sources to use as part of their analytics processes. As the name
implies, Big Data is large, but size is not the only concern. There
are several other considerations when deciding how to locate and
parse Big Data sets.
The first step is to identify usable data. While that may be obvious,
it is anything but simple. Locating the appropriate data to push through
an analytics platform can be complex and frustrating. The source must
be considered to determine whether the data set is appropriate for use.
That translates into detective work or investigative reporting.
Considerations should include the following:
j Structure of the data (structured, unstructured, semistructured,
table based, proprietary)
j Source of the data (internal, external, private, public)
j Value of the data (generic, unique, specialized)
j Quality of the data (verified, static, streaming)
j Storage of the data (remotely accessed, shared, dedicated plat-
forms, portable)
j Relationship of the data (superset, subset, correlated)
All of those elements and many others can affect the selection
process and can have a dramatic effect on how the raw data are pre-
pared (“scrubbed”) before the analytics process takes place.
c05 22 October 2012; 17:57:16
37

In the IT realm, once a data source is located, the next step is to
import the data into an appropriate platform. That process may be as
simple as copying data onto a Hadoop cluster or as complicated as
scrubbing, indexing, and importing the data into a large SQL-type
table. That importation, or gathering of the data, is only one step in a
multistep, sometimes complex process.
Once the importation (or real-time updating) has been performed,
templates and scripts can be designed to ease further data-gathering
chores. Once the process has been designed, it becomes easier to
execute in the future.
Building a Big Data set ultimately serves one strategic purpose: to
mine the data, or dig for something of value. Mining data involves a lot
more than just running algorithms against a particular data source.
Usually, the data have to be first imported into a platform that can deal
with the data in an appropriate fashion. This means the data have to be
transformed into something accessible, queryable, and relatable.
Mining starts with a mine or, in Big Data parlance, a platform. Ulti-
mately, to have any value, that platform must be populated with
usable information.
HUNTING FOR DATA
Finding data for Big Data analytics is part science, part investigative
work, and part assumption. Some of the most obvious sources for
data are electronic transactions, web site logs, and sensor infor-
mation. Any data the organization gathers while doing business are
included. The idea is to locate as many data sources as possible and
bring the data into an analytics platform. Additional data can be
gathered using network taps and data replication clients. Ideally,
the more data that can be captured, the more data there will be to
work with.
Finding the internal data is the easy part of Big Data. It gets more
complicated once data considered unrelated, external, or unstructured
are bought into the equation. With that in mind, the big question with
Big Data now is, “Where do I get the data from?” This is not easily
answered; it takes some research to separate the wheat from the chaff,
knowing that the chaff may have some value as well.
c05 22 October 2012; 17:57:16
38 ⁄ B I G D A T A A N A L Y T I C S
Setting out to build a Big Data warehouse takes a concentrated
effort to find the appropriate data. The first step is to determine what
Big Data analytics is going to be used for. For example, is the business
looking to analyze marketing trends, predict web traffic, gauge cus-
tomer satisfaction, or achieve some other lofty goal that can be
accomplished with the current technologies?
It is this knowledge that will determine where and how to gather
Big Data. Perhaps the best way to build such knowledge is to better
understand the business analytics (BA) and business intelligence (BI)
processes to determine how large-scale data sets can be used to interact
with internal data to garner actionable results.
SETTING THE GOAL
Every project usually starts out with a goal and with objectives to reach
that goal. Big Data analytics should be no different. However, defining
the goal can be a difficult process, especially when the goal is vague
and amounts to little more than something like “using the data better.”
It is imperative to define the goal before hunting for data sources, and
in many cases, proven examples of success can be the foundation for
defining a goal.
Take, for example, a retail organization. The goal for Big Data
analytics may be to increase sales, a chore that spans several business
ideologies and departments, including marketing, pricing, inventory,
advertising, and customer relations. Once there is a goal in mind, the
next step is to define the objectives, the exact means by which to reach
the goal.
For a project such as the retail example, it will be necessary
to gather information from a multitude of sources, some internal
and others external. Some of the data may have to be purchased, and
some may be available under the public domain. The key is to start
with the internal, structured data first, such as sales logs, inventory
movement, registered transactions, customer information, pricing, and
supplier interactions.
Next come the unstructured data, such as call center and support
logs, customer feedback (perhaps e-mails and other communications),
surveys, and data gathered by sensors (store traffic, parking lot usage).
c05 22 October 2012; 17:57:17
B I G D A T A S O U R C E S¥ 39

The list can include many other internally tracked elements; however,
it is critical to be aware of diminishing returns on investment with the
data sourced. In other words, some log information may not be worth
the effort to gather, because it will not affect the analytics outcome.
Finally, external data must be taken into account. There is a vast
wealth of external information that can be used to calculate everything
from customer sentiments to geopolitical issues. The data that make up
the public portion of the analytics process can come from government
entities, research companies, social networking sites, and a multitude
of other sources.
For example, a business may decide to mine Twitter, Facebook, the
U.S. census, weather information, traffic pattern information, and
news archives to build a complex source of rich data. Some controls
need to be in place, and that may even include scrubbing the data
before processing (i.e., removing spurious information or invalid
elements).
The richness of the data is the basis for predictive analytics. A
company looking to increase sales may compare population trends,
along with social sentiment, to customer feedback and satisfaction to
identify where the sales process could be improved. The data ware-
house can be used for much more after the initial processing, and real-
time data could also be integrated to identify trends as they arise.
The retail situation is only one example; there are dozens of others,
each of which may have a specific applicability to the task at hand.
BIG DATA SOURCES GROWING
Multiple sources are responsible for a growth in data that is appl-
cable to Big Data technology. Some of these sources represent entirely
new data sources, while others are a change in the resolution of the
existing data generated. Much of that growth can be attributed to
industry digitization of content.
With companies now turning to creating digital representations of
existing data and acquiring everything that is new, data growth rates
over the last few years have been nearly infinite, simply because most
of the businesses involved started from zero.
c05 22 October 2012; 17:57:17
40 ⁄ B I G D A T A A N A L Y T I C S
Many industries fall under the umbrella of new data creation and
digitization of existing data, and most are becoming appropriate
sources for Big Data resources. Those industries include the following:
j Transportation, logistics, retail, utilities, and tele-
communications. Sensor data are being generated at an
accelerating rate from fleet GPS transceivers, RFID (radio-
frequency identification) tag readers, smart meters, and cell
phones (call data records); these data are used to optimize
operations and drive operational BI to realize immediate busi-
ness opportunities.
j Health care. The health care industry is quickly moving to
electronic medical records and images, which it wants to use for
short-term public health monitoring and long-term epidemio-
logical research programs.
j Government. Many government agencies are digitizing public
records, such as census information, energy usage, budgets,
Freedom of Information Act documents, electoral data, and law
enforcement reporting.
j Entertainment media. The entertainment industry has
moved to digital recording, production, and delivery in the past
five years and is now collecting large amounts of rich content
and user viewing behaviors.
j Life sciences. Low-cost gene sequencing (less than $1,000) can
generate tens of terabytes of information that must be analyzed
to look for genetic variations and potential treatment
effectiveness.
j Video surveillance. Video surveillance is still transitioning
from closed-caption television to Internet protocol television
cameras and recording systems that organizations want to ana-
lyze for behavioral patterns (security and service enhancement).
For many businesses, the additional data can come from self-service
marketplaces, which record the use of affinity cards and track the sites
visited, and can be combined with social networks and location-based
c05 22 October 2012; 17:57:17
B I G D A T A S O U R C E S¥ 41
metadata. This creates a goldmine of actionable consumer data for
retailers, distributors, and manufacturers of consumer packaged goods.
The legal profession is adding to the multitude of data sources,
thanks to the discovery process, which is dealing more frequently with
electronic records and requiring the digitization of paper documents
for faster indexing and improved access. Today, leading e-discovery
companies are handling terabytes or even petabytes of information
that need to be retained and reanalyzed for the full course of a legal
proceeding.
Additional information and large data sets can be found on social
media sites such as Facebook, Foursquare, and Twitter. A number of
new businesses are now building Big Data environments, based on
scale-out clusters using power-efficient multicore processors that
leverage consumers’ (conscious or unconscious) nearly continuous
streams of data about themselves (e.g., likes, locations, and opinions).
Thanks to the network effect of successful sites, the total data
generated can expand at an exponential rate. Some companies have
collected and analyzed over 4 billion data points (e.g., web site cut-
and-paste operations) since information collection started, and within
a year the process has expanded to 20 billion data points gathered.
DIVING DEEPER INTO BIG DATA SOURCES
A change in resolution is further driving the expansion of Big Data.
Here additional data points are gathered from existing systems or
with the installation of new sensors that deliver more pieces of
information. Some examples of increased resolution can be found
in the following areas:
j Financial transactions. Thanks to the consolidation of global
trading environments and the increased use of programmed
trading, the volume of transactions being collected and analy-
zed is doubling or tripling. Transaction volumes also fluctuate
much faster, much wider, and much more unpredictably.
Competition among firms is creating more data, simply because
sampling for trading decisions is occurring more frequently and
at faster intervals.
c05 22 October 2012; 17:57:17
42 ⁄ B I G D A T A A N A L Y T I C S

j Smart instrumentation. The use of smart meters in energy
grid systems, which shifts meter readings from monthly to every
15 minutes, can translate into a multithousandfold increase in
data generated. Smart meter technology extends beyond just
power usage and can measure heating, cooling, and other loads,
which can be used as an indicator of household size at any
given moment.
j Mobile telephony. With the advances in smartphones and
connected PDAs, the primary data generated from these devices
have grown beyond caller, receiver, and call length. Additional
data are now being harvested at exponential rates, including
elements such as geographic location, text messages, browsing
history, and (thanks to the addition of accelerometers) even
motions, as well as social network posts and application use.
A WEALTH OF PUBLIC INFORMATION
For those looking to sample what is available for Big Data analytics,
a vast amount of data exists on the Web; some of it is free, and some
of it is available for a fee. Much of it is simply there for the taking.
If your goal is to start gathering data, it is pretty hard to beat many of
the tools that are readily available on the market. For those looking for
point-and-click simplicity, Extractiv (http://www.extractiv.com) and
Mozenda (http://www.mozenda.com) offer the ability to acquire data
from multiple sources and to search the Web for information.
Another candidate for processing data on the Web is Google Refine
(http://code.google.com/p/google-refine), a tool set that can work
with messy data, cleaning them up and then transforming them into
different formats for analytics. 80Legs (http://www.80legs.com) spe-
cializes in gathering data from social networking sites as well as retail
and business directories.
The tools just mentioned are excellent examples for mining data
from the Web to transform them into a Big Data analytics platform.
However, gathering data is only the first of many steps. To garner
value from the data, they must be analyzed and, better yet, visualized.
Tools such as Grep (http://www.linfo.org/grep.html), Turk (http://
www.mturk.com), and BigSheets (http://www-01.ibm.com/software/
c05 22 October 2012; 17:57:17
B I G D A T A S O U R C E S¥ 43
ebusiness/jstart/bigsheets) offer the ability to analyze data. For visu-
alization, analysts can turn to tools such as Tableau Public (http://
www.tableausoftware.com), OpenHeatMap (http://www.openheatmap
.com), and Gephi (http://www.gephi.org).
Beyond the use of discovery tools, Big Data can be found through
services and sites such as CrunchBase, the U.S. census, InfoChimps,
Kaggle, Freebase, and Timetric. Many other services offer data sets
directly for integration into Big Data processing.
The prices of some of these services are rather reasonable. For
example, you can download amillionWeb pages through 80Legs for less
than three dollars. Some of the top data sets can be found on commercial
sites, yet for free. An example is the Common Crawl Corpus, which has
crawl data from about five billionWeb pages and is available in the ARC
file format from Amazon S3. The Google Books Ngrams is another data
set that Amazon S3 makes available for free. The file is in a Hadoop-
friendly format. For those who may be wondering, n-grams are fixed-
size sets of items. In this case, the items are words extracted from the
Google Books corpus. The n specifies the number of elements in the set,
so a five-gram contains five words or characters.
Many more data sets are available from Amazon S3, and it is
definitely worth visiting http://aws.amazon.com/publicdatasets/ to
track these down. Another site to visit for a listing of public data sets is
http://www.quora.com/Data/Where-can-I-get-large-datasets-open-to-
the-public, a treasure trove of links to data sets and information related
to those data sets.
GETTING STARTED WITH BIG DATA ACQUISITION
Barriers to Big Data adoption are generally cultural rather than tech-
nological. In particular, many organizations fail to implement Big Data
programs because they are unable to appreciate how data analytics can
improve their core business. One the most common triggers for Big
Data development is a data explosion that makes existing data sets
very large and increasingly difficult to manage with conventional
database management tools.
As these data sets grow in size—typically ranging from several
terabytes to multiple petabytes—businesses face the challenge of
c05 22 October 2012; 17:57:17
44 ⁄ B I G D A T A A N A L Y T I C S

capturing, managing, and analyzing the data in an acceptable time
frame. Getting started involves several steps, starting with training.
Training is a prerequisite for understanding the paradigm shift that Big
Data offers. Without that insider knowledge, it becomes difficult to
explain and communicate the value of data, especially when the data
are public in nature. Next on the list is the integration of development
and operations teams (known as DevOps), the people most likely to
deal with the burdens of storing and transforming the data into
something usable.
Much of the process of moving forward will lie with the business
executives and decision makers, who will also need to be brought up
to speed on the value of Big Data. The advantages must be explained in
a fashion that makes sense to the business operations, which in turn
means that IT pros are going to have to do some legwork. To get
started, it proves helpful to pursue a few ideologies:
j Identify a problem that business leaders can understand and
relate to and that commands their attention.
j Do not focus exclusively on the technical data management
challenge. Be sure to allocate resources to understand the uses
for the data within the business.
j Define the questions that must be answered to meet the busi-
ness objective, and only then focus on discovering the
necessary data.
j Understand the tools available to merge the data and the busi-
ness process so that the result of the data analysis is more
actionable.
j Build a scalable infrastructure that can handle growth of the
data. Good analysis requires enough computing power to pull in
and analyze data. Many people get discouraged because when
they start the analytic process, it is slow and laborious.
j Identify technologies that you can trust. A dizzying variety of
open source Big Data software technologies are available, and
many are likely to disappear within a few years. Find one that
has professional vendor support, or be prepared to take on
permanent maintenance of the technology as well as the
c05 22 October 2012; 17:57:17
B I G D A T A S O U R C E S¥ 45
solution in the long run. Hadoop seems to be attracting a lot of
mainstream vendor support.
j Choose a technology that fits the problem. Hadoop is best for
large but relatively simple data set filtering, converting, sorting,
and analysis. It is also good for sifting through large volumes of
text. It is not really useful for ongoing persistent data manage-
ment, especially if structural consistency and transactional
integrity are required.
j Be aware of changing data formats and changing data needs.
For instance, a common problem faced by organizations seeking
to use BI solutions to manage marketing campaigns is that those
campaigns can be very specifically focused, requiring an analysis
of data structures that may be in play for only a month or two.
Using conventional relational database management system
techniques, it can take several weeks for database adminis-
trators to get a data warehouse ready to accept the changed
data, by which time the campaign is nearly over. A MapReduce
solution, such as one built on a Hadoop framework, can reduce
those weeks to a day or two. Thus it is not just volume but also
variety that can drive Big Data adoption.
ONGOING GROWTH, NO END IN SIGHT
Data creation is occurring at a record rate. In fact, the research firm
IDC’s Digital Universe Study predicts that between 2009 and 2020,
digital data will grow 44-fold, to 35 zettabytes per year. It is also
important to recognize that much of this data explosion is the result of
an explosion in devices located at the periphery of the network,
including embedded sensors, smartphones, and tablet computers. All
of these data create new opportunities for data analytics in human
genomics, health care, oil and gas, search, surveillance, finance, and
many other areas.
c05 22 October 2012; 17:57:17
46 ⁄ B I G D A T A A N A L Y T I C S
C H A P T E R 6The Nuts andBolts of Big Data
Assembling a Big Data solution is sort of like putting together an
erector set. There are various pieces and elements thatmust be put
together in the proper fashion to make sure everything works
adequately, and there are almost endless combinations of configura-
tions that can be made with the components at hand.
With Big Data, the components include platform pieces, servers,
virtualization solutions, storage arrays, applications, sensors, and rout-
ing equipment. The right pieces must be picked and integrated in a
fashion that offers the best performance, high efficiency, affordability,
ease of management and use, and scalability.
THE STORAGE DILEMMA
Big Data consists of data sets that are too large to be acquired, handled,
analyzed, or stored in an appropriate time frame using the traditional
infrastructures. Big is a term relative to the size of the organization
and, more important, to the scope of the IT infrastructure that’s in
place. The scale of Big Data directly affects the storage platform that
must be put in place, and those deploying storage solutions have to
understand that Big Data uses storage resources differently than the
typical enterprise application does.
c06 22 October 2012; 17:58:3
47
These factors can make provisioning storage a complex endeavor,
especiallywhen one considers that Big Data also includes analysis; this is
driven by the expectation that there will be value in all of the infor-
mation a business is accumulating and a way to draw that value out.
Originally driven by the concept that storage capacity is inex-
pensive and constantly dropping in price, businesses have been
compelled to save more data, with the hope that business intelligence
(BI) can leverage the mountains of new data created every day.
Organizations are also saving data that have already been analyzed,
which can potentially be used for marking trends in relation to future
data collections.
Aside from the ability to store more data than ever before, busi-
nesses also have access to more types of data. These data sources include
Internet transactions, social networking activity, automated sensors,
mobile devices, scientific instrumentation, voice over Internet protocol,
and video elements. In addition to creating static data points, transac-
tions can create a certain velocity to this data growth. For example, the
extraordinary growth of social media is generating new transactions
and records. But the availability of ever-expanding data sets doesn’t
guarantee success in the search for business value.
As data sets continue to growwith both structured and unstructured
data and data analysis becomes more diverse, traditional enterprise
storage system designs are becoming less able to meet the needs of Big
Data. This situation has driven storage vendors to design new storage
platforms that incorporate block- and file-based systems to meet the
needs of Big Data and associated analytics.
Meeting the challenges posed by Big Data means focusing on some
key storage ideologies and understanding how those storage design
elements interact with Big Data demands, including the following:
j Capacity. Big Data can mean petabytes of data. Big Data stor-
age systems must therefore be able to quickly and easily change
scale to meet the growth of data collections. These storage
systems will need to add capacity in modules or arrays that
are transparent to users, without taking systems down. Most
Big Data environments are turning to scale-out storage (the
ability to increase storage performance as capacity increases)
c06 22 October 2012; 17:58:3
48 ⁄ B I G D A T A A N A L Y T I C S
technologies to meet that criterion. The clustered architecture
of scale-out storage solutions features nodes of storage capacity
with embedded processing power and connectivity that can
grow seamlessly, avoiding the silos of storage that traditional
systems can create.
Big Data also means many large and small files. Managing
the accumulation of metadata for file systems with multiple large
and small files can reduce scalability and impact performance,
a situation that can be a problem for traditional network-attached
storage systems. Object-based storage architectures, in contrast,
can allow Big Data storage systems to expand file counts into the
billions without suffering the overhead problems that traditional
file systems encounter. Object-based storage systems can also
scale geographically, enabling large infrastructures to be spread
across multiple locations.
j Security. Many types of data carry security standards that are
driven by compliance laws and regulations. The data may be
financial, medical, or government intelligence and may be part
of an analytics set yet still be protected. While those data may
not be different from what current IT managers must accom-
modate, Big Data analytics may need to cross-reference data
that have not been commingled in the past, and this can create
some new security considerations. In turn, IT managers should
consider the security footing of the data stored in an array used
for Big Data analytics and the people who will access the data.
j Latency. In many cases, Big Data employs a real-time com-
ponent, especially in use scenarios involving Web transactions
or financial transactions. An example is tailoring Web adver-
tising to each user’s browsing history, which demands real-time
analytics to function. Storage systems must be able to grow
rapidly and still maintain performance. Latency produces “stale”
data. That is another case in which scale-out architectures solve
problems. The technology enables the cluster of storage nodes to
increase in processing power and connectivity as they grow in
capacity. Object-based storage systems can parallel data streams,
further improving output.
c06 22 October 2012; 17:58:3
T H E N U T S A N D B O L T S O F B I G D A T A¥ 49
Most Big Data environments need to provide high input-
output operations per second (IOPS) performance, especially
those used in high-performance computing environments. Vir-
tualization of server resources, which is a common methodology
used to expand compute resources without the purchase of
new hardware, drives high IOPS requirements, just as it does in
traditional IT environments. Those high IOPS performance
requirements can be met with solid-state storage devices, which
can be implemented in many different formats, including simple
server-based cache to all-flash-based scalable storage systems.
j Access. As businesses get a better understanding of the potential
of Big Data analysis, the need to compare different data sets
increases, and with it, more people are bought into the data
sharing loop. The quest to create business value drives businesses
to look at more ways to cross-reference different data objects from
various platforms. Storage infrastructures that include global file
systems can address this issue, since they allow multiple users on
multiple hosts to access files from many different back-end stor-
age systems in multiple locations.
j Flexibility. Big Data storage infrastructures can grow very large,
and that should be considered as part of the design challenge,
dictating that care should be taken in the design and allowing the
storage infrastructure to growand evolve alongwith the analytics
component of the mission. Big Data storage infrastructures also
need to account for data migration challenges, at least during the
start-up phase. Ideally, data migration will become something
that is no longer needed in the world of Big Data, simply because
the data are distributed in multiple locations.
j Persistence. Big Data applications often involve regulatory
compliance requirements, which dictate that data must be saved
for years or decades. Examples are medical information, which is
often saved for the life of the patient, and financial information,
which is typically saved for seven years. However, Big Data users
are often saving data longer because they are part of a historical
record or are used for time-based analysis. The requirement for
c06 22 October 2012; 17:58:3
50 ⁄ B I G D A T A A N A L Y T I C S

longevity means that storage manufacturers need to include
ongoing integrity checks and other long-term reliability features
as well as address the need for data-in-place upgrades.
j Cost. Big Data can be expensive. Given the scale at which many
organizations are operating their Big Data environments, cost
containment is imperative. That means more efficiency as well
as less expensive components. Storage deduplication has
already entered the primary storage market and, depending on
the data types involved, could bring some value for Big Data
storage systems. The ability to reduce capacity consumption
even by a few percentage points provides a significant return
on investment as data sets grow. Other Big Data storage tech-
nologies that can improve efficiencies are thin provisioning,
snapshots, and cloning.
j Thin provisioning operates by allocating disk storage space in
a flexible manner among multiple users based on the mini-
mum space required by each user at any given time.
j Snapshots streamline access to stored data and can speed up the
process of data recovery. There are two main types of storage
snapshot: copy-on-write (or low-capacity) snapshot and split-
mirror snapshot. Utilities are available that can automatically
generate either type.
j Disk cloning is copying the contents of a computer’s hard
drive. The contents are typically saved as a disk image file and
transferred to a storage medium, which could be another
computer’s hard drive or removable media such as a DVD or
a USB drive.
Data storage systems have evolved to include an archive
component, which is important for organizations that are dealing
with historical trends or long-term retention requirements. From
a capacity and dollar standpoint, tape is still the most economical
storage medium. Today, systems that support multiterabyte car-
tridges are becoming the de facto standard in many of these
environments.
c06 22 October 2012; 17:58:3
T H E N U T S A N D B O L T S O F B I G D A T A¥ 51
The biggest effect on cost containment can be traced to
the use of commodity hardware. This is a good thing, since the
majority of Big Data infrastructures won’t be able to rely on
the big iron enterprises of the past. Most of the first and
largest Big Data users have built their own “white-box” systems
on-site, which leverage a commodity-oriented, cost-saving
strategy.
These examples and others have driven the trend of cost
containment, and more storage products are arriving on the
market that are software based and can be installed on existing
systems or on common, off-the-shelf hardware. In addition,
many of the same vendors are selling their software technologies
as commodity appliances or partnering with hardware manu-
facturers to produce similar offerings. That all adds up to cost-
saving strategies, which brings Big Data into the reach of smaller
and smaller businesses.
j Application awareness. Initially, Big Data implementa-
tions were designed around application-specific infrastructures,
such as custom systems developed for government projects or
the white-box systems engineered by large Internet service
companies. Application awareness is becoming common in
mainstream storage systems and should improve efficiency or
performance, which fits right into the needs of a Big Data
environment.
j Small and medium business. The value of Big Data and the
associated analytics is trickling down to smaller organizations,
which creates another challenge for those building Big Data
storage infrastructures: creating smaller initial implementations
that can scale yet fit into the budgets of smaller organizations.
BUILDING A PLATFORM
Like any application platform, a Big Data application platform must
support all of the functionality required for any application plat-
form, including elements such as scalability, security, availability, and
continuity.
c06 22 October 2012; 17:58:3
52 ⁄ B I G D A T A A N A L Y T I C S
Yet Big Data Application platforms are unique; they need to be
able to handle massive amounts of data across multiple data stores and
initiate concurrent processing to save time. This means that a Big Data
platform should include built-in support for technologies such as
MapReduce, integration with external Not only SQL (NoSQL) data-
bases, parallel processing capabilities, and distributed data services. It
should also make use of the new integration targets, at least from a
development perspective.
Consequently, there are specific characteristics and features that a
Big Data platform should offer to work effectively with Big Data
analytics processes:
j Support for batch and real-time analytics. Most of the
existing platforms for processing data were designed for han-
dling transactional Web applications and have little support
for business analytics applications. That situation has driven
Hadoop to become the de facto standard for handling batch
processing. However, real-time analytics is altogether different,
requiring something more than Hadoop can offer. An event-
processing framework needs to be in place as well. Fortunately,
several technologies and processing alternatives exist on the
market that can bring real-time analytics into Big Data plat-
forms, and many major vendors, such as Oracle, HP, and IBM,
are offering the hardware and software to bring real-time pro-
cessing to the forefront. However, for the smaller business that
may not be a viable option because of the cost. For now, real-
time processing remains a function that is provided as a service
via the cloud for smaller businesses.
j Alternative approaches. Transforming Big Data application
development into something more mainstream may be the best
way to leverage what is offered by Big Data. This means creating
a built-in stack that integrates with Big Data databases from
the NoSQL world and creating MapReduce frameworks such as
Hadoop and distributed processing. Development should account
for the existing transaction-processing and event-processing
semantics that come with the handling of the real-time analytics
that fit into the Big Data world.
c06 22 October 2012; 17:58:3
T H E N U T S A N D B O L T S O F B I G D A T A¥ 53
Creating Big Data applications is very different from writing
a typical “CRUD application” (create, retrieve, update, delete)
for a centralized relational database. The primary difference is
with the design of the data domain model, as well as the API
and Query semantics that will be used to access and process that
data. Mapping is an effective approach in Big Data, hence the
success of MapReduce, in which there is an impedance mis-
match between different data models and sources. An appro-
priate example is the use of object and relational mapping tools
like Hibernate for building a bridge between the impedance
mismatches.
j Available Big Data mapping tools. Batch-processing projects
are being serviced with frameworks such as Hive, which provide
an SQL-like facade for handling complex batch processing with
Hadoop. However, other tools are starting to show promise.
An example is JPA, which provides a more standardized JEE
abstraction that fits into real-time Big Data applications. The
Google app Engine uses Data Nucleus along with Bigtable to
achieve the same goal, while GigaSpaces uses OpenJPA’s JPA
abstraction combined with an in-memory data grid. Red Hat
takes a different approach and leverages Hibernate object-grid
mapping to map Big Data.
j Big Data abstraction tools. There are several choices available
to abstract data, ranging from open source tools to commercial
distributions of specialized products. One to pay attention to is
Spring Data from SpringSource, which is a high-level abstrac-
tion tool that offers the ability to map different data stores of all
kinds into one common abstraction through annotation and a
plug-in approach.
Of course, one of the primary capabilities offered by abstrac-
tion tools is the ability to normalize and interpret the data into a
uniform structure, which can be further worked with. The key
here is to make sure that whatever abstraction technology is
employed deals with current and future data sets efficiently.
j Business logic. A critical component of the Big Data analytics
process is logic, especially business logic, which is responsible for
c06 22 October 2012; 17:58:3
54 ⁄ B I G D A T A A N A L Y T I C S
processing the data. Currently, MapReduce reigns supreme in
the realm of Big Data business logic. MapReduce was designed
to handle the processing of massive amounts of data through
moving the processing logic to the data and distributing the logic
in parallel to all nodes. Another factor that adds to the appeal
of MapReduce is that developing parallel processing code is
very complex.
When designing a custom Big Data application platform, it is
critical to make MapReduce and parallel execution simple. That
can be accomplished by mapping the semantics into existing
programmingmodels. An example is to extend an existingmodel,
such as SessionBean, to support the needed semantics. Thismakes
parallel processing look like a standard invocation of single-job
execution.
j Moving away from SQL. SQL is a great query language.
However, it is limited, at least in the realm of Big Data. The
problem lies in the fact that SQL relies on a schema to work
properly, and Big Data, especially when it is unstructured, does
not work well with schema-based queries. It is the dynamic data
structure of Big Data that confounds the SQL schema-based
processes. Here Big Data platforms must be able to support
schema-less semantics, which in turn means that the data
mapping layer would need to be extended to support document
semantics. Examples are MongoDB, CouchBase, Cassandra, and
the GigaSpaces document API. The key here is to make sure that
Big Data application platforms support more relaxed versions
of those semantics, with a focus on providing flexibility in
consistency, scalability, and performance.
j In-memory processing. If the goal is to deliver the best per-
formance and reduce latency, then one must consider using
RAM-based devices and perform processing in-memory. How-
ever, for that to work effectively, Big Data platforms need to
provide a seamless integration between RAM and disk-based
devices in which data that are written in RAM would be
synched into the disk asynchronously. Also, the platforms need
to provide common abstractions that allow users the same data
c06 22 October 2012; 17:58:3
T H E N U T S A N D B O L T S O F B I G D A T A¥ 55
access API for both devices and thus make it easier to choose the
right tool for the job without changing the application code.
j Built-in support for event-driven data distribution. Big
Data applications (and platforms) must also be able to work
with event-driven processes. With Big Data, this means there
must be data awareness incorporated, which makes it easy to
route messages based on data affinity and the content of the
message. There also have to be controls that allow the creation
of fine-grained semantics for triggering events based on data
operations (such as add, delete, and update) and content, as
with complex event processing.
j Support for public, private, and hybrid clouds. Big Data
applications consume large amounts of computer and storage
resources. This has led to the use of the cloud and its elastic
capabilities for running Big Data applications, which in turn can
offer a more economical approach to processing Big Data jobs.
To take advantage of those economics, Big Data application
platforms must include built-in support for public, private, and
hybrid clouds that will include seamless transitions between
the various cloud platforms through integration with the
available frameworks. Examples abound, such as JClouds and
Cloud Bursting, which provides a hybrid model for using cloud
resources as spare capacity to handle load.
j Consistent management. The typical Big Data application
stack incorporates several layers, including the database itself,
the Web tier, the processing tier, caching layer, the data syn-
chronization and distribution layer, and reporting tools. Amajor
disadvantage for those managing Big Data applications is that
each of those layers comes with different management, provi-
sioning, monitoring, and troubleshooting tools. Add to that
the inherent complexity of Big Data applications, and effec-
tive management, along with the associated maintenance,
becomes difficult.
With that in mind, it becomes critical to choose a Big Data
application platform that integrates the management stack with
the application stack. An integrated management capability is
c06 22 October 2012; 17:58:4
56 ⁄ B I G D A T A A N A L Y T I C S
one of the best productivity elements that can be incorporated
into a Big Data platform.
Building a Big Data platform is no easy chore, especially when one
considers that there may be a multitude of right ways and wrong ways
to do it. This is further complicated by the plethora of tools, technol-
ogies, and methodologies available. However, there is a bright side that
stresses flexibility, and since Big Data is constantly evolving, flexibility
will rule in building a custom platform or choosing one off the shelf.
BRINGING STRUCTURE TO UNSTRUCTURED DATA
In its native format, a large pile of unstructured data has little value. It
is burdensome in the typical enterprise, especially one that has not
adopted Big Data practices to extract the value.
However, extracting value can be akin to finding a needle in a
haystack, and if that haystack is spread across several farms and the
needle is in pieces, it becomes even more difficult. One of the primary
jobs of Big Data analytics is to piece that needle back together and
organize the haystack into a single entity to speed up the search. That
can be a tall order with unstructured data, a type of data that is growing
in volume and size as well as complexity.
Unstructured (or uncatalogued) data can take many forms, such
as historical photograph collections, audio clips, research notes,
genealogy materials, and other riches hidden in various data libraries.
The Big Data movement has driven methodologies to create dynamic
and meaningful links among these currently unstructured informa-
tion sources.
For the most part, that has resulted in the creation of metadata and
methods to bring structure to unstructured data. Currently, two domi-
nant technical and structural approaches have emerged: (1) a reliance
on search technologies, and (2) a trend toward automated data cate-
gorization. Many data categorization techniques are being applied
across the landscape, including taxonomies, semantics, natural lan-
guage recognition, auto-categorization, “what’s related” functionality,
data visualization, and personalization. The idea is to provide the
information that is needed to process an analytics function.
c06 22 October 2012; 17:58:4
T H E N U T S A N D B O L T S O F B I G D A T A¥ 57
The importance of integrating structured and loosely unstructured
data cannot be overstated in the world of Big Data analytics. There are a
few enabling technical strategies that make it possible to sort the wheat
from the chaff. For instance, there is SQL-NoSQL Integration. Those
using MapReduce and other schemaless frameworks have been strug-
gling with structural data and analytics coming from the relational
database management system (RDBMS) side. However, the integration
of the relational and nonrelational paradigms provides the most pow-
erful analytics by bringing together the best of both worlds.
There are several technologies that enable this integration; some of
them take advantage of the processing power of MapReduce frame-
works like Hadoop to perform data transformation in place, rather than
doing it in a separatemiddle tier. Some tools combine this capabilitywith
in-place transformation at the target database as well, taking advant-
age of the computing capabilities of engineered machines and using
change data capture to synchronize, source, and target, again without
the overhead of a middle tier. In both cases, the overarching principle is
real-time data integration, in which reflecting data change instantly in a
data warehouse—whether originating from a MapReduce job or from
a transactional system—and create downstream analytics that have an
accurate, timely view of reality. Others are turning to linked data and
semantics, where data sets are created using linking methodologies that
focus on the semantics of the data.
This fits well into the broader notion of pointing at external sources
from within a data set, which has been around for quite a long time.
That ability to point to unstructured data (whether residing in the file
system or some external source) merely becomes an extension of the
given capabilities, in which the ability to store and process XML and
XQuery natively within an RDBMS enables the combination of different
degrees of structure while searching and analyzing the underlying data.
Newer semantics technologies can take this further by providing a
set of formalized XML-based standards for storage, querying, and
manipulation of data. Since these technologies have been focused on
the Web, many businesses have not associated the process with Big
Data solutions.
Most NoSQL technologies fall into the categories of key value
stores, graph, or document databases; the semantic resource description
c06 22 October 2012; 17:58:4
58 ⁄ B I G D A T A A N A L Y T I C S

framework (RDF) triple store creates an alternative. It is not relational
in the traditional sense, but it still maintains relationships between
data elements, including external ones, and does so in a flexible,
extensible fashion.
A record in an RDF store is composed of a triple, consisting of
subject, predicate, and object. That does not impose a relational schema
on the data, which supports the addition of new elements without
structural modifications to the store. In addition, the underlying system
can resolve references by inferring new triples from the existing records
using a rules set. This is a powerful alternative to joining relational
tables to resolve references in a typical RDBMS, while also offering a
more expressive way to model data than a key value store.
One of the most powerful aspects of semantic technology comes
from the world of linguistics and natural language processing, also
known as entity extraction. This is a powerful mechanism to extract
information from unstructured data and combine it with transactional
data, enabling deep analytics by bringing these worlds closer together.
Another method that brings structure to the unstructured is the text
analytics tool, which is improving daily as scientists come up with new
ways of making algorithms understand written text more accurately.
Today’s algorithms can detect names of people, organizations, and
locations within seconds simply by analyzing the context in which
words are used. The trend for this tool is to move toward recognition of
further useful entities, such as product names, brands, events, and skills.
Entity relation extraction is another important tool, in which a
relation that consistently connects two entities in many documents is
important information in science and enterprise alike. Entity relation
extraction detects new knowledge in Big Data. Other unstructured data
tools are detecting sentiment in social data, integrating multiple lan-
guages, and applying text analytics to audio and video transcripts. The
number of videos is growing at a constant rate, and transcripts are even
more unstructured than written text because there is no punctuation.
PROCESSING POWER
Analyzing Big Data can take massive amounts of processing power.
There is a simple relationship between data analytics and processing
c06 22 October 2012; 17:58:4
T H E N U T S A N D B O L T S O F B I G D A T A¥ 59

power: the larger the data set and the faster that results are needed, the
more processing power it takes. However, processing Big Data ana-
lytics is not a simple matter of throwing the latest and fastest processor
at the problem; it is more about the ideology behind grid-computing
technologies.
Big Data involves more than just distributed processing technolo-
gies, like Hadoop. It is also about faster processors, wider bandwidth
communications, and larger and cheaper storage to achieve the goal of
making the data consumable. That in turn drives the idea of data
visualization and interface technologies, which make the results of
analysis consumable by humans, and that is where the raw processing
power comes to bear for analytics.
Intuitiveness comes from proper analysis, and proper analysis
requires the appropriate horsepower and infrastructure to mine an
appropriate data set from huge piles of data. To that end, distributed
processing platforms such as Hadoop and MapReduce are gaining
favor over big iron in the realm of Big Data analytics.
Perhaps the simplest argument for pursuing a distributed infra-
structure is the flexibility of scale, in which more commodity hardware
can just be thrown at a particular analysis project to increase perfor-
mance and speed results. That distributed ideology plays well into grid
processing and cloud-based services, which can be employed as needed
to process data sets.
The primary thing to remember about building a processing plat-
form for Big Data is how processing can scale. For example, many
businesses start off small, with a few commodity PCs running a Hadoop-
based platform, but as the amount of data and the available sources grow
exponentially, the ability to process the data falls exponentially,
meaning that designsmust incorporate a look-aheadmethodology. That
is where IT professionals will need to consider available, future tech-
nologies to scale processing to their needs.
Cloud-based solutions that offer elastic-type services are a decent
way to future-proof a Big Data analytics platform, simply because of
the ability of a cloud service to instantly scale to the loads placed
upon it.
There is no simple answer to how to process Big Data with the
technology choices available today. Nevertheless, major vendors are
c06 22 October 2012; 17:58:4
60 ⁄ B I G D A T A A N A L Y T I C S

looking to make the choices easier by providing canned solutions that
are based on appliance models, while others are building complete
cloud-based Big Data solutions to meet the elastic needs of small and
medium businesses looking to leverage Big Data.
CHOOSING AMONG IN-HOUSE, OUTSOURCED,OR HYBRID APPROACHES
The world of Big Data is filled with choices—so many that most IT
professionals can become overwhelmed with options, technologies,
and platforms. It is almost at the point at which Big Data analytics is
required to choose among the various Big Data ideologies, platforms,
and tools.
However, the question remains of where to start with Big Data.
The answer can be found in how Big Data systems evolve or grow. In
the past, working with Big Data always meant working on the scale of
a dedicated data center. However, commodity hardware using plat-
forms like Hadoop has changed the dynamic, decreasing storage prices,
and open source applications have further lowered the initial cost of
entry. These new dynamics allow smaller businesses to experiment
with Big Data and then expand the platforms as needed as successes
are built.
Once a pilot project has been constructed using open source soft-
ware with commodity hardware and storage devices, IT managers can
then measure how well the pilot platform meets their needs. Only
after the processing needs and volume of data increase can an IT
manager make a decision on where to head with a Big Data analytics
platform, developing one in-house or turning to the cloud.
c06 22 October 2012; 17:58:4
T H E N U T S A N D B O L T S O F B I G D A T A¥ 61

c06 22 October 2012; 17:58:4

C H A P T E R 7Security,Compliance,Auditing, andProtection
The sheer size of a Big Data repository brings with it a major
security challenge, generating the age-old question presented
to IT: How can the data be protected? However, that is a trick
question—the answer has many caveats, which dictate how security
must be imagined as well as deployed. Proper security entails more
than just keeping the bad guys out; it also means backing up data and
protecting data from corruption.
The first caveat is access. Data can be easily protected, but only if
you eliminate access to the data. That’s not a pragmatic solution, to say
the least. The key is to control access, but even then, knowing the who,
what, when, and where of data access is only a start.
The second caveat is availability: controlling where the data are
stored and how the data are distributed. The more control you have,
the better you are positioned to protect the data.
The third caveat is performance. Higher levels of encryption,
complex security methodologies, and additional security layers can all
c07 22 October 2012; 17:58:55
63
improve security. However, these security techniques all carry a pro-
cessing burden that can severely affect performance.
The fourth caveat is liability. Accessible data carry with them
liability, such as the sensitivity of the data, the legal requirements con-
nected to the data, privacy issues, and intellectual property concerns.
Adequate security in the Big Data realm becomes a strategic bal-
ancing act among these caveats along with any additional issues the
caveats create. Nonetheless, effective security is an obtainable, if not
perfect, goal. With planning, logic, and observation, security becomes
manageable and omnipresent, effectively protecting data while still
offering access to authorized users and systems.
PRAGMATIC STEPS TO SECURING BIG DATA
Securing the massive amounts of data that are inundating organiza-
tions can be addressed in several ways. A starting point is to basically
get rid of data that are no longer needed. If you do not need certain
information, it should be destroyed, because it represents a risk to the
organization. That risk grows every day for as long as the information
is kept. Of course, there are situations in which information cannot
legally be destroyed; in that case, the information should be securely
archived by an offline method.
The real challenge may be determining whether the data are
needed—a difficult task in the world of Big Data, where value can be
found in unexpected places. For example, getting rid of activity logs
may be a smart move from a security standpoint. After all, those
seeking to compromise networks may start by analyzing activity so
they can come up with a way to monitor and intercept traffic to break
into a network. In a sense, those logs present a serious risk to an
organization, and to prevent the logs from being exposed, the best
method may be to delete them after their usefulness ends.
However, those logs could be used to determine scale, use, and
efficiency of large data systems, an analytical process that falls right
under the umbrella of Big Data analytics. Here a catch-22 is created:
Logs are a risk, but analyzing those logs properly can mitigate risks as
well. Should you keep or dispose of the data in these cases?
c07 22 October 2012; 17:58:55
64 ⁄ B I G D A T A A N A L Y T I C S

There is no easy answer to that dilemma, and it becomes a case of
choosing the lesser of two evils. If the data have intrinsic value for
analytics, they must be kept, but that does not mean they need to be
kept on a system that is connected to the Internet or other systems.
The data can be archived, retrieved for processing, and then returned
to the archive.
CLASSIFYING DATA
Protecting data becomes much easier if the data are classified—that is,
the data should be divided into appropriate groupings for management
purposes. A classification system does not have to be very sophisticated
or complicated to enable the security process, and it can be limited to
a few different groups or categories to keep things simple for proces-
sing and monitoring.
With data classification in mind, it is essential to realize that all data
are not created equal. For example, Internal e-mails between two
colleagues should not be secured or treated the same way as financial
reports, human resources (HR)information, or customer data.
Understanding the classifications and the value of the data sets is
not a one-task job; the life-cycle management of data may need to be
shared by several departments or teams in an enterprise. For example,
you may want to divide the responsibilities among technical, security,
and business organizations. Although it may sound complex, it really
isn’t all that hard to educate the various corporate shareholders to
understand the value of data and where their responsibilities lie.
Classification can become a powerful tool for determining the sen-
sitivity of data. A simple approachmay just include classifications such as
financial, HR, sales, inventory, and communications, each of which is
self-explanatory and offers insight into the sensitivity of the data.
Once organizations better understand their data, they can take
important steps to segregate the information, which will make the
deployment of security measures like encryption and monitoring more
manageable. Themore data are placed into silos at higher levels, the easier
it becomes to protect and control them. Smaller sample sizes are easier to
protect and can be monitored separately for specific necessary controls.
c07 22 October 2012; 17:58:55
S E C U R I T Y , C O M P L I A N C E , A U D I T I N G , A N D P R O T E C T I O N¥ 65
PROTECTING BIG DATA ANALYTICS
It is sad to report that protecting data is an often forgotten inclination
in the data center, an afterthought that falls behind current needs. The
launch of Big Data initiatives is no exception in the data center, and
protection is too often an afterthought. Big Data offers more of a
challenge than most other data center technologies, making it the
perfect storm for a data protection disaster.
The real cause of concern is the fact that Big Data contains all of the
things you don’t want to see when you are trying to protect data. Big
Data can contain very unique sample sets—for example, data from
devices that monitor physical elements (e.g., traffic, movement, soil
pH, rain, wind) on a frequent schedule, surveillance cameras, or any
other type of data that are accumulated frequently and in real time. All
of the data are unique to the moment, and if they are lost, they are
impossible to recreate.
That uniqueness also means you cannot leverage time-saving
backup preparation and security technologies, such as deduplication;
this greatly increases the capacity requirements for backup subsystems,
slows down security scanning, makes it harder to detect data corrup-
tion, and complicates archiving.
There is also the issue of the large size and number of files often
found in Big Data analytic environments. In order for a backup
application and associated appliances or hardware to churn through a
large number of files, bandwidth to the backup systems and/or the
backup appliance must be large, and the receiving devices must be able
to ingest data at the rate that the data can be delivered, which means
that significant CPU processing power is necessary to churn through
billions of files.
There is more to backup than just processing files. Big Data nor-
mally includes a database component, which cannot be overlooked.
Analytic information is often processed into an Oracle, NoSQL, or
Hadoop environment of some type, so real-time (or live) protection of
that environment may be required. A database component shifts the
backup ideology from a massive number of small files to be backed up
to a small number of massive files to be backed up. That changes the
dynamics of how backups need to be processed.
c07 22 October 2012; 17:58:55
66 ⁄ B I G D A T A A N A L Y T I C S

Big Data often presents the worst-case scenario for most backup
appliances, in which the workload mix consists of billions of small
files and a small number of large files. Finding a backup solution that
can ingest this mixed workload of data at full speed and that can scale
to massive capacities may be the biggest challenge in the Big Data
backup market.
BIG DATA AND COMPLIANCE
Compliance issues are becoming a big concern in the data center, and
these issues have a major effect on how Big Data is protected, stored,
accessed, and archived. Whether Big Data is going to reside in the data
warehouse or in some other more scalable data store remains unre-
solved for most of the industry; it is an evolving paradigm. However,
one thing is certain: Big Data is not easily handled by the relational
databases that the typical database administrator is used to working
with in the traditional enterprise database server environment. This
means it is harder to understand how compliance affects the data.
Big Data is transforming the storage and access paradigms to an
emerging new world of horizontally scaling, unstructured databases,
which are better at solving some old business problems through ana-
lytics. More important, this new world of file types and data is
prompting analysis professionals to think of new problems to solve,
some of which have never been attempted before. With that in mind,
it becomes easy to see that a rebalancing of the database landscape is
about to commence, and data architects will finally embrace the fact
that relational databases are no longer the only tool in the tool kit.
This has everything to do with compliance. New data types and
methodologies are still expected to meet the legislative requirements
placed on businesses by compliance laws. There will be no excuses
accepted and no passes given if a new datamethodology breaks the law.
Preventing compliance from becoming the next Big Data night-
mare is going to be the job of security professionals. They will have to
ask themselves some important questions and take into account the
growing mass of data, which are becoming increasingly unstructured
and are accessed from a distributed cloud of users and applications
looking to slice and dice them in a million and one ways. How will
c07 22 October 2012; 17:58:55
S E C U R I T Y , C O M P L I A N C E , A U D I T I N G , A N D P R O T E C T I O N¥ 67

security professionals be sure they are keeping tabs on the regulated
information in all that mix?
Many organizations still have to grasp the importance of such areas
as payment card industry and personal health information compliance
and are failing to take the necessary steps because the Big Data ele-
ments are moving through the enterprise with other basic data. The
trend seems to be that as businesses jump into Big Data, they forget to
worry about very specific pieces of information that may be mixed into
their large data stores, exposing them to compliance issues.
Health care probably provides the best example for those charged
with compliance as they examine how Big Data creation, storage,
and flow work in their organizations. The move to electronic health
record systems, driven by the Health Insurance Portability and
Accountability Act (HIPAA) and other legislation, is causing a dramatic
increase in the accumulation, access, and inter-enterprise exchange of
personal identifying information. That has already created a Big Data
problem for the largest health care providers and payers, and it must be
solved to maintain compliance.
The concepts of Big Data are as applicable to health care as they are
to other businesses. The types of data are as varied and vast as the
devices collecting the data, and while the concept of collecting and
analyzing the unstructured data is not new, recently developed tech-
nologies make it quicker and easier than ever to store, analyze, and
manipulate these massive data sets.
Health care deals with these massive data sets using Big Data stores,
which can span tens of thousands of computers to enable enterprises,
researchers, and governments to develop innovative products, make
important discoveries, and generate new revenue streams. The rapid
evolution of Big Data has forced vendors and architects to focus pri-
marily on the storage, performance, and availability elements, while
security—which is often thought to diminish performance—has largely
been an afterthought.
In the medical industry, the primary problem is that unsecured Big
Data stores are filled with content that is collected and analyzed in real
time and is often extraordinarily sensitive: intellectual property, per-
sonal identifying information, and other confidential information. The
disclosure of this type of data, by either attack or human error, can be
devastating to a company and its reputation.
c07 22 October 2012; 17:58:55
68 ⁄ B I G D A T A A N A L Y T I C S
However, because this unstructured Big Data doesn’t fit into tradi-
tional, structured, SQL-based relational databases, NoSQL, a new type
of data management approach, has evolved. These nonrelational data
stores can store,manage, andmanipulate terabytes, petabytes, and even
exabytes of data in real time.
No longer scattered in multiple federated databases throughout the
enterprise, Big Data consolidates information in a single massive
database stored in distributed clusters and can be easily deployed in
the cloud to save costs and ease management. Companies may also
move Big Data to the cloud for disaster recovery, replication, load
balancing, storage, and other purposes.
Unfortunately, most of the data stores in use today—including
Hadoop, Cassandra, and MongoDB—do not incorporate sufficient data
security tools to provide enterprises with the peace of mind that
confidential data will remain safe and secure at all times. The need for
security and privacy of enterprise data is not a new concept. However,
the development of Big Data changes the situation in many ways.
To date, those charged with network security have spent a great deal of
time and money on perimeter-based security mechanisms such as
firewalls, but perimeter enforcement cannot prevent unauthorized
access to data once a criminal or a hacker has entered the network.
Add to this the fact that most Big Data platforms provide little to no
data-level security along with the alarming truth that Big Data cen-
tralizes most critical, sensitive, and proprietary data in a single logical
data store, and it’s clear that Big Data requires big security.
The lessons learned by the health care industry show that there is a
way to keep Big Data secure and in compliance. A combination of
technologies has been assembled to meet four important goals:
1. Control access by process, not job function. Server and
network administrators, cloud administrators, and other employ-
ees often have access to more information than their jobs require
because the systems simply lack the appropriate access controls.
Just because a user has operating system–level access to a specific
serverdoesnotmean thatheor sheneeds,or shouldhave, access to
the Big Data stored on that server.
2. Secure the data at rest. Most consumers today would not
conduct anonline transactionwithout seeing the familiar padlock
c07 22 October 2012; 17:58:55
S E C U R I T Y , C O M P L I A N C E , A U D I T I N G , A N D P R O T E C T I O N¥ 69
symbol or at least a certification notice designating that particular
transaction as encrypted and secure. So why wouldn’t you
require the same data to be protected at rest in a Big Data store?
All Big Data, especially sensitive information, should remain
encrypted, whether it is stored on a disk, on a server, or in the
cloud and regardless of whether the cloud is inside or outside
the walls of your organization.
3. Protect the cryptographic keys and store them separately
from the data. Cryptographic keys are the gateway to the
encrypted data. If the keys are left unprotected, the data are
easily compromised. Organizations—often those that have
cobbled together their own encryption and key management
solution—will sometimes leave the key exposed within the
configuration file or on the very server that stores the encrypted
data. This leads to the frightening reality that any user with
access to the server, authorized or not, can access the key and
the data. In addition, that key may be used for any number of
other servers. Storing the cryptographic keys on a separate,
hardened server, either on the premises or in the cloud, is the
best practice for keeping data safe and an important step in
regulatory compliance. The bottom line is to treat key security
with as much, if not greater, rigor than the data set itself.
4. Create trusted applications and stacks to protect data
from rogue users. You may encrypt your data to control
access, but what about the user who has access to the config-
uration files that define the access controls to those data?
Encrypting more than just the data and hardening the security
of your overall environment—including applications, services,
and configurations—gives you peace of mind that your sensi-
tive information is protected from malicious users and rogue
employees.
There is still time to create and deploy appropriate security rules
and compliance objectives. The health care industry has helped to lay
some of the groundwork. However, the slow development of laws and
regulations works in favor of those trying to get ahead on Big Data.
Currently, many of the laws and regulations have not addressed the
c07 22 October 2012; 17:58:55
70 ⁄ B I G D A T A A N A L Y T I C S
unique challenges of data warehousing. Many of the regulations do
not address the rules for protecting data from different customers at
different levels.
For example, if a database has credit card data and health care
data, do the PCI Security Standards Council and HIPAA apply to
the entire data store or only to the parts of the data store that have
their types of data? The answer is highly dependent on your inter-
pretation of the requirements and the way you have implemented
the technology.
Similarly, social media applications that are collecting tons of
unregulated yet potentially sensitive data may not yet be a compliance
concern. But they are still a security problem that if not properly
addressed now may be regulated in the future. Social networks are
accumulating massive amounts of unstructured data—a primary fuel
for Big Data, but they are not yet regulated, so this is not a compliance
concern but remains as a security concern.
Security professionals concerned about how things like Hadoop
and NoSQL deployments are going to affect their compliance efforts
should take a deep breath and remember that the general principles of
data security still apply. The first principle is knowing where the data
reside. With the newer database solutions, there are automated ways
of detecting data and triaging systems that appear to have data they
shouldn’t.
Once you begin to map and understand the data, opportunities
should become evident that will lead to automating and monitoring
compliance and security through data warehouse technologies. Auto-
mation offers the ability to decrease compliance and security costs and
still provide the higher levels of assurance, which validates where the
data are and where they are going.
Of course, automation does not solve every problem for secu-
rity, compliance, and backup. There are still some very basic rules
that should be used to enable security while not derailing the value
of Big Data:
j Ensure that security does not impede performance or
availability. Big Data is all about handling volume while pro-
viding results, being able to deal with the velocity and variety
c07 22 October 2012; 17:58:55
S E C U R I T Y , C O M P L I A N C E , A U D I T I N G , A N D P R O T E C T I O N¥ 71

of data, and allowing organizations to capture, analyze, store,
or move data in real time. Security controls that limit any of
these processes are a nonstarter for organizations serious about
Big Data.
j Pick the right encryption scheme. Some data security solu-
tions encrypt at the file level or lower, such as including
specific data values, documents, or rows and columns. Those
methodologies can be cumbersome, especially for key man-
agement. File level or internal file encryption can also render
data unusable because many applications cannot analyze
encrypted data. Likewise, encryption at the operating system
level, but without advanced key management and process-
based access controls, can leave Big Data woefully insecure.
To maintain the high levels of performance required to analyze
Big Data, consider a transparent data encryption solution opti-
mized for Big Data.
j Ensure that the security solution can evolve with your
changing requirements. Vendor lock-in is becoming a major
concern for many enterprises. Organizations do not want to be
held captive to a sole source for security, whether it is a single-
server vendor, a network vendor, a cloud provider, or a platform.
The flexibility to migrate between cloud providers and models
based on changing business needs is a requirement, and this is no
different with Big Data technologies. When evaluating security,
you should consider a solution that is platform-agnostic and
can work with any Big Data file system or database, including
Hadoop, Cassandra, and MongoDB.
THE INTELLECTUAL PROPERTY CHALLENGE
One of the biggest issues around Big Data is the concept of intellectual
property (IP). First wemust understandwhat IP is, in itsmost basic form.
There aremany definitions available, but basically, intellectual property
refers to creations of the human mind, such as inventions, literary
and artistic works, and symbols, names, images, and designs used in
commerce. Although this is a rather broad description, it conveys the
essence of IP.
c07 22 October 2012; 17:58:55
72 ⁄ B I G D A T A A N A L Y T I C S
With Big Data consolidating all sorts of private, public, corporate,
and government data into a large data store, there are bound to be pieces
of IP in themix: simple elements, such as photographs, tomore complex
elements, such as patent applications or engineering diagrams. That
information has to be properly protected, which may prove to be diffi-
cult, since Big Data analytics is designed to find nuggets of information
and report on them.
Here is a little background: Between 1985 and 2010, the number of
patents granted worldwide rose from slightly less than 400,000 to more
than 900,000. That’s an increase of more than 125 percent over one
generation (25 years). Patents are filed and backedwith IP rights (IPRs).
Technology is obviously pushing this growth forward, so it only
makes sense that Big Data will be used to look at IP and IP rights to
determine opportunity. This should create a major concern for com-
panies looking to protect IP and should also be a catalyst to take action.
Fortunately, protecting IP in the realm of Big Data follows many of the
same rules that organizations have already come to embrace, so IP
protection should already be part of the culture in any enterprise.
The same concepts just have to be expanded into the realm of Big
Data. Some basic rules are as follows:
j Understand what IP is and know what you have to
protect. If all employees understand what needs to be pro-
tected, they can better understand how to protect it and whom
to protect it from. Doing that requires that those charged with IP
security in IT (usually a computer security officer, or CSO) must
communicate on an ongoing basis with the executives who
oversee intellectual capital. This may require meeting at least
quarterly with the chief executive, operating, and information
officers and representatives from HR, marketing, sales, legal
services, production, and research and development (R&D).
Corporate leaders will be the foundation for protecting IP.
j Prioritize protection. CSOs with extensive experience nor-
mally recommend doing a risk and cost-benefit analysis. This
may require you to create a map of your company’s assets and
determine what information, if lost, would hurt your company
the most. Then consider which of those assets are most at risk of
c07 22 October 2012; 17:58:56
S E C U R I T Y , C O M P L I A N C E , A U D I T I N G , A N D P R O T E C T I O N¥ 73

being stolen. Putting these two factors together should help you
figure out where to best allocate your protective efforts.
j Label. Confidential information should be labeled appropri-
ately. If company data are proprietary, note that on every log-in
screen. This may sound trivial, but in court you may have to
prove that someone who was not authorized to take informa-
tion had been informed repeatedly. Your argument won’t stand
up if you can’t demonstrate that you made this clear.
j Lock it up. Physical as well as digital protection schemes are a
must. Rooms that store sensitive data should be locked. This
applies to everything from the server farm to the file room.
Keep track of who has the keys, always use complex passwords,
and limit employee access to important databases.
j Educate employees. Awareness training can be effective for
plugging and preventing IP leaks, but it must be targeted to the
information that a specific group of employees needs to guard.
Talk in specific terms about something that engineers or scien-
tists have invested a lot of time in, and they will pay attention.
Humans are often the weakest link in the defense chain. This is
why an IP protection effort that counts on firewalls and copy-
rights but ignores employee awareness and training is doomed
to fail.
j Know your tools. A growing variety of software tools are
available for tracking documents and other IP stores. The cate-
gory of data loss protection (or data leakage prevention) grew
quickly in the middle of the first decade of this century and now
shows signs of consolidation into other security tool sets. Those
tools can locate sensitive documents and keep track of how they
are being used and by whom.
j Use a holistic approach. You must take a panoramic view of
security. If someone is scanning the internal network, your
internal intrusion detection system goes off, and someone from
IT calls the employee who is doing the scanning and says, “Stop
doing that.” The employee offers a plausible explanation, and
that’s the end of it. Later the night watchman sees an employee
carrying out protected documents, whose explanation, when
c07 22 October 2012; 17:58:56
74 ⁄ B I G D A T A A N A L Y T I C S

stopped, is “Oops, I didn’t realize that got into my briefcase.”
Over time, the HR group, the audit group, the individual’s
colleagues, and others all notice isolated incidents, but no one
puts them together and realizes that all these breaches were
perpetrated by the same person. This is why communication
gaps between infosecurity and corporate security groups can be
so harmful. IP protection requires connections and communi-
cation among all the corporate functions. The legal department
has to play a role in IP protection, and so does HR, IT, R&D,
engineering, and graphic design. Think holistically, both to
protect and to detect.
j Use a counterintelligence mind-set. If you were spying on
your own company, how would you do it? Thinking through
such tactics will lead you to consider protecting phone lists,
shredding the papers in the recycling bins, convening an internal
council to approve your R&D scientists’ publications, and coming
up with other worthwhile ideas for your particular business.
These guidelines can be applied to almost any information security
paradigm that is geared toward protecting IP. The same guidelines can
be used when designing IP protection for a Big Data platform.
c07 22 October 2012; 17:58:56
S E C U R I T Y , C O M P L I A N C E , A U D I T I N G , A N D P R O T E C T I O N¥ 75

c07 22 October 2012; 17:58:56
C H A P T E R 8The Evolutionof Big Data
To truly understand the implications of Big Data analytics, one has
to reach back into the annals of computing history, specifically
business intelligence (BI) and scientific computing. The ideology
behind Big Data can most likely be tracked back to the days before
the age of computers, when unstructured data were the norm (paper
records) and analytics was in its infancy. Perhaps the first Big
Data challenge came in the form of the 1880 U.S. census, when the
information concerning approximately 50 million people had to be
gathered, classified, and reported on.
With the 1880 census, just counting people was not enough
information for the U.S. government to work with—particular ele-
ments, such as age, sex, occupation, education level, and even the
“number of insane people in household,” had to be accounted for. That
information had intrinsic value to the process, but only if it could be
tallied, tabulated, analyzed, and presented. New methods of relating
the data to other data collected came into being, such as associating
occupations with geographic areas, birth rates with education levels,
and countries of origin with skill sets.
The 1880 census truly yielded a mountain of data to deal with, yet
only severely limited technologywas available to do any of the analytics.
The problem of Big Data could not be solved for the 1880 census, so it
took over seven years to manually tabulate and report on the data.
c08 22 October 2012; 17:59:52
77
With the 1890 census, things began to change, thanks to the
introduction of the first Big Data platform: a mechanical device called
the Hollerith Tabulating System, which worked with punch cards that
could hold about 80 variables. The Hollerith Tabulating System revo-
lutionized the value of census data, making it actionable and increasing
its value an untold amount. Analysis now took six weeks instead of
seven years. That allowed the government to act on information in a
reasonable amount of time.
The census example points out a common theme with data ana-
lytics: Value can be derived only by analyzing data in a time frame in
which action can still be taken to utilize the information uncovered.
For the U.S. government, the ability to analyze the 1890 census led to
an improved understanding of the populace, which the government
could use to shape economic and social policies ranging from taxation
to education to military conscription.
In today’s world, the information contained in the 1890 census
would no longer be considered Big Data, according to the definition:
data sets so large that common technology cannot accommodate
and process them. Today’s desktop computers certainly have enough
horsepower to process the information contained in the 1890 census
by using a simple relational database and some basic code.
That realization transforms what Big Data is all about. Big Data
involves having more data than you can handle with the computing
power you already have, and you cannot easily scale your current
computing environment to address the data. The definition of Big Data
therefore continues to evolve with time and advances in technology.
Big Data will always remain a paradigm shift in the making.
That said, the momentum behind Big Data continues to be driven
by the realization that large unstructured data sources, such as those
from the 1890 census, can deliver almost immeasurable value. The
next giant leap for Big Data analytics came with the Manhattan
Project, the U.S. development of the atomic bomb during World War
II. The Manhattan Project not only introduced the concept of Big Data
analysis with computers, it was also the catalyst for “Big Science,”
which in turn depends on Big Data analytics for success. The next
largest Big Science project began in the late 1950s with the launch of
the U.S. space program.
c08 22 October 2012; 17:59:52
78 ⁄ B I G D A T A A N A L Y T I C S

As the term Big Science gained currency in the 1960s, the Man-
hattan Project and the space program became paradigmatic examples.
However, the International Geophysical Year, an international scien-
tific project that lasted from July 1, 1957, to December 31, 1958,
provided scientists with an alternative model: a synoptic collection of
observational data on a global scale.
This new, potentially complementary model of Big Science encom-
passed multiple fields of practice and relied heavily on the sharing of
large data sets that spanned multiple disciplines. The change in data
gathering techniques, analysis, and collaboration also helped to redefine
how Big Science projects are planned and accomplished. Most impor-
tant, the International Geophysical Year project laid the foundation for
more ambitious projects that gathered more specialized data for specific
analysis, such as the International Biological Program and later the Long-
Term Ecological Research Network. Both increased the mountains of
data gathered, incorporated newer analysis technologies, and pushed IT
technology further into the spotlight.
The International Biological Program encountered difficulties
when the institutional structures, research methodologies, and data
management implied by the Big Science mode of research collided
with the epistemic goals, practices, and assumptions of many of the
scientists involved. By 1974, when the program ended, many parti-
cipants viewed it as a failure.
Nevertheless, what many viewed as a failure really was a success.
The program transformed the way data were collected, shared, and
analyzed and redefined how IT can be used for data analysis. Historical
analysis suggests that many of the original incentives of the program
(such as the emphasis on Big Data and the implementation of the
organizational structure of Big Science) were in fact realized by the
program’s visionaries and its immediate investigators. Even though
the program failed to follow the exact model of the International
Geophysical Year, it ultimately succeeded in providing a renewed
legitimacy for synoptic data collection.
The lessons learned from the birth of Big Science spawned new Big
Data projects: weather prediction, physics research (supercollider data
analytics), astronomy images (planet detection), medical research (drug
interaction), andmany others. Of course, Big Data doesn’t apply only to
c08 22 October 2012; 17:59:52
T H E E V O L U T I O N O F B I G D A T A¥ 79
science; businesses have latchedonto its techniques,methodologies, and
objectives, too. This has allowed the businesses to uncover value in data
that might previously have been overlooked.
BIG DATA: THE MODERN ERA
Big Science may have led to the birth of Big Data, but it was Big
Business that brought Big Data through its adolescence into the modern
era. Big Science and Big Business differ on many levels, of course,
especially in analytics. Big Science uses Big Data to answer questions
or prove theories, while Big Business uses Big Data to discover new
opportunities, measure efficiencies, or uncover relationships among
what was thought to be unrelated data sets.
Nonetheless, both use algorithms to mine data, and both have to
have technologies to work with mountains of data. But the similarities
end there. Big Science gathers data based on experiments and research
conducted in controlled environments. Big Business gathers data from
sources that are transactional in nature and that often have little
control over the origin of the data.
For Big Business, and businesses of almost any size, there is an
avalanche of data available that is increasing exponentially. Perhaps
Google CEO Erik Schmidt said it best: “Every two days now we create
as much information as we did from the dawn of civilization up until
2003. That’s something like five exabytes of data.” An exabyte is
an incredibly large, almost unimaginable amount of information: 10
to the 18th power. Think of an exabyte as the number 1 followed by
18 zeros.
It is that massive amount of exponentially growing data that
defines the future of Big Data. Once again, we may need to look at
the scientific community to determine where Big Data is headed for the
business world. Farnam Jahanian, the assistant director for computer
and information science and engineering for the National Science
Foundation (NSF), kicked off a May 1, 2012, briefing about Big Data on
Capitol Hill by calling data “a transformative new currency for science,
engineering, education, and commerce.” That briefing, which was
organized by TechAmerica, brought together a panel of leaders from
government and industry to discuss the opportunities for innovation
c08 22 October 2012; 17:59:52
80 ⁄ B I G D A T A A N A L Y T I C S

arising from the collection, storage, analysis, and visualization of large,
heterogeneous data sets, all the while taking into consideration the
significant security and privacy implications.
Jahanian noted that “Big Data is characterized not only by the
enormous volume of data but also by the diversity and heterogeneity
of the data and the velocity of its generation,” the result of modern
experimental methods, longitudinal observational studies, scientific
instruments such as telescopes and particle accelerators, Internet
transactions, and the widespread deployment of sensors all around us.
In doing so, he set the stage for why Big Data is important to all facets
of the IT discovery and innovation ecosystem, including the nation’s
academic, government, industrial, entrepreneurial, and investment
communities.
Jahanian further explained the implications of the modern era of
Big Data with three specific points:
First, insights and more accurate predictions from large andcomplex collections of data have important implications forthe economy. Access to information is transformingtraditional businesses and is creating opportunities in newmarkets. Big Data is driving the creation of new IT productsand services based on business intelligence and dataanalytics and is boosting the productivity of firms that use itto make better decisions and identify new business trends.
Second, advances in Big Data are critical to acceleratethe pace of discovery in almost every science andengineering discipline. From new insights about proteinstructure, biomedical research and clinical decision making,and climate modeling to new ways to mitigate and respondto natural disasters and new strategies for effective learningand education, there are enormous opportunities for data-driven discovery.
Third, Big Data also has the potential to solve some ofthe nation’s most pressing challenges—in science,education, environment and sustainability, medicine,commerce, and cyber and national security—withenormous societal benefit and laying the foundations forU.S. competitiveness for many decades to come.
Jahanian shared the President’s Council of Advisors on Science
and Technology’s recent recommendation for the federal government
c08 22 October 2012; 17:59:52
T H E E V O L U T I O N O F B I G D A T A¥ 81
to “increase R&D investments for collecting, storing, preserving, man-
aging, analyzing, and sharing increased quantities of data,” because
“the potential to gain new insights [by moving] from data to knowl-
edge to action has tremendous potential to transform all areas of
national priority.”
Partly in response to this recommendation, the White House Office
of Science and Technology Policy, together with other agencies,
announced a $200 million Big Data R&D initiative to advance core
techniques and technologies. According to Jahanian, within this ini-
tiative, the NSF’s strategy for supporting the fundamental science and
underlying infrastructure enabling Big Data science and engineering
involves the following:
j Advances in foundational techniques and technologies (i.e.,
new methods) to derive knowledge from data.
j Cyberinfrastructure to manage, curate, and serve data to science
and engineering research and education communities.
j New approaches to education and workforce development.
j Nurturance of new types of collaborations—multidisciplinary
teams and communities enabled by new data access policies—to
make advances in the grand challenges of the computation- and
data-intensive world today.
Ultimately, Jahanian concluded, “realizing the enormous potential
of Big Data requires a long-term, bold, sustainable, and comprehensive
approach, not only by NSF but also throughout the government and
our nation’s research institutions.”
The panel discussions that followed echoed many of Jahanian’s
remarks. For example, Nuala O’Connor Kelly, the senior counsel for
information governance and chief privacy leader at General Electric
(GE), said, “For us, it’s the volume and velocity and variety of data
[and the opportunity that’s presented for using] that data to achieve
new results for the company and for our customers and clients
[throughout the world].” She cited as an example that GE Healthcare
collects and monitors maintenance data from its machines deployed
worldwide and can automatically ship replacement parts just days in
advance of their malfunctioning, based on the analytics of machine
c08 22 October 2012; 17:59:52
82 ⁄ B I G D A T A A N A L Y T I C S

functionality. “Much of [this] is done remotely and at tremendous cost
savings,” she said.
Caron Kogan, the strategic planning director at Lockheed Martin,
and Flavio Villanustre, the vice president of technology at LexisNexis
Risk Solutions, described similar pursuits within their companies—
particularly in intelligence and fraud prevention, respectively.
GE’s Kelly touched on privacy aspects. “Control may no longer be
about not having the data at all,” she pointed out. “A potentially more
efficient solution is one of making sure there are appropriate controls
technologically and processes and policies and laws in place and then
ensuring appropriate enforcement.” She emphasized striking the right
balance between policies that ensure the protection of individuals and
those that enable technological innovation and economic growth.
Bill Perlowitz, the chief technology officer in Wyle Laboratories’s
science, technology, and engineering group, referenced a paradigm
shift in scientific exploration:
Before, if you had an application or software, you hadvalue; now that value is going to be in the data. Forscientists that represents a shift from [hypothesis-driven]science to data-driven research. Hypothesis-driven sciencelimits your exploration to what you can imagine, andthe human mind . . . can only go so far. Data-drivenscience allows us to collect data and then see what it tells us,and we don’t have a pretense that we may understandwhat those relationships are and what we may find. So fora research scientist, these kinds of changes are veryexciting and something we’ve been trying to get to for sometime now.
Perhaps Nick Combs, the federal chief technology officer at EMC
Corporation, summed it up best when describing the unprecedented
growth in data: “It’s [no longer about finding a] needle in a haystack or
connecting the dots. That’s child’s play.”
What all of this means is that the value of Big Data and the
transformation of the ideologies and technologies are already here.
The government and scientific communities are preparing themselves
for the next evolution of Big Data and are planning how to address the
new challenges and figure out better ways to leverage the data.
c08 22 October 2012; 17:59:52
T H E E V O L U T I O N O F B I G D A T A¥ 83
TODAY, TOMORROW, AND THE NEXT DAY
As the amount of data gathered grows exponentially, so does the
evolution of the technology used to process the data. According to
the International Data Corporation, the volume of digital content
in the world will grow to 2.7 billion terabytes in 2012, up 48 percent
from 2011, and will reach 8 billion terabytes by 2015. That will be a
lot of data!
The flood of data is coming from both structured corporate data-
bases and unstructured data from Web pages, blogs, social networking
messages, and other sources. Currently, for example, there are count-
less digital sensors worldwide in industrial equipment, automobiles,
electrical meters, and shipping crates. Those sensors can measure and
communicate location, movement, vibration, temperature, humidity,
and even chemical changes in the air. Today, Big Business wields data
like a weapon. Giant retailers, such as Walmart and Kohl’s, analyze
sales, pricing, economic, demographic, and weather data to tailor
product selections at particular stores and determine the timing of price
markdowns.
Logistics companies like United Parcel Service mine data on truck
delivery times and traffic patterns to fine-tune routing. A whole eco-
system of new businesses and technologies is springing up to engage
with this new reality: companies that store data, companies that mine
data for insight, and companies that aggregate data to make them
manageable. However, it is an ecosystem that is still emerging, and its
exact shape has yet to make itself clear.
Even though Big Data has been around for some time, one of
the biggest challenges of working with it still remains, and that is
assembling data and preparing them for analysis. Different systems store
data in different formats, even within the same company. Assembling,
standardizing, and cleaning data of irregularities—all without removing
the information that makes them valuable—remain a central challenge.
Currently, Hadoop, an open source software framework derived
from Google’s MapReduce and Google File System papers, is being
used by several technology vendors to do just that. Hadoop maps tasks
across a cluster of machines, splitting them into smaller subtasks,
before reducing the results into one master calculation. It’s really an
c08 22 October 2012; 17:59:53
84 ⁄ B I G D A T A A N A L Y T I C S

old grid-computing technique given new life in the age of cloud
computing. Many of the challenges of yesterday remain today, and
technology is just now catching up with the demands of Big Data
analytics. However, Big Data remains a moving target.
As the future brings more challenges, it will also deliver more
solutions, and Big Data has a bright future, with tomorrow delivering
the technologies that ease leveraging the data. For example, Hadoop is
converging with other technology advances such as high-speed data
analysis, made possible by parallel computing, in-memory processing,
and lower-cost flash memory in the form of solid-state drives.
The prospect of being able to process troves of data very quickly,
in-memory, without time-consuming forays to retrieve information
stored on disk drives, will be a major enabler, and this will allow
companies to assemble, sort, and analyze data much more rapidly. For
example, T-Mobile is using SAP’s HANA to mine data on its 30 million
U.S. customers from stores, text messages, and call centers to tailor
personalized deals.
What used to take T-Mobile a week to accomplish can now be
done in three hours with the SAP system. Organizations that can
utilize this capability to make faster and more informed business
decisions will have a distinct advantage over competitors. In a short
period of time, Hadoop has transitioned from relative obscurity as a
consumer Internet project into the mainstream consciousness of
enterprise IT.
Hadoop is designed to handle mountains of unstructured data.
However, as it exists, the open source code is a long way from meeting
enterprise requirements for security, management, and efficiency
without some serious customization. Enterprise-scale Hadoop deploy-
ments require costly IT specialists who are capable of guiding a lot of
somewhat disjointed processes. That currently limits adoption to orga-
nizations with substantial IT budgets.
As tomorrow delivers refined platforms, Hadoop and its derivatives
will start to fit into the enterprise as a complement to existing data
analytics and data warehousing tools, available from established
business process vendors, such as Oracle, HP, and SAP. The key will be
to make Hadoop much more accessible to enterprises of all sizes, which
can be accomplished by creating high availability platforms that take
c08 22 October 2012; 17:59:53
T H E E V O L U T I O N O F B I G D A T A¥ 85

much of the complexity out of assembling and preparing huge
amounts of data for analysis.
Aggregating multiple steps into a streamlined automated process
with significantly enhanced security will prove to be the catalyst that
drives Big Data from today to tomorrow. Add those enhancements
to new technologies, such as appliances, and the momentum should
continue to pick up, thanks to easy management through user-
friendly GUI.
The true value of Big Data lies in the amount of useful data that can
be derived from it. The future of Big Data is therefore to do for data
and analytics what Moore’s Law has done for computing hardware and
exponentially increase the speed and value of business intelligence.
Whether the need is to link geography and retail availability, use patient
data to forecast public health trends, or analyze global climate trends, we
live in a world full of data. Effectively harnessing Big Data will give
businesses a whole new lens through which to see it.
However, the advance of Big Data technology doesn’t stop with
tomorrow. Beyond tomorrow probably holds surprises that no one
has even imagined yet. As technology marches ahead, so will the
usefulness of Big Data. A case in point is IBM’s Watson, an artificial
intelligence computer system capable of answering questions posed in
natural language. In 2011, as a test of its abilities, Watson competed on
the quiz show Jeopardy!, in the show’s only human-versus-machine
match to date. In a two-game, combined-point match, broadcast in
three episodes aired February 14–16, Watson beat Brad Rutter, the
biggest all-time money winner on Jeopardy!, and Ken Jennings,
the record holder for the longest championship streak (74 wins).
Watson had access to 200 million pages of structured and unstruc-
tured content consuming four terabytes of disk storage, including the full
text of Wikipedia, but was not connected to the Internet during the
game. Watson demonstrated that there are new ways to deal with Big
Data and new ways to measure results, perhaps exemplifying where
Big Data may be headed.
So what’s next for Watson? IBM has stated publicly that Watson
was a client-driven initiative, and the company intends to push Wat-
son in directions that best serve customer needs. IBM is now working
with financial giant Citi to explore how the Watson technology could
c08 22 October 2012; 17:59:53
86 ⁄ B I G D A T A A N A L Y T I C S

improve and simplify the banking experience. Watson’s applicability
doesn’t end with banking, however; IBM has also teamed up with
health insurer WellPoint to turn Watson into a machine that can
support the doctors of the world.
According to IBM, Watson is best suited for use cases involving
critical decision making based on large volumes of unstructured data.
To drive the Big Data–crunching message home, IBM has stated that
90 percent of the world’s data was created in the last two years, and 80
percent of that data is unstructured. Furthering the value proposition
of Watson and Big Data, IBM has also stated that five new research
documents come out of Wall Street every minute, and medical
information is doubling every five years.
IBM views the future of Big Data a little differently than other
vendors do, most likely based on its Watson research. In IBM’s future,
Watson becomes a service—as IBM calls it, Watson-as-a-Service—
which will be delivered as a private or hybrid cloud service.
Watson aside, the health care industry seems ripe as a source of
prediction for how Big Data will evolve. Examples abound for the
benefits of Big Data and the medical field; however, getting there is
another story altogether. Health care (or in this context, “Big Medi-
cine”) has some specific challenges to overcome and some specific
goals to achieve to realize the potential of Big Data:
j Big Medicine is drowning in information while also dying of
thirst. For those in the medical profession, that axiom can be
summed up with a situation that most medical personnel face:
When you’re in the institution and you’re trying to figure out
what’s going on and how to report on something, you’re dying
of thirst in a sea of information. There is a tremendous amount of
information, so much so that it becomes a Big Data problem.
How does one tap into that information and make sense of it?
The answer has implications not only for patients but also for the
service providers, ranging from nurses, physicians, and hospital
administrators, even to government and insurance agencies. The
big issue is that the data are not organized; they are a mixture of
structured and unstructured data. How the data will ultimately be
handled over the next few yearswill be driven by the government,
c08 22 October 2012; 17:59:53
T H E E V O L U T I O N O F B I G D A T A¥ 87
which will require a tremendous amount of information to be
recorded for reporting purposes.
j Technologies that tap into Big Data need to become more
prevalent and even ubiquitous. From the patient’s perspective,
analytics and Big Data will aid in determining which hospital in
a patient’s immediate area is the best for treating his or her
condition. Today there are a huge number of choices available,
and most people choose by word of mouth, insurance
requirements, doctor recommendations, and many other fac-
tors. Wouldn’t it make more sense to pick a facility based on
report cards derived by analytics? That is the goal of the gov-
ernment, which wants patients to be able to look at a report
card for various institutions. However, the only way to create
that report card is to unlock all of the information and impose
regulations and reporting. That will require various types of IT
to tap into unstructured information, like dashboard technolo-
gies and analytics, business intelligence technologies, clinical
intelligence technologies, and revenue cycle management
intelligence for institutions.
j Decision support needs to be easier to access. Currently in medical
institutions, evidence-based medicine and decision support is not
as easy to access as it should be. Utilizing Big Data analytics will
make the decision process easier and will provide the hard evi-
dence to validate a particular decision path. For example, when a
patient is suffering from a particular condition, there’s a high
potential that something is going to happen to that patient because
of his or her history. The likely outcomes or progressions can be
brought up at the beginning of the care cycle, and the treating
physician can be informed immediately. Information like that
and much more will come from the Big Data analytics process.
j Information needs to flowmore easily. Currently from a patient’s
perspective, health care today limits information. Patients often
have little perspective onwhat exactly is happening, at least until
a physician comes in. However, the majority of patients are
apprehensive about talking to the physician. That becomes an
c08 22 October 2012; 17:59:53
88 ⁄ B I G D A T A A N A L Y T I C S
informational blockade for both the physician and the patient and
creates a situation in which it becomes more difficult for both
physicians and patients to make choices. Big Data has the
potential to solve that problem as well; the flow of information
will be easiernot only forphysicians tomanagebutalso forpatients
to access. For example, physicians will be able to look on their
tablets or smartphones and see there is a 15-minute emergency-
room wait over here and a 5-minute wait over there. Scheduling,
diagnostic support, and evidence-based medicine support in the
work flow will improve.
j Quality of care needs to be increased while driving costs down.
From a cost perspective and a quality-of-care point of view,
there are a number of different areas that can be improved by
Big Data. For example, if a patient experiences an injury while
staying in a hospital, the hospital will not be reimbursed for his
or her care. The system can see that this has the potential to
happen and can alert everyone. Big Data can enable a proactive
approach for care that reduces accidents or other problems that
affect the quality of care. By preventing problems and accidents,
Big Data can yield significant savings.
j The physician–patient relationship needs to improve. Thanks to
social media and mobile applications, which are benefiting from
Big Data techniques, it is becoming easier to research health
issues and allow patients and physicians to communicate more
frequently. Stored data and unstructured data can be analyzed
against social data to identify health trends. That information
can then be used by hospitals to keep patients healthier and out
of the facility. In the past, hospitals made more money the sicker
a patient was and the longer they kept him or her there.
However, with health care reform, hospitals are going to start
being compensated for keeping patients healthier. Because of
that there will be an explosion of mobile applications and even
social media, allowing patients to have easier access to nurses
and physicians. Health care is undergoing a transformation in
which the focus is more on keeping patients healthy and driving
c08 22 October 2012; 17:59:53
T H E E V O L U T I O N O F B I G D A T A¥ 89
down costs. These two major areas are going to drive a great
deal of change, and a lot of evolution will take place from a
health information technology point of view, all underpinned
by the availability of data.
Health care proves that Big Data has definite value and will
arguably be the leader in Big Data developments. However, the lessons
learned by the health care industry can readily be applied to other
business models, because Big Data is all about knowing how to utilize
and analyze data to fit specific needs.
CHANGING ALGORITHMS
Just as data evolve and force the evolution of Big Data platforms, the
very basic elements of analytics evolve as well. Most approaches to
dealing with large data sets within a classification learning paradigm
attempt to increase computational efficiency. Given the same amount
of time, a more efficient algorithm can explore more of the hypothesis
space than a less efficient algorithm. If the hypothesis space contains
an optimal solution, a more efficient algorithm has a greater chance of
finding that solution (assuming the hypothesis space cannot be
exhaustively searched within a reasonable time). It is that desire for
efficiency and speed that is forcing the evolution of algorithms and the
supporting systems that run them.
However, a more efficient algorithm results in more searching or a
faster search, not a better search. If the learning biases of the algorithm
are inappropriate, an increase in computational efficiency may not
equal an improvement in prediction performance. Therein lies the
problem: More efficient algorithms normally do not lead to additional
insights, just improved performance. However, improving the per-
formance of a Big Data analytics platform increases the amount of data
that can be analyzed, and that may lead to new insights.
The trick here is to create new algorithms that are more flexible,
that incorporate machine learning techniques, and that remove the
bias from analysis. Computer systems are now becoming powerful
and subtle enough to help reduce human biases from our decision
making. And this is the key: Computers can do it in real time. That will
c08 22 October 2012; 17:59:53
90 ⁄ B I G D A T A A N A L Y T I C S
inevitably transform the objective observer concept into an organic,
evolving database.
Today these systems can chew through billions of bits of data,
analyze them via self-learning algorithms, and package the insights for
immediate use. Neither we nor the computers are perfect, but in
tandem we might neutralize our biased, intuitive failings when we
price a car, prescribe a medicine, or deploy a sales force.
In the real world, accurate algorithms will translate to fewer
hunches and more facts. Take, for example, the banking and mortgage
market, where even the most knowledgeable human can quickly be
outdone by an algorithm. Big Data systems are now of such scale that
they can analyze the value of tens of thousands of mortgage-backed
securities by picking apart the ongoing, dynamic creditworthiness of
tens of millions of individual home owners. Such a system has already
been built for Wall Street traders.
By crunching billions of data points about traffic flows, an algo-
rithm might find that on Fridays a delivery fleet should stick to the
highways, despite the gut instinct of a dispatcher for surface road
shortcuts.
Big Data is at an evolutionary juncture where human judgment
can be improved or even replaced by machines. That may sound
ominous, but the same systems are already predicting hurricanes,
warning of earthquakes, and mapping tornadoes.
Businesses are seeing the value, and the systems and algorithms
are starting to supplement human judgment and are even on a path to
replace it, in some cases. Until recently, however, businesses have
been thwarted by the cost of storage, slower processing speeds, and the
flood of the data themselves, spread sloppily across scores of different
databases inside one company.
With technology and pricing points now solving those problems,
the evolution of algorithms and Big Data platforms is bound to
accelerate and change the very way we do predictive analysis, research,
and even business.
c08 22 October 2012; 17:59:53
T H E E V O L U T I O N O F B I G D A T A¥ 91

c08 22 October 2012; 17:59:53

C H A P T E R 9Best Practices forBig Data Analytics
L ike any other technology or process, there obviously are best
practices that can be applied to the problems of Big Data. In
most cases, best practices usually arise from years of testing and
measuring results, giving them a solid foundation to build on.
However, Big Data, as it is applied today, is relatively new, short
circuiting the tried-and-true methodology used in the past to derive
best practices. Nevertheless, best practices are presenting themselves
at a fairly accelerated rate, which means that we can still learn from
the mistakes and successes of others to define what works best and
what doesn’t.
The evolutionary aspect of Big Data tends to affect best practices,
so what may be best today may not necessarily be best tomorrow.
That said, there are still some core proven techniques that can be
applied to Big Data analytics and that should withstand the test of
time. With new terms, new skill sets, new products, and new provi-
ders, the world of Big Data analytics can seem unfamiliar, but tried-
and-true data management best practices do hold up well in this still
emerging discipline.
As with any business intelligence (BI) and/or data warehouse
initiative, it is critical to have a clear understanding of an organization’s
data management requirements and a well-defined strategy before
venturing too far down the Big Data analytics path. Big Data analytics
c09 22 October 2012; 18:0:37
93
is widely hyped, and companies in all sectors are being flooded with
new data sources and ever larger amounts of information. Yet making
a big investment to attack the Big Data problem without first figuring
out how doing so can really add value to the business is one of the
most serious missteps for would-be users.
The trick is to start from a business perspective and not get too
hung up on the technology, which may entail mediating conversations
among the chief information officer (CIO), the data scientists, and
other businesspeople to identify what the business objectives are
and what value can be derived. Defining exactly what data are avail-
able and mapping out how an organization can best leverage the
resources is a key part of that exercise.
CIOs, IT managers, and BI and data warehouse professionals need
to examine what data are being retained, aggregated, and utilized and
compare that with what data are being thrown away. It is also critical
to consider external data sources that are currently not being tapped
but that could be a compelling addition to the mix. Even if companies
aren’t sure how and when they plan to jump into Big Data analytics,
there are benefits to going through this kind of an evaluation sooner
rather than later.
Beginning the process of accumulating data also makes you better
prepared for the eventual leap to Big Data, even if you don’t know
what you are going to use it for at the outset. The trick is to start
accumulating the information as soon as possible. Otherwise there
may be a missed opportunity because information may fall through
the cracks, and you may not have that rich history of information to
draw on when Big Data enters the picture.
START SMALL WITH BIG DATA
When analyzing Big Data, it makes sense to define small, high-value
opportunities and use those as a starting point. Ideally, those smaller
tasks will build the expertise needed to deal with the larger questions
an organization may have for the analytics process. As companies
expand the data sources and types of information they are looking
to analyze, and as they start to create the all-important analytical
models that can help them uncover patterns and correlations in both
c09 22 October 2012; 18:0:37
94 ⁄ B I G D A T A A N A L Y T I C S
structured and unstructured data, they need to be vigilant about
homing in on the findings that are most important to their stated
business objectives.
It is critical to avoid situations in which you end up with a process
that identifies news patterns and data relationships that offer little
value to the business process. That creates a dead spot in an analytics
matrix where patterns, though new, may not be relevant to the
questions being asked.
Successful Big Data projects tend to start with very targeted goals
and focus on smaller data sets. Only then can that success be built
upon to create a true Big Data analytics methodology that starts small
and grows after the practice has served the enterprise rather well,
allowing value to be created with little upfront investment while
preparing the company for the potential windfall of information that
can be derived from analytics.
That can be accomplished by starting with “small bites” (i.e., taking
individual data flows and migrating those into different systems for
converged processing). Over time, those small bites will turn into big
bites, and Big Data will be born. The ability to scale will prove
important—as data collection increases, the scale of the system will
need to grow to accommodate the data.
THINKING BIG
Leveraging open source Hadoop technologies and emerging packaged
analytics tools makes an open source environment more familiar to
business analysts trained in using SQL. Ultimately, scale will become
the primary factor when mapping out a Big Data analytics road map,
and business analysts will need to eschew the ways of SQL to grasp the
concept of distributed platforms that run on nodes and clusters.
It is critical to consider what the buildup will look like. It can be
accomplished by determining how much data will need to be gathered
six months from now and calculating how many more servers may be
needed to handle it. You will also have to make sure that the software
is up to the task of scaling. One big mistake is to be ignorant about
the potential growth of the solution and the potential popularity of the
solution once it is rolled into production.
c09 22 October 2012; 18:0:38
B E S T P R A C T I C E S F O R B I G D A T A A N A L Y T I C S¥ 95
As analytics scales, data governance becomes increasingly important,
a situation that is no different with Big Data than it is with any other
large-scale network operation. The same can be said for information
governance practices, which is just as important todaywith Big Data as it
was yesterday with data warehousing. A critical caveat is to remember
that information is a corporate asset and should be treated as such.
AVOIDING WORST PRACTICES
There are many potential reasons that Big Data analytics projects fall
short of their goals and expectations, and in some cases it is better to
know what not to do rather than knowing what to do. This leads us
to the idea of identifying “worst practices,” so that you can avoid
making the same mistakes that others have made in the past. It is
better to learn from the errors of others than to make your own. Some
worst practices to look out for are the following:
j Thinking “If we build it, they will come.” Many organi-
zations make the mistake of assuming that simply deploying
a data warehousing or BI system will solve critical business
problems and deliver value. However, IT as well as BI and ana-
lytics program managers get sold on the technology hype and
forget that business value is their first priority; data analysis
technology is just a tool used to generate that value. Instead of
blindly adopting and deploying something, Big Data analytics
proponents first need to determine the business purposes that
would be served by the technology in order to establish a busi-
ness case—and only then choose and implement the right ana-
lytics tools for the job at hand. Without a solid understanding of
business requirements, the danger is that project teams will end
up creating a Big Data disk farm that really isn’t worth anything
to the organization, earning the teams an unwanted spot in the
“data doghouse.”
j Assuming that the software will have all of the answers.
Building an analytics system, especially one involving Big Data,
is complex and resource-intensive. As a result, many organiza-
tions hope the software they deploy will be a magic bullet that
c09 22 October 2012; 18:0:38
96 ⁄ B I G D A T A A N A L Y T I C S
instantly does it all for them. People should know better, of
course, but they still have hope. Software does help, sometimes
dramatically. But Big Data analytics is only as good as the data
being analyzed and the analytical skills of those using the tools.
j Not understanding that you need to think differently.
Insanity is often defined as repeating a task and expecting dif-
ferent results, and there is some modicum of insanity in the
world of analytics. People forget that trying what has worked for
them in the past, even when they are confronted with a dif-
ferent situation, leads to failure. In the case of Big Data, some
organizations assume that big just means more transactions and
large data volumes. It may, but many Big Data analytics
initiatives involve unstructured and semistructured information
that needs to be managed and analyzed in fundamentally
different ways than is the case with the structured data in
enterprise applications and data warehouses. As a result, new
methods and tools might be required to capture, cleanse, store,
integrate, and access at least some of your Big Data.
j Forgetting all of the lessons of the past. Sometimes enter-
prises go to the other extreme and think that everything is
different with Big Data and that they have to start from scratch.
This mistake can be even more fatal to a Big Data analytics
project’s success than thinking that nothing is different. Just
because the data you are looking to analyze are structured
differently doesn’t mean the fundamental laws of data man-
agement have been rewritten.
j Not having the requisite business and analytical expertise.
A corollary to the misconception that the technology can do it
all is the belief that all you need are IT staffers to implement Big
Data analytics software. First, in keeping with the theme
mentioned earlier of generating business value, an effective Big
Data analytics program has to incorporate extensive business
and industry knowledge into both the system design stage and
ongoing operations. Second, many organizations underesti-
mate the extent of the analytical skills that are needed. If Big
Data analysis is only about building reports and dashboards,
c09 22 October 2012; 18:0:38
B E S T P R A C T I C E S F O R B I G D A T A A N A L Y T I C S¥ 97
enterprises can probably just leverage their existing BI exper-
tise. However, Big Data analytics typically involves more
advanced processes, such as data mining and predictive ana-
lytics. That requires analytics professionals with statistical,
actuarial, and other sophisticated skills, which might mean
new hiring for organizations that are making their first forays
into advanced analytics.
j Treating the project like a science experiment. Too often,
companies measure the success of Big Data analytics programs
merely by the fact that data are being collected and then ana-
lyzed. In reality, collecting and analyzing the data is just the
beginning. Analytics only produces business value if it is incor-
porated into business processes, enabling business managers and
users to act on the findings to improve organizational perfor-
mance and results. To be truly effective, an analytics program
also needs to include a feedback loop for communicating the
success of actions taken as a result of analytical findings, followed
by a refinement of the analytical models based on the business
results.
j Promising and trying to do too much. Many Big Data
analytics projects fall into a big trap: Proponents oversell how fast
they can deploy the systems and how significant the business
benefits will be. Overpromising and underdelivering is the surest
way to get the business to walk away from any technology, and it
often sets back the use of the particular technology within an
organization for a long time—even if many other enterprises
are achieving success. In addition, when you set expectations
that the benefits will come easily and quickly, business execu-
tives have a tendency to underestimate the required level of
involvement and commitment. And when a sufficient resource
commitment isn’t there, the expected benefits usually don’t
come easily or quickly—and the project is labeled a failure.
BABY STEPS
It is said that every journey begins with the first step, and the journey
toward creating an effective Big Data analytics holds true to that
c09 22 October 2012; 18:0:38
98 ⁄ B I G D A T A A N A L Y T I C S
axiom. However, it takes more than one step to reach a destination of
success. Organizations embarking on Big Data analytics programs
require a strong implementation plan to make sure that the analytics
process works for them. Choosing the technology that will be used
is only half the battle when preparing for a Big Data initiative. Once a
company identifies the right database software and analytics tools and
begins to put the technology infrastructure in place, it’s ready to
move to the next level and develop a real strategy for success.
The importance of effective project management processes to
creating a successful Big Data analytics program also cannot be over-
stated. The following tips offer advice on steps that businesses should
take to help ensure a smooth deployment:
j Decide what data to include and what to leave out. By
their very nature, Big Data analytics projects involve large data
sets. But that doesn’t mean that all of a company’s data sources, or
all of the informationwithin a relevant data source,will need to be
analyzed.Organizations need to identify the strategic data thatwill
lead to valuable analytical insights. For instance, what combina-
tion of information can pinpoint key customer-retention factors?
Or what data are required to uncover hidden patterns in stock
market transactions? Focusing on a project’s business goals in the
planning stages can help an organization home in on the exact
analytics that are required, after which it can—and should—look
at the data needed tomeet those business goals. In some cases, this
will indeed mean including everything. In other cases, though, it
means using only a subset of the Big Data on hand.
j Build effective business rules and then work through the
complexity they create. Coping with complexity is the key
aspect of most Big Data analytics initiatives. In order to get the
right analytical outputs, it is essential to include business-
focused data owners in the process to make sure that all of
the necessary business rules are identified in advance. Once the
rules are documented, technical staffers can assess how much
complexity they create and the work required to turn the data
inputs into relevant and valuable findings. That leads into the
next phase of the implementation.
c09 22 October 2012; 18:0:38
B E S T P R A C T I C E S F O R B I G D A T A A N A L Y T I C S¥ 99
j Translate business rules into relevant analytics in a
collaborative fashion. Business rules are just the first step in
developing effective Big Data analytics applications. Next, IT or
analytics professionals need to create the analytical queries and
algorithms required to generate the desired outputs. But that
shouldn’t be done in a vacuum. The better and more accurate
that queries are in the first place, the less redevelopment will
be required. Many projects require continual reiterations because
of a lack of communication between the project team and
business departments. Ongoing communication and collabora-
tion lead to a much smoother analytics development process.
j Have a maintenance plan. A successful Big Data analytics
initiative requires ongoing attention and updates in addition to
the initial development work. Regular query maintenance and
keeping on top of changes in business requirements are
important, but they represent only one aspect of managing an
analytics program. As data volumes continue to increase and
business users become more familiar with the analytics process,
more questions will inevitably arise. The analytics team must be
able to keep up with the additional requests in a timely fashion.
Also, one of the requirements when evaluating Big Data ana-
lytics hardware and software options is assessing their ability to
support iterative development processes in dynamic business
environments. An analytics system will retain its value over
time if it can adapt to changing requirements.
j Keep your users in mind—all of them. With interest
growing in self-service BI capabilities, it shouldn’t be shocking
that a focus on end users is a key factor in Big Data analytics
programs. Having a robust IT infrastructure that can handle
large data sets and both structured and unstructured informa-
tion is important, of course. But so is developing a system that is
usable and easy to interact with, and doing so means taking the
various needs of users into account. Different types of people—
from senior executives to operational workers, business ana-
lysts, and statisticians—will be accessing Big Data analytics
applications in one way or another, and their adoption of the
c09 22 October 2012; 18:0:38
100 ⁄ B I G D A T A A N A L Y T I C S
tools will help to ensure overall project success. That requires
different levels of interactivity that match user expectations and
the amount of experience they have with analytics tools—for
instance, building dashboards and data visualizations to present
findings in an easy-to-understand way to business managers
and workers who aren’t inclined to run their own Big Data
analytics queries.
There’s no one way to ensure Big Data analytics success. But fol-
lowing a set of frameworks and best practices, including the tips outlined
here, can help organizations to keep their Big Data initiatives on track.
The technical details of a Big Data installation are quite intensive and
need to be looked at and considered in an in-depth manner. That isn’t
enough, though: Both the technical aspects and the business factors
must be taken into account to make sure that organizations get the
desired outcomes from their Big Data analytics investments.
THE VALUE OF ANOMALIES
There are people who believe that anomalies are something best
ignored when processing Big Data, and they have created sophisticated
scrubbing programs to discard what is considered an anomaly. That
can be a sound practice when working with particular types of data,
since anomalies can color the results. However, there are times when
anomalies prove to be more valuable than the rest of the data in
a particular context. The lesson to be learned is “Don’t discard data
without further analysis.”
Take, for example, the world of high-end network security, where
encryption is the norm, access is logged, and data are examined in real
time. Here the ability to identify something that fits into the unchar-
acteristic movement of data is of the utmost importance—in other
words, security problems are detected by looking at anomalies. That
idea can be applied to almost any discipline, ranging from financial
auditing to scientific inquiry to detecting cyber-threats, all critical
services that are based on identifying something out of the ordinary.
In the world of Big Data, that “something out of the ordinary” may
constitute a single log entry out of millions, which, on its own, may not
c09 22 October 2012; 18:0:38
B E S T P R A C T I C E S F O R B I G D A T A A N A L Y T I C S¥ 101
be worth noticing. But when analyzed against traffic, access, and data
flow, that single entry may have untold value and can be a key piece of
forensic information. With computer security, seeking anomalies
makes a great deal of sense. Nevertheless, many data scientists are
reluctant to put much stock in anomalies for other tasks.
Anomalies can actually be the harbingers of trends. Take online
shopping, for example, in which many buying trends start off as iso-
lated anomalies created by early adopters of products; these can then
transcend into a fad and ultimately become a top product. That type
of information—early trending—can make or break a sales cycle.
Nowhere is this more true than on Wall Street, where anomalous
stock trades can set off all sorts of alarms and create frenzies, all driven
by the detection of a few small events uncovered in a pile of Big Data.
Given a large enough data set, anomalies commonly appear. One of
the more interesting aspects of anomaly value comes from the realm
of social networking, where posts, tweets, and updates are thrown into
Big Data and then analyzed. Here businesses are looking at information
such as customer sentiment, using a horizontal approach to compare
anomalies across many different types of time series, the idea being that
different dimensions could share similar anomaly patterns.
Retail shopping is a good example of that. A group of people may do
grocery shopping relatively consistently throughout the year at Safeway,
Trader Joe’s, or Whole Foods but then do holiday shopping at Best Buy
and Toys“R”Us, leading to the expected year-end increases. A company
like Apple might see a level pattern for most of the year, but when a new
iPhone is released, the customers dutifully line up along with the rest of
the world around that beautiful structure of glass and steel.
This information translates to the proverbial needle in a haystack
that needs to be brought forth above other data elements. It is the
concept that for about 300 days of the year, the Apple store is a typical
electronics retailer in terms of temporal buying patterns (if not profit
margins). However, that all changes when an anomalous event (such
as a new product launch) translates into two or three annual block-
buster events, and it becomes the differentiating factor between an
Apple store and other electronics retailers. Common trends among
industries can be used to discount the expected seasonal variations in
order to focus on the truly unique occurrences.
c09 22 October 2012; 18:0:38
102 ⁄ B I G D A T A A N A L Y T I C S
For Twitter data, there are often big disparities among dimensions.
Hashtags are typically associatedwith transient or irregular phenomena,
as opposed to, for instance, the massive regularity of tweets emanating
from a big country. Because of this greater degree of within-dimension
similarity, we should treat the dimensions separately. The dimensional
application of algorithms can identify situations in which hashtags and
user names, rather than locations and time zones, dominate the list of
anomalies, indicating that there is very little similarity among the items
in each of these groups.
Given so many anomalies, making sense of them becomes a dif-
ficult task, creating the following questions: What could have caused
the massive upsurges in the otherwise regular traffic? What domains
are involved? Are URL shorteners and Twitter live video streaming
services involved? Sorting by the magnitude of the anomaly yields a
cursory and excessively restricted view; correlations of the anomalies
often exist within and between dimensions. There can be a great deal
of synergy among algorithms, but it may take some sort of clustering
procedure to uncover them.
EXPEDIENCY VERSUS ACCURACY
In the past, Big Data analytics usually involved a compromise between
performance and accuracy. This situation was caused by the fact that
technology had to deal with large data sets that often required hours
or days to analyze and run the appropriate algorithms on. Hadoop
solved some of these problems by using clustered processing, and other
technologies have been developed that have boosted performance. Yet
real-time analytics has beenmostly a dream for the typical organization,
which has been constrained by budgetary limits for storage and pro-
cessing power—two elements that Big Data devours at prodigious rates.
These constraints created a situation in which if you needed
answers fast, you would be forced to look at smaller data sets, which
could lead to less accurate results. Accuracy, in contrast, often required
the opposite approach: working with larger data sets and taking more
processing time.
As technology and innovation evolve, so do the available options.
The industry is addressing the speed-versus-accuracy problem with
c09 22 October 2012; 18:0:38
B E S T P R A C T I C E S F O R B I G D A T A A N A L Y T I C S¥ 103

in-memory processing technologies, in which data are processed in
volatile memory instead of directly on disk. Data sets are loaded into a
high-speed cache and the algorithms are applied there, reducing all of
the input and output typically needed to read and write to and from
physical disk drives.
IN-MEMORY PROCESSING
Organizations are realizing the value of analyzed data and are seeking
ways to increase that value even further. For many, the path to more
value comes in the form of faster processing. Discovering trends and
applying algorithms to process information takes on additional value if
that analysis can deliver real-time results.
However, the latency of disk-based clusters and wide area network
connections makes it difficult to obtain instantaneous results from BI
solutions. The question then is whether real-time processing can
deliver enough value to offset the additional expenses of faster tech-
nologies. To answer this, one must determine what the ultimate goal
of real-time processing is. Is it to speed up results for a particular
business process? Is it to meet the needs of a retail transaction? Is it to
gain a competitive edge?
The reasons can be many, yet the value gained is still dictated by
the price feasibility of faster processing technologies. That is where
in-memory processing comes into play. However, there are many
other factors that will drive the move toward in-memory processing.
For example, a recent study by the Economist estimated that humans
created about 150 exabytes of information in the year 2005. Although
that may sound like an expansive amount, it pales in comparison to
the over 1,200 exabytes created in 2011.
Furthermore, the research firm IDC (International Data Corpora-
tion) estimates that digital content doubles every 18 months. Further
complicating the processing of data is the related growth of unstruc-
tured data. In fact, research outlet Gartner projects that as much as
80 percent of enterprise data will take on the form of unstructured
elements, spanning traditional and nontraditional sources.
The type of data, the amount of data, and the expediency of acces-
sing the data all influence the decision of whether to use in-memory
c09 22 October 2012; 18:0:38
104 ⁄ B I G D A T A A N A L Y T I C S
processing. Nevertheless, these factors might not hold back the coming
tide of advanced in-memory processing solutions simply because of the
value that in-memory processing brings to businesses.
To understand the real-world advantages of in-memory proces-
sing, you have to look at how Big Data has been dealt with to date
and understand the current physical limits of computing, which are
dictated by the speed of accessing data from relational databases,
processing instructions, and all of the other elements required to
process large data sets.
Using disk-based processing meant that complex calculations that
involved multiple data sets or algorithmic search processing could not
happen in real time. Data scientists would have to wait a few hours to
a few days for meaningful results—not the best solution for fast
business processes and decisions.
Today businesses are demanding faster results that can be used to
make quicker decisions and be used with tools that help organizations
to access, analyze, govern, and share information. All of this brings
increasing value to Big Data.
The use of in-memory technology brings that expediency to ana-
lytics, ultimately increasing the value, which is further accentuated by
the falling prices of the technology. The availability and capacity per
dollar of system memory has increased in the last few years, leading to
a repostulation of how large amounts of data can be stored and acted
upon.
Falling prices and increased capacity have created an environment
where enterprises can now store a primary database in silicon-based
main memory, resulting in an exponential improvement in perfor-
mance and enabling the development of completely new applications.
Physical hard drives are no longer the limiting element for expediency
in processing.
When business decision makers are provided with information and
analytics instantaneously, new insights can be developed and business
processes executed in ways never thought possible. In-memory pro-
cessing signals a significant paradigm shift for IT operations dealing
with BI and business analytics as they apply to large data sets.
In-memory processing is poised to create a new era in business
management in which managers can base their decisions on real-time
c09 22 October 2012; 18:0:38
B E S T P R A C T I C E S F O R B I G D A T A A N A L Y T I C S¥ 105

analyses of complex business data. The primary advantages are as
follows:
j Tremendous improvements in data-processing speed and vol-
ume, created by the multifold improvements of data processing,
which can amount to hundreds of times of increased perfor-
mance compared to older technologies.
j In-memory processing that can handle rapidly expanding
volumes of information while delivering access speeds that are
thousands of times faster than that of traditional physical disk
storage.
j Better price-to-performance ratios than can displace the overall
costs of in-memory processing, compared to disk-based pro-
cessing, yet still offer real-time analytics.
j The ability to leverage the significant reductions in the cost of
central processing units and memory cost in recent years,
combined with multicore and blade architectures, to modernize
data operations while delivering measurable results.
In-memory processing offers these advantages and many others by
shifting the analytics process from a cluster of hard drives and inde-
pendent CPUs to a single comprehensive database that can handle all
the day-to-day transactions and updates, as well as analytical requests,
in real time.
In-memory computing technology allows for the processing of
massive quantities of transactional data in the main memory of the
server, thereby providing immediate results from the analysis of these
transactions.
Since in-memory technology allows data to be accessed directly
from memory, query results come back much more quickly than they
would from a traditional disk-based warehouse. The time it takes to
update the database is also significantly reduced, and the system can
handle more queries at a time.
With this vast improvement in process speed, query quality, and
business insight, in-memory database management systems promise
performance that is 10 to 20 times faster than traditional disk-based
models.
c09 22 October 2012; 18:0:38
106 ⁄ B I G D A T A A N A L Y T I C S
The elements of in-memory computing are not new, but they have
now been developed to a point where common adoption is possible.
Recent improvements in hardware economics and innovations in
software have now made it possible for massive amounts of data to be
sifted, correlated, and updated in seconds with in-memory technology.
Technological advances in main memory, multicore processing, and
data management have combined to deliver dramatic increases in
performance.
In-memory technology promises impressive benefits inmany areas.
The most significant are cost savings, enhanced efficiency, and greater
immediate visibility of a sort that can enable improved decisionmaking.
Businesses of all sizes and across all industries can benefit from the
cost savings obtainable through in-memory technology. Database
management currently accounts for more than 25 percent of most
companies’ IT budgets. Since in-memory databases use hardware sys-
tems that require far less power than traditional database management
systems, they dramatically reduce hardware and maintenance costs.
In-memory databases also reduce the burden on a company’s
overall IT landscape, freeing up resources previously devoted to
responding to requests for reports. And since in-memory solutions are
based on proven mature technology, the implementations are nondis-
ruptive, allowing companies to return to operations quickly and easily.
Any company with operations that depend on frequent data
updates will be able to run more efficiently with in-memory tech-
nology. The conversion to in-memory technology allows an entire
technological layer to be removed from a company’s IT architecture,
reducing the complexity and infrastructure that traditional systems
require. This reduced complexity allows data to be retrieved nearly
instantaneously, making all of the teams in the business more efficient.
In-memory computing allows any business user to easily carve out
subsets of BI for convenient departmental usage. Work groups can
operate autonomously without affecting the workload imposed on
a central data warehouse. And, perhaps most important, business
users no longer have to call for IT support to gain relevant insight into
business data.
These performance gains also allow business users on the road to
retrieve more useful information via their mobile devices, an ability
c09 22 October 2012; 18:0:38
B E S T P R A C T I C E S F O R B I G D A T A A N A L Y T I C S¥ 107

that is increasingly important as more businesses incorporate mobile
technologies into their operations.
With that in mind, it becomes easy to see how in-memory tech-
nology allows organizations to compile a comprehensive overview of
their business data, instead of being limited to subsets of data that have
been compartmentalized in a data warehouse.
With those improvements to database visibility, enterprises are
able to shift from after-event analysis (reactive) to real-time decision
making (proactive) and then create business models that are predictive
rather than response based. More value can be realized by combining
easy-to-use analytic solutions from the start with the analytics plat-
form. This allows anyone in the organization to build queries and
dashboards with very little expertise, which in turn has the potential to
create a pool of content experts who, without external support, can
become more proactive in their actions.
In-memory technology further benefits enterprises because it
allows for greater specificity of information, so that the data elements
are personalized to both the customer and the business user’s indi-
vidual needs. That allows a particular department or line of business to
self-service specific needs whose results can trickle up or down the
management chain, affecting account executives, supply chain man-
agement, and financial operations.
Customer teams can combine different sets of data quickly and
easily to analyze a customer’s past and current business conditions
using in-memory technology from almost any location, ranging from
the office to the road, on their mobile devices. This allows business
users to interact directly with customers using the most up-to-date
information; it creates a collaborative situation in which business users
can interact with the data directly. Business users can experiment with
the data in real time to create more insightful sales and marketing
campaigns. Sales teams have instant access to the information they
need, leading to an entirely new level of customer insight that can
maximize revenue growth by enabling more powerful up-selling and
cross-selling.
With traditional disk-based systems, data are usually processed
overnight,whichmay result in businesses being late to react to important
c09 22 October 2012; 18:0:38
108 ⁄ B I G D A T A A N A L Y T I C S
supply alerts. In-memory technology can eliminate that problem by
giving businesses full visibility of their supply-and-demand chains on a
second-by-second basis. Businesses are able to gain insight in real time,
allowing them to react to changing business conditions. For example,
businessesmaybeable to create alerts, suchas anearlywarning to restock
a specific product, and can respond accordingly.
Financial controllers face increasing challenges brought on by
increased data volumes, slow data processing, delayed analytics, and
slow data-response times. These challenges can limit the controllers’
analysis time frames to several days rather than the more useful
months or quarters. This can lead to a variety of delays, particularly at
the closing of financial periods. However, in-memory technology,
large-volume data analysis, and a flexible modeling environment can
result in faster-closing financial quarters and better visibility of
detailed finance data for extended periods.
In-memory technology has the potential to help businesses in any
industry operate more efficiently, from consumer products and
retailing to manufacturing and financial services. Consumer products
companies can use in-memory technology to manage their suppliers,
track and trace products, manage promotions, provide support in
complying with Environmental Protection Agency standards, and
perform analyses on defective and under-warranty products.
Retail companies canmanage store operations inmultiple locations,
conduct point-of-sale analytics, performmultichannel pricing analyses,
and track damaged, spoiled, and returned products. Manufacturing
organizations can use in-memory technology to ensure operational
performance management, conduct analytics on production and
maintenance, and perform real-time asset utilization studies. Financial
services companies can conduct hedge fund trading analyses, such as
managing client exposures to currencies, equities, derivatives, and other
instruments. Using information accessed from in-memory technology,
they can conduct real-time systematic risk management and reporting
based on market trading exposure.
As the popularity of Big Data analytics grows, in-memory pro-
cessing is going to become the mainstay for many businesses looking
for a competitive edge.
c09 22 October 2012; 18:0:38
B E S T P R A C T I C E S F O R B I G D A T A A N A L Y T I C S¥ 109

c09 22 October 2012; 18:0:39
C H A P T E R 10Bringing ItAll Together
The promises offered by data-driven decision making have been
widely recognized. Businesses have been using business intelli-
gence (BI) and business analytics for years now, realizing the
value offered by smaller data sets and offline advanced processing.
However, businesses are just starting to realize the value of Big Data
analytics, especially when paired with real-time processing.
That has led to a growing enthusiasm for the notion of Big Data,
with businesses of all sizes starting to throw resources behind the quest
to leverage the value out of large data stores composed of structured,
semistructured, and unstructured data. Although the promises wrap-
ped around Big Data are very real, there is still a wide gap between its
potential and its realization.
That wide gap is highlighted by those who have successfully used
the concepts of Big Data at the outset. For example, it is estimated that
Google alone contributed $54 billion to the U.S. economy in 2009,
a significant economic effect, mostly attributed to the ability to handle
large data sets in an efficient manner.
That alone is probably reason enough for the majority of busi-
nesses to start evaluating how Big Data analytics can affect the bottom
line, and those businesses should probably start evaluating Big Data
promises sooner rather than later.
c10 22 October 2012; 18:1:22
111
Delving into the value of Big Data analytics reveals that elements
such as heterogeneity, scale, timeliness, complexity, and privacy prob-
lems can impede progress at all phases of the process that create value
from data. The primary problem begins at the point of data acquisition,
when the data tsunami requires us to make decisions, currently in an ad
hoc manner, about what data to keep, what to discard, and how to
reliably store what we keep with the right metadata.
Adding to the confusion is that most data today are not natively
stored in a structured format; for example, tweets and blogs are weakly
structured pieces of text, while images and video are structured for
storage and display but not for semantic content and search. Trans-
forming such content into a structured format for later analysis is a
major challenge.
Nevertheless, the value of data explodes when they can be linked
with other data; thus data integration is a major creator of value.
Since most data are directly generated in digital format today, busi-
nesses have the opportunity and the challenge to influence the
creation of facilitating later linkage and to automatically link previ-
ously created data.
Data analysis, organization, retrieval, and modeling are other foun-
dational challenges. Data analysis is a clear bottleneck in many applica-
tions because of the lack of scalability of the underlying algorithms aswell
as the complexity of the data that need to be analyzed. Finally, presen-
tation of the results and their interpretation by nontechnical domain
experts is crucial for extracting actionable knowledge.
THE PATH TO BIG DATA
During the last three to four decades, primary data management
principles, including physical and logical independence, declarative
querying, and cost-based optimization, have created a multibillion-
dollar industry that has delivered added value to collected data. The
evolution of these technical advantages has led to the creation of BI
platforms, which have become one of the primary tenets of value
extraction and corporate decision making.
The foundation laid by BI applications and platforms has created
the ideal environment for moving into Big Data analytics. After all,
c10 22 October 2012; 18:1:22
112 ⁄ B I G D A T A A N A L Y T I C S
many of the concepts remain the same; it is just the data sources and
the quantity that primarily change, as well as the algorithms used to
expose the value.
That creates an opportunity in which investment in Big Data and its
associated technical elements becomes amust formany businesses. That
investment will spur further evolution of the analytical platforms in use
and will strive to create collaborative analytical solutions that look
beyond the confines of traditional analytics. In other words, appropriate
investment in Big Data will lead to a new wave of fundamental tech-
nological advances that will be embodied in the next generations of Big
Data management and analysis platforms, products, and systems.
The time is now. Using Big Data to solve business problems and
promote research initiatives will most likely create huge economic
value in the U.S. economy for years to come, making Big Data ana-
lytics the norm for larger organizations. However, the path to success is
not easy and may require that data scientists rethink data analysis
systems in fundamental ways.
A major investment in Big Data, properly directed, not only can
result inmajor scientific advances but also can lay the foundation for the
next generation of advances in science, medicine, and business. So
business leaders must ask themselves the following: Do they want to be
part of the next big thing in IT?
THE REALITIES OF THINKING BIG DATA
Today, organizations and individuals are awash in a flood of data.
Applications and computer-based tools are collecting information on
an unprecedented scale. The downside is that the data have to be
managed, which is an expensive, cumbersome process. Yet the cost of
that management can be offset by the intrinsic value offered by the
data, at least when looked at properly.
The value is derived from the data themselves. Decisions that were
previously based on guesswork or on painstakingly constructed models
of reality can now be made based on the data themselves. Such Big
Data analysis now drives nearly every aspect of our modern society,
including mobile services, retail, manufacturing, financial services, life
sciences, and physical sciences.
c10 22 October 2012; 18:1:22
B R I N G I N G I T A L L T O G E T H E R¥ 113
Certain market segments have had early success with Big Data
analytics. For example, scientific research has been revolutionized by
Big Data, a prime case being the Sloan Digital Sky Survey, which has
become a central resource for astronomers the world over.
Big Data has transformed astronomy from a field in which taking
pictures of the sky was a large part of the job to one in which the
pictures are all in a database already and the astronomer’s task is to
find interesting objects and phenomena in the database.
Transformation is taking place in the biological arena as well. There
is now a well-established tradition of depositing scientific data into a
public repository and of creating public databases for use by other
scientists. In fact, there is an entire discipline of bioinformatics that
is largely devoted to the maintenance and analysis of such data. As
technology advances, particularly with the advent of next-generation
sequencing, the size and number of available experimental data sets
are increasing exponentially.
Big Data has the potential to revolutionize more than just research;
the analytics process has started to transform education aswell. A recent
detailed quantitative comparison of different approaches taken by 35
charter schools in New York City has found that one of the top five
policies correlated with measurable academic effectiveness was the use
of data to guide instruction.
This example is only the tip of the iceberg; as access to data and
analytics improves and evolves, much more value can be derived. The
potential here leads to a world where authorized individuals have
access to a huge database in which every detailed measure of every
student’s academic performance is stored. That data could be used to
design the most effective approaches for education, ranging from
the basics, such as reading, writing, and math, to advanced college-
level courses.
A final example is the health care industry, in which everything
from insurance costs to treatment methods to drug testing can be
improved with Big Data analytics. Ultimately, Big Data in the health
care industry will lead to reduced costs and improved quality of care,
which may be attributed to making care more preventive and per-
sonalized and basing it on more extensive (home-based) continuous
monitoring.
c10 22 October 2012; 18:1:23
114 ⁄ B I G D A T A A N A L Y T I C S

More examples are readily available to prove that data can deliver
value well beyond one’s expectations. The key issues are the analysis
performed and the goal sought. The previous examples only scratch
the surface of what Big Data means to the masses. The essential point
here is to understand the intrinsic value of Big Data analytics and
extrapolate the value as it can be applied to other circumstances.
HANDS-ON BIG DATA
The analysis of Big Data involves multiple distinct phases, each of which
introduces challenges. These phases include acquisition, extraction,
aggregation, modeling, and interpretation. However, most people focus
just on the modeling (analysis) phase.
Although that phase is crucial, it is of little use without the other
phases of the data analysis process, which can create problems like
false outcomes and uninterruptable results. The analysis is only as
good as the data provided. The problem stems from the fact that
there are poorly understood complexities in the context of multi-
tenanted data clusters, especially when several analyses are being
run concurrently.
Many significant challenges extend beyond and underneath the
modeling phase. For example, Big Data has to be managed for context,
which may include spurious information and can be heterogeneous in
nature; this is further complicated by the lack of an upfront model.
It means that data provenancemust be accounted for, aswell asmethods
created to handle uncertainty and error.
Perhaps the problems can be attributed to ignorance or, at the very
least, a lack of consideration for primary topics that define the Big Data
process yet are often afterthoughts. This means that questions and
analytical processes must be planned and thought out in the context of
the data provided. One has to determine what is wanted from the data
and then ask the appropriate questions to get that information.
Accomplishing that will require smarter systems as well as better
support for those making the queries, perhaps by empowering those
users with natural language tools (rather than complex mathematical
algorithms) to query the data. The key issue is the level of achievable
artificial intelligence and how much that can be relied on. Currently,
c10 22 October 2012; 18:1:23
B R I N G I N G I T A L L T O G E T H E R¥ 115
IBM’s Watson is a major step toward integrating artificial intelligence
with the Big Data analytics space, yet the sheer size and complexity of
the system precludes its use for most analysts.
This means that other methodologies to empower users and ana-
lysts will have to be created, and they must remain affordable and be
simple to use. After all, the current bottleneck with processing Big Data
really has become the number of users who are empowered to ask
questions of the data and analyze them.
THE BIG DATA PIPELINE IN DEPTH
Big Data does not arise from a vacuum (except, of course, when studying
deep space). Basically, data are recorded from a data-generating source.
Gathering data is akin to sensing andobserving theworld aroundus, from
the heart rate of a hospital patient to the contents of an air sample to the
number of Web page queries to scientific experiments that can easily
produce petabytes of data.
However, much of the data collected is of little interest and can be
filtered and compressed by many orders of magnitude, which creates a
bigger challenge: the definition of filters that do not discard useful
information. For example, suppose one data sensor reading differs
substantially from the rest. Can that be attributed to a faulty sensor, or
are the data real and worth inclusion?
Further complicating the filtering process is how the sensors gather
data. Are they based on time, transactions, or other variables? Are the
sensors affected by environment or other activities? Are the sensors tied
to spatial and temporal events such as traffic movement or rainfall?
Before the data are filtered, these considerations and others must
be addressed. That may require new techniques and methodologies to
process the raw data intelligently and deliver a data set in manageable
chunks without throwing away the needle in the haystack. Further
filtering complications come with real-time processing, in which the
data are in motion and streaming on the fly, and one does not have
the luxury of being able to store the data first and process them later
for reduction.
Another challenge comes in the form of automatically generating
the right metadata to describe what data are recorded and how they
c10 22 October 2012; 18:1:23
116 ⁄ B I G D A T A A N A L Y T I C S
are recorded and measured. For example, in scientific experiments,
considerable detail on specific experimental conditions and procedures
may be required to be able to interpret the results correctly, and it is
important that such metadata be recorded with observational data.
When implemented properly, automated metadata acquisi-
tion systems can minimize the need for manual processing, greatly
reducing the human burden of recording metadata. Those who
are gathering data also have to be concerned with the data prove-
nance. Recording information about the data at their time of creation
becomes important as the data move through the data analysis
process. Accurate provenance can prevent processing errors from
rendering the subsequent analysis useless. With suitable provenance,
the subsequent processing steps can be quickly identified. Proving the
accuracy of the data is accomplished by generating suitable metadata
that also carry the provenance of the data through the data analysis
process.
Another step in the process consists of extracting and cleaning the
data. The information collected will frequently not be in a format
ready for analysis. For example, consider electronic health records in a
medical facility that consist of transcribed dictations from several
physicians, structured data from sensors and measurements (possibly
with some associated anomalous data), and image data such as scans.
Data in this form cannot be effectively analyzed. What is needed is an
information extraction process that draws out the required informa-
tion from the underlying sources and expresses it in a structured form
suitable for analysis.
Accomplishing that correctly is an ongoing technical challenge,
especially when the data include images (and, in the future, video).
Such extraction is highly application dependent; the information in an
MRI, for instance, is very different from what you would draw out of a
surveillance photo. The ubiquity of surveillance cameras and the
popularity of GPS-enabled mobile phones, cameras, and other portable
devices means that rich and high-fidelity location and trajectory (i.e.,
movement in space) data can also be extracted.
Another issue is the honesty of the data. For the most part, data are
expected to be accurate, if not truthful. However, in some cases, those
who are reporting the data may choose to hide or falsify information.
c10 22 October 2012; 18:1:23
B R I N G I N G I T A L L T O G E T H E R¥ 117

For example, patients may choose to hide risky behavior, or potential
borrowers filling out loan applications may inflate income or hide
expenses. The list is endless of ways in which data could be mis-
interpreted or misreported. The act of cleaning data before analysis
should include well-recognized constraints on valid data or well-
understood error models, which may be lacking in Big Data platforms.
Moving data through the process requires concentration on inte-
gration, aggregation, and representation of the data—all of which are
process-oriented steps that address the heterogeneity of the flood of
data. Here the challenge is to record the data and then place them into
some type of repository.
Data analysis is considerably more challenging than simply locating,
identifying, understanding, and citing data. For effective large-scale
analysis, all of this has to happen in a completely automated manner.
This requires differences in data structure and semantics to be expressed
in forms that are machine readable and then computer resolvable.
It may take a significant amount of work to achieve automated error-
free difference resolution.
The data preparation challenge even extends to analysis that uses
only a single data set. Here there is still the issue of suitable database
design, further complicated by the many alternative ways in which to
store the information. Particular database designs may have certain
advantages over others for analytical purposes. A case in point is the
variety in the structure of bioinformatics databases, in which infor-
mation on substantially similar entities, such as genes, is inherently
different but is represented with the same data elements.
Examples like these clearly indicate that database design is an
artistic endeavor that has to be carefully executed in the enterprise
context by professionals. When creating effective database designs,
professionals such as data scientists must have the tools to assist them
in the design process, and more important, they must develop tech-
niques so that databases can be used effectively in the absence of
intelligent database design.
As the data move through the process, the next step is querying
the data and then modeling it for analysis. Methods for querying and
mining Big Data are fundamentally different from traditional statistical
analysis. Big Data is often noisy, dynamic, heterogeneous, interrelated,
c10 22 October 2012; 18:1:23
118 ⁄ B I G D A T A A N A L Y T I C S

and untrustworthy—a very different informational source from small
data sets used for traditional statistical analysis.
Even so, noisy Big Data can be more valuable than tiny samples
because general statistics obtained from frequent patterns and cor-
relation analysis usually overpower individual fluctuations and often
disclose more reliable hidden patterns and knowledge. In addition,
interconnected Big Data creates large heterogeneous informa-
tion networks with which information redundancy can be explored
to compensate for missing data, cross-check conflicting cases, and
validate trustworthy relationships. Interconnected Big Data resources
can disclose inherent clusters and uncover hidden relationships
and models.
Mining the data therefore requires integrated, cleaned, trustwor-
thy, and efficiently accessible data, backed by declarative query and
mining interfaces that feature scalable mining algorithms. All of this
relies on Big Data computing environments that are able to handle the
load. Furthermore, data mining can be used concurrently to improve
the quality and trustworthiness of the data, expose the semantics
behind the data, and provide intelligent querying functions.
Virulent examples of introduced data errors can be readily found
in the health care industry. As noted previously, it is not uncommon
for real-world medical records to have errors. Further complicating the
situation is the fact that medical records are heterogeneous and are
usually distributed in multiple systems. The result is a complex ana-
lytics environment that lacks any type of standard nomenclature to
define its respective elements.
The value of Big Data analysis can be realized only if it can be
applied robustly under those challenging conditions. However, the
knowledge developed from that data can be used to correct errors and
remove ambiguity. An example of the use of that corrective analysis is
when a physician writes “DVT” as the diagnosis for a patient. This
abbreviation is commonly used for both deep vein thrombosis and
diverticulitis, two very different medical conditions. A knowledge base
constructed from related data can use associated symptoms or medi-
cations to determine which of the two the physician meant.
It is easy to see how Big Data can enable the next generation
of interactive data analysis, which by using automation can deliver
c10 22 October 2012; 18:1:23
B R I N G I N G I T A L L T O G E T H E R¥ 119
real-time answers. This means that machine intelligence can be used
in the future to direct automatically generated queries toward Big
Data—a key capability that will extend the value of data for automatic
content creation for web sites, populate hot lists or recommendations,
and to provide an ad hoc analysis of the value of a data set to decide
whether to store or discard it.
Achieving that goal will require scaling complex query-processing
techniques to terabytes while enabling interactive response times, and
currently this is a major challenge and an open research problem.
Nevertheless, advances are made on a regular basis, and what is a
problem today will undoubtedly be solved in the near future as pro-
cessing power increases and data become more coherent.
Solving that problem will require a technique that eliminates
the lack of coordination among database systems that host the data
and provide SQL querying, with analytics packages that perform
various forms of non-SQL processing such as data mining and sta-
tistical analyses. Today’s analysts are impeded by a tedious process of
exporting data from a database, performing a non-SQL process, and
bringing the data back. This is a major obstacle to providing the
interactive automation that was provided by the first generation of
SQL-based OLAP systems. What is needed is a tight coupling between
declarative query languages and the functions of Big Data analytics
packages that will benefit both the expressiveness and the perfor-
mance of the analysis.
One of the most important steps in processing Big Data is the
interpretation of the data analyzed. That is where business decisions can
be formed based on the contents of the data as they relate to a business
process. The ability to analyze Big Data is of limited value if the users
cannot understand the analysis. Ultimately, a decision maker, provided
with the result of an analysis, has to interpret these results. Data
interpretation cannot happen in a vacuum. For most scenarios, inter-
pretation requires examining all of the assumptions and retracing the
analysis process.
An important element of interpretation comes from the under-
standing that there are many possible sources of error, ranging from
processing bugs to improper analysis assumptions to results based on
erroneous data—a situation that logically prevents users from fully
c10 22 October 2012; 18:1:23
120 ⁄ B I G D A T A A N A L Y T I C S

ceding authority to a fully automated process run solely by the com-
puter system. Proper interpretation requires that the user understands
and verifies the results produced by the computer. Nevertheless, the
analytics platform should make that easy to do, which currently
remains a challenge with Big Data because of its inherent complexity.
In most cases, crucial assumptions behind the data are recorded
that can taint the overall analysis. Those analyzing the data need to
be aware of these situations. Since the analytical process involves
multiple steps, assumptions can creep in at any point, making doc-
umentation and explanation of the process especially important to
those interpreting the data. Ultimately that will lead to improved
results and will introduce self-correction into the data process as
those interpreting the data inform those writing the algorithms of
their needs.
It is rarely enough to provide just the results. Rather, one must
provide supplementary information that explains how each result
was derived and what inputs it was based on. Such supplementary
information is called the provenance of the data. By studying how best
to acquire, store, and query provenance, in conjunction with using
techniques to accumulate adequate metadata, we can create an
infrastructure that provides users with the ability to interpret the
analytical results and to repeat the analysis with different assump-
tions, parameters, or data sets.
BIG DATA VISUALIZATION
Systems that offer a rich palette of visualizations are important in con-
veying to the users the results of the queries, using a representation that
best illustrates how data are interpreted in a particular situation. In the
past, BI systems users were normally offered tabular content consisting
of numbers and had to visualize the data relationships themselves.
However, the complexity of Big Data makes that difficult, and graphical
representations of analyzed data sets are more informative and easier
to understand.
It is usually easier for a multitude of users to collaborate on the
analytical results when it is presented in a graphical form, simply
because interpretation is removed from the formula and the users are
c10 22 October 2012; 18:1:23
B R I N G I N G I T A L L T O G E T H E R¥ 121
shown the results. Today’s analysts need to present results in powerful
visualizations that assist interpretation and support user collaboration.
These visualizations should be based on interactive sources that
allow the users to click and redefine the presented elements, creating a
constructive environment where theories can be played out and other
hidden elements can be brought forward. Ideally, the interface will
allow visualizations to be affected by what-if scenarios or filtered by
other related information, such as date ranges, geographical locations,
or statistical queries.
Furthermore, with a few clicks the user should be able to go deeper
into each piece of data and understand its provenance, which is a key
feature to understanding the data. Users need to be able to not only see
the results but also understand why they are seeing those results.
Raw provenance, particularly regarding the phases in the analytics
process, is likely to be too technical for many users to grasp completely.
One alternative is to enable the users to play with the steps in the
analysis—make small changes to the process, for example, or modify
values for some parameters. The users can then view the results of
these incremental changes. By these means, the users can develop an
intuitive feeling for the analysis and also verify that it performs as
expected in corner cases, those that occur outside normal circum-
stances. Accomplishing this requires the system to provide convenient
facilities for the user to specify analyses.
BIG DATA PRIVACY
Data privacy is another huge concern, which increases as one equates
such privacy with the power of Big Data. For electronic health records,
there are strict laws governing what can and cannot be done. For other
data, regulations, particularly in the United States, are less forceful.
However, there is great public fear about the inappropriate use of
personal data, particularly through the linking of data from multiple
sources. Managing privacy is effectively both a technical and a socio-
logical problem, and it must be addressed jointly from both perspec-
tives to realize the promise of Big Data.
Take, for example, the data gleaned from location-based services.
A situation in which new architectures require a user to share his
c10 22 October 2012; 18:1:23
122 ⁄ B I G D A T A A N A L Y T I C S
or her location with the service provider results in obvious privacy
concerns. Hiding the user’s identity alone without hiding the location
would not properly address these privacy concerns.
An attacker or a (potentially malicious) location-based server can
infer the identity of the query source from its location information. For
example, a user’s location information can be tracked through several
stationary connection points (e.g., cell towers). After a while, the user
leaves a metaphorical trail of bread crumbs that lead to a certain res-
idence or office location and can thereby be used to determine the
user’s identity.
Several other typesof private information, suchashealth issues (e.g.,
presence in a cancer treatment center) or religious preferences
(e.g., presence in a church), can also be revealed by just observing
anonymous users’movement and usage pattern over time.
Furthermore, with the current platforms in use, it is more difficult
to hide a user location than to hide his or her identity. This is a result
of how location-based services interact with the user. The location of
the user is needed for successful data access or data collection, but the
identity of the user is not necessary.
There are many additional challenging research problems, such as
defining the ability to share private data while limiting disclosure
and ensuring sufficient data utility in the shared data. The existing
methodology of differential privacy is an important step in the right
direction, but it unfortunately cripples the data payload too severely to
be useful in most practical cases.
Real-world data are not static in nature, but they get larger and
change over time, rendering the prevailing techniques almost useless,
since useful content is not revealed in any measurable amount for
future analytics. This requires a rethinking of how security for infor-
mation sharing is defined for Big Data use cases. Many online services
today require us to share private information (think of Facebook
applications), but beyond record-level access control we do not
understand what it means to share data, how the shared data can be
linked, and how to give users fine-grained control over this sharing.
Those issues will have to be worked out to preserve user security
while still providing the most robust data set for Big Data analytics.
c10 22 October 2012; 18:1:23
B R I N G I N G I T A L L T O G E T H E R¥ 123

c10 22 October 2012; 18:1:23

Appendix
Supporting Data
This appendix contains two white papers:
1. “The MapR Distribution for Apache Hadoop”
2. “High Availability: No Single Points of Failure”
Each paper offers its own take and provides additional knowledge
for those looking to leverage Big Data solutions.
bapp 23 October 2012; 12:47:47
125

ª 2011 MapR, Inc. Confidential. All Rights Reserved.
bapp 23 October 2012; 12:47:47
126
bapp 23 October 2012; 12:48:0
127
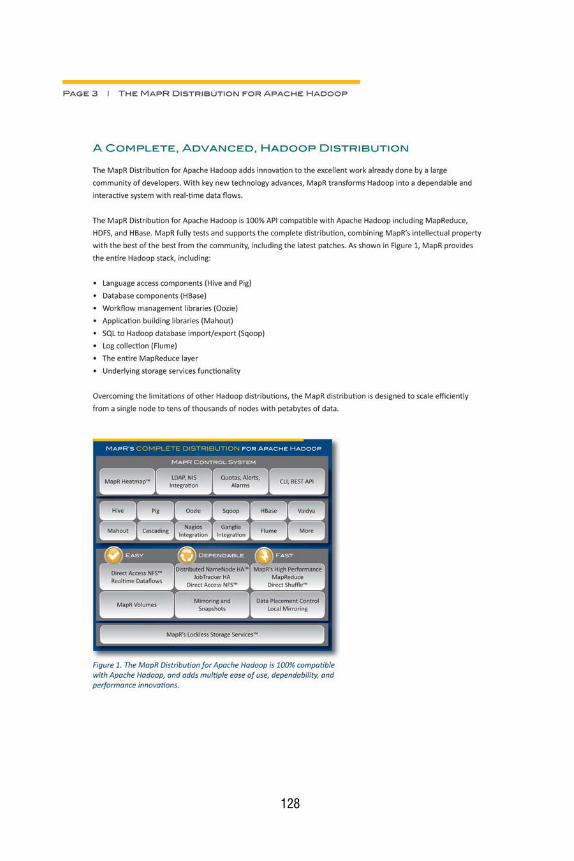
bapp 23 October 2012; 12:48:12
128
bapp 23 October 2012; 12:48:25
129
bapp 23 October 2012; 12:48:36
130
bapp 23 October 2012; 12:48:49
131
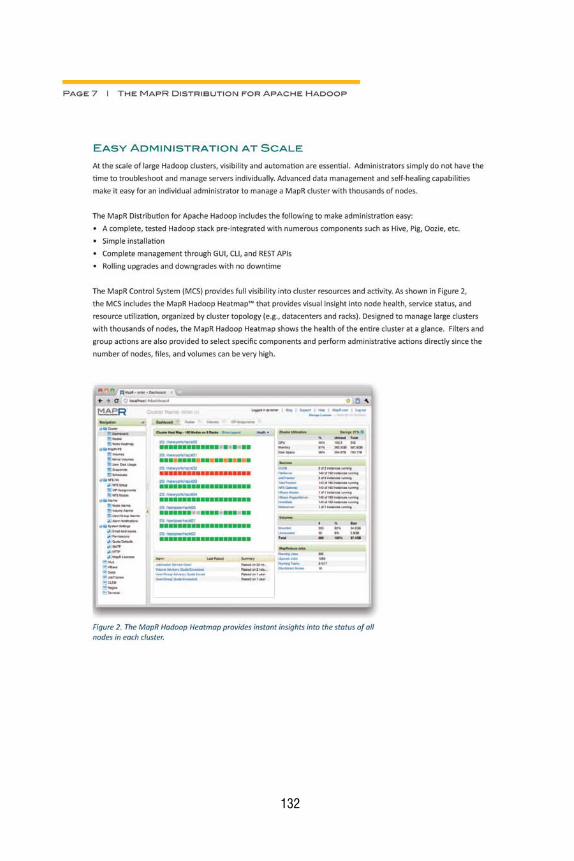
bapp 23 October 2012; 12:49:2
132

bapp 23 October 2012; 12:49:15
133

bapp 23 October 2012; 12:49:27
134

bapp 23 October 2012; 12:49:40
135

bapp 23 October 2012; 12:49:51
136

bapp 23 October 2012; 12:50:2
137

bapp 23 October 2012; 12:50:15
138
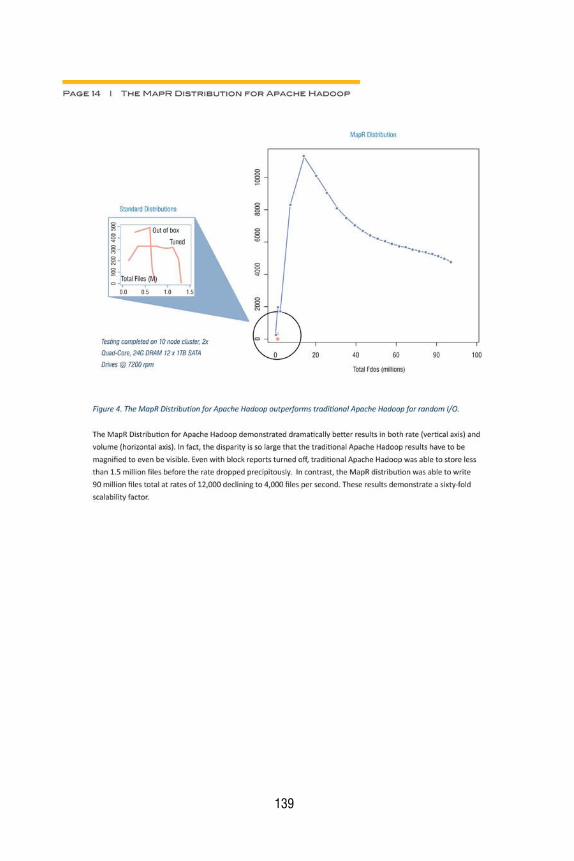
bapp 23 October 2012; 12:50:26
139

bapp 23 October 2012; 12:50:36
140
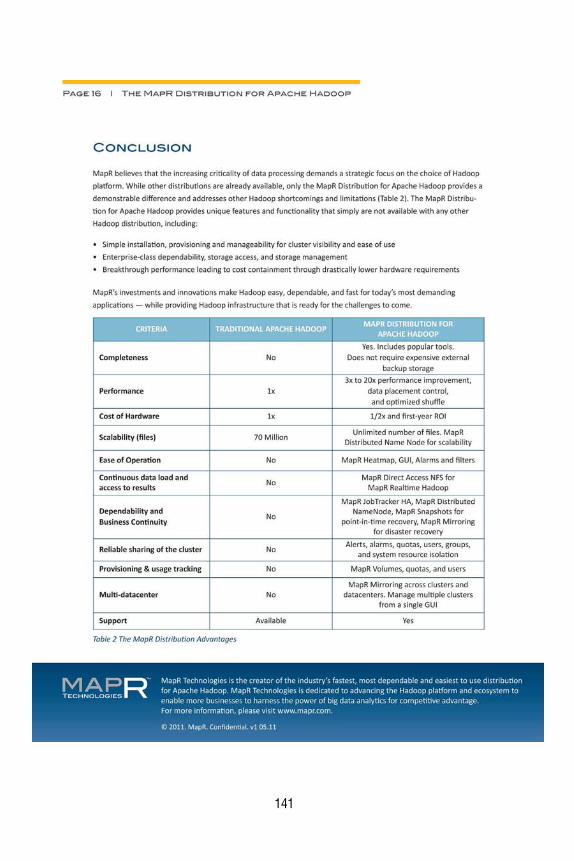
bapp 23 October 2012; 12:50:47
141
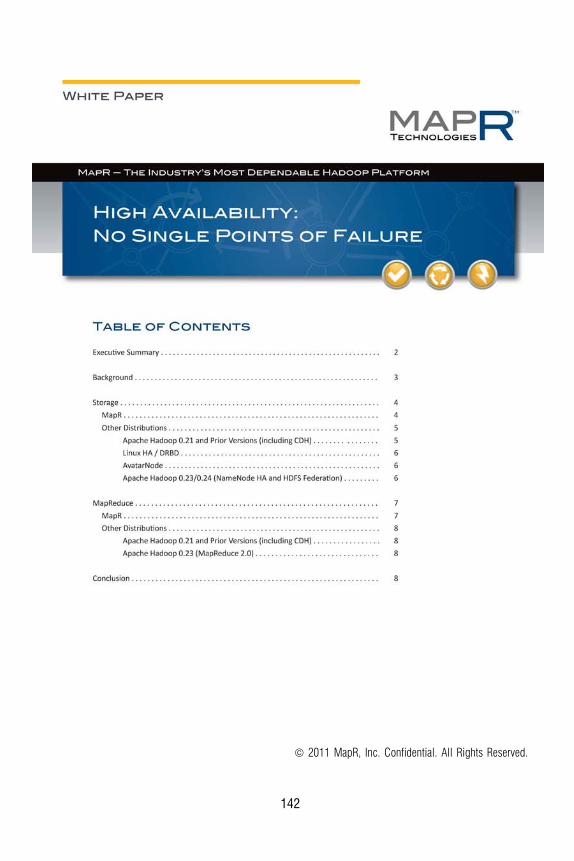
ª 2011 MapR, Inc. Confidential. All Rights Reserved.
bapp 23 October 2012; 12:50:57
142
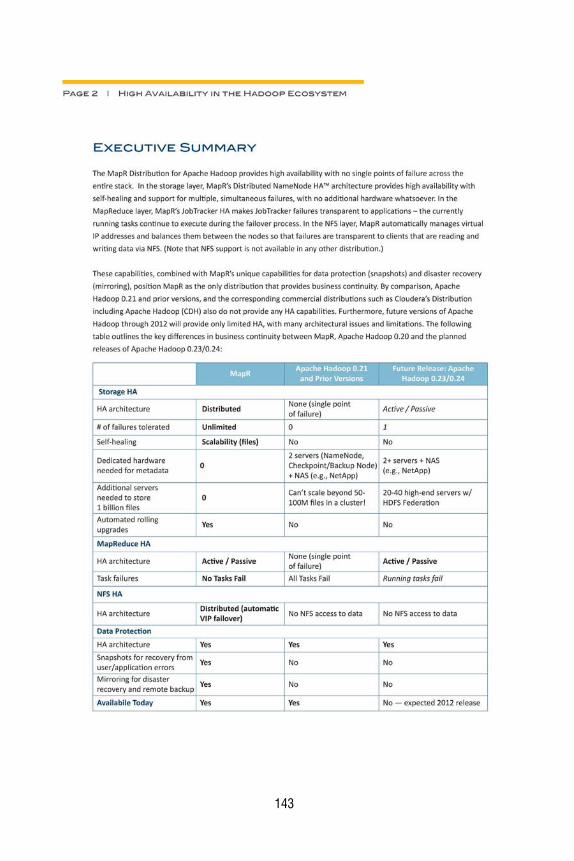
bapp 23 October 2012; 12:51:8
143

bapp 23 October 2012; 12:51:20
144
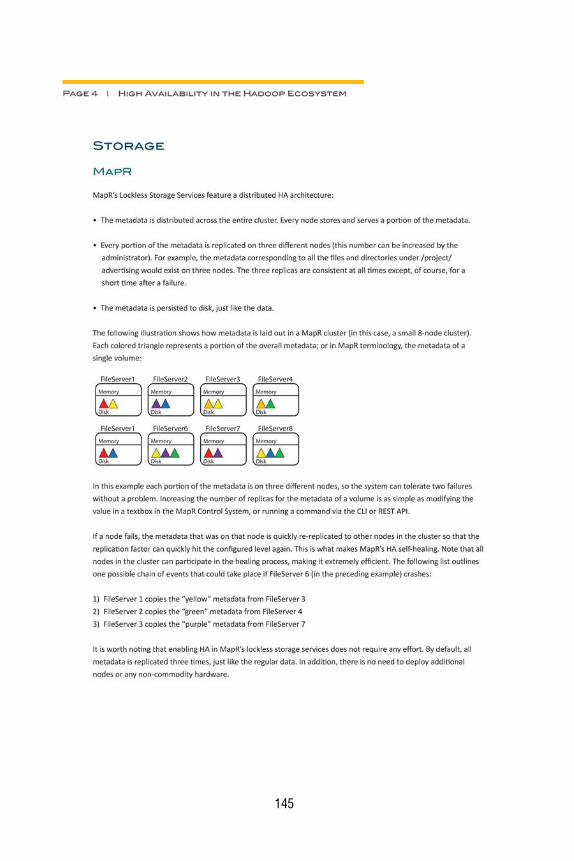
bapp 23 October 2012; 12:51:32
145

bapp 23 October 2012; 12:51:43
146

bapp 23 October 2012; 12:51:54
147
bapp 23 October 2012; 12:52:6
148
bapp 23 October 2012; 12:52:17
149

bapp 23 October 2012; 12:52:28

About the Author
Frank J. Ohlhorst is an award-winning technology journalist, pro-
fessional speaker, and IT business consultant with over 25 years of
experience in the technology arena. Frank has written for several
leading technology publications, including ComputerWorld, TechTarget,
CRN, Network Computing, PCWorld, ExtremeTech, and Tom’s Hardware.
Frank has contributed to business publications, including Entrepreneur
and BNET, and to multiple technology books. He has written several
white papers, case studies, reviewers’ guides, and channel guides for
leading technology vendors.
babout 22 October 2012; 18:2:47
151

babout 22 October 2012; 18:2:47
Index
AAbstraction tools, 54
Access to data, 32, 50, 63, 69
Accuracy of data, 103–104, 117–118
Activity logs, 64
Algorithms
accuracy, 18, 103–104
anomalies, 103
data mining, 119
evolution of, 90–91
real-time results, 104
scenarios, 5
statistical applications, 4
text analytics, 59
Amazon, 11–12, 27
Amazon S3, 44
Analysis of data. See Data analysis
Anomalies, value of, 101–103
Apple, 102
Applications, 4, 52–57, 70
Archives, 51
Artificial intelligence, 86–87, 116, 120
Astronomy, 114
Auto-categorization, 57
Automated metadata acquisition
systems, 116–117
Availability of data, 63, 71–72
BBA. See Business analytics (BA)
BackType, 18
Backup systems, 66–67
Batch processing, 53, 54
Behavioral analytics, 17–18
Benefits analysis, 23–24
Best practices, 93–109
anomalies, 101–103
expediency-accuracy tradeoff,
103–104
high-value opportunities focus,
94–95
in-memory processing, 104–109
project management processes,
98–101
project prerequisites, 93–94
thinking big, 95–96
worst practice avoidance, 96–98
BI. See Business intelligence (BI)
Big Data and Big Data analytics
analysis categories, 4–5
application platforms, 52–57
best practices, 93–109
business case development, 21–28
challenges, 6–7, 112
classifications, 5–6
components, 47
defined, 1–2, 21–22, 78
evolution of, 77–91
examples of, 113–115
4Vs of, 3–4
goal setting, 39–40
introduction, ix–xi
bindex 22 October 2012; 18:15:22
153
Big Data and Big Data analytics
(continued)
investment in, 113
path to, 112–113
phases of, 115–121
potential of, 111
privacy issues, 122–123
processing, 59–61, 104–109
role of, 2–3
security (See Security)
sources of, 37–46
storage, 7, 25–28, 47–52
team development, 29–35
technologies (See Technologies)
value of, 11–19
visualizations, 121–122
Big Science, 78–80
BigSheets, 43–44
Bigtable, 26, 27
Bioinformatics, 16, 114, 118
Biomedical industry, 16
Blekko, 14
Business analytics (BA), 9, 39
Business case
best practices, 96
data collection and storage options,
25–28
elements of, 22–25
introduction, 21–22
Business intelligence (BI)
as Big Data analytics foundation,
112–113
Big Data analytics team
incorporation, 30, 34
Big Data impact, 21, 26
defined, 4
extract, transform, and load
(ETL), 9
information technology and, 30
in-memory processing, 107
limitations of, 96
marketing campaigns, 46
risk analysis, 24–25
storage capacity issues, 48
unstructured data, 5–6
visualizations, 121
Business leads, 99
Business logic, 54–55
Business objectives, 45, 94–95, 99
Business rules, 99–100
CCapacity of storage systems,
48–49
Cassandra, 27
Census data, 77–78
CERN, 13, 16
Citi, 86–87
Classification of data, 5–6, 65
Cleaning, 117, 118
Click-stream data, 16, 17
Cloud computing, 28, 56, 60–61
Cloudera, 28
Combs, Nick, 83
Commodity hardware, 52
Common Crawl Corpus, 44
Communication, 98
Competition, 22, 109
Compliance, 50–51, 67–72
Computer security officers (CSOs),
73–74
Consulting firms, 33
Core capabilities, data analytics
team, 32
Costs, 24, 51–52, 107
Counterintelligence mind-set, 75
CRUD (create, retrieve, update,
delete) applications, 54
Cryptographic keys, 70
Culture, corporate, 34–35, 44
bindex 22 October 2012; 18:15:22
154 ⁄ I N D E X
Customer needs, 108
Cutting, Doug, 26
DData
defined, ix
growth in volume of, 2, 14–15,
25–26, 40–42, 46, 80, 84, 104
value of, 11–19
See also Big Data and Big Data
analytics
Data analysis
categories, 4–5
challenges, 112, 115–116, 118
complexity of, 17–18
as critical skill for team members,
32, 33
data accuracy, 117–118
evolution of, 79
importance of, 113
process, 118–121
technologies, 43–44, 96
Database design, 118
Data classification, 5–6, 65
Data discovery, 33, 42
Data extraction, 9, 59, 117
Data integration
technologies, 6, 53, 58
value creation, 112
Data interpretation, 120–122
Data manipulation, 33
Data migration, 50
Data mining
components, 38
as critical skill for team members,
32, 33
defined, 4, 19
examples, 84, 85
methods, 118–119
technologies, 43
Data modeling, 5, 115–116
Data protection. See Security
Data retention, 64–65
Data scientists, 29–30, 31, 32–33
Data sources, 37–46
growth of, 40–43
identification of, 37, 38–40, 43–44
importation of data into
platform, 38
public information, 43–44
Data visualization, 33, 43–44,
121–122
Data warehouses, 25, 70–71, 96
DevOPs, 45
Discovery of data, 33, 42
Disk cloning, 51
Disruptive technologies, 21
Distributed file systems, 26, 60.
See also Hadoop
Dynamo, 27
Ee-commerce, 17, 102
Economist, 104
e-discovery, 42
Education, 114
80Legs, 43, 44
Electronic medical records
compliance, 68
data errors, 119
data extraction, 117
privacy issues, 122
trends, 41
Electronic transactions, 38
EMC Corporation, 83
Employees
data analytics team membership,
29–35
monitoring of, 74–75
training, 45, 74
bindex 22 October 2012; 18:15:22
I N D E X¥ 155
Encryption, 70, 72
Entertainment industry, 41
Entity extraction, 59
Entity relation extraction, 59
Errors, 119
Event-driven data distribution, 56
Evidence-based medicine, 88
Evolution of Big Data, 77–91
algorithms, 90–91
current issues, 84–85
future developments, 85–90
modern era, 80–83
origins of, 77–80
Expectations, 98
Expediency-accuracy tradeoff,
103–104
External data, 38, 40
Extract, transform, and load (ETL), 9
Extractiv, 43
FFacebook, 12, 27
Filters, 116
Financial controllers, 109
Financial sector, 16–17, 91, 109
Financial transactions, 42
Flexibility of storage systems, 50
4Vs of Big Data, 3–4
GGartner, 104
General Electric (GE), 82–83
Gephi, 44
Goal setting, 39–40
Google, 12–13, 26, 111
Google Books Ngrams, 44
Google Refine, 43
Governance, 32, 96
Government agencies, 41
Grep, 43
HHadoop
advantages and disadvantages of,
7–10, 26, 28, 46, 60, 69, 85
design and function of, 7–8,
84–85, 103
event-processing framework, 53
future, 85
origins of, 26
vendor support, 46
Yahoo’s use, 26–27
HANA, 85
HBase, 9–10
HDFS, 9–10
Health care
Big Data analytics opportunities,
114
Big Data trends, 41
compliance, 68
evolution of Big Data, 87–90
See also Electronic medical
records
Hibernate, 54
High-value opportunities, 94–95
History. See Evolution of Big Data
Hive, 9, 54
Hollerith Tabulating System, 78
Hortonworks, 28
IIBM, 2, 86–87, 116
IDC (International Data
Corporation), 84, 104
IDC Digital Universe Study, 46
Information professionals, 32–33,
97–98, 118
Information technology (IT)
Big Data analytics team
incorporation, 30, 34
business value focus, 96
bindex 22 October 2012; 18:15:22
156 ⁄ I N D E X
database management as
percentage of budget, 107
data governance, 32
evolution of, 79
in-memory processing impact, 107
pilot programs, 61
user analysis, 100–101
In-memory processing, 55–56, 104–
109, 116
Input-output operations per second
(IOPS), 50
Integration of data, 6, 53, 58, 112
Intellectual property, 72–75
Interconnected data, 119
Internal data, 38, 39–40
International Biological Program, 79
International Data Corporation,
84, 104
International Geophysical Year
project, 79
Interpretation of data, 120–122
JJahanian, Farnam, 80–82
JPA, 54
KKelly, Nuala O’Connor, 82–83
Kogan, Caron, 83
LLabeling of confidential
information, 74
Latency of storage systems, 49–50
Legal issues, 42, 64, 75
LexisNexis Risk Solutions, 83
Liability, 64
Life sciences, 41
LivingSocial, 19
Location-based services, 122–123
Lockheed Martin, 83
Log-in screens, 74
Logistics, 41, 84
Logs, activity, 64
Loyalty programs, 16
MMaintenance plans, 100
Manhattan Project, 78–79
Manipulation of data, 33
Manufacturing, in-memory
processing technology, 109
Mapping tools, 54
MapR, 28
MapReduce
advantages, 46, 54, 55
built-in support for integration, 53
defined, 8
Hadoop, 9
relational database management
systems, 58
Marketing campaigns, 46
Memory, brain’s capacity, ix
Metadata, 49, 57, 116–117
Metrics, 35
Mining. See Data mining
Mobile devices, 43, 107–108
Modeling, 5, 115–116
Moore’s Law, 25–26
Mozenda, 43
NNAS, 7
National Oceanic and Atmospheric
Administration (NOAA), 2
National Science Foundation (NSF),
80, 82
Natural language recognition,
57, 59
New York Times, 2
bindex 22 October 2012; 18:15:22
I N D E X¥ 157

Noisy data, 119
NoSQL (Not only SQL), 53,
58–59, 69
OObject-based storage systems, 49
OLAP systems, 120
OOZIE, 9
OpenHeatMap, 44
Open source technologies
availability, 28
options, 43–44, 45
pilot projects, 61
See also Hadoop
Organizational structure, 30–31
Outsourcing, 61
PParallel processing, 55
Patents, 72–75
Pentaho, 9
Performance measurement, 35
Performance-security tradeoff,
63–64, 71–72
Perlowitz, Bill, 83
Pharmaceutical companies, 2
Pig, 9
Pilot projects, 9–10, 61
Planning, 44–46, 93–94, 99
Point-of-sale (POS) data, 16
Predictive analysis, 4–5, 40
Privacy, 122–123
Problem identification, 45
Processing, 59–61, 104–109
Project management processes,
98–101
Project planning, 44–46, 93–94, 99
Public information sources, 43–44
Purging of data, 64–65
QQueries, 100, 118–119, 120
RRAM-based devices, 55–56
Real-time analytics, 53, 104–109, 116
Recruitment of data analytics
personnel, 32–33
Red Hat, 54
Relational database management
system (RDBMS), 58, 67
Research and development (R&D),
82
Resource description framework
(RDF), 58–59
Results, 121
Retailers
anomalies, 102
Big Data use, 84, 109
click-stream data, 16, 17
data sources, 41
goal setting, 39–40
in-memory processing
technology, 109
organizational culture, 34
Retention of data, 64–65
Return on investment (ROI), 25
Risk analysis, 24–25
SSANS, 7
SAP, 85
Scale-out storage solutions, 48–49
Scaling, 95, 120
Scenarios, 5, 121–122
Schmidt, Erik, 80
Science, 16, 78–83, 114
Scope of project, 24
Scrubbing programs, 101
bindex 22 October 2012; 18:15:22
158 ⁄ I N D E X
Security
backup systems, 66–67
challenges, 49, 63–64
compliance issues, 67–72
data classification, 65
data retention, 64–65
intellectual property, 72–75
rules, 71–72
technologies, 69–70, 74
Semantics
event-driven data distribution
support, 56
mapping of, 55
technologies, 58–59
trends, 57
Semistructured data, 6
Sensor data
filtering, 116
growth of, 15, 46
types, 2, 41, 84
Silos, 65
Sloan Digital Sky Survey, 114
Small and medium businesses
(SMBs), 13–15, 31, 52
Smart meters, 43
Smartphones, 43
Snapshots, 51
Social media, 42, 59, 71, 102
Software. See Technologies
Sources of data. See Data sources
Space program, 78–79
Specificity of information, 108
Speed-accuracy tradeoff, 103–104
Spring Data, 54
SQL
limitations, 55
NoSQL Integration, 53, 58
scaling, 95, 120
Stale data, 49
Statistical applications, 4
Storage, 7, 25–28, 47–52
Storm, 18–19
Structured data, 5–6, 17
Success, measurement of, 35
Supplementary information, 121
Supply chain, 108–109
TTableau Public, 44
Taxonomies, 57
Team members, 29–35, 97–98
Technologies
application platforms, 52–57
Cassandra, 27
cloud computing, 28, 56, 60–61
commodity hardware, 52
decision making, 28, 45–46
processing power, 59–61, 104–109
security, 69–70, 74
storage, 7, 25–28, 47–52
Web-based tools, 43–44
worst practices, 96–97
See also Hadoop
Telecommunications, 41
Text analytics, 59
Thin provisioning, 51
T-Mobile, 85
Training, 45, 74
Transportation, 41
Trends, 102
Trusted applications, 70
Turk, 43
Twitter, 18–19, 103
UUnited Parcel Service (UPS), 84
Unstructured data
complexity of, 17
bindex 22 October 2012; 18:15:22
I N D E X¥ 159

United Parcel Service (UPS)
(continued)
defined, 6
forms, 57
growth of, 5, 87, 104
project goal setting, 39–40
social media’s collection, 71
technologies, 18–19, 57–59
varieties of, 3
U.S. census, 77–78
User analysis, 100–101
Utilities sector, 41
VValue, extraction of, 3–5, 57
Variety, 3
Velocity, 3
Vendor lock-in, 72
Veracity, 3
Videos, 59
Video surveillance, 41
Villanustre, Flavio, 83
Visualization, 33, 43–44, 121–122
Volume, 3
WWalt Disney Company, 2
Watson, 86–87, 116
Web-based technologies, 43–44
Web sites
click-stream data, 16, 17
logs, 38
traffic distribution, 14
White-box systems, 52
Worst practices, 96–98
Wyle Laboratories, 83
XXML, 6, 58
YYahoo, 26–27
bindex 22 October 2012; 18:15:22
160 ⁄ I N D E X