big data for development: new opportunities for emerging markets presentation to access to...
TRANSCRIPT
Big Data for Development: New opportunities for emerging markets
Presentation to Access to Information Unit, Bangladesh Prime Minister’s Office, Dhaka
October 2015
This work was carried out with the aid of a grant from the International Development Research Centre, Canada and the Department for International Development UK..

What kinds of comprehensive big data are available in emerging economies?
• Administrative data– E.g., digitized medical records, insurance records, tax records
• Commercial transactions (transaction-generated data)– E.g., Stock exchange data, bank transactions, credit card records,
supermarket transactions connected by loyalty card number
• Sensors and tracking devices– E.g., road and traffic sensors, climate sensors, equipment &
infrastructure sensors, mobile phones communicating with base stations, satellite/ GPS devices
• Online activities/ social media– E.g., online search activity, online page views, blogs/ FB/ twitter posts
2
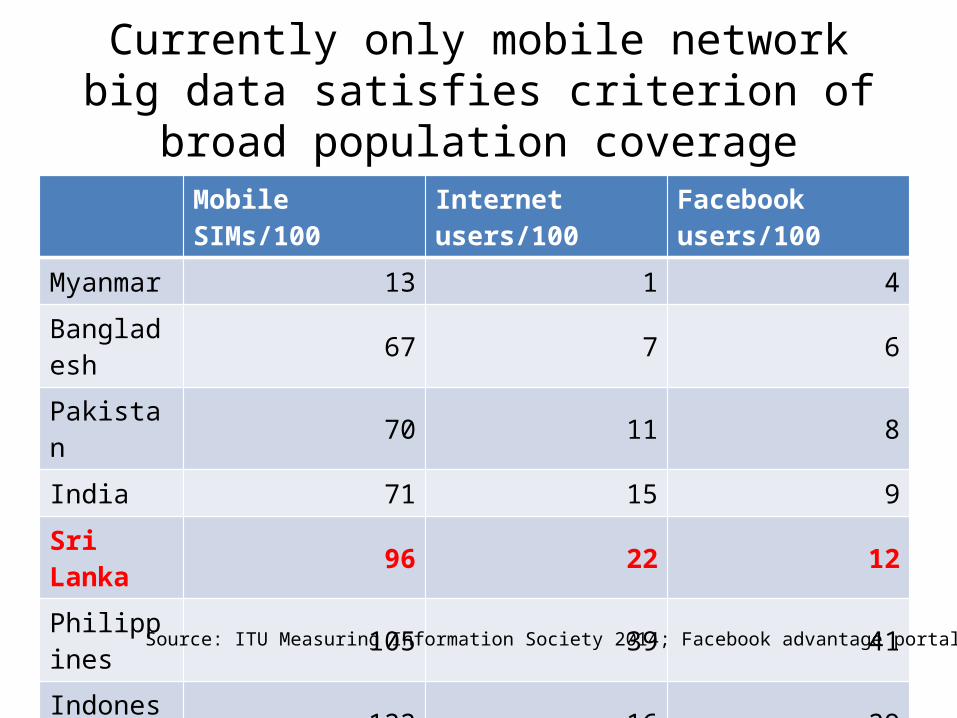
Currently only mobile network big data satisfies criterion of broad population coverage
3
Mobile SIMs/100 Internet users/100 Facebook users/100
Myanmar 13 1 4
Bangladesh 67 7 6
Pakistan 70 11 8
India 71 15 9
Sri Lanka 96 22 12
Philippines 105 39 41
Indonesia 122 16 29
Thailand 138 29 46
Source: ITU Measuring Information Society 2014; Facebook advantage portal
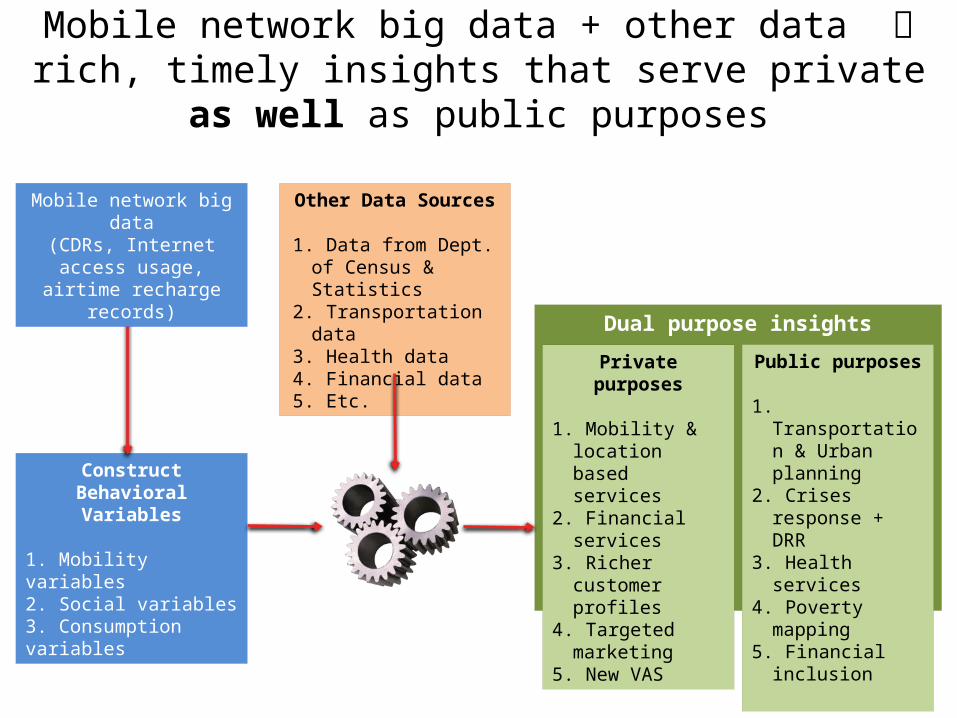
Mobile network big data + other data rich, timely insights that serve private as well as public purposes
4
Construct Behavioral Variables
1. Mobility variables2. Social variables3. Consumption variables
Other Data Sources
1. Data from Dept. of Census & Statistics
2. Transportation data3. Health data4. Financial data5. Etc.
Dual purpose insights
Private purposes
1. Mobility & location based services
2. Financial services3. Richer customer
profiles4. Targeted
marketing5. New VAS
Public purposes
1. Transportation & Urban planning
2. Crises response + DRR
3. Health services4. Poverty mapping5. Financial
inclusion
Mobile network big data(CDRs, Internet access usage, airtime recharge
records)
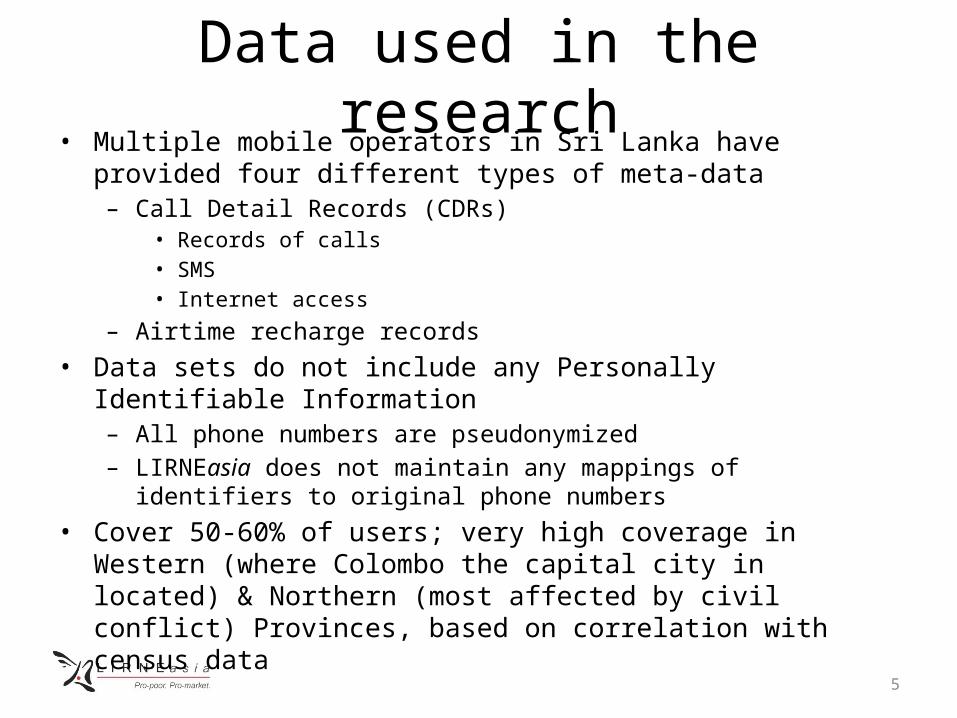
Data used in the research• Multiple mobile operators in Sri Lanka have provided four different types
of meta-data– Call Detail Records (CDRs)
• Records of calls• SMS• Internet access
– Airtime recharge records• Data sets do not include any Personally Identifiable Information
– All phone numbers are pseudonymized – LIRNEasia does not maintain any mappings of identifiers to original phone
numbers• Cover 50-60% of users; very high coverage in Western (where Colombo
the capital city in located) & Northern (most affected by civil conflict) Provinces, based on correlation with census data
5
Actions to improve data sharing
• Reduce transaction costs– Guidelines on managing privacy and competitive
implications developed; being consulted with experts and stakeholders
• Language can be used in non-disclosure agreements
– Work ongoing to reduce pseudonymization burdens to companies
6
Work performed by collaborative inter-disciplinary teams
• LIRNEasia/ MIT– Gabriel Kreindler (Economics)– Yuhei Miyauchi (Economics)
• Other US Universities– Prof. Joshua Blumenstock (U
Washington, School of Information)
• Data Science– Saad Gulzar (NYU Poli Sci)
• Political Science
• Advisors:– Dr. Srinath Perera (WSO2)– Prof. Louiqa Rashid (U of
Maryland)
7
• LIRNEasia– Sriganesh Lokanathan– Kaushalya Madhawa– Danaja Maldeniya– Prof. Rohan Samarajiva– Dedunu Dhananjaya – Madhushi Bandara– Nisansa de Silva (moved on to U of
Oregon)
• University of Moratuwa– Prof. Amal Kumarage
• Transport – Dr. Amal Shehan Perera
• Data Mining– Undergraduates working on
projects

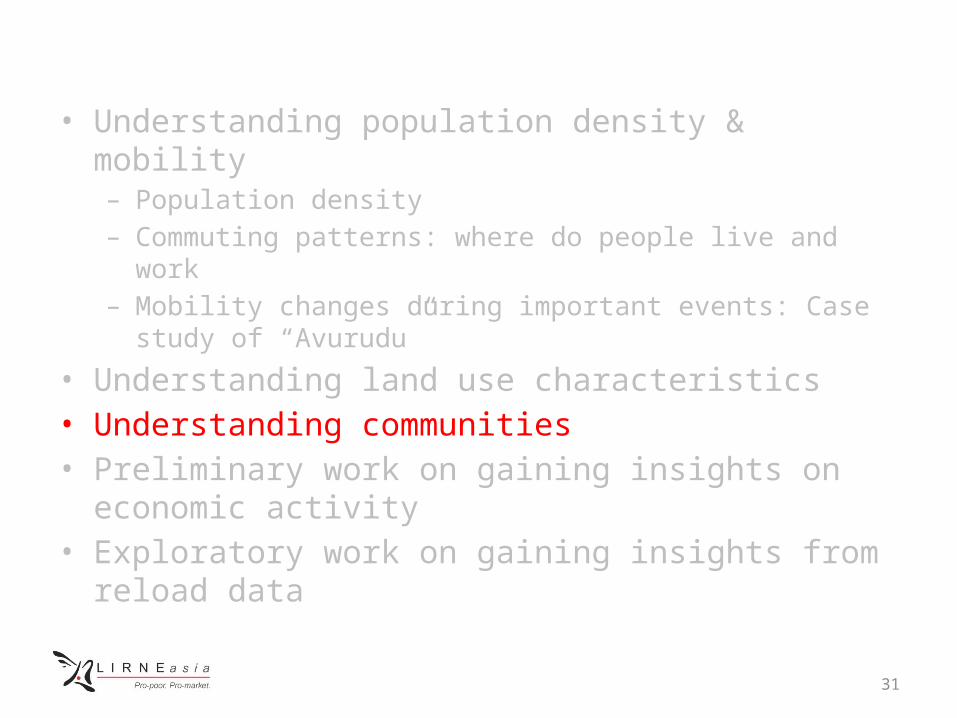
Illustrative findings• Understanding population density & mobility
– Population density– Commuting patterns: where do people live and work– Mobility changes during important events: Case study of “Avurudu”
• Understanding land use characteristics• Understanding communities• Preliminary work on gaining insights on economic activity• Exploratory work on gaining insights from reload data
8

• Understanding population density & mobility– Population density– Commuting patterns: where do people live and work– Mobility changes during important events: Case study of “Avurudu”
• Understanding land use characteristics• Understanding communities• Preliminary work on gaining insights on economic activity• Exploratory work on gaining insights from reload data
9
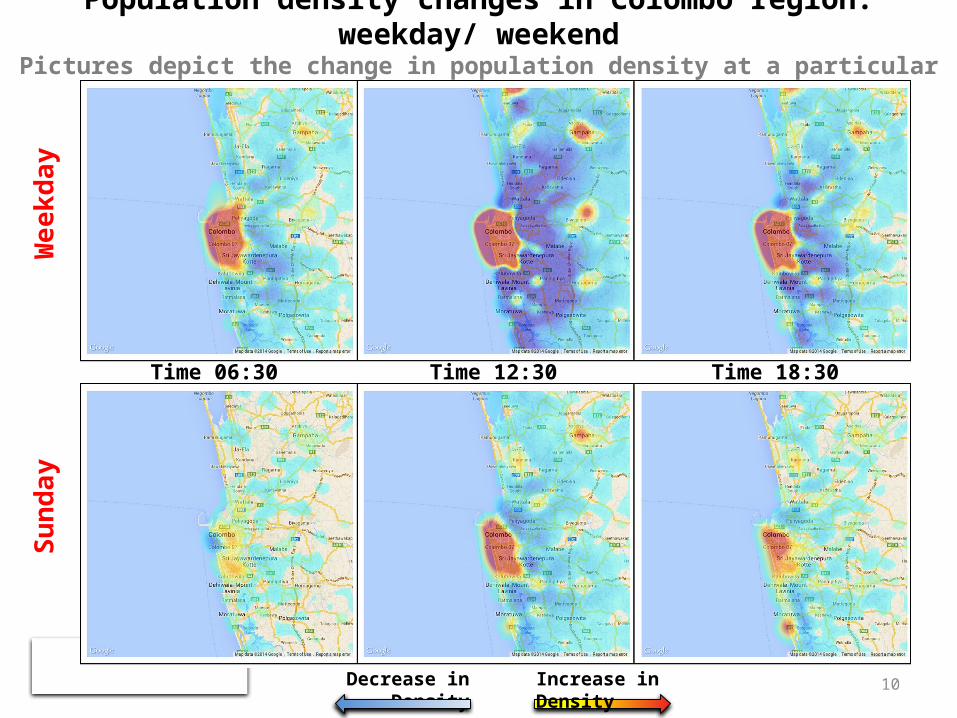
Population density changes in Colombo region: weekday/ weekendPictures depict the change in population density at a particular time relative to midnight
10
We
ekd
ay
Su
nd
ay
Decrease in Density Increase in Density
Time 18:30Time 12:30Time 06:30
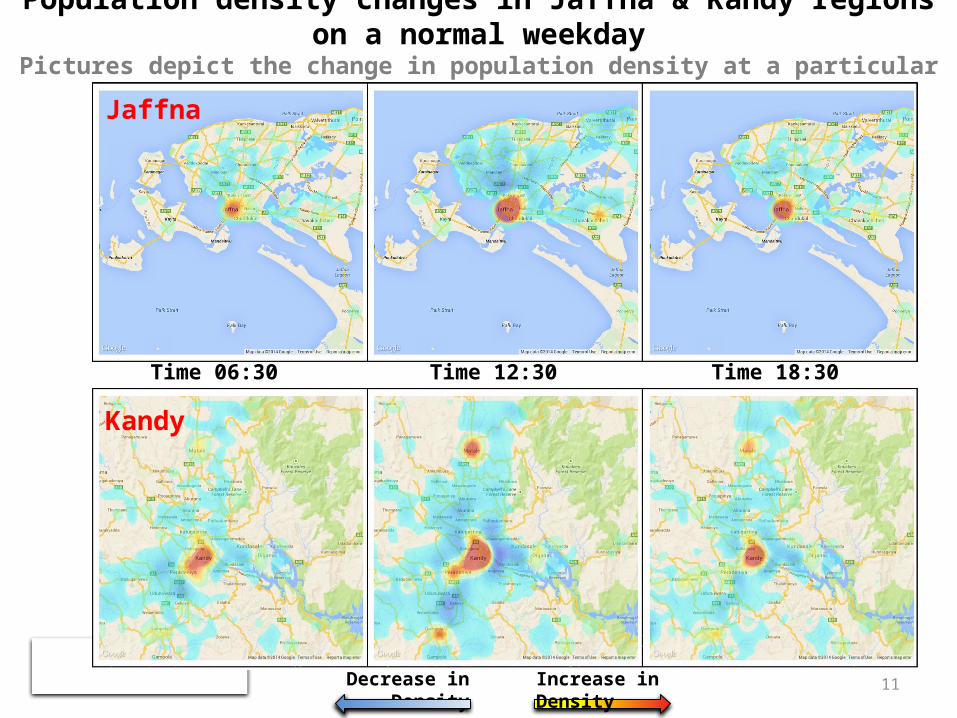
Population density changes in Jaffna & Kandy regions on a normal weekdayPictures depict the change in population density at a particular time relative to midnight
11Decrease in Density Increase in Density
Time 18:30Time 12:30Time 06:30
Jaffna
Kandy
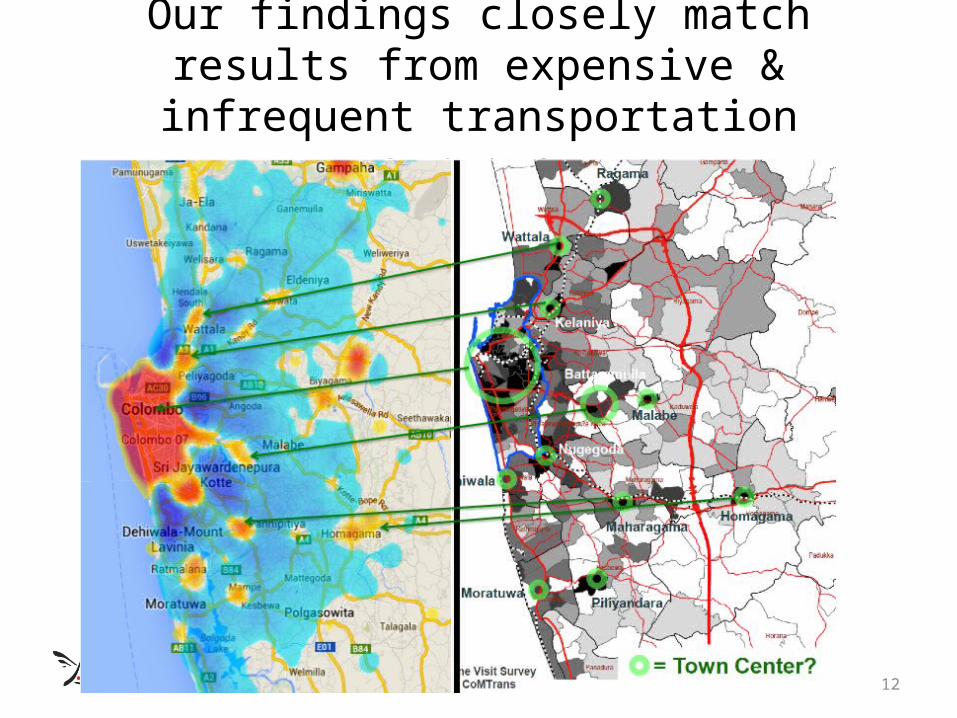
Our findings closely match results from expensive & infrequent transportation surveys
12
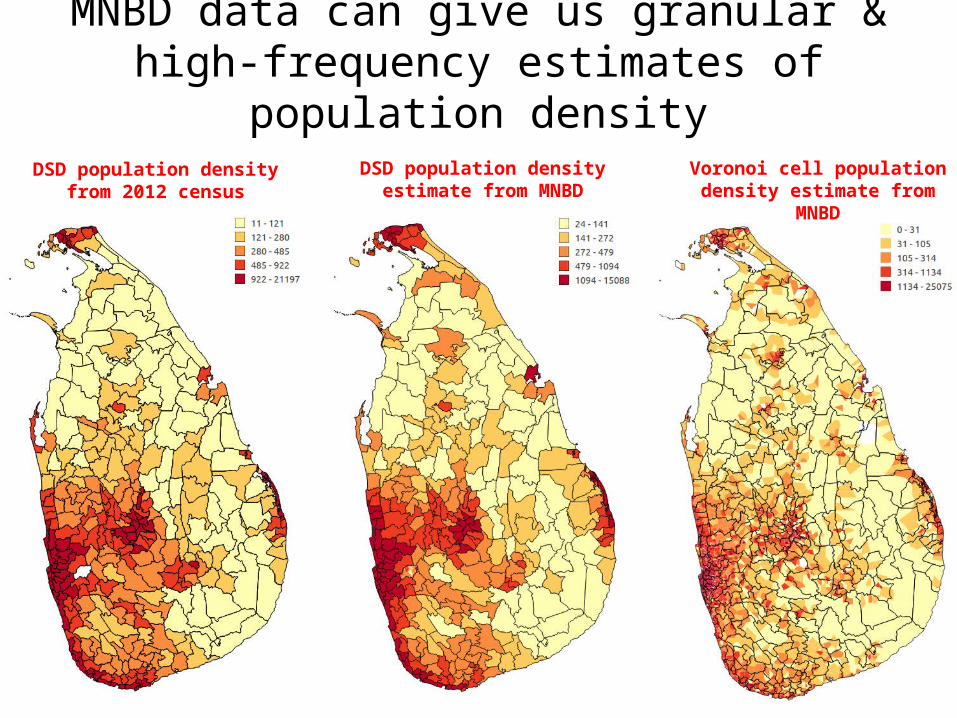
MNBD data can give us granular & high-frequency estimates of population density
13
DSD population density from 2012 census
DSD population density estimate from MNBD
Voronoi cell population density estimate from MNBD
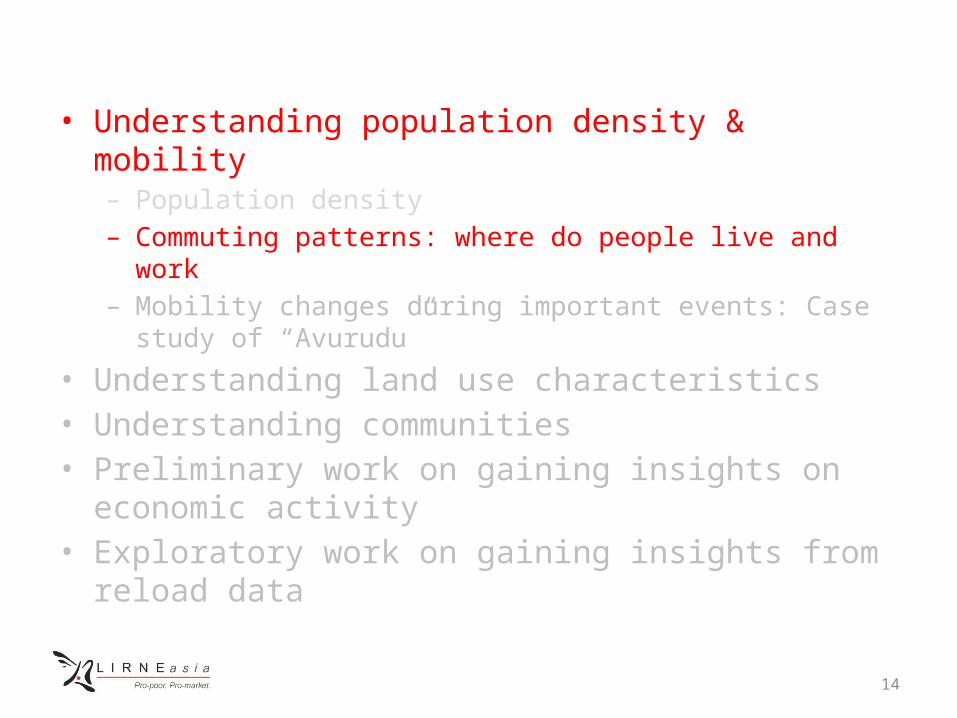
• Understanding population density & mobility– Population density– Commuting patterns: where do people live and work– Mobility changes during important events: Case study of “Avurudu”
• Understanding land use characteristics• Understanding communities• Preliminary work on gaining insights on economic activity• Exploratory work on gaining insights from reload data
14

15
46.9% of Colombo City’s daytime population comes from the surrounding regions
Home DSD %age of Colombo’s daytime population
Colombo city 53.1
1. Maharagama 3.7
2. Kolonnawa 3.5
3. Kaduwela 3.3 4. Sri Jayawardanapura
Kotte 2.9
5. Dehiwala 2.6
6. Kesbewa 2.5
7. Wattala 2.5
8. Kelaniya 2.1
9. Ratmalana 2.0
10. Moratuwa 1.8
Colombo city is made up of Colombo and Thimbirigasyaya DSDs
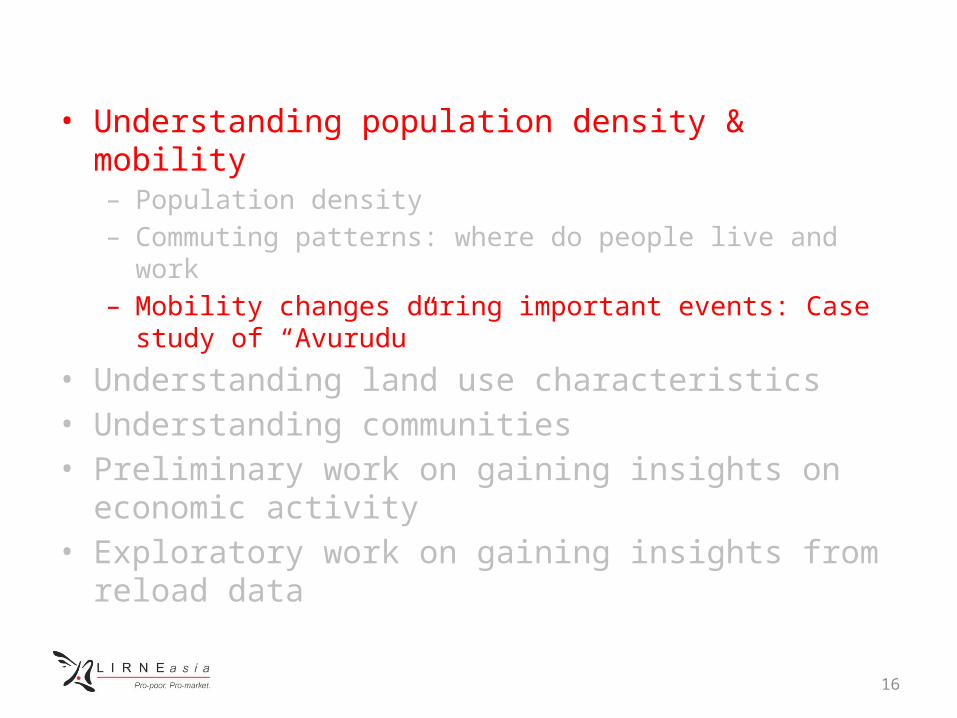
• Understanding population density & mobility– Population density– Commuting patterns: where do people live and work– Mobility changes during important events: Case study of “Avurudu”
• Understanding land use characteristics• Understanding communities• Preliminary work on gaining insights on economic activity• Exploratory work on gaining insights from reload data
16

People travel greater distances during major holiday
17
A-4 A-3 A-2 A-1 A A+1 A+2 A+3 A+4
Average: 11.6km
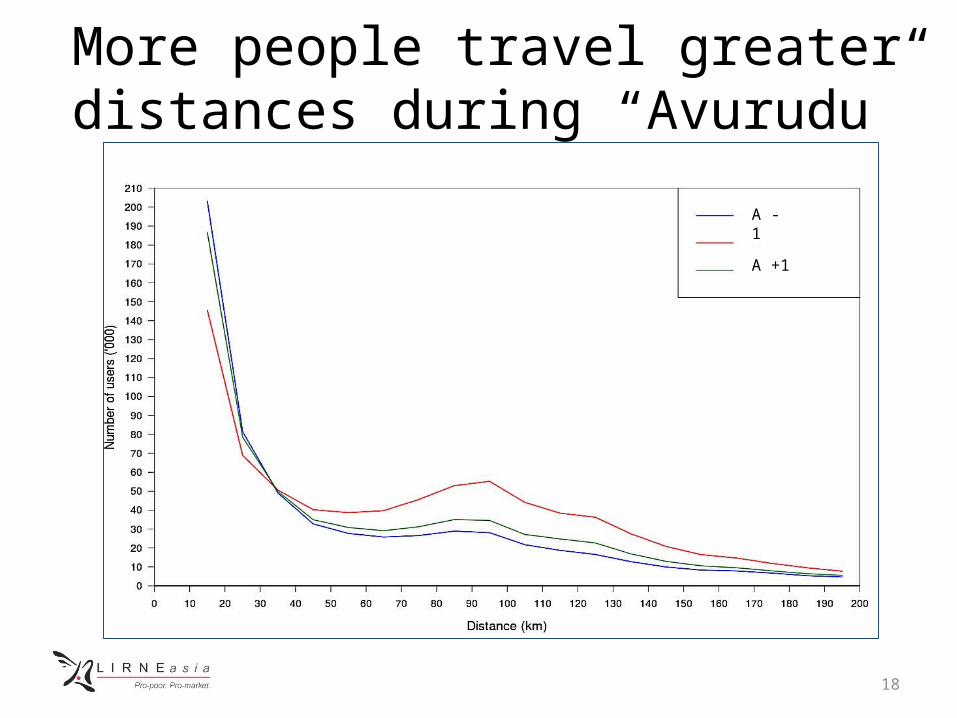
More people travel greater distances during “Avurudu”
18
A
A -1
A +1

Net inflow during Avurudu weekend
19
With the exception of Ampara, more Colombo city residents travelled to other DSDs during Avurudu, as compared to other weekends (some examples below):• Nuwara Eliya: 315%• Kotmale: 233%• Town & Gravets (Trincomalee): 100%• Udunuwara: 93%• Kalutara: 90%• Jaffna: 80%• Galle Four Gravets: 77%• Gangawata Korale: 71%• Attanagalla: 71%• Mirigama: 66%
Implications for public policy
• Population maps and mobility/migration patterns are essential policy tools– Included in most census and household surveys
• MNBD allows us to improve & extend measurement– Large sample sizes– Very frequent measurement
• More precise measures– Commuting/ seasonal/ long-term migration
20
Implications for public policy
• Improve planning for “spiky” events that create pressure on government and privately supplied services– Humanitarian response to disasters– Special events/holidays
• Urban & transportation planning– Can identify high volume transport corridors to prioritize for provision
of mass transit– Map de facto municipal boundaries
• Health policy– Mobility patterns that can help respond to spread of infectious
diseases (e.g., dengue)
21
• Understanding population density & mobility– Population density– Commuting patterns: where do people live and work– Mobility changes during important events: Case study of “Avurudu”
• Understanding land use characteristics• Understanding communities• Preliminary work on gaining insights on economic activity• Exploratory work on gaining insights from reload data
22
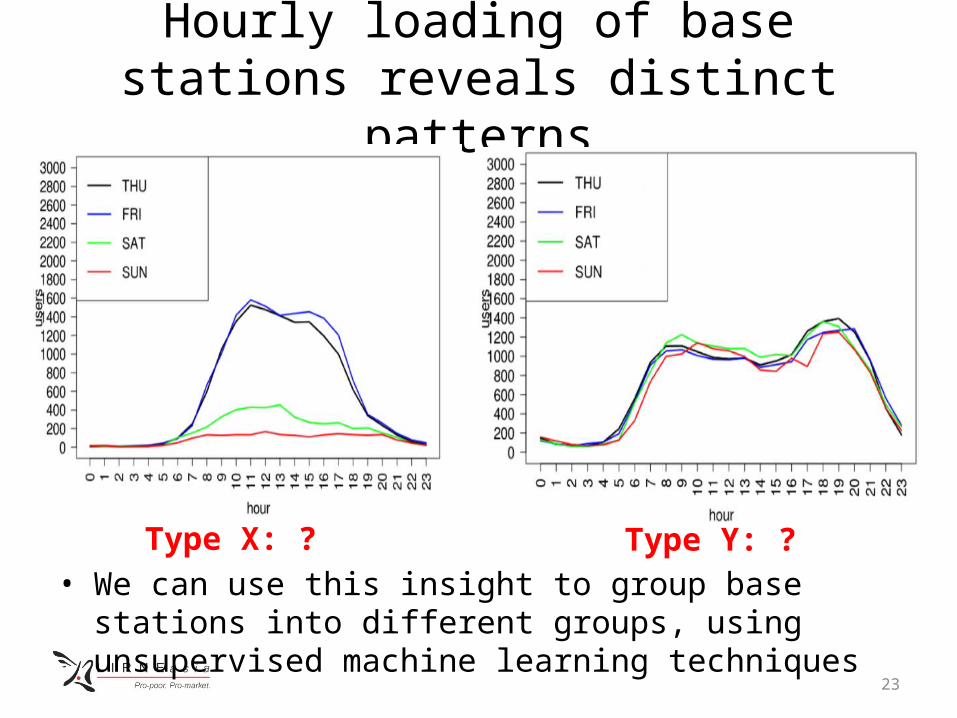
Hourly loading of base stations reveals distinct patterns
• We can use this insight to group base stations into different groups, using unsupervised machine learning techniques
23
Type Y: ?Type X: ?

Methodology
• The time series of users connected at a base station contains variations, that can be grouped by similar characteristics
• A month of data is collapsed into an indicative week (Sunday to Saturday), with the time series normalized by the z-score
• Principal Component Analysis(PCA) is used to identify the discriminant patterns from noisy time series data
• Each base station’s pattern is filtered into 15 principal components (covering 95% of the data for that base station)
• Using the 15 principal components, we cluster all the base stations into 3 clusters in an unsupervised manner using k-means algorithm
24
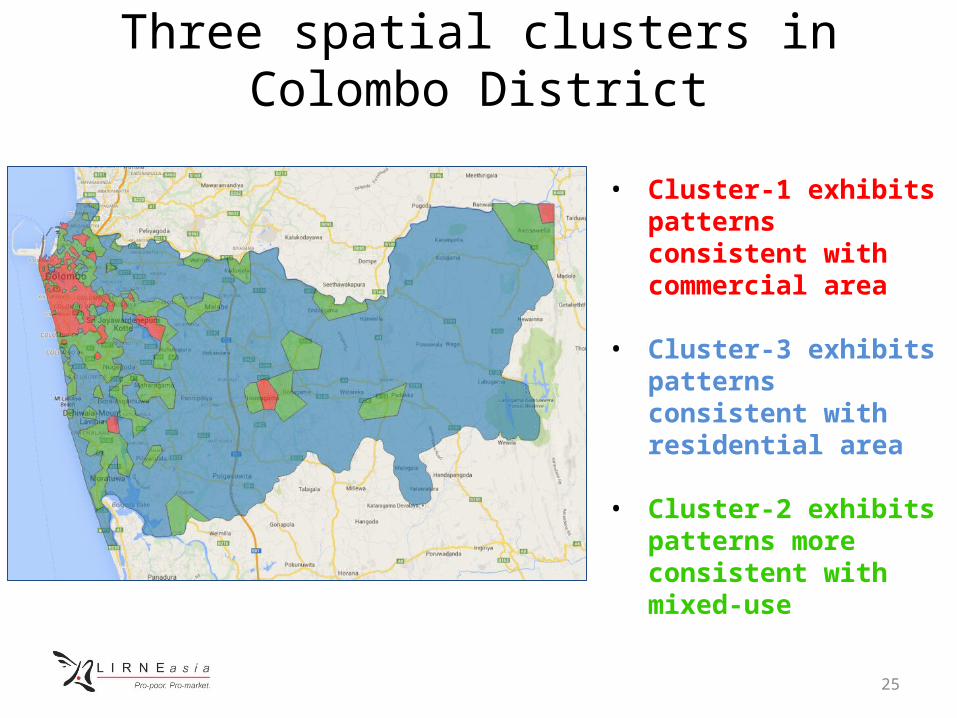
Three spatial clusters in Colombo District
25
• Cluster-1 exhibits patterns consistent with commercial area
• Cluster-3 exhibits patterns consistent with residential area
• Cluster-2 exhibits patterns more consistent with mixed-use
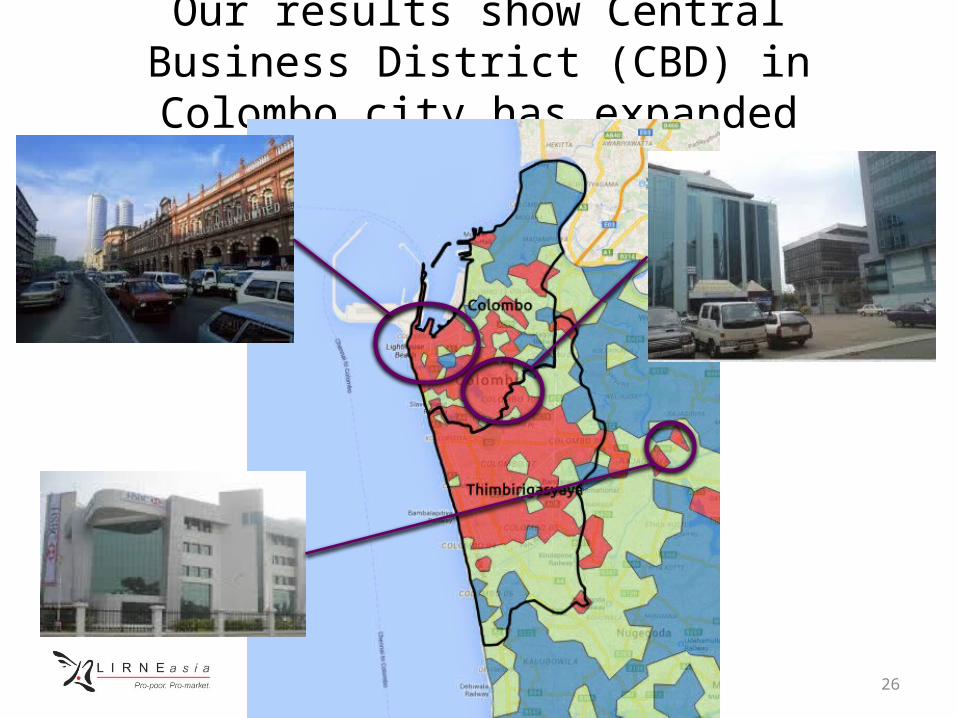
Our results show Central Business District (CBD) in Colombo city has expanded
26

Small area in NE corner of Colombo District classified as belonging to Cluster 1?
27
Seethawaka Export Processing Zone
Photo ©Senanayaka Bandara - Panoramio

Internal variations in mixed use regions: More commercial or more residential?
28Blue dots: more residential than commercial Red dots: more commercial than residential
• To evaluate the relative closeness to the other two clusters, we define extent of commercialization as:
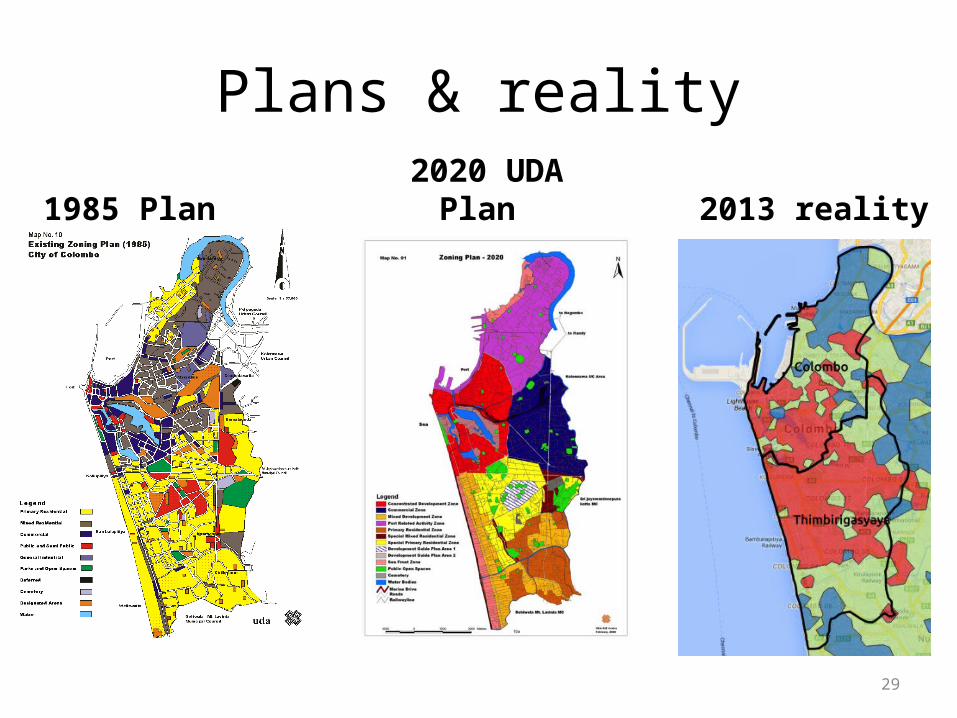
Plans & reality
1985 Plan 2013 reality
29
2020 UDA Plan

Implications for urban policy• Almost real-time monitoring of urban land use
– We are currently working on understanding finer temporal variations in zone characteristics (especially the mixed-use areas)
• Can complement infrequent surveys & align master plan to reality
• LIRNEasia is working to unpack the identified categories further, e.g.,– Entertainment zones that show evening activity
30
• Understanding population density & mobility– Population density– Commuting patterns: where do people live and work– Mobility changes during important events: Case study of “Avurudu”
• Understanding land use characteristics• Understanding communities• Preliminary work on gaining insights on economic activity• Exploratory work on gaining insights from reload data
31
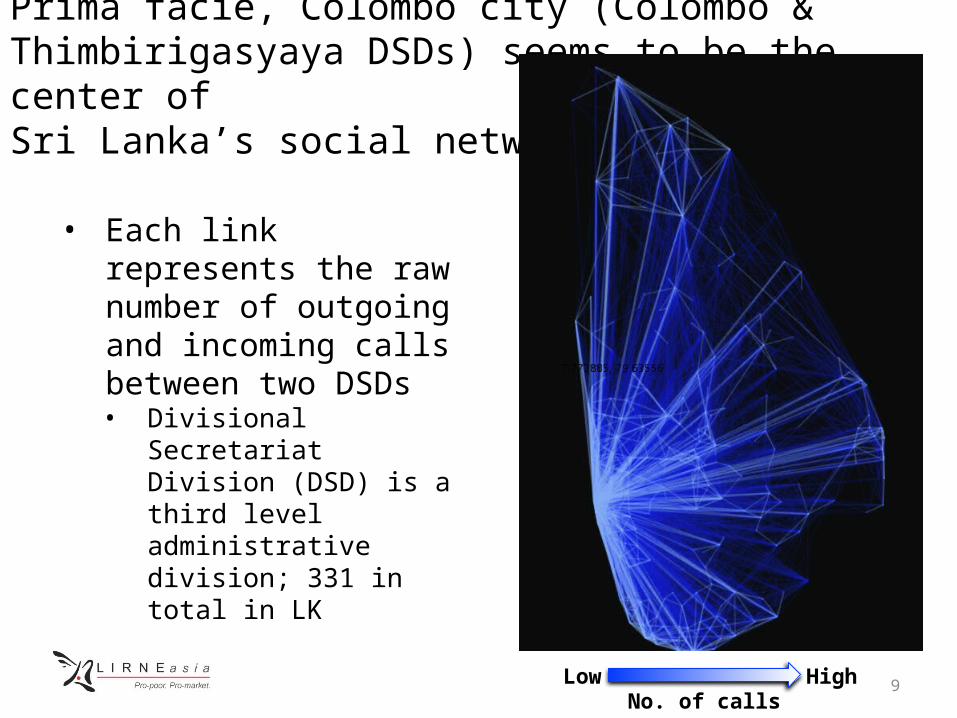
Prima facie, Colombo city (Colombo & Thimbirigasyaya DSDs) seems to be the center of Sri Lanka’s social network
• Each link represents the raw number of outgoing and incoming calls between two DSDs • Divisional Secretariat
Division (DSD) is a third level administrative division; 331 in total in LK
9No. of calls
Low High
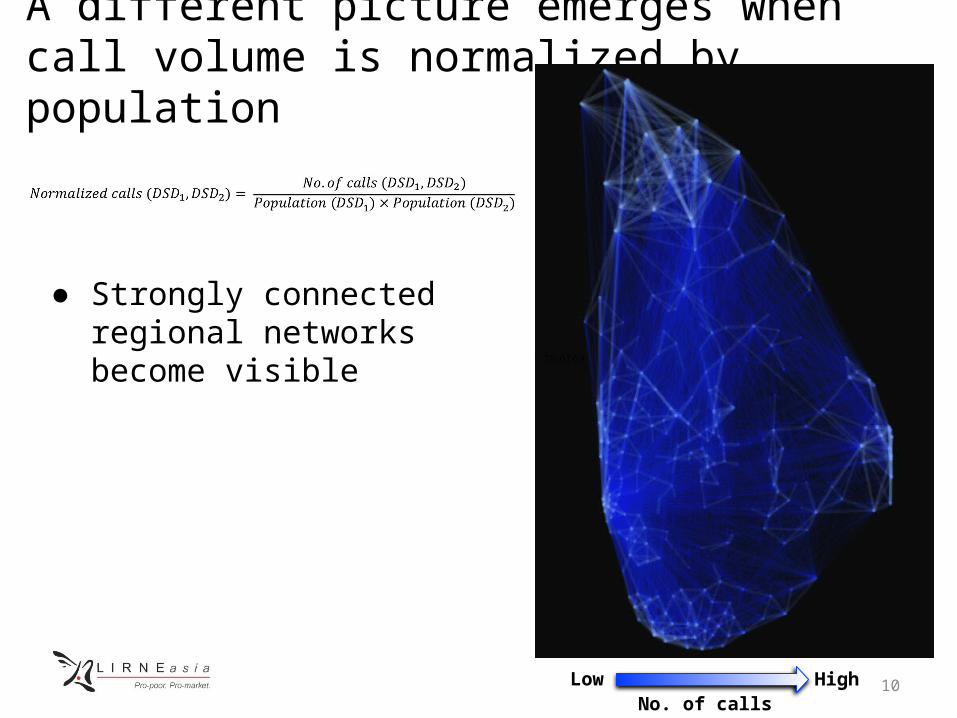
A different picture emerges when call volume is normalized by population
● Strongly connected regional networks become visible
10No. of calls
Low High

Identifying communities: methodology• The social network is segregated such that
overlapping connections between communities are minimized
• Strength of a community is determined by modularity• Modularity Q = (edges inside the community) –
(expected number of edges inside the community)
M. E. J.-Newman, Michele-Girvan, “Finding and evaluating community structure in networks”, Physical Review E, APS, Vol. 69, No. 2, p. 1-16, 204.
12

We find Sri Lanka is made up of 11 communities
35
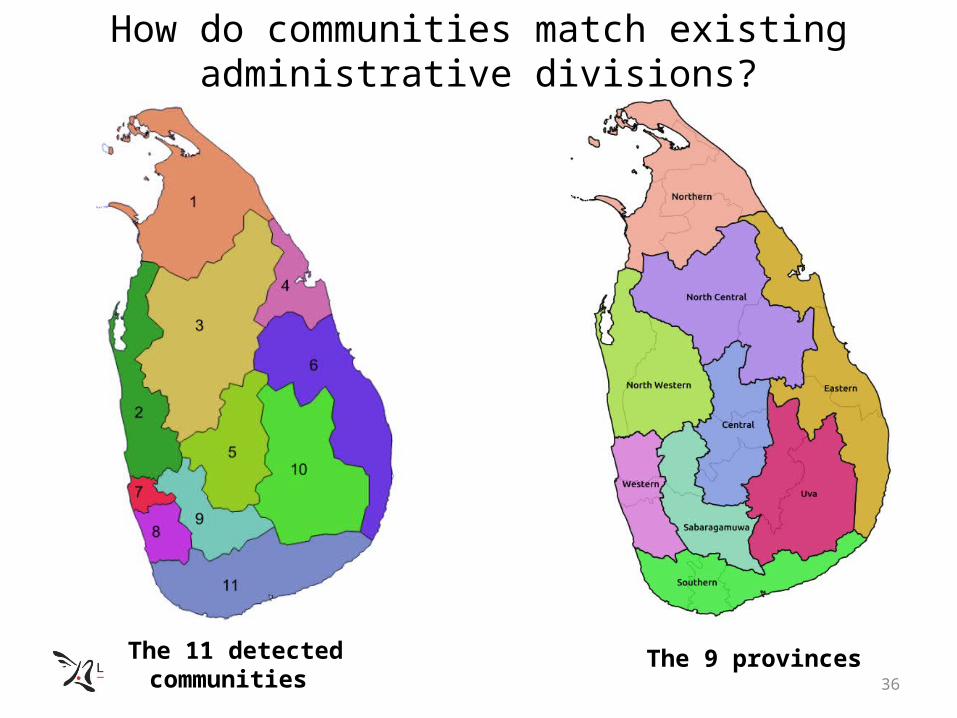
How do communities match existing administrative divisions?
36
The 9 provincesThe 11 detected communities

With some exceptions, boundaries of communities differ from existing administrative divisions
37
• Northern (1), Uva (10) and Southern (11) communities most similar to existing provincial boundaries; but 11 takes Embilipitiya and Kataragama
• Colombo district is clustered as a single community (7)• Gampaha merges with coastal belt of North Western Province
(2) and Kalutara (8) is its own community– What does this mean for Western Province Megapolis?
• Batticaloa & Ampara districts of the Eastern Province merge with the Polonnaruwa district of North Central Province to form its own distinct community (6)– Possibly reflective of economic linkages since this is the rice belt
of Sri Lanka– Does economics override ethnicity?
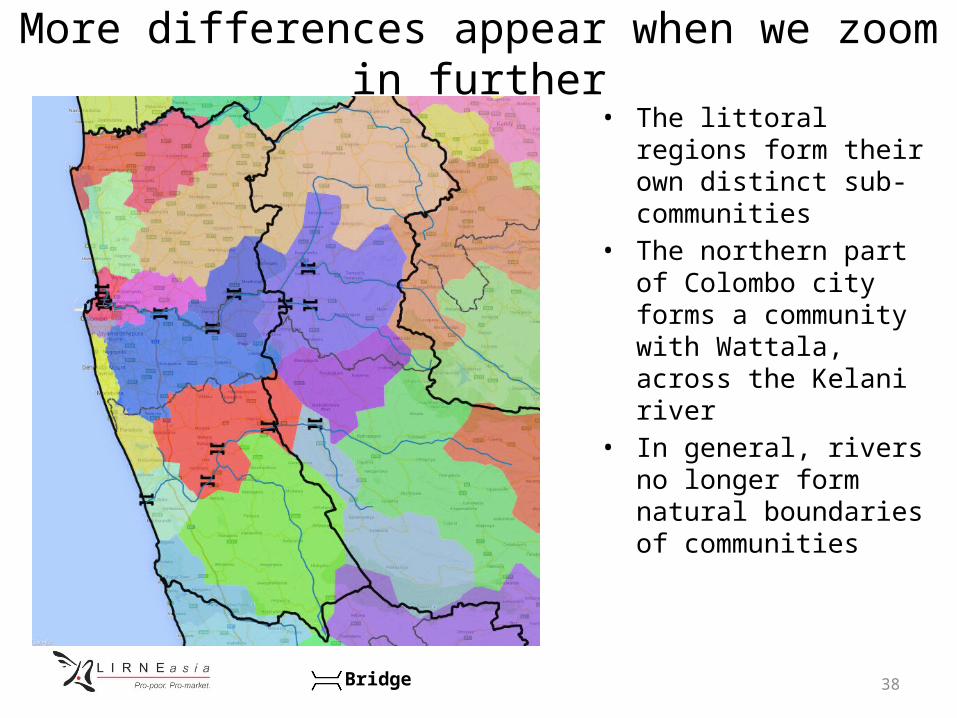
More differences appear when we zoom in further• The littoral regions form
their own distinct sub-communities
• The northern part of Colombo city forms a community with Wattala, across the Kelani river
• In general, rivers no longer form natural boundaries of communities
38Bridge
• Understanding population density & mobility– Population density– Commuting patterns: where do people live and work– Mobility changes during important events: Case study of “Avurudu”
• Understanding land use characteristics• Understanding communities• Preliminary work on gaining insights on economic activity• Exploratory work on gaining insights from reload data
39

40
How is mobility informative about economic activity?
Economic activity = (number of workers) x (productivity per worker)
Observed Must be inferred
• We assume more productive regions are more attractive destinations
• Commuting patterns emerge from the trade-off between attractiveness of a workplace and the cost of getting there
41
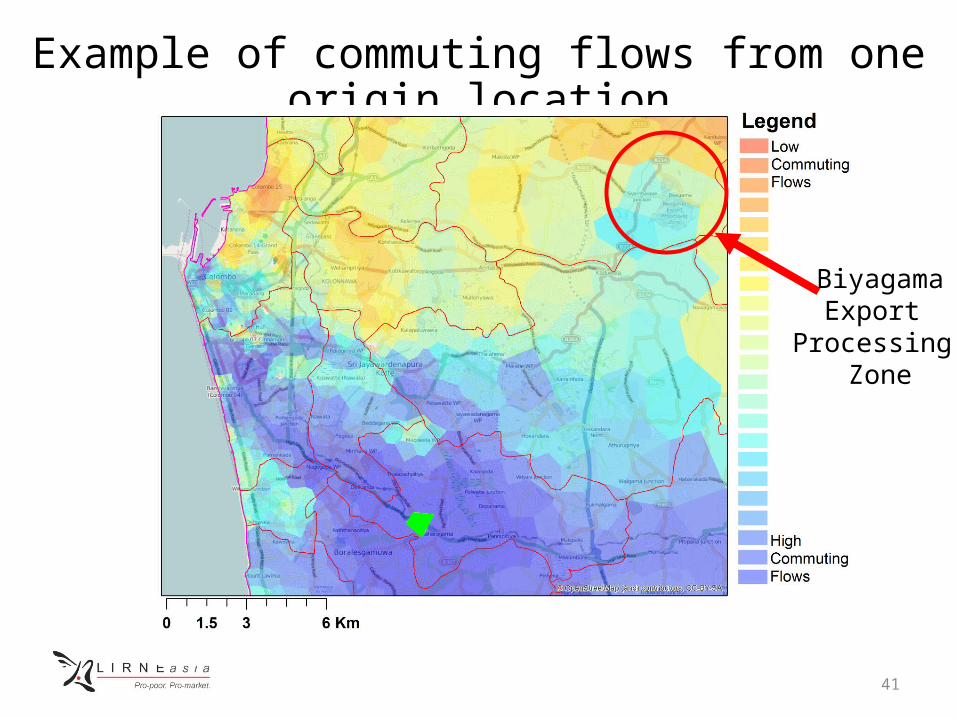
Example of commuting flows from one origin location
BiyagamaExport
Processing Zone

42
Theoretical model outline
43
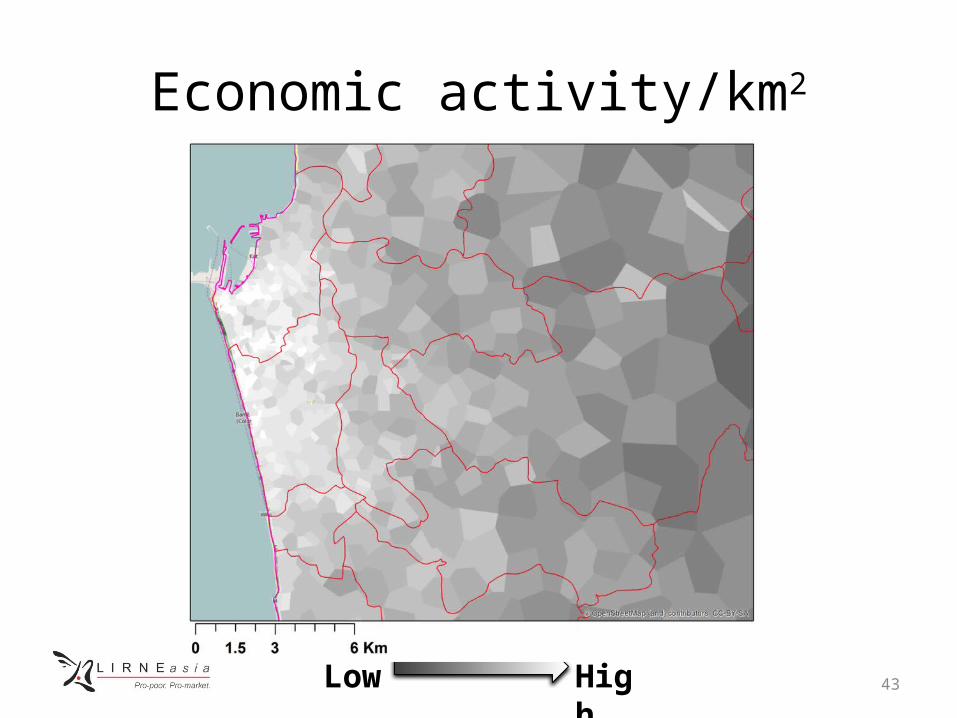
Economic activity/km2
Low High
44
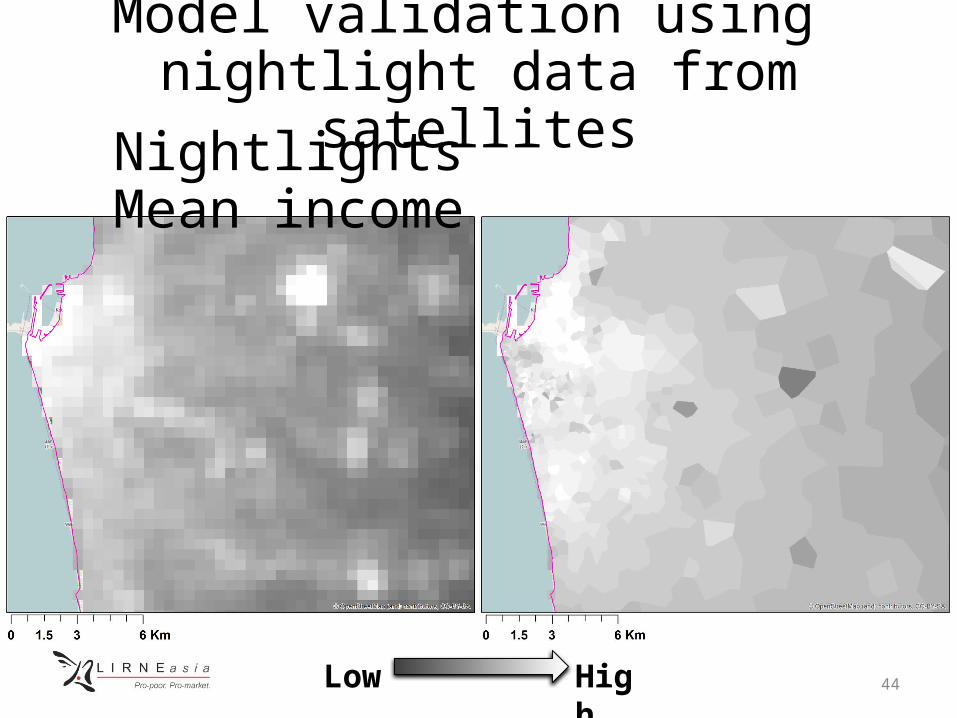
Nightlights Mean income
Model validation using nightlight data from satellites
Low High

45
Nightlights Household data Industrial Data
Geographic variation
Time variation yearly quarterly/2-3yrs/decade yearly/decade
Relevant variablesEducation,
(un)employment, skill levels
Employment, capital intensity
Ideal for: Improving Measure
Improving & Validation
Incorporating other data can give further insights
Household data: Census/HIES/LFSIndustrial data: ASI, Industrial Census

Benefit of an improved framework for modeling economic activity
• Increase the coverage of existing surveys (both temporal and geographic)– By calibrating with household, industry census and survey
data, when available– Then, mobile data can be used to predict/extrapolate for
time periods and regions without survey data
• Can capture informal economic activity– Other research suggests informal economy is almost 30%
of GDP in Sri Lanka
46
47
Implications• A new measure of economic activity from
commuting flows (from mobile phone data)• Significant potential use for policy and research.• Fine temporal and spatial resolution.
• Preliminary validation with the best available data looks promising
• Additional data (Industrial, Household) will allow measure to be taken to next level

• Understanding population density & mobility– Population density– Commuting patterns: where do people live and work– Mobility changes during important events: Case study of “Avurudu”
• Understanding land use characteristics• Understanding communities• Preliminary work on gaining insights on economic activity• Exploratory work on gaining insights from reload data
48

Average monthly reload by residents of Colombo & adjacent region is high, as is variability
49
Low High
Average monthly reload amount
Co-efficient of Variation (COV)

Similar story for Northern Province residents, but average monthly reload is higher than Colombo district
50Low High
Average monthly reload amount
Co-efficient of Variation (COV)
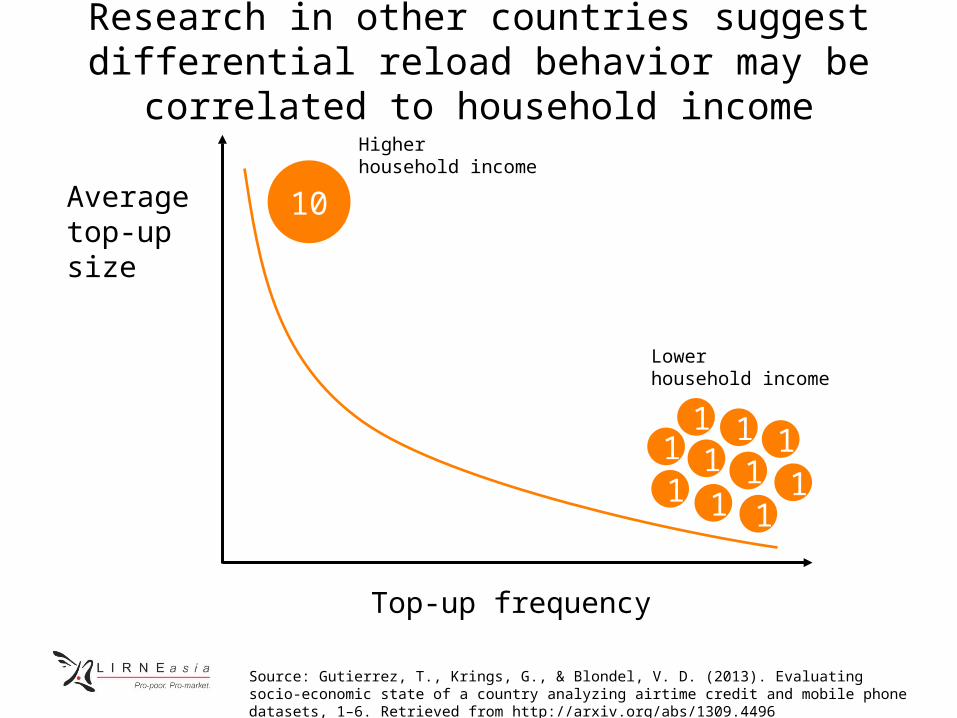
Research in other countries suggest differential reload behavior may be correlated to household income
10
111
1 11
1
11
1
Top-up frequency
Averagetop-up size
Higherhousehold income
Lowerhousehold income
Source: Gutierrez, T., Krings, G., & Blondel, V. D. (2013). Evaluating socio-economic state of a country analyzing airtime credit and mobile phone datasets, 1–6. Retrieved from http://arxiv.org/abs/1309.4496
But preliminary LK results are inconclusive
• Large majority of LK mobile users reload using recharge cards and higher denomination cards are not easy to come by
• High reload spending in Northern Province meshes with– Findings from Department of Census and Statistics – LIRNEasia research on high communication expenditures
• Addition work required:– Ideally we would have user-level socio-economic data through phone
surveys, but difficult to implement – Co-relate fine grained MNBD behavioral data (not just reload but also
mobility and social) with census-block level data from HIES and Census• V. Soto, V. Frias-Martinez, J. Virseda, and E. Frias-Martinez. 2011. Prediction of
socioeconomic levels using cell phone records. In Proceedings of the 19th International Conference on User Modeling, Adaption, and Personalization (UMAP’11). Springer-Verlag, Berlin, 377–388
52

Selected Publications & Reports• Lokanathan, S., Kreindler, G., de Silva, N. D., Miyauchi, Y., Dhananjaya, D., & Samarajiva, R.
(forthcoming). Using Mobile Network Big Data for Informing Transportation and Urban Planning in Colombo. Information Technologies & International Development
• Samarajiva, R., Lokanathan, S., Madhawa, K., Kriendler, G., & Maldeniya, D. (2015). Big data to improve urban planning. Economic and Political Weekly, Vol L. No. 22, May 30
• Maldeniya, D., Lokanathan, S., & Kumarage, A. (2015). Origin-Destination matrix estimation for Sri Lanka using mobile network big data. 13th International Conference on Social Implications of Computers in Developing Countries. Colombo
• Kreindler, G. & Miyauchi, Y. (2015). Commuting and Productivity: Quantifying Urban Economic Activity using Cell Phone Data. LIRNEasia
• Lokanathan, S & Gunaratne, R. L. (2015). Mobile Network Big Data for Development: Demystifying the Uses and Challenges. Communications & Strategies.
• Lokanathan, S. (2014). The role of big data for ICT monitoring and for development. In Measuring the Information Society 2014. International Telecommunication Union.
More information: http://lirneasia.net/projects/bd4d/
53