big data analytics in bioinformatics: a machine learning ... · pdf filebig data analytics in...
TRANSCRIPT

JOURNAL OF LATEX CLASS FILES, VOL. 13, NO. 9, SEPTEMBER 2014 1
Big Data Analytics in Bioinformatics: A MachineLearning Perspective
Hirak Kashyap, Hasin Afzal Ahmed, Nazrul Hoque, Swarup Roy, and Dhruba Kumar Bhattacharyya
Abstract—Bioinformatics research is characterized by voluminous and incremental datasets and complex data analytics methods. Themachine learning methods used in bioinformatics are iterative and parallel. These methods can be scaled to handle big data using thedistributed and parallel computing technologies.
Usually big data tools perform computation in batch-mode and are not optimized for iterative processing and high data dependencyamong operations. In the recent years, parallel, incremental, and multi-view machine learning algorithms have been proposed. Similarly,graph-based architectures and in-memory big data tools have been developed to minimize I/O cost and optimize iterative processing.
However, there lack standard big data architectures and tools for many important bioinformatics problems, such as fast constructionof co-expression and regulatory networks and salient module identification, detection of complexes over growing protein-proteininteraction data, fast analysis of massive DNA, RNA, and protein sequence data, and fast querying on incremental and heterogeneousdisease networks. This paper addresses the issues and challenges posed by several big data problems in bioinformatics, and gives anoverview of the state of the art and the future research opportunities.
Index Terms—Big data, Bioinformatics, Machine learning, MapReduce, Clustering, Gene regulatory network
F
1 INTRODUCTION
A S we enter into the information age, data are beinggenerated by variety of sources other than people and
servers, such as sensors embedded into phones and wear-able devices, video surveillance cameras, MRI scanners,and set-top boxes. Considering the annual growth of datageneration, the digital universe - data we generate annually- will reach 44 zettabytes, or 44 trillion gigabytes by the year2020, which is ten times the size of the digital universe in2013 [2]. The fast transition into the information age hasbeen fueled by the digitization of all of our devices andcommunication technology. Yesteryears technologies, suchas analog telephony and film cameras, have been digitized.The advent of the Internet, followed by the WWW boomdigitized our mailing systems, televisions, banking systems,and retailing, leading to storage and transmission of volu-minous data. High performance technologies are used inscientific research, such as fast data capturing tools and veryhigh resolution satellite data recording.
Apart from digitization of services and enterprises,a new trend has emerged recently to network all theman-made things around us, such as cars, home appli-ances, weapons, traffic lights, and power meters. Thesethings communicate with each other to share data capturedthrough various sensors, in order to take intelligent op-erational decisions by themselves. This network has beentermed as the Internet of Things (IoT) [3]. The first net-worked appliance, a coke vending machine, was deployed
• H. Kashyap, H. A. Ahmed, N Hoque, and D. K. Bhattacharyya are withDepartment of Computer Science and Engineering, Tezpur University,India - 784028.E-mail: {hirak, hasin, nhoq, dkb}@tezu.ernet.in
• S. Roy is with Department of Information Technology, North Eastern HillUniversity, Shillong-22, India.E-mail: [email protected]
Manuscript received June 15, 2015
at the Computer Science department of Carnegie MellonUniversity in the year 19901. The IoT is growing fast andmachine-to-machine connections will reach 1.2 billion in2017, up from only 200 million in 2012 [4].
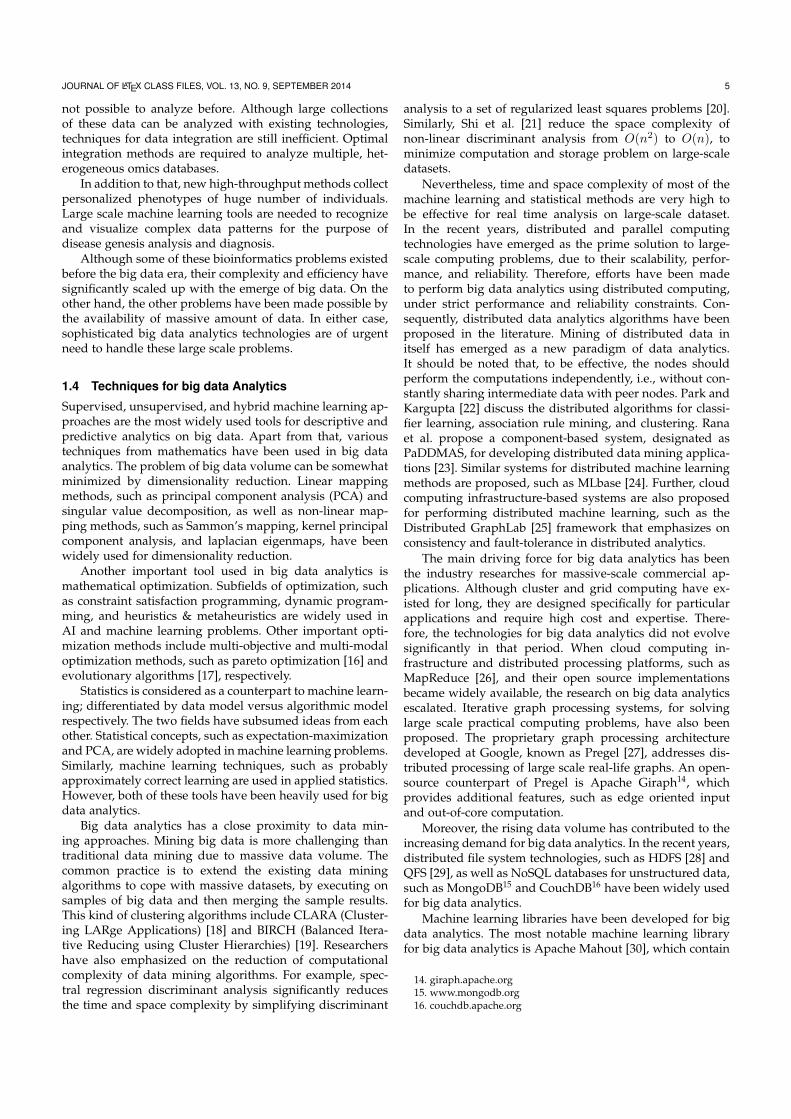
However, it should be noted that not all data, that wegenerate, are useful for descriptive or predictive analysis.Only a part of the data in the digital universe is useful,when tagged, termed as target-rich data. Metadata are moretarget-rich than the data itself. According to Turner et al. [2],approximately all of the target rich data were general IT datain the year 2014; however, by the year 2020, IoT data willoccupy more than 20% of the target-rich data lake. Figure 1shows the forecast made in the IDC report [2] regarding thesize of the digital universe and the target-rich portion of itby the year 2020.
0
5
10
15
20
25
30
35
40
45
2013 2020
Size
in Z
etta
byt
es
Year
Digital universe
Target-rich data
Fig. 1. Size of the digital universe in 2013 and 2020
The significance of these data are paramount as they em-bed the real life scenarios, such as environmental changes,cyber attacks, consumer drifts, and forthcoming epidemics,
1. www.cs.cmu.edu/ coke/
arX
iv:1
506.
0510
1v1
[cs
.CE
] 1
5 Ju
n 20
15

JOURNAL OF LATEX CLASS FILES, VOL. 13, NO. 9, SEPTEMBER 2014 2
and also because they are being generated and shared inreal time. Consequently, these data are being heavily usedfor decision making and intelligent control.
Due to this high availability of information intensivedata stream and the advances in high performance com-puting technologies, big data analytics have emerged toperform real time descriptive and predictive analysis onmassive amount of data, in order to formulate intelligentinformed decisions. Big data refers to a high volume ofheterogeneous data formed by continuous or discontinuousinformation stream. In the literature, big data has beencharacterized as either 3Vs or 4Vs [5], [6]. The 3Vs referto Volume, Velocity, and Variety; whereas the 4th V in thelater definition refers to Veracity, i.e., reliability of the ac-cumulated data. Additionally, there are two very importantcharacteristics of big data that are not covered by this tra-ditional definition. First, big data are incremental, i.e., newdata are dynamically added to the big data lake from time totime. Second, big data are geographically distributed. Thesecharacteristics separate big data from traditional databasesor data-warehouses.
1.1 Big data in bioinformatics
The volume of data is growing fast in bioinformatics re-search. Big data sources are no longer limited to particlephysics experiments or search-engine logs and indexes.With digitization of all processes and availability of highthroughput devices at lower costs, data volume is risingeverywhere, including in bioinformatics research. For in-stance, the size of a single sequenced human genome isapproximately 200 gigabytes [7]. This trend in rising datavolume is also supported by decreasing computing costand increasing analytics throughput with growing big datatechnologies. Biologists no longer use traditional labora-tories to discover a novel biomarker for a disease, ratherthey rely on huge and continuously growing genomic datamade available by various research groups. Technologies forcapturing bio data are becoming cheaper and more effective,such as automated genome sequencers, giving rise to thisnew era of big data in bioinformatics.
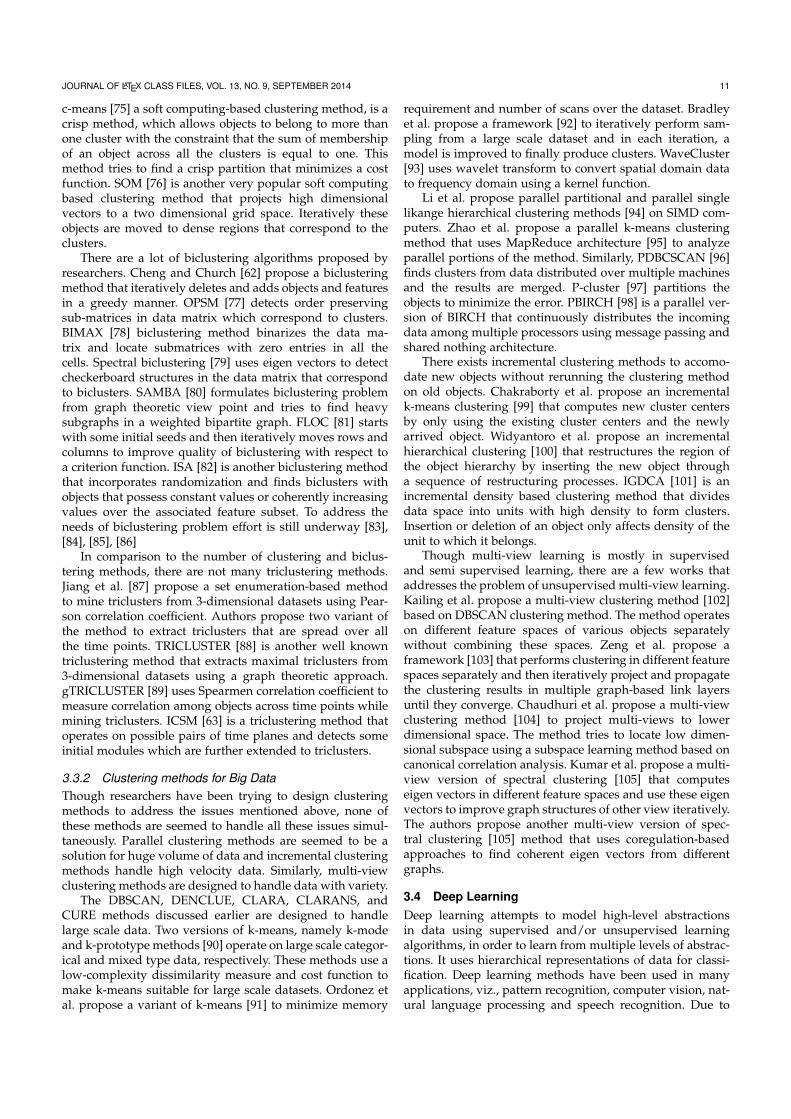
The data size in bioinformatics is increasing dramaticallyin the recent years. The European Bioinformatics Institute(EBI), one of the largest biology-data repositories, had ap-proximately 40 petabytes of data about genes, proteins, andsmall molecules in 2014, in comparsion to 18 petabytes in2013 [8]. Their total storage size is doubling every year.Figure 2 shows the increasing trend in their genome andexpression data store.
EBI has installed a cluster, the Hinxton data centre clus-ter, with 17,000 cores and 74 terabytes of RAM, to processtheir data. Its computing power is increased in almost everymonth. More importantly, EBI is not the only organizationinvolved in massive bio-data store. There are many otherorganizations, who are storing and processing huge collec-tions of biological databases and distributing them aroundthe world, such as National Center for Biotechnology In-formation (NCBI), USA and National Institute of Genetics,Japan.
Availability of high volume of data is helpful for moreaccurate analytics, particularly in a highly sensitive field of
(a) Genomes (all species)
(b) Gene expression data
Fig. 2. Quantity of data stored by EBI over the years [8]
research like bioinformatics. However, the big data chal-lenges here are much different from other well knownbig data problems, such as particle physics data cap-tured at CERN or high resolution satellite data receivedat NRSC/ISRO open data archive2. The difference comesmainly in two aspects. First, bioinformatics data are highlyheterogeneous in nature. Many analytics problems in bioin-formatics require multiple heterogeneous and independentdatabases for inference and validation. Moreover, bioinfor-matics data are generated by many uncontrolled organiza-tions and consequently, the same types of data are repre-sented in different forms by their sources. Second, bioinfor-matics data, massive and growing in terms of dimensionand number of instances, is geographically distributed allover the world. While part of these data may be transferredover the Internet, the remaining are not transferable due totheir size (and hence inefficient), cost, privacy, and otherethical issues [9]. This sometimes forces to perform part ofthe analysis remotely and share the results. Therefore, bigdata problems in bioinformatics are not only characterizedby volume, velocity, and variety, but also by geographicallydistributed data.
In order to tackle these challenges of big data in bioin-formatics, cloud computing technologies have been used,with a lot of success. The best policy is to use cloud forboth data store as well as for computation [9]. In fact, thispolicy helps to handle the big data challenges imposedby bioinformatics research over massive, growing and re-motely distributed data. BGI, formerly known as BeijingGenomics Institute, one of the world’s premiere genomesequencing centers, has installed a cloud-based analysisworkflow called Gaea, using Hadoop framework. Gaea can
2. bhuvan.nrsc.gov.in

JOURNAL OF LATEX CLASS FILES, VOL. 13, NO. 9, SEPTEMBER 2014 3
be used to perform large-scale genome analysis in parallelacross hundreds of cloud-based computers. Another notablecloud-based genome analytics solution is provided by BinaTechnologies3, a Stanford University and UC Berkeley spin-off, in terms of a hardware component, called Bina box, todo the pre-processing on genome data and a cloud-basedcomponent to perform analytics on the pre-processed data.Bina box also reduces the size of genome data for their effi-cient transfer to the cloud component. This solution claimsto improve the throughput of genome analytics by orders ofmagnitude higher than the traditional approaches [10].
1.2 Types of big data in bioinformaticsThere are primarily five types of data that are massive insize and used heavily in bioinformatics research: i) geneexpression data, ii) DNA, RNA, and protein sequence data,iii) protein-protein interaction (PPI) data, iv) pathway data,and v) gene ontology (GO). Although, other types of datasuch as human disease network and disease gene associa-tion network are also used, and highly important for manyresearch directions including disease diagnosis.
In gene expression analysis, the expression levels ofthousands of genes are analyzed over different conditions,such as separate developmental stages of treatments or dis-eases. Microarray-based gene expression profiling is usuallyused to record the expression levels for analysis. Thereare three types of microarray data, namely gene-sample,gene-time, and gene-sample-time. Gene expression profilesover sample space record the expression levels for varyingexternal conditions, whereas over time space, they recordthe expression levels at different instances of time. Geneexpression analysis can identify genes that are affected frompathogens or viruses, by comparing the expression valuesfrom infected and uninfected cells. The analysis results maybe used to suggest biomarkers for disease diagnosis andprevention, among others. There are many public sourcesfor microrarray databases, such as ArrayExpress4 from EBI,Gene Expression Omnibus5 from NCBI, and Stanford Mi-croarray Database6.
In sequence analysis, DNA, RNA or peptide sequencesare processed using various analytical methods to under-stand their features, functions, structures, and evolution.DNA sequencing is used in study of genomes and proteinsand their associations with diseases and phenotypes andidentification of potential drugs, evolutionary biology, iden-tification of micro species present in a sample environment,forensic identification, etc. Sequence analysis methodologiesinclude sequence alignment and biological database search,among others. Although RNA sequencing is mainly used asan alternative for microarrays, it can be used for additionalpurposes also, such as mutation identification, identificationof post-transcriptional mechanisms, detection of viruses andexogenous RNAs, and identification of Polyadenylation. Se-quence analysis is more effective than microarray analysis,since sequence data embed richer information. However, itrequires more sophisticated analytic tools and computing
3. www.bina.com4. www.ebi.ac.uk/arrayexpress5. www.ncbi.nlm.nih.gov/geo6. smd.princeton.edu
infrastructures, in order to deal with massive amount ofsequence data [11]. Important sequence databases includeDNA Data Bank of Japan7, RDP8, and miRBase9.
PPIs provide crucial information regarding all biologicalprocesses. Therefore, forming and analyzing PPI networkscan give a proper understanding of protein functions. PPIsare intrinsic to the interactomics of living cell. Therefore,anomalous PPIs are the basis of various diseases, such asAlzheimer’s disease and cancer. PPIs have been studiedin different fields of research, such as bioinformatics, bio-chemistry, quantum chemistry, and molecular dynamics,thus giving rise to high volume of heterogeneous dataregarding the interactions. Important PPI repositories areDIP10, STRING11, and BioGRID12, among others
Pathway analysis is useful for understanding molecularbasis of a disease. Additionally, pathway analysis identifiesgenes and proteins associated with the etiology of a disease,predicts drug targets, and helps to conduct targeted litera-ture searches. Further, it helps to integrate diverse biologicalinformation and assign functions to genes. The most notablepathway data sources are KEGG [12], Reactome [13], andPathway Commons [14].
The GO database13 provides dynamic, structured, andspecies-independent gene ontologies for associated biologi-cal processes, cellular components, and molecular functions.The GO database uses controlled vocabularies to facilitatequerying at different levels. A vast number of tools usesthe GO database for bioinformatics research. Most of thesetools are third-party based, however the GO project itselfmaintains certain tools, such as AmiGO, DAG-Edit, andOBO-Edit. The GO-based tool chain is so huge that thereexist tools, such as SerbGO [15], to search the appropri-ate GO tools for a particular bioinformatics problem. TheGO database has highly been used for various purposes,such as to build ontologies for anatomies, to validate semi-supervised and unsupervised analytics results from data,and to develop timelines for model organisms, human dis-eases and plant growth environments.
1.3 Big data problems in bioinformatics
The solutions for cloud-based large-scale big data analytics,such as Bina box for genome analysis, are very recent.There are several other big data problems in the domain ofbioinformatics that are yet to be explored. Considering therecent big data boom in bioinformatics, as discussed above,there is an urgent need to address many of these problems.In this paper, we categorize the big data analytics problemsin bioinformatics into seven categories. They are discussedbelow.
1.3.1 Microarray data analysisThe size and number of microarray datasets are growingrapidly, mainly due to decreasing cost and widespread use
7. www.ddbj.nig.ac.jp8. rdp.cme.msu.edu9. www.mirbase.org10. dip.doe-mbi.ucla.edu11. string.embl.de12. thebiogrid.org13. www.geneontology.org

JOURNAL OF LATEX CLASS FILES, VOL. 13, NO. 9, SEPTEMBER 2014 4
of microarray experiments. Moreover, microarray experi-ments are also been performed for gene-sample-time space,in order to capture the changes in expression values overtime or over different stages of a disease. Big data technolo-gies are required for fast construction of co-expression andregulatory networks using voluminous microarray.
As gene expression data are being captured at differentprogression stages of a disease over time, there has beenan opportunity to identify the genes that are affected bythe disease, in order to identify biomarkers for the disease.Computationally, the addition of the third dimension, time,makes the analytics much higher in complexity than thetraditional analysis of gene complexes.
1.3.2 Gene-gene network analysisGene regulatory networks (GRN) alterations underlie manyanomalous conditions, such as cancer. Inferring GRN andtheir alterations from high-throughput microarray data is afundamental but challenging task. With the rapid growth ofhigh throughput sequencing technologies, system biologistare now able to infer gigabytes of data. In many cases,movement of such large volume of data is not feasible.Integration of large multiple GRNs from different sourceshelp in reconstruction of a unified GRN. Reconstructionof GRNs locally and then their integration through cloudinfrastructure may help system biologists to better analyzea diseased network.
Additionally, the inference can be translated to genomicmedicine. Although there exist many GRN inference mech-anisms, their relative strength are unknown, due to the lackof large-scale validation. To find the most effective inferencemechanism to identify the abnormal networks and to priori-tize the target proteins for druggabilty are demanding issuesand need to be addressed using fast, reliable, and scalablearchitectures.
Gene co-expression network analysis estimates the cor-relation among different gene-gene networks obtained fromgene-expression analysis. Differential co-expression analysisfinds the changes incurred by the gene complexes over timeor over different stages of a disease. This helps in findingthe relations between gene complexes and traits of interest.Gene complexes of different species can also be studiedto find genotypic similarities. Gene co-expression networkanalysis is a complex and highly iterative problem andrequires large-scale data analytics systems.
1.3.3 PPI data analysisPPI complexes and changes in them inhibit high informationcontent about various diseases. PPI networks are being stud-ied in various domains of life sciences with production ofvoluminous data. The volume, velocity, and variety of datamake PPI complex analytics is a genuine big data problem. Itdemands for an efficient and scalable architecture to providefast and accurate PPI complex generation, validation, andrank-aggregation.
1.3.4 Sequence analysisWith the increasing volume (in order of petabytes) of DNAdata deluge originated from thousands of sources, thepresent DNA sequencing tools have been found inadequate.
So, development of a high throughput and compact archi-tecture for DNA sequence analysis with renewed focus forbig data management is a bioinformatics problem with highdemand in the recent days.
RNA sequencing technology has emerged as a strongsuccessor to the microarray technology, due to its moreaccurate and quantitative gene expression measurements.However, RNA sequence data also contain additional infor-mation, which are often overlooked, and require complexmachine learning techniques to be extracted. Big data tech-nologies can be used to identify mutations, allele-specificexpressions, and exogenous RNA contents, such as viruses,from RNA sequence data using sophisticated machine learn-ing methods.
The next generation genome sequencing provides infor-mation on the complete genome of an individual, in ordersof magnitude bigger in size than microarray based methodsfor genetic assessment. Large scale methods are needed tostudy the specific changes in genome sequences due to aparticular disease and to compare with the existing resultsof the same or different related diseases.
1.3.5 Evolutionary researchThe recent advances in molecular biological technologieshave become a prominent source for the generation ofbig data. Huge amount data has been generated by var-ious projects at microbial level, such as whole genomesequencing, microarrays, and metabolomics. Bioinformaticshas emerged as a significant platform for analysis andarchival of this wealth of information. An important big dataproblem in bioinformatics has been the study of functionaltrends of adaptation and evolution using microbial research,by investigating primitive organisms.
1.3.6 Pathway analysisPathway analysis associates genetic products with pheno-types of interest, in order to predict gene function, identifybiomarkers and traits, and classify patients and samples.The genetic, genomic, metabolomics, and proteomic datahas increased rapidly and big data technologies are requiredto perform association analysis on huge volumes of thesedata.
1.3.7 Disease network analysisLarge disease networks have been formulated for manyspecies, including human. These networks are continuouslygrowing and new networks are being added by differentsources in their own format. The multi-objective associa-tions among diseases in heterogeneous networks are use-ful for understanding the relations among diseases acrossnetworks. Traditional network analytics techniques wouldnot perform well over unstructured and heterogeneous datawithout compromising information quality, and intelligentand efficient analytics are required. Big data technologiesare required to effectively deep mine the associations amongheterogeneous disease networks.
Complex networks of molecular phenotypes character-ize causal or predictive genes or mechanisms for disease-associated traits. Ability for fast processing of these dataallows researchers to analyze more datasets, that were
JOURNAL OF LATEX CLASS FILES, VOL. 13, NO. 9, SEPTEMBER 2014 5
not possible to analyze before. Although large collectionsof these data can be analyzed with existing technologies,techniques for data integration are still inefficient. Optimalintegration methods are required to analyze multiple, het-erogeneous omics databases.
In addition to that, new high-throughput methods collectpersonalized phenotypes of huge number of individuals.Large scale machine learning tools are needed to recognizeand visualize complex data patterns for the purpose ofdisease genesis analysis and diagnosis.
Although some of these bioinformatics problems existedbefore the big data era, their complexity and efficiency havesignificantly scaled up with the emerge of big data. On theother hand, the other problems have been made possible bythe availability of massive amount of data. In either case,sophisticated big data analytics technologies are of urgentneed to handle these large scale problems.
1.4 Techniques for big data Analytics
Supervised, unsupervised, and hybrid machine learning ap-proaches are the most widely used tools for descriptive andpredictive analytics on big data. Apart from that, varioustechniques from mathematics have been used in big dataanalytics. The problem of big data volume can be somewhatminimized by dimensionality reduction. Linear mappingmethods, such as principal component analysis (PCA) andsingular value decomposition, as well as non-linear map-ping methods, such as Sammon’s mapping, kernel principalcomponent analysis, and laplacian eigenmaps, have beenwidely used for dimensionality reduction.
Another important tool used in big data analytics ismathematical optimization. Subfields of optimization, suchas constraint satisfaction programming, dynamic program-ming, and heuristics & metaheuristics are widely used inAI and machine learning problems. Other important opti-mization methods include multi-objective and multi-modaloptimization methods, such as pareto optimization [16] andevolutionary algorithms [17], respectively.
Statistics is considered as a counterpart to machine learn-ing; differentiated by data model versus algorithmic modelrespectively. The two fields have subsumed ideas from eachother. Statistical concepts, such as expectation-maximizationand PCA, are widely adopted in machine learning problems.Similarly, machine learning techniques, such as probablyapproximately correct learning are used in applied statistics.However, both of these tools have been heavily used for bigdata analytics.
Big data analytics has a close proximity to data min-ing approaches. Mining big data is more challenging thantraditional data mining due to massive data volume. Thecommon practice is to extend the existing data miningalgorithms to cope with massive datasets, by executing onsamples of big data and then merging the sample results.This kind of clustering algorithms include CLARA (Cluster-ing LARge Applications) [18] and BIRCH (Balanced Itera-tive Reducing using Cluster Hierarchies) [19]. Researchershave also emphasized on the reduction of computationalcomplexity of data mining algorithms. For example, spec-tral regression discriminant analysis significantly reducesthe time and space complexity by simplifying discriminant
analysis to a set of regularized least squares problems [20].Similarly, Shi et al. [21] reduce the space complexity ofnon-linear discriminant analysis from O(n2) to O(n), tominimize computation and storage problem on large-scaledatasets.
Nevertheless, time and space complexity of most of themachine learning and statistical methods are very high tobe effective for real time analysis on large-scale dataset.In the recent years, distributed and parallel computingtechnologies have emerged as the prime solution to large-scale computing problems, due to their scalability, perfor-mance, and reliability. Therefore, efforts have been madeto perform big data analytics using distributed computing,under strict performance and reliability constraints. Con-sequently, distributed data analytics algorithms have beenproposed in the literature. Mining of distributed data initself has emerged as a new paradigm of data analytics.It should be noted that, to be effective, the nodes shouldperform the computations independently, i.e., without con-stantly sharing intermediate data with peer nodes. Park andKargupta [22] discuss the distributed algorithms for classi-fier learning, association rule mining, and clustering. Ranaet al. propose a component-based system, designated asPaDDMAS, for developing distributed data mining applica-tions [23]. Similar systems for distributed machine learningmethods are proposed, such as MLbase [24]. Further, cloudcomputing infrastructure-based systems are also proposedfor performing distributed machine learning, such as theDistributed GraphLab [25] framework that emphasizes onconsistency and fault-tolerance in distributed analytics.
The main driving force for big data analytics has beenthe industry researches for massive-scale commercial ap-plications. Although cluster and grid computing have ex-isted for long, they are designed specifically for particularapplications and require high cost and expertise. There-fore, the technologies for big data analytics did not evolvesignificantly in that period. When cloud computing in-frastructure and distributed processing platforms, such asMapReduce [26], and their open source implementationsbecame widely available, the research on big data analyticsescalated. Iterative graph processing systems, for solvinglarge scale practical computing problems, have also beenproposed. The proprietary graph processing architecturedeveloped at Google, known as Pregel [27], addresses dis-tributed processing of large scale real-life graphs. An open-source counterpart of Pregel is Apache Giraph14, whichprovides additional features, such as edge oriented inputand out-of-core computation.
Moreover, the rising data volume has contributed to theincreasing demand for big data analytics. In the recent years,distributed file system technologies, such as HDFS [28] andQFS [29], as well as NoSQL databases for unstructured data,such as MongoDB15 and CouchDB16 have been widely usedfor big data analytics.
Machine learning libraries have been developed for bigdata analytics. The most notable machine learning libraryfor big data analytics is Apache Mahout [30], which contain
14. giraph.apache.org15. www.mongodb.org16. couchdb.apache.org

JOURNAL OF LATEX CLASS FILES, VOL. 13, NO. 9, SEPTEMBER 2014 6
implementations of various machine learning techniques,such as classifiers, clustering, and recommender systems,which are scalable to large scale datasets. MLlib17 is a similarlibrary to perform machine learning on big data on theApache Spark platform, a MapReduce variant for iterativeand fast computations on big data. However, these librariesstill lack many important machine learning methods andmore contributions are needed from the community.
1.5 Contributions
This paper provides an in depth study on the sources andtypes of big data in bioinformatics, the existing machinelearning and big data techniques to analyze them, and thelimitations and future research. The contributions of thispaper are listed below.
1) Two additional characteristics to the traditional defini-tion of big data are introduced. Accordingly, big dataare also incremental and geographically distributed.
2) The problems in bioinformatics, that face the challengesof huge, ever growing, and heterogeneous datasets, arecategorized into seven classes. Research issues in eachof these problem categories are identified.
3) State of the art big data technologies are classified intothree classes based on their overall system architec-tures. The generic architectures for each of the classesare introduced.
4) Machine learning methods for large scale data analyticsare presented. The limitations of the traditional meth-ods and their incremental versions for fast, scalable, andaccurate big data solutions are discussed.
5) Big data tools and machine learning techniques avail-able for each category of the bioinformatics problemsand the scope for future contributions are discussed.
1.6 Organization of the paper
The paper is organized as follows. In Section 2, generic ar-chitectures for the existing big data analytics computationalmodels are presented. The traditional as well as the big dataoriented machine learning methods, along with discussionon their capabilities and limitations are discussed in Section3. In Section 4, the issues and challenges associated withbig data analytics are discussed. Existing big data tools forbioinformatics are presented in Section 5 and our conclu-sions on the study are presented in Section 6.
2 ARCHITECTURES FOR BIG DATA ANALYTICS
Big data analytics systems have been proposed with sev-eral architectures. However, many of them share commoncomputational models. Based on our study, we classify bigdata solutions into three major architectures. Each of themhas their own advantages as well as limitations, and theirsuitability depends on the nature and requirements of thealgorithm to be implemented. These are discussed below.
17. spark.apache.org/mllib
2.1 MapReduce architecture
MapReduce is a data-parallel architecture, originally devel-oped by Google [31]. Parallelism is achieved by multiplemachines or nodes performing the same task on differentdata. Apache Hadoop18 is a highly used open-source im-plementation of MapReduce. A MapReduce daemon runson the nodes all the time. There is one master node thatperforms the configuration and control throughout the exe-cution of the problem. The other nodes are called the workernodes and perform actual computation on data. The masternode also splits the data, assigns them to worker nodes,and puts them into the global memory as (key, value) pairs.Figure 3 depicts the basic architecture of MapReduce, whereWi’s are the worker nodes.
Communication Network
W1 W2 W3 Wn Master….
…..Data Split
Shared Global Memory
Fig. 3. MapReduce architecture
MapReduce works in rounds, each consisting of twophases, namely map and reduce phases. A node can beused in both map and reduce phases. Each phase consistsof three states: input, computation, and output. There isone synchronization barrier between any two consecutivephases. During synchronization, local memory of a node iscleared and written onto the global memory. The masternode can read/write onto the global memory and com-municate with the other nodes during all time. However,the worker nodes can read/write onto the global memoryonly during synchronization. In Figure 3, this has beendistinguished using thick and thin arrows.
During the map phase, the problem is data-distributedamong the worker nodes and the partial results generatedby the worker nodes are stored in the global memory.During the reduce phase, the partial results are combined toobtain the overall result, to be stored in the global memory.If the intermediate results need to be further processed, thephases are repeated again.
MapReduce architecture performs well when the datasize is huge and the problem in hand is embarrassingly par-allel. The architecture provides fault-tolerance by re-doingthe computation (done by the failing node) for the phaseon another node. However, the architecture has limitationsfor problems involving high computational dependenciesamong data. Moreover, the architecture cannot be used toexpress iterative computations and becomes inefficient withhigh I/O overhead.
18. hadoop.apache.org

JOURNAL OF LATEX CLASS FILES, VOL. 13, NO. 9, SEPTEMBER 2014 7
Efforts have been made to mitigate the limitationsof the MapReduce architecture and improve its perfor-mance. Twister [32] optimizes iterative computations on theMapReduce architecture by using in-memory computations,rather than writing onto the distributed memory after eachphase. However, Twister has fault-tolerant issues due to in-memory processing. Apache Spark19 extends Hadoop byusing Resilient Distributed Database (RDD) [33] to allowin-memory processing as well as fault-tolerance by re-constructing a faulty partition in case of node failure.
2.2 Fault tolerant graph architectureWhile MapReduce and its different implementations pro-cess data in batch mode, they are not very expressivewhen complex computational dependencies exist amongdata. Most of the machine learning and statistical methodsinhibit high data dependencies. Therefore, MapReduce isnot the best architecture for them. Alternate architecturesare needed to process the complex and iterative problemsefficiently, while supporting fault tolerance. Fault toleranceis important for scalability also, since it allows to use unre-liable networks, such as the Internet.
In order to achieve that, a fault tolerant graph-basedarchitecture, called GraphLab, was first proposed by Lowet al. [34] and later many other big data solutions adoptedsimilar architectures. In this architecture, the computationis divided among nodes in a heterogeneous way, with eachof them performing some particular tasks. The data modelis divided into two parts, i) a graph with computing nodesand ii) a shared global memory (distributed). The genericarchitecture is depicted in Figure 4. The Ni’s represent thecomputing nodes and the dotted arrows show the depen-dencies among the nodes, whereas actual communication isperformed via the communication network.
Communication Network
N1
Shared Global Memory
…. Nn
N2
N3
N4
N5
Fig. 4. Architecture for Graph with global shared memory
Similar to MapReduce, the computation is carried outin execution cycles in a synchronous manner. The shareddatabase is initialized with the input data. At the beginningof each cycle, a node first reads the shared database and thenperforms computation using its own and its neighbor’s data.Then the results are merged and then written back to theglobal shared database, for use in the next execution cycle.If a particular node fails in one cycle, it is recomputed andthe dependent nodes lose one cycle. Although it reduces the
19. spark.apache.org
efficiency by a cycle, the fault tolerance is guaranteed. If anode fails permanently, then it is replaced.
This architecture provides high expressiveness for com-plex problems with data dependency and iterations. How-ever, the architecture demands high disk I/O and therefore,it is not optimized for performance. To the best of ourknowledge, an improvement using RDD to facilitate in-memory processing and fault tolerance is not yet proposed.
Apart from GraphLab, other major graph-based big datasolutions are Pregel and Giraph. Graph packages are alsodeveloped for the MapReduce architecture, such as GraphXand the Hama20 graph package called Angrapa.
2.3 Streaming graph architecture
The graph-based architecture discussed above allows scal-able distributed computation, complex data dependencyamong operations, efficient iterative processing, and faulttolerance. However, due to its high disk read/write over-head, it is not efficient for stream data. Although thereare packages to perform analytics on stream data on theMapReduce architecture, such as Spark Streaming21, theyinternally convert stream data to batches for processing.Stream applications require in-memory processing for highbandwidth. The well known Message Passing Interface(MPI) [35] is a good fit for this problem. At the applicationlevel, MPI has similar API as MapReduce and almost allMapReduce programs can also be implemented using MPI.Figure 5 depicts the graph-based architecture for large scaledistributed processing, for high bandwidth and iterativeapplications with high data dependency among operations.This architecture is in line with the ever increasing comput-ing speed and improved network bandwidth and reliability.
Communication Network
N1 …. Nn
N2
N3
N4
N5
Fig. 5. Architecture for graph-based asynchronous processing
There are three major differences between this architec-ture and the previous one. First, in this architecture, a globalshared memory is not used, rather the nodes exchangedata using peer-to-peer communications directly. Second,the operations are performed in an asynchronous manner.The different data flows become synchronous only duringtheir merge operations. Finally, in this architecture, dataneed not be stored into disks. As memories are becomingcheaper everyday, in-memory processing of large volumedata is possible, which significantly increases the overallthroughput.
20. hama.apache.org21. spark.apache.org/streaming

JOURNAL OF LATEX CLASS FILES, VOL. 13, NO. 9, SEPTEMBER 2014 8
The main disadvantage of this architecture is the absenceof fault tolerance. If any one of the nodes fail, the process hasto start from the beginning all over again. Consequently, thisarchitecture is unsuitable in unreliable networks, such as theInternet. This in turn causes scalability issues. However, ifa reliable network is available and the algorithm has highdata dependency, then this architecture can provide higherthroughput than the other architectures. This architecturecan be implemented on standalone clusters using MPI toperform analytics on big data .
3 MACHINE LEARNING FOR BIG DATA ANALYTICS
Machine learning techniques have been found very effectiveand relevant to many real world applications in bioinfor-matics, network security, healthcare, banking and finance,and transportations. Over time, bioinformatics and health-related data are created and accumulated continuously,resulting in an incredible volume of data. Newer formsof big data, such as 3D imaging, genomics and biometricsensor readings are also fueling this exponential growth.Future applications of real-time data, such as early de-tection of infections/diseases and fast application of theappropriate treatments (not just broad-spectrum antibiotics)could reduce patient morbidity and mortality. Already, real-time streaming data monitors neonates in the ICU, catchinglife-threatening infections at real time. The ability to per-form real-time analytics against such voluminous streamdata across all specialties would revolutionize healthcare.Therein lies data with volume, velocity, and variety.
Machine learning is a field of computer science thatstudies the computational methods that learn from data [36].There are mainly two types of learning methods in machinelearning, viz., supervised and unsupervised learning meth-ods [37]. In supervised learning, a method learns from aset of objects with class label, often called a training set.The acquired knowledge is used to assign label to unknownobjects often called test objects. On the other hand, unsuper-vised learning methods do not depend on the availability ofprior knowledge or training instances with class labels. Allthese machine learning methods require preprocessing ofdatasets for effective results. Feature selection is one of theimportant preprocessing tasks that leads to improved resultand reduced time requirement. Hybrid learning methods,such as Deep learning, have become popular in the recentyears and provide significantly high accuracy.
Advanced data capturing technologies have led to accu-mulation of a very high volume of data, growing rapidlyover time. Although the computational technologies haveimproved over time, this improvement is not proportionateto the rate of increase in data volume. The traditional ma-chine learning methods are found inadequate in handlingvoluminous data using the current computational resources[38]. Figure 6 depicts the contrast between traditional datamining and mining of big data.
To apply a traditional, or enhanced a new machinelearning method to analyze big data, following propertiesare desirable.
• Scalable to high volume: The method should be able tohandle large chunk of data with low space complexityand less disk overhead.
SamplingFeature
Selection
Distributed processing
Traditional learning Big data learning
Can handle volume?
Big data (volume, variety, velocity, incremental,
distributed)
Large scale data
Small scale data
Yes No
Data have variety?
No
Yes
Fig. 6. Traditional data mining and mining of big data
• Robust with high velocity: The method should havelow time complexity and be able to digest and processstream data in real time without any degradation inperformance.
• Transparent to variety: Big data can be semi-structuredor unstructured in nature. However, most traditionalmachine learning methods are able to process datasetswith a fixed schema, which is normally generated froma single source. By the term schema, we refer to anordered set of features and the relations among them. Amachine learning method for big data analytics shouldbe able to handle data from multiple sources withdifferent schema.
• Incremental: Typically, machine learning methods oper-ate on entire datasets at once without accounting for thesituation where dataset dynamically grows over time. Amachine learning method for big data analytics shouldconsider the inconsistent arrival of data over time andshould be able to handle such data with minimum cost,without compromising quality.
• Distributed: A machine learning method should allowdistributed processing on partial data and merging ofthe partial results. With big data sources distributedaround the world, all data may not be available at asingle location for big data analytics.
3.1 Feature Selection
The main objective of feature selection is to select a subset ofmost relevant and non-redundant features that can increasethe performance of a learning method. A feature selectionmethod can improve the performance of prediction modelsby removing irrelevant and redundant features with alle-viating the effect of the curse of dimensionality, enhancingthe generalization performance, speeding up the learningprocess, and improving the model interpretability [39]. Dueto wide application of computer networks and Internet,data over Internet communication as well as in many otheronline services must deal with large volume of data with

JOURNAL OF LATEX CLASS FILES, VOL. 13, NO. 9, SEPTEMBER 2014 9
volume, velocity, and variety. Moreover, in many businessapplications, handling big data is an essential requirementbut taking instant decision reliably on big data is still anopen research issue. Such big data pose great challengesfor feature selection in terms of performance, scalability,robustness, universality, nonlinearity, and cost and imple-mentation complexity.
A feature selection plays a major role in identifying themost important features from a ultrahigh dimensional bigdataset. The selected feature set can be used for processinglarge volume of data to take instant decision in short periodof time. Especially, in big data analytics, relevant featurescan be selected from large data using both supervisedlearning as well as unsupervised learning. Hence, rankingthe features based on their relevance and selecting themost relevant features can vastly improve the generalizationperformance.
Feature selection is also considered very important forbig data analytics due to its characteristics of semi-infiniteprogramming (SIP) problem [40]. The SIP is an optimizationproblem that can be stated either it is associated with a finitenumber of variables and an infinite number of constraints,or an infinite number of variables and a finite number ofconstraints. To address the SIP problem, Tan et al. [41]propose an efficient feature selection algorithm works itera-tively and selects a subset of features, and solves a sequenceof multiple kernel learning (MKL) subproblems. Authorsclaim that the proposed method converges globally undermild condition and yields low biasness on feature selection.
In bioinformatics, protein sequence analysis and PPIanalysis are complex problems in functional genomics. Afeature vector exhibits protein sequences with distinguishedcharacters and the feature vector plays a major role duringanalysis of protein sequence. However, a major problem ofPPI dataset is that it contains huge number of enormousfeatures which increase not only the complexity of analysisbut reduce prediction accuracy. To overcome this problem,Bagyamathi et al. [42] propose a new feature selectionmethod combining Improved harmony search algorithmwith rough set theory to tackle the feature selection problemin big data.
Barbu et. al. [43] propose a novel feature selectionmethod with annealing technique for big data learning. Inthis method they reduce the dimensionality of an instancefrom M to k using an annealing plan to decrease greedi-ness and remove the most irrelevant variables to facilitatecomplex computation. They termed the feature selectionproblem as a constrained optimization problem defined asβ=arg min L(β), such that, |{j : βj 6= 0} ≤ k|, where k isthe number of relevant features. The algorithm is extremelysuitable for big data computation due to its simplicity andability to reduce the problem size throughout the iteration.
Incremental learning is useful to predict behavior ofbig data in terms of adaptiveness. An incremental learningmethod considers subset of features selected incrementallyfrom samples of data over time. For efficient analysis ofhigh volume of data with random velocity and multiplevarieties, incremental feature selection method selects thosefeatures that can predict the behavior of data efficiently.Zeng et al. [44] propose an incremental feature selectionmethod called FRSA-IFS-HIS (AD) using fuzzy-rough set
theory on hybrid information systems. The method has beenfound effective compared to non-incremental fuzzy-roughset feature selection method applied on big data.
3.2 Supervised Learning
In supervised learning, labeled training examples are usedto train the learning algorithm. The objective of a super-vised learning model is to predict the class labels of testinstances based on knowledge gained from the availabletraining instances. Within supervised learning family wecan further distinguish between classification models whichfocus on prediction of discrete (categorical) outputs or re-gression models which predict continuous outputs. Amonglarge number of models reported in the literature linearand nonlinear density-based classifiers, decision trees, naiveBayes, support vector machines (SVMs), neural networksand K-nearest neighbour (KNN) are the most frequentlyused methods in many applications [45] [46] [47] [48].
In big data analytics, we need some advanced super-vised approaches for parallel and distributed learning suchas Multi-hyperplane Machine (MM) classification model[49], divide-and-conquer SVM [50], and neural networkclassifiers. Among these SVM is one of the most efficient andwidely used supervised learning method and several mod-ified SVM methods have been introduced for big data ana-lytics. Nie et al. propose a modified SVM called New PrimalSVM for big data classification [51]. The method uses a novellinear computational cost primal SVM solver using two lossfunctions called L1-norm and L2-norm in Augmented La-grange Multipliers (ALM). Individual detection of patientswith Parkinson disease using SVM analysis was proposedby Haller et. al. [52]. In this work, the authors adopt a com-plex methodology including a chain of tract-based spatialstatistics (TBSS) preprocessing of DTI fractional anisotropydata, feature selection of the most discriminative voxels, andsubsequent SVM classification. Experimental results estab-lish the effectiveness of the proposed method and feasibilityof performing SVM individual classification of DTI data inpatient diagnosis, which may merit future prospective andlarger scale follow-up studies. Giveki et. al. [53] propose aweighted SVM based on mutual information and modifiedcuckoo search for automatic detection of diabetics diagnosis.The method first applies principal component analysis forfeature selection from diabetes dataset and estimates thebest feature weights using mutual information. Afterwards,the method is applied to classify patients where modifiedcuckoo search is used to find the best value for C and γparameters of the proposed methods.
Another SVM-based decision support system for heartdisease classification with integer-coded genetic algorithmto select crucial features was proposed by Bhatia et. al.[54]. The method uses an integer-coded genetic algorithmto select an optimal subset of features from Cleveland heartdisease database which maximizes the SVM classificationaccuracy with a reduced number of features used by theSVM classifier to classify heart disease. Son et al. [55] useSVM to classify heart failure patients.
Distributed decision tree is another significant effort toimprove the performance of decision tree induction whenprocessing on big data by parallelizing the induction process

JOURNAL OF LATEX CLASS FILES, VOL. 13, NO. 9, SEPTEMBER 2014 10
and by performing the induction process in distributedenvironment. Ye et. al. propose techniques to distribute andparallelize Gradient Boosted Decision Trees(GBDT) [56]. Itis very straightforward to convert GBDT to MapReducedmodel and in this method a MapReduced-based GBDT wasemployed for horizontal data partitioning. According to theauthors, due to the high communication overhead of HDFS[57], Hadoop is not suitable for this algorithm.
Calaway et al. [58] propose fast, scalable and dis-tributable decision tree called rxDTree which can estimatedecision trees efficiently on big data. This algorithm iswidely used in classification and regression problems of bigdata. It computes histograms to create empirical distributionfunctions of the data and builds the decision tree in abreadth-first fashion. The algorithm can be executed in par-allel settings, such as a multicore machine or a distributed(cluster or grid) environment.
For big data, an intelligent agent could provide hint onareas of data that might the users would be very useful. Ifthe dataset has categories for different user classes as classlabels, then the labels can be used to train a decision tree toclassify unseen data. But, the training set will be much largerthan usual and hence, the rule generation for decision treeis a complex and time consuming process. To handle thisproblem, Hall et al. [59] propose a modified decision treelearning that generates rules from a set of decision treesbuilt in parallel on tractable size training dataset.
3.3 Unsupervised learning
Unsupervised learning do not use the class labels of theobjects for learning [60]. Clustering is an unsupervisedtechnique that attempts to group objects to optimize thecriterion that states that distance among objects in the samecluster is minimized and distance among objects in differentclusters is maximized [61]. A major issue in clustering is thecomputation of distance between a pair of objects. Variousproximity measures have been used for this purpose, suchas Euclidean, Cosine, and city block distance. In traditionalclustering, all the features are used while computing thedistance between a pair of objects. A cluster is a group ofobjects that are close to each other with respect to theirmutual distance. In other words, they are similar in natureover the entire set of features. However, in a number of ap-plications, especially where number of available features ina dataset is very large, researchers are interested in findinggroups of objects that are similar over subset of the availablefeatures [62]. This requirement has led to the emergence ofanother variant of clustering called biclustering, where eachbicluster is associated with a subset of features.
Clustering and biclustering analyses two dimensionaldata, where each feature corresponds to an attribute of theobjects. Value of an object over a feature is some formof quantification of the concerned attribute. With adventof data capturing technologies, it has been possible totrace down dynamic nature of the object attributes bycapturing values over multiple consecutive time instances.This arrangement leads to generation of three dimensionaldatasets. Another variant of clustering, called triclusteringoperates on such datasets to generate triclusters. A triclusteris a group of objects that are not only similar over a subset
of features, but are also similar across a subset of time points[63]. Triclustering promotes grouping of objects, featuresand time points simultaneously.
3.3.1 Existing clustering methodsNumerous clustering methods have been proposed so farin the field of machine learning. These clustering methodsare mainly classified into partitional clustering, hierarchicalclustering, density-based clustering, graph theoretic cluster-ing, soft computing-based clustering, and matrix operationbased clustering [64]. Partitional clustering methods assignobjects to one of the k clusters, where k is a user givenparameter, to iteratively optimize a criterion function. K-means [65] assign objects to the nearest cluster centroiditeratively until there is no more assignment possible. Par-titioning Around Medoids (PAM) [66] is another partitionalclustering method that uses medoids instead of centroids.PAM is robust, but inefficient in handling large dataset dueto its O(n2) complexity. CLARA [66] and CLARANS [67]are two popular partitional clustering methods that usesampling for large datasets. CLARA draws a sample ofobjects on which PAM is applied. CLARAN uses samplingduring neighborhood search operation. Both CLARA andCLARANS attempt to handle large dataset.
Hierarchical clustering methods can be classified intoagglomerative and divisive methods [68]. Agglomerativeapproaches operate in bottom up direction on a tree andstarts with nodes with individual objects. These nodes areiteratively merged to reach the root of the tree. In divisiveapproach, root with all the nodes are iteratively splitted tofinally reach the leaf nodes. BIRCH [19] is a popular ag-glomerative hierarchical clustering method that constructsclustering feature (CF) tree first, which is operated in abottom up fashion to extract the clusters. CURE [69] isanother popular hierarchical clustering method that startswith some scattered objects to form clusters. These clustersare then shrunk towards theirs centers. DIANA [66] is adivisive hierarchical clustering method that splits largestcluster iteratively to find splinter groups.
Density-based clustering methods find clusters charac-terized as dense areas and separated by low dense regions[70]. Density of a node is measured using neighbourhoodanalysis. DBSCAN [71] is a very popular density-basedclustering method that starts from an initial object andincludes objects from it’s neighbourhood iteratively if theysatisfy a user defined threshold to form a cluster. DENCLUE[72] is another popular density-based clustering method thatuses kernel density function. A cluster is defined as a localmaximum of the density function.
Graph theoretic clustering methods use properties andconcepts of graph theory [73]. CLIQUE [68] a graph theoret-ical clustering method tries to locate maximally completesubgraphs in the connectivity graph derived from actualdatasets. These subgraphs correspond to detected clusters.Chameleon [74] is another graph theoretic agglomerativehierarchical clustering method that uses k-nearest neighborgraph. Here, edges are iteratively deleted if connectingnodes are not included in the k-nearest neighbour sets ofeach other.
Soft computing-based clustering methods use soft com-putation tools, such as fuzzy set and neural network. Fuzzy
JOURNAL OF LATEX CLASS FILES, VOL. 13, NO. 9, SEPTEMBER 2014 11
c-means [75] a soft computing-based clustering method, is acrisp method, which allows objects to belong to more thanone cluster with the constraint that the sum of membershipof an object across all the clusters is equal to one. Thismethod tries to find a crisp partition that minimizes a costfunction. SOM [76] is another very popular soft computingbased clustering method that projects high dimensionalvectors to a two dimensional grid space. Iteratively theseobjects are moved to dense regions that correspond to theclusters.
There are a lot of biclustering algorithms proposed byresearchers. Cheng and Church [62] propose a biclusteringmethod that iteratively deletes and adds objects and featuresin a greedy manner. OPSM [77] detects order preservingsub-matrices in data matrix which correspond to clusters.BIMAX [78] biclustering method binarizes the data ma-trix and locate submatrices with zero entries in all thecells. Spectral biclustering [79] uses eigen vectors to detectcheckerboard structures in the data matrix that correspondto biclusters. SAMBA [80] formulates biclustering problemfrom graph theoretic view point and tries to find heavysubgraphs in a weighted bipartite graph. FLOC [81] startswith some initial seeds and then iteratively moves rows andcolumns to improve quality of biclustering with respect toa criterion function. ISA [82] is another biclustering methodthat incorporates randomization and finds biclusters withobjects that possess constant values or coherently increasingvalues over the associated feature subset. To address theneeds of biclustering problem effort is still underway [83],[84], [85], [86]
In comparison to the number of clustering and biclus-tering methods, there are not many triclustering methods.Jiang et al. [87] propose a set enumeration-based methodto mine triclusters from 3-dimensional datasets using Pear-son correlation coefficient. Authors propose two variant ofthe method to extract triclusters that are spread over allthe time points. TRICLUSTER [88] is another well knowntriclustering method that extracts maximal triclusters from3-dimensional datasets using a graph theoretic approach.gTRICLUSTER [89] uses Spearmen correlation coefficient tomeasure correlation among objects across time points whilemining triclusters. ICSM [63] is a triclustering method thatoperates on possible pairs of time planes and detects someinitial modules which are further extended to triclusters.
3.3.2 Clustering methods for Big DataThough researchers have been trying to design clusteringmethods to address the issues mentioned above, none ofthese methods are seemed to handle all these issues simul-taneously. Parallel clustering methods are seemed to be asolution for huge volume of data and incremental clusteringmethods handle high velocity data. Similarly, multi-viewclustering methods are designed to handle data with variety.
The DBSCAN, DENCLUE, CLARA, CLARANS, andCURE methods discussed earlier are designed to handlelarge scale data. Two versions of k-means, namely k-modeand k-prototype methods [90] operate on large scale categor-ical and mixed type data, respectively. These methods use alow-complexity dissimilarity measure and cost function tomake k-means suitable for large scale datasets. Ordonez etal. propose a variant of k-means [91] to minimize memory
requirement and number of scans over the dataset. Bradleyet al. propose a framework [92] to iteratively perform sam-pling from a large scale dataset and in each iteration, amodel is improved to finally produce clusters. WaveCluster[93] uses wavelet transform to convert spatial domain datato frequency domain using a kernel function.
Li et al. propose parallel partitional and parallel singlelikange hierarchical clustering methods [94] on SIMD com-puters. Zhao et al. propose a parallel k-means clusteringmethod that uses MapReduce architecture [95] to analyzeparallel portions of the method. Similarly, PDBCSCAN [96]finds clusters from data distributed over multiple machinesand the results are merged. P-cluster [97] partitions theobjects to minimize the error. PBIRCH [98] is a parallel ver-sion of BIRCH that continuously distributes the incomingdata among multiple processors using message passing andshared nothing architecture.
There exists incremental clustering methods to accomo-date new objects without rerunning the clustering methodon old objects. Chakraborty et al. propose an incrementalk-means clustering [99] that computes new cluster centersby only using the existing cluster centers and the newlyarrived object. Widyantoro et al. propose an incrementalhierarchical clustering [100] that restructures the region ofthe object hierarchy by inserting the new object througha sequence of restructuring processes. IGDCA [101] is anincremental density based clustering method that dividesdata space into units with high density to form clusters.Insertion or deletion of an object only affects density of theunit to which it belongs.
Though multi-view learning is mostly in supervisedand semi supervised learning, there are a few works thataddresses the problem of unsupervised multi-view learning.Kailing et al. propose a multi-view clustering method [102]based on DBSCAN clustering method. The method operateson different feature spaces of various objects separatelywithout combining these spaces. Zeng et al. propose aframework [103] that performs clustering in different featurespaces separately and then iteratively project and propagatethe clustering results in multiple graph-based link layersuntil they converge. Chaudhuri et al. propose a multi-viewclustering method [104] to project multi-views to lowerdimensional space. The method tries to locate low dimen-sional subspace using a subspace learning method based oncanonical correlation analysis. Kumar et al. propose a multi-view version of spectral clustering [105] that computeseigen vectors in different feature spaces and use these eigenvectors to improve graph structures of other view iteratively.The authors propose another multi-view version of spec-tral clustering [105] method that uses coregulation-basedapproaches to find coherent eigen vectors from differentgraphs.
3.4 Deep LearningDeep learning attempts to model high-level abstractionsin data using supervised and/or unsupervised learningalgorithms, in order to learn from multiple levels of abstrac-tions. It uses hierarchical representations of data for classi-fication. Deep learning methods have been used in manyapplications, viz., pattern recognition, computer vision, nat-ural language processing and speech recognition. Due to

JOURNAL OF LATEX CLASS FILES, VOL. 13, NO. 9, SEPTEMBER 2014 12
exponential increase of data in these applications, deeplearning is useful for accurate prediction from voluminousdata. In recent years, reseachers have developed effectiveand scalable parallel algorithms for training deep models[106]. Many organizations use deep learning for decisionmaking, information retrieval, and semantic indexing. Adeep learning architecture is shown in Figure 7. Input dataare partitioned into multiple samples for data abstarctions.The intermediate layers are used to process the features atmultiple levels for prediction from data. The final predictionis performed at the output layer using the outputs of itsimmediate upper layer.
Input Layer
Data Representation
Sampling
Sub-Sampling
Hidden
Layers
Output
Layer
Prediction
Fig. 7. Deep Leaning Architecture
Deep learning represents data in multiple layers. It canefficiently process high volume of data, where shallowlearning fails to explore due to the complexities of datapatterns. Moreover, deep learning is quiet suitable for ana-lyzing unstructured and heterogeneous data collected formvarious sources.
Traditional neural networks pose two problems, viz.,poor performance due to local optima of a non-convexobject function and incapability to exploit unlabeled data,which are abundant and cheap. To overcome these lim-itations of traditional neural networks, Deep Belief Net-works (DBN) [107] was introduced with a deep learningarchitecture to learn from both labeled and unlabeled data.The deep architecture of DBN integrates unsupervised pre-training and supervised fine-tuning strategies. The unsuper-vised pre-training is used to learn data distribution, whereasthe supervised fine-tuning is used for local optima search.Ngiam et al. [108] propose a deep learning method byintegrating both audio and video data for learning represen-tations. The solution is effective in learning from multipleabstractions and can capture correlations across multipleabstractions.
Big data are continuously generated at a very high speedand require fast processing. Therefore, learning solutionshould not only be fast and efficient, but also be able tohandle incremental data. However, we could not find a deeplearning method that considers incremental data. Moreover,
deep learning can handle only volume and variety of bigdata [109].
3.5 Inference of Large Scale GRN with AssociationRule MiningIn system biology, complex dynamic behavior of a groupof genes and how it influences the expression of othergenes, may be represented as GRN. By comparing be-tween normal and diseased networks, one can identifypotential drug targets for the target disease [110]. Researchlabs are producing a large number of expression data andconsequently, the state-of-the-art inference techniques areinsufficient in handling such large scale GRN. Microarrayexperiments conducted in different growth environmentsleads to heterogeneous data. Presence of steady-state andperturb expression data make the task of inference morechallenging. Looking into the magnitude of difficulties inhandling such voluminous, continuous, and heterogeneousdata, the task of GRN inference may be considered as abig data analytics problem [111], [112]. Specialized inferencemethods in big data paradigm are very much necessary.A number of inference methods have been proposed forlast several years [113], [114], [115], [116], [117], [118], [119].However, they are limited in handling data sets with morethan thousands of genes. In most of the cases, executionperformance degrades exponentially with the increase innumber of nodes or genes in the network. The scenariobecomes more adverse with the increase in number of con-ditions (dimensions) or time points in time series expressiondata.
3.5.1 Serial Association MiningAssociation rule mining (ARM) came into existence as mar-ket basket analysis on boolean datasets. In association min-ing the sizes of datasets are semi large that can usually beaccommodated on main memory. Typically, they are staticin nature.
The AIS (Agrawal, Imielinski, Swami) [120] and Apri-ori [121] are two pioneering algorithms for mining associ-ation rule Although, they are robust, two major limitationsare that they generate too many candidate itemsets and re-quire too many passes over the whole database. SETM [122]was motivated by the desire to use SQL to calculate largeitemsets, whereas, DHP (Direct Hashing and Pruning) at-tempts to reduce the number of candidate itemsets [123].
The partition approach [124] mines frequent itemsetsfrom large datasets by dividing into smaller partitions,whereas, sampling [125] reduces the number of databasescans. DIC (Dynamic Itemset Counting) [126] drasticallyreduces the number of scans of the database during frequentitemset finding. FP-Growth [127] finds frequent itemsetswithout candidate generation. However, the time taken toconstruct the FP-tree is quite large and its performance de-grades with the increase in support count. Recently, anothereffective algorithm called OPAM [128] has been proposed,for finding all the frequent itemsets without generating anycandidate sets. OPAM adopts an integrated approach tosolve the frequent itemset finding problem in a single passover the database.
Today, most real-world databases are heterogeneous innature, contain only quantitative data or both quantitative

JOURNAL OF LATEX CLASS FILES, VOL. 13, NO. 9, SEPTEMBER 2014 13
and categorical data. Further, such databases are multi-dimensional and their volume seems to be large. And this iswhere the conventional ARM techniques almost fail to sat-isfy the demand of mining fast growing varied voluminousdata.
Attribute partitioning approach is the most evident oneto deal quantitative attributes [129]. As reported in [130],a possible solution to figure out meaningful quantitativeregions for the discovery of association rules is clusteringapproach.
3.5.2 Distributed and Parallel Association Mining
Sequential techniques are inadequate to provide scalabilityin terms of dimension, size or data which are spread aroundgeographically dispersed locations. To cope up with suchcircumstances, researchers are looking for high-performanceparallel and distributed association mining techniques. Inthe yester-years, a number of such techniques have been de-veloped. These are mostly the extensions of already existingsequential methods.
The Count Distribution [131] is a simple parallelizationof Apriori. This algorithm minimizes communication, be-cause only the counts are exchanged among the processors.However, the algorithm replicates the entire hash tree oneach processor and does not use the aggregate systemmemory effectively. PDM [132] is based on DHP [123]. InPDM, each processor generates the local supports of 1-itemsets and approximate counts for the 2-itemsets with ahash table. Next, PDM obtains the local counts for all can-didates and exchanges them among all processors to deter-mine the globally frequent itemsets. FDM (Fast DistributedMining) [133] builds on Count Distribution [131], and theauthors propose new techniques to reduce the number ofcandidates considered for counting and hence minimizescommunication. FDM also suggests three optimizations:local pruning, global pruning, and count polling. To addressthe issues of FDM, a parallel version of FDM, called FastParallel Mining (FPM) [134] was introduced. FPM generatesfewer candidates and retains the local and global pruningsteps. But instead of count polling and subsequent broadcastof frequent itemsets, it simply broadcasts local supports toall processors.
Other than improvement in computational cost, dis-tribute or parallel versions inherently carry all the demeritssuffered by their respective serial methods. Recently, severalefforts have been made to extend some of the serial rule min-ing methods to be implemented in MapReduce frameworkfor faster execution [135] and handling for voluminous data.
3.5.3 Dynamic Association Mining
The techniques discussed in the previous sections are mostlybased on the assumption that the datasets used as inputdoes not change. In practice, no transaction database isstatic. Subsequent update of dataset could potentially in-validate existing association rules. Database updates requirerediscovering the rules afresh by scanning the entire old andnew data. Rediscovering of rules with the updates of thedatabase leads to time consuming computation and leads tosignificant I/O overheads. The dynamics of databases canbe represented as i) incremental updates and ii) decremental
updates. A number of efficient techniques have been devel-oped for mining dynamic datasets.
Fast UPdate (FUP) [136] was proposed to compute largeitemsets in a dataset that is updated regularly. The frame-work of FUP is similar to that of Apriori and DHP and isreferred to as a k-pass algorithm because it scans the datasetk times. The Borders [137] algorithm is based on the conceptof border sets introduced in [138]. It is another incrementalmethod to generate frequent sets. The Decrement UpdatingAlgorithm [139] tries to detect all the frequent itemsets fromdynamically deleted databases.
For faster handling of varied, voluminous data, cur-rent association mining techniques are inadequate. Big dataparadigm demands an integrated solution encompassingalmost all the approaches to handle dynamic, large, andheterogeneous data. Several attempts have been made toinfer GRN based on steady-state time series data. However,none of them can handle dynamic time-series data [112].There is an urgent need of a scalable GRN reconstructionmethod that can work to infer reliable GRNs.
4 CHALLENGES AND ISSUES IN BIG DATA ANALYT-ICS
Bioinformatics research has rapidly become a big dataproblem in the recent years. Big data not only possessesvolume, velocity, and variety, but also are incremental anddistributed. These properties of big data make it extremelydifficult for the traditional data analytics to perform fastand accurately. Machine learning methods may be usefulin handling big data analytics, since they have evolved inthe computer science domain with objectives like perfor-mance and efficiency. The machine learning techniques forbioinformatics, the existing ones as well as those developedfor handling big data, are discussed in the previous sec-tion. This section summarizes some of the challenges andresearch issues in big data analytics using machine learningmethods.
4.1 Challenges in big data analyticsThe techniques used for analysis and visualization of tradi-tional databases are not adequate on big data. The volume,velocity, variety, distributedness, and incremental nature ofsuch data impose challenges on the traditional methodsfor data analytics. The volume of data generation and thespeed of data transmission are growing rapidly. Napatech,a manufacturer of high speed network accelerators reportedin 2014 that all network data will grow with an annualgrowth rate of 23% through 2018. The exponential increasein the use of hand-held devices and their associated sensorshave mostly contributed to the growth of big data in therecent years.
Along with the increase in the data volume, the speedof data generation and transmission are also increasing.According to the Cisco report [140], the average mobilenetwork connection speed in 2014 was 1,683 kbps, whichwill reach approximately 4.0 Mbps by 2019. Real time an-alytics on big data become more difficult with high datavelocity. Although batch mode analytics may be scalableto high data velocity using distributed and parallel com-puting techniques, the slow I/O operations severely affect

JOURNAL OF LATEX CLASS FILES, VOL. 13, NO. 9, SEPTEMBER 2014 14
the analytics performance. In this era, I/O speed is laggingfar behind computing speed, acting as the limiting factor ofcomputational throughput.
Moreover, these continuously generated data are highlyheterogeneous in nature. Traditional databases are arrangedin terms of a set of defined schemas. Data warehouses storeand update data following the extraction-transformation-loading operations. Since big data systems continuouslyfetch new data in high velocity and high variety fromheterogeneous sources, a structured database, such as datawarehouse, is not at all suitable for dynamic storage andreal time retrieval.
Given these challenges, the traditional data analyticstechniques, such as machine learning and statistical anal-ysis, are inefficient with big data in their original form.Consequently, the problem of machine learning enabledanalytics has to be studied from the perspective of big data.
Data privacy is another major challenge of big dataanalytics, particularly in the bioinformatics and healthcaredomain. In order to protect sensitive information, datasources might use data anonymity or publish only partialdata. Analytics on partial or anonymous data might be morecomplex and inefficient.
4.2 Issues in big data AnalyticsBig data analytics require processing of massive amount ofstructured, semi-structured, poly-structured, and unstruc-tured data, that grow over time. Real time analytics im-pose an additional requirement of time bound computation.Techniques from AI may be applied to find patterns andrelations in unstructured data. Similarly, big data analyticscan be scaled using parallel and distributed computingtechnologies, without compromising on accuracy of results.However, traditional data analytics on big data have certainissues regarding scalability and performance, which arediscussed below.
1) An integrated big data analytics architecture that isfault tolerant and able to handle voluminous and varieddata in batches as well as in a continuous stream in realtime is still missing.
2) Distributed computing is the prime solution to handlethe massive volume of big data. However, most of theAI, data mining, and statistical analysis approaches arenot originally designed for distributed computation.Although distributed algorithms have been proposedin the literature [141], [142], [143], they are mostlyacademic research and lack robust implementation,considering various MapReduce frameworks.
3) A big data store does not have a uniform data format.Rather big data analytics need to process heteroge-neous data captured through sensors of various types.Therefore, intelligent algorithms are required to find acoherent meaning from disparate data. This increasesthe complexity of analytics.
4) Unstructured, semi-structured and poly-structureddata introduce more problems, such as data inconsis-tency and redundancy. Data pre-processing is costlydue to their heterogeneous nature and massive vol-ume. Traditional data analytics techniques attemptingto handle inconsistent and noisy data are found costlyin terms of time and space complexities.
5) Big data analytics need to mine datasets at differentlevels of abstraction. This significantly increases thecomplexity of the analytics methods, however, enablingbiologists to analyze the data at various level of ab-stractions help understanding the interest of sematicsbiological data.
5 TOOLS FOR BIG DATA ANALYTICS IN BIOINFOR-MATICS
Various tools have been developed over the years tohandle the bioinformatics problems. The tools developedbefore the big data era are mostly standalone and notdesigned for very large scale data. In the last decade manylarge scale data analysis tools have been developed forseveral problems, such as microarray data analysis toidetify coexpressed patterns, gene-gene network analysisand salient module extraction, PPI complex finding, andRNA/DNA and sequence analysis. However, apart fromcertain sequence analysis tools, the other exsting toolsare not adequate for handling big data or not suitable forcloud computing infrastructures. Along with specific tools,several cloud-based bioinformatics platforms have alsobeen developed to integrate specific tools and to provide afast comprehensive solution to multiple problems, such asGalaxy [144] and CloudBLAST [145].
1) Tools for microarray data analysisLarge number of software tools are available to performvarious analysis on microarray data. However, not allthe software are designed to handle large scale data.With the increase in the size of data sets, the timerequired to generate samples and sequences to identifycomplexes and to process heterogeneous disease queryto find relevant complexes has become prohibitive.Beeline22 handles big data size by parallel computationsand reduction in the data size with adaptive filtering.A quality assurance tool called caCORRECT [146]removes artifactual noises from high throughputmicroarray data. caCORRECT may be used to improveintegrity and quality of both public microarray archivesas well as reproduced data and to provide a universalquality score for validation. A web-based applicationcalled omniBiomarker [147] uses knowledge-drivenalgorithms to find differentially expressed genes forbiomarker identification from high throughput geneexpression data. The approach requires complexcomputation and validation, and omniBiomarker helpsin identifying stable and reproducible biomarkers.
2) Tools for gene-gene network analysisGene expression datasets are already massive in sizeand getting bigger everyday. FastGCN [148] toolexploits parallelism with GPU architectures to findthe co-expression networks in an optimized way.Similar GPU accelerated co-expression networksanalysis methods are proposed by Arefin et al. [149]and McArt et al. [150]. The UCLA Gene Expression
22. illumina.com/applications/microarrays/microarray-software/beeline.html

JOURNAL OF LATEX CLASS FILES, VOL. 13, NO. 9, SEPTEMBER 2014 15
Tool (UGET) [151] performs large scale co-expressionanalysis to find disease gene associations. Diseasenetworks have significantly higher gene correlationsand UGET calculates the correlations among allpossible pairs of genes. UGET has been found effectivewhen tested on Celsius [152], which is the largestco-normalized microarray dataset of Affymetrix-basedgene expression datawarehouse. WGCNA [153] isa popular R package for performing weighted geneco-expression network analysis and can be used in anR-Hadoop distributed computing system.
3) Tools for PPI data analysisPPI complex finding problem is a highly timeconsuming process. From our research experience,standalone implementations for both supervised andunsupervised PPI complex finding, such as MATLABprograms, require days or even weeks of time to findcomplexes from a dataset of approximately 1 millioninteractions on standard workstations. Therefore,there is an urgent need to develop fast big datatools for PPI complex finding and ranking, w.r.t.any heterogenious disease network query. Severalrelatively fast tools have been developed for PPIcomplex (isolated and overlapping) finding, such asNeMo [154], MCODE [155], and ClusterONE [156],either as a standalone tool or as a Cytoscape plugin.However, these tools cannot be used in distributedsystems for better efficiency on large-scale PPI data.Finally, PathBLAST [157] is an important web-basedtool for fast alignment of protein interaction networks.
4) Tools for sequence analysisFor sequence analysis problems, several tools havebeen developed on top of the Hadoop MapReduceplatform to perform analytics on large scale sequencedata. BioPig [158] is a notable hadoop-based tool forsequence analysis that scales automatically with thedata size and can be ported directly to many hadoopinfrastructures. SeqPig [159] is another such tool.The Crossbow [160] tool combines Bowtie [161], anultrafast and memory efficient short read aligner, andSoapSNP [162], an accurate genotyper, to performlarge scale whole genome sequence analytics on cloudplatforms or on a local hadoop cluster. Other cloud-based tools that have been developed for large scalesequence analysis are Stormbow [163], CloVR [164],and Rainbow [165]. There exist other programs forlarge scale sequence analysis that do not use big datatechnologies, such as Vmatch [166] and SeqMonk23.
5) Tools for pathway analysisTo support pathway analysis, a good number oftools have been developed for pathway analysis,such as GO-Elite [167] to describe particular genesor metabolites, PathVisio [168] for analysis anddrawing, directPA [169] to perform analysis in ahigh-dimensional space for identifying pathways,Pathway Processor [170] to analyze expression data
23. www.bioinformatics.bbsrc.ac.uk/projects/seqmonk
regarding metabolic pathways, Pathway-PDT [171]to perform analysis using raw genotypes in generalnuclear families, and Pathview [172] for pathwaybased data integration. However, these tools neitheruse distributed computing platforms, nor they aredeveloped as a cloud-based application, for highscalability.
Although evolutionary research may use tools devel-oped for more specific problems, such as sequence analysisor gene-gene network analysis, a big data tool for com-prehensive evolutionary research is still not known. Theexisting tools for evolution research, such as MEGA [173]and EvoPipes.net [174] are not developed for big data inevolutionary research.
6 CONCLUSION
This paper discusses the recent surge in bioinformatics datastores in terms of volume as well as dimension. With theadvent of new high throughput and cheap data capturingtools, this rapid growth in data will continue in the comingyears. Bioinformatics data are voluminous, heterogeneous,incremental, and distributed geographically all over theworld. Consequently, the big data analytics techniques arerequired to solve the problems in bioinformatics.
The problems, data sources and data types in bioin-formatics are diverse in nature. The existing big data ar-chitectures do not provide a comprehensive solution forbig data analytics, which is fast, fault tolerant, large scale,incremental, distributed, and optimized for iterative andcomplex computations. The well known MapReduce archi-tecture for distributed computing executes in a batch modeand has high disk read/write overhead. On the other hand,the graph-based architectures for streaming applications failto provide fault tolerance. An integrated big data analyticsarchitecture that fulfills the requirements of the problems inbioinformatics is an urgent need.
Machine learning has been the most utilized tool fordata analytics. Large scale data existed well before the bigdata era, particularly in bioinformatics. Machine learningtools have been successfully used to analyze both smallscale as well as large scale data using various techniquessuch as, sampling, feature selection, and distributed com-putations. However, big data poses more challenges on thetraditional learning methods in terms of velocity, variety,and incremental data. Traditional learning methods usuallyembed iterative processing and complex data dependencyamong operations. Consequently, the traditional machinelearning methods cannot be used to perform fast process-ing on massive data using big data platforms, such asMapReduce. This paper discusses the traditional machinelearning methods , their limitations, and the efforts madein the recent years to extend them for big data, such as theincremental, parallel, and multi-view clustering methods tohandle complex bioinformatics problems.
The existing tools for many bioinformatics problems arestill not adequate for big data. A few tools have been devel-oped for sequence analysis using the Hadoop MapReduceplatform, such as BioPig [158] and Crossbow [160] in the

JOURNAL OF LATEX CLASS FILES, VOL. 13, NO. 9, SEPTEMBER 2014 16
recent years. Apart from that, other important bioinfor-matics problems, such as PPI network analysis or diseasenetwork analysis, still lacking Hadoop or cloud-based bigdata tools. Considering the big data boom in bioinformaticsand the emerging research opportunities, big data analyticsin bioinformatics need to be properly addressed from theperspectives of big data technologies and effective dataanalytics approaches, such as machine learning.
ACKNOWLEDGMENTS
The authors would like to thank the Ministry of HRD, Govt.of India for funding as a Centre of Excellence with thrustarea in Machine Learning Research and Big Data Analyticsfor the period 2014-2019.
REFERENCES
[1] C. P. Chen and C.-Y. Zhang, “Data-intensive applications, chal-lenges, techniques and technologies: A survey on big data,”Information Sciences, vol. 275, pp. 314–347, 2014.
[2] V. Turner, J. Gantz, D. Reinsel, and S. Minton, “The digitaluniverse of opportunities: Rich data and the increasing value ofthe internet of things,” International Data Corporation, White Paper,IDC 1672, 2014.
[3] N. Gershenfeld, R. Krikorian, and D. Cohen, “The internet ofthings,” Scientific American, vol. 291, no. 4, p. 76, 2004.
[4] M. Page, M. Molina, and J. Gordon, “The mobile econ-omy 2013,” ATKearney.[Online] URL: http://www. atkearney.com/documents/10192/760890/The Mobile Economy 2013. pdf (Ac-cessed on Feb 09, 2015), 2013.
[5] D. E. O’Leary, “Artificial intelligence and big data,” IEEE Intelli-gent Systems, vol. 28, no. 2, pp. 0096–99, 2013.
[6] Z. Zhou, N. Chawla, Y. Jin, and G. Williams, “Big data opportuni-ties and challenges: Discussions from data analytics perspectives[discussion forum],” Computational Intelligence Magazine, IEEE,vol. 9, no. 4, pp. 62–74, 2014.
[7] R. J. Robison, “How big is the human genome?” PrecisionMedicine, January 2014.
[8] EMBL-European Bioinformatics Institute, “EMBL-EBI annual sci-entific report 2013,” 2014.
[9] V. Marx, “Biology: The big challenges of big data,” Nature, vol.498, no. 7453, pp. 255–260, 2013.
[10] S. Y. Rojahn, “Breaking the Genome Bottleneck,” MIT TechnologyReview, May 2012.
[11] A. Nekrutenko and J. Taylor, “Next-generation sequencing datainterpretation: enhancing reproducibility and accessibility,” Na-ture Reviews Genetics, vol. 13, no. 9, pp. 667–672, 2012.
[12] M. Kanehisa and S. Goto, “KEGG: kyoto encyclopedia of genesand genomes,” Nucleic acids research, vol. 28, no. 1, pp. 27–30,2000.
[13] D. Croft, G. OKelly, G. Wu, R. Haw, M. Gillespie, L. Matthews,M. Caudy, P. Garapati, G. Gopinath, B. Jassal et al., “Reactome:a database of reactions, pathways and biological processes,”Nucleic acids research, p. gkq1018, 2010.
[14] E. G. Cerami, B. E. Gross, E. Demir, I. Rodchenkov, O. Babur,N. Anwar, N. Schultz, G. D. Bader, and C. Sander, “Pathwaycommons, a web resource for biological pathway data,” Nucleicacids research, vol. 39, no. suppl 1, pp. D685–D690, 2011.
[15] J. Mosquera and A. Sanchez-Pla, “Serbgo: searching for the bestgo tool,” Nucleic acids research, vol. 36, no. suppl 2, pp. W368–W371, 2008.
[16] V. Pareto, Cours d’economie politique. Librairie Droz, 1964.[17] T. Back, “Evolutionary computation: Toward a new philosophy
of machine intelligence,” 1997.[18] L. Kaufman and P. J. Rousseeuw, “Finding groups in data. an
introduction to cluster analysis,” Wiley Series in Probability andMathematical Statistics. Applied Probability and Statistics, New York:Wiley, 1990, vol. 1, 1990.
[19] T. Zhang, R. Ramakrishnan, and M. Livny, “Birch: an efficientdata clustering method for very large databases,” in ACM SIG-MOD Record, vol. 25, no. 2. ACM, 1996, pp. 103–114.
[20] D. Cai, X. He, and J. Han, “Srda: An efficient algorithm for large-scale discriminant analysis,” Knowledge and Data Engineering,IEEE Transactions on, vol. 20, no. 1, pp. 1–12, 2008.
[21] W. Shi, Y.-F. Guo, C. Jin, and X. Xue, “An improved general-ized discriminant analysis for large-scale data set,” in MachineLearning and Applications, 2008. ICMLA’08. Seventh InternationalConference on. IEEE, 2008, pp. 769–772.
[22] B.-H. Park and H. Kargupta, “Distributed data mining: Algo-rithms, systems, and applications,” 2002.
[23] O. Rana, D. Walker, M. Li, S. Lynden, and M. Ward, “Paddmas:parallel and distributed data mining application suite,” in Paralleland Distributed Processing Symposium, 2000. IPDPS 2000. Proceed-ings. 14th International. IEEE, 2000, pp. 387–392.
[24] T. Kraska, A. Talwalkar, J. C. Duchi, R. Griffith, M. J. Franklin, andM. I. Jordan, “Mlbase: A distributed machine-learning system.”in CIDR, 2013.
[25] Y. Low, D. Bickson, J. Gonzalez, C. Guestrin, A. Kyrola, and J. M.Hellerstein, “Distributed graphlab: a framework for machinelearning and data mining in the cloud,” Proceedings of the VLDBEndowment, vol. 5, no. 8, pp. 716–727, 2012.
[26] J. Dean and S. Ghemawat, “Mapreduce: Simplified data process-ing on large clusters,” in OSDI\’04, 2005, pp. 137–150.
[27] G. Malewicz, M. H. Austern, A. J. Bik, J. C. Dehnert, I. Horn,N. Leiser, and G. Czajkowski, “Pregel: a system for large-scalegraph processing,” in Proceedings of the 2010 ACM SIGMODInternational Conference on Management of data. ACM, 2010, pp.135–146.
[28] K. Shvachko, H. Kuang, S. Radia, and R. Chansler, “The hadoopdistributed file system,” in Mass Storage Systems and Technologies(MSST), 2010 IEEE 26th Symposium on. IEEE, 2010, pp. 1–10.
[29] M. Ovsiannikov, S. Rus, D. Reeves, P. Sutter, S. Rao, and J. Kelly,“The quantcast file system,” Proceedings of the VLDB Endowment,vol. 6, no. 11, pp. 1092–1101, 2013.
[30] S. Owen, R. Anil, T. Dunning, and E. Friedman, Mahout in action.Manning, 2011.
[31] J. Dean and S. Ghemawat, “Mapreduce: simplified data process-ing on large clusters,” Communications of the ACM, vol. 51, no. 1,pp. 107–113, 2008.
[32] J. Ekanayake, H. Li, B. Zhang, T. Gunarathne, S.-H. Bae, J. Qiu,and G. Fox, “Twister: a runtime for iterative mapreduce,” inProceedings of the 19th ACM International Symposium on HighPerformance Distributed Computing. ACM, 2010, pp. 810–818.
[33] M. Zaharia, M. Chowdhury, T. Das, A. Dave, J. Ma, M. McCauley,M. J. Franklin, S. Shenker, and I. Stoica, “Resilient distributeddatasets: A fault-tolerant abstraction for in-memory cluster com-puting,” in Proceedings of the 9th USENIX conference on NetworkedSystems Design and Implementation. USENIX Association, 2012,pp. 2–2.
[34] Y. Low, J. E. Gonzalez, A. Kyrola, D. Bickson, C. E. Guestrin, andJ. Hellerstein, “Graphlab: A new framework for parallel machinelearning,” arXiv preprint arXiv:1408.2041, 2014.
[35] W. Gropp, E. Lusk, N. Doss, and A. Skjellum, “A high-performance, portable implementation of the mpi message pass-ing interface standard,” Parallel computing, vol. 22, no. 6, pp. 789–828, 1996.
[36] C. M. Bishop et al., Pattern recognition and machine learning.springer New York, 2006, vol. 4, no. 4.
[37] D. K. Bhattacharyya and J. K. Kalita, Network anomaly detection: Amachine learning perspective. CRC Press, 2013.
[38] L. Floridi, “Big data and their epistemological challenge,” Philos-ophy & Technology, vol. 25, no. 4, pp. 435–437, 2012.
[39] S. C. Hoi, J. Wang, P. Zhao, and R. Jin, “Online feature selectionfor mining big data,” in Proceedings of the 1st international workshopon big data, streams and heterogeneous source mining: Algorithms,systems, programming models and applications. ACM, 2012, pp.93–100.
[40] M. Lopez and G. Still, “Semi-infinite programming,” EuropeanJournal of Operational Research, vol. 180, no. 2, pp. 491–518, 2007.
[41] M. Tan, I. W. Tsang, and L. Wang, “Towards ultrahigh dimen-sional feature selection for big data,” The Journal of MachineLearning Research, vol. 15, no. 1, pp. 1371–1429, 2014.
[42] M. Bagyamathi and H. H. Inbarani, “A novel hybridized roughset and improved harmony search based feature selection forprotein sequence classification,” in Big Data in Complex Systems.Springer, 2015, pp. 173–204.
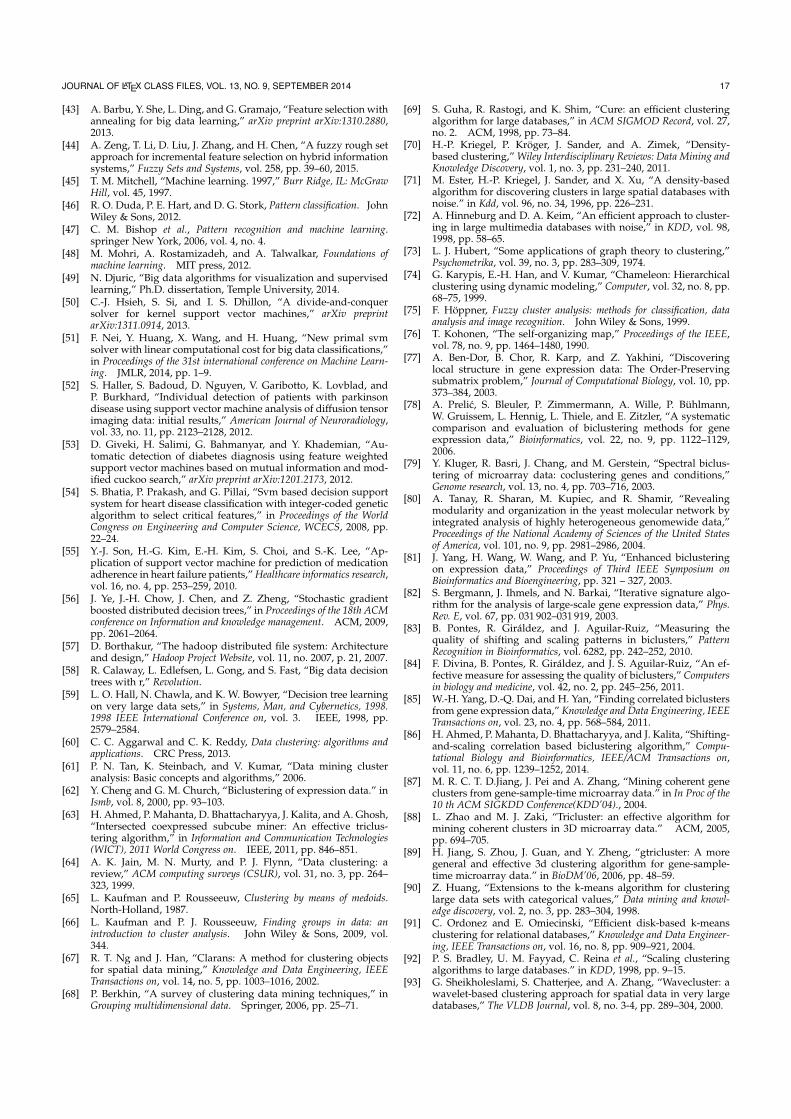
JOURNAL OF LATEX CLASS FILES, VOL. 13, NO. 9, SEPTEMBER 2014 17
[43] A. Barbu, Y. She, L. Ding, and G. Gramajo, “Feature selection withannealing for big data learning,” arXiv preprint arXiv:1310.2880,2013.
[44] A. Zeng, T. Li, D. Liu, J. Zhang, and H. Chen, “A fuzzy rough setapproach for incremental feature selection on hybrid informationsystems,” Fuzzy Sets and Systems, vol. 258, pp. 39–60, 2015.
[45] T. M. Mitchell, “Machine learning. 1997,” Burr Ridge, IL: McGrawHill, vol. 45, 1997.
[46] R. O. Duda, P. E. Hart, and D. G. Stork, Pattern classification. JohnWiley & Sons, 2012.
[47] C. M. Bishop et al., Pattern recognition and machine learning.springer New York, 2006, vol. 4, no. 4.
[48] M. Mohri, A. Rostamizadeh, and A. Talwalkar, Foundations ofmachine learning. MIT press, 2012.
[49] N. Djuric, “Big data algorithms for visualization and supervisedlearning,” Ph.D. dissertation, Temple University, 2014.
[50] C.-J. Hsieh, S. Si, and I. S. Dhillon, “A divide-and-conquersolver for kernel support vector machines,” arXiv preprintarXiv:1311.0914, 2013.
[51] F. Nei, Y. Huang, X. Wang, and H. Huang, “New primal svmsolver with linear computational cost for big data classifications,”in Proceedings of the 31st international conference on Machine Learn-ing. JMLR, 2014, pp. 1–9.
[52] S. Haller, S. Badoud, D. Nguyen, V. Garibotto, K. Lovblad, andP. Burkhard, “Individual detection of patients with parkinsondisease using support vector machine analysis of diffusion tensorimaging data: initial results,” American Journal of Neuroradiology,vol. 33, no. 11, pp. 2123–2128, 2012.
[53] D. Giveki, H. Salimi, G. Bahmanyar, and Y. Khademian, “Au-tomatic detection of diabetes diagnosis using feature weightedsupport vector machines based on mutual information and mod-ified cuckoo search,” arXiv preprint arXiv:1201.2173, 2012.
[54] S. Bhatia, P. Prakash, and G. Pillai, “Svm based decision supportsystem for heart disease classification with integer-coded geneticalgorithm to select critical features,” in Proceedings of the WorldCongress on Engineering and Computer Science, WCECS, 2008, pp.22–24.
[55] Y.-J. Son, H.-G. Kim, E.-H. Kim, S. Choi, and S.-K. Lee, “Ap-plication of support vector machine for prediction of medicationadherence in heart failure patients,” Healthcare informatics research,vol. 16, no. 4, pp. 253–259, 2010.
[56] J. Ye, J.-H. Chow, J. Chen, and Z. Zheng, “Stochastic gradientboosted distributed decision trees,” in Proceedings of the 18th ACMconference on Information and knowledge management. ACM, 2009,pp. 2061–2064.
[57] D. Borthakur, “The hadoop distributed file system: Architectureand design,” Hadoop Project Website, vol. 11, no. 2007, p. 21, 2007.
[58] R. Calaway, L. Edlefsen, L. Gong, and S. Fast, “Big data decisiontrees with r,” Revolution.
[59] L. O. Hall, N. Chawla, and K. W. Bowyer, “Decision tree learningon very large data sets,” in Systems, Man, and Cybernetics, 1998.1998 IEEE International Conference on, vol. 3. IEEE, 1998, pp.2579–2584.
[60] C. C. Aggarwal and C. K. Reddy, Data clustering: algorithms andapplications. CRC Press, 2013.
[61] P. N. Tan, K. Steinbach, and V. Kumar, “Data mining clusteranalysis: Basic concepts and algorithms,” 2006.
[62] Y. Cheng and G. M. Church, “Biclustering of expression data.” inIsmb, vol. 8, 2000, pp. 93–103.
[63] H. Ahmed, P. Mahanta, D. Bhattacharyya, J. Kalita, and A. Ghosh,“Intersected coexpressed subcube miner: An effective triclus-tering algorithm,” in Information and Communication Technologies(WICT), 2011 World Congress on. IEEE, 2011, pp. 846–851.
[64] A. K. Jain, M. N. Murty, and P. J. Flynn, “Data clustering: areview,” ACM computing surveys (CSUR), vol. 31, no. 3, pp. 264–323, 1999.
[65] L. Kaufman and P. Rousseeuw, Clustering by means of medoids.North-Holland, 1987.
[66] L. Kaufman and P. J. Rousseeuw, Finding groups in data: anintroduction to cluster analysis. John Wiley & Sons, 2009, vol.344.
[67] R. T. Ng and J. Han, “Clarans: A method for clustering objectsfor spatial data mining,” Knowledge and Data Engineering, IEEETransactions on, vol. 14, no. 5, pp. 1003–1016, 2002.
[68] P. Berkhin, “A survey of clustering data mining techniques,” inGrouping multidimensional data. Springer, 2006, pp. 25–71.
[69] S. Guha, R. Rastogi, and K. Shim, “Cure: an efficient clusteringalgorithm for large databases,” in ACM SIGMOD Record, vol. 27,no. 2. ACM, 1998, pp. 73–84.
[70] H.-P. Kriegel, P. Kroger, J. Sander, and A. Zimek, “Density-based clustering,” Wiley Interdisciplinary Reviews: Data Mining andKnowledge Discovery, vol. 1, no. 3, pp. 231–240, 2011.
[71] M. Ester, H.-P. Kriegel, J. Sander, and X. Xu, “A density-basedalgorithm for discovering clusters in large spatial databases withnoise.” in Kdd, vol. 96, no. 34, 1996, pp. 226–231.
[72] A. Hinneburg and D. A. Keim, “An efficient approach to cluster-ing in large multimedia databases with noise,” in KDD, vol. 98,1998, pp. 58–65.
[73] L. J. Hubert, “Some applications of graph theory to clustering,”Psychometrika, vol. 39, no. 3, pp. 283–309, 1974.
[74] G. Karypis, E.-H. Han, and V. Kumar, “Chameleon: Hierarchicalclustering using dynamic modeling,” Computer, vol. 32, no. 8, pp.68–75, 1999.
[75] F. Hoppner, Fuzzy cluster analysis: methods for classification, dataanalysis and image recognition. John Wiley & Sons, 1999.
[76] T. Kohonen, “The self-organizing map,” Proceedings of the IEEE,vol. 78, no. 9, pp. 1464–1480, 1990.
[77] A. Ben-Dor, B. Chor, R. Karp, and Z. Yakhini, “Discoveringlocal structure in gene expression data: The Order-Preservingsubmatrix problem,” Journal of Computational Biology, vol. 10, pp.373–384, 2003.
[78] A. Prelic, S. Bleuler, P. Zimmermann, A. Wille, P. Buhlmann,W. Gruissem, L. Hennig, L. Thiele, and E. Zitzler, “A systematiccomparison and evaluation of biclustering methods for geneexpression data,” Bioinformatics, vol. 22, no. 9, pp. 1122–1129,2006.
[79] Y. Kluger, R. Basri, J. Chang, and M. Gerstein, “Spectral biclus-tering of microarray data: coclustering genes and conditions,”Genome research, vol. 13, no. 4, pp. 703–716, 2003.
[80] A. Tanay, R. Sharan, M. Kupiec, and R. Shamir, “Revealingmodularity and organization in the yeast molecular network byintegrated analysis of highly heterogeneous genomewide data,”Proceedings of the National Academy of Sciences of the United Statesof America, vol. 101, no. 9, pp. 2981–2986, 2004.
[81] J. Yang, H. Wang, W. Wang, and P. Yu, “Enhanced biclusteringon expression data,” Proceedings of Third IEEE Symposium onBioinformatics and Bioengineering, pp. 321 – 327, 2003.
[82] S. Bergmann, J. Ihmels, and N. Barkai, “Iterative signature algo-rithm for the analysis of large-scale gene expression data,” Phys.Rev. E, vol. 67, pp. 031 902–031 919, 2003.
[83] B. Pontes, R. Giraldez, and J. Aguilar-Ruiz, “Measuring thequality of shifting and scaling patterns in biclusters,” PatternRecognition in Bioinformatics, vol. 6282, pp. 242–252, 2010.
[84] F. Divina, B. Pontes, R. Giraldez, and J. S. Aguilar-Ruiz, “An ef-fective measure for assessing the quality of biclusters,” Computersin biology and medicine, vol. 42, no. 2, pp. 245–256, 2011.
[85] W.-H. Yang, D.-Q. Dai, and H. Yan, “Finding correlated biclustersfrom gene expression data,” Knowledge and Data Engineering, IEEETransactions on, vol. 23, no. 4, pp. 568–584, 2011.
[86] H. Ahmed, P. Mahanta, D. Bhattacharyya, and J. Kalita, “Shifting-and-scaling correlation based biclustering algorithm,” Compu-tational Biology and Bioinformatics, IEEE/ACM Transactions on,vol. 11, no. 6, pp. 1239–1252, 2014.
[87] M. R. C. T. D.Jiang, J. Pei and A. Zhang, “Mining coherent geneclusters from gene-sample-time microarray data.” in In Proc of the10 th ACM SIGKDD Conference(KDD’04)., 2004.
[88] L. Zhao and M. J. Zaki, “Tricluster: an effective algorithm formining coherent clusters in 3D microarray data.” ACM, 2005,pp. 694–705.
[89] H. Jiang, S. Zhou, J. Guan, and Y. Zheng, “gtricluster: A moregeneral and effective 3d clustering algorithm for gene-sample-time microarray data.” in BioDM’06, 2006, pp. 48–59.
[90] Z. Huang, “Extensions to the k-means algorithm for clusteringlarge data sets with categorical values,” Data mining and knowl-edge discovery, vol. 2, no. 3, pp. 283–304, 1998.
[91] C. Ordonez and E. Omiecinski, “Efficient disk-based k-meansclustering for relational databases,” Knowledge and Data Engineer-ing, IEEE Transactions on, vol. 16, no. 8, pp. 909–921, 2004.
[92] P. S. Bradley, U. M. Fayyad, C. Reina et al., “Scaling clusteringalgorithms to large databases.” in KDD, 1998, pp. 9–15.
[93] G. Sheikholeslami, S. Chatterjee, and A. Zhang, “Wavecluster: awavelet-based clustering approach for spatial data in very largedatabases,” The VLDB Journal, vol. 8, no. 3-4, pp. 289–304, 2000.
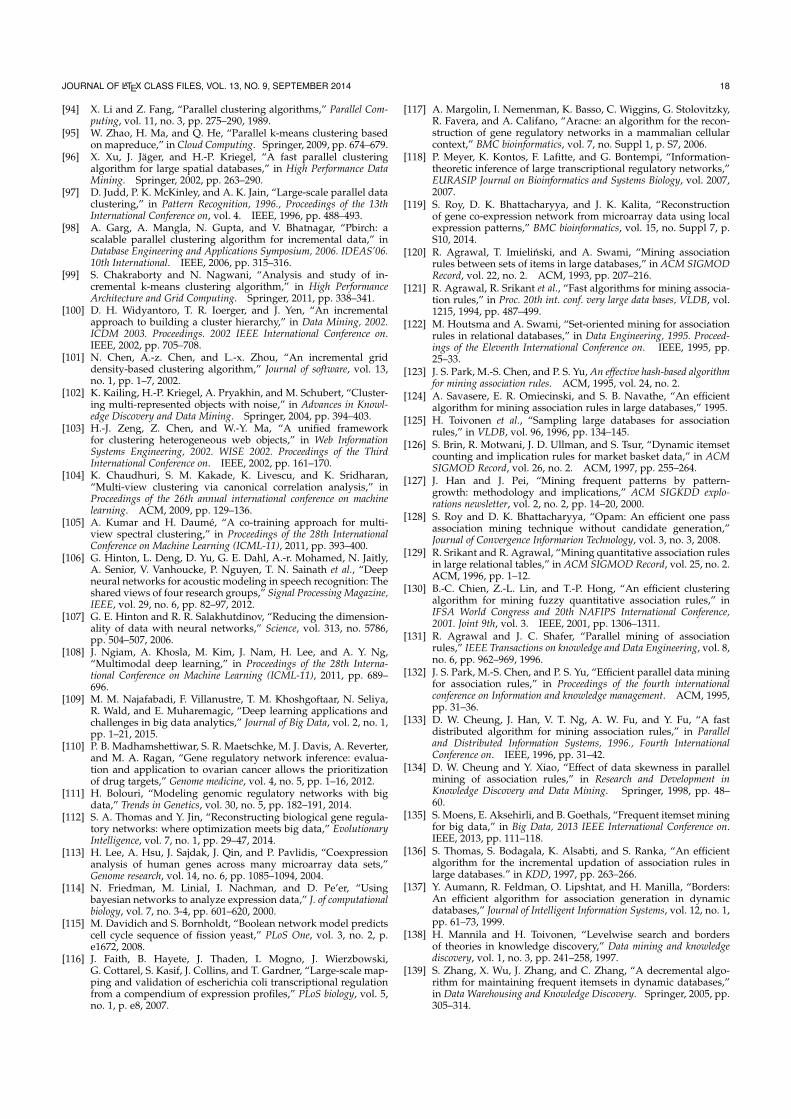
JOURNAL OF LATEX CLASS FILES, VOL. 13, NO. 9, SEPTEMBER 2014 18
[94] X. Li and Z. Fang, “Parallel clustering algorithms,” Parallel Com-puting, vol. 11, no. 3, pp. 275–290, 1989.
[95] W. Zhao, H. Ma, and Q. He, “Parallel k-means clustering basedon mapreduce,” in Cloud Computing. Springer, 2009, pp. 674–679.
[96] X. Xu, J. Jager, and H.-P. Kriegel, “A fast parallel clusteringalgorithm for large spatial databases,” in High Performance DataMining. Springer, 2002, pp. 263–290.
[97] D. Judd, P. K. McKinley, and A. K. Jain, “Large-scale parallel dataclustering,” in Pattern Recognition, 1996., Proceedings of the 13thInternational Conference on, vol. 4. IEEE, 1996, pp. 488–493.
[98] A. Garg, A. Mangla, N. Gupta, and V. Bhatnagar, “Pbirch: ascalable parallel clustering algorithm for incremental data,” inDatabase Engineering and Applications Symposium, 2006. IDEAS’06.10th International. IEEE, 2006, pp. 315–316.
[99] S. Chakraborty and N. Nagwani, “Analysis and study of in-cremental k-means clustering algorithm,” in High PerformanceArchitecture and Grid Computing. Springer, 2011, pp. 338–341.
[100] D. H. Widyantoro, T. R. Ioerger, and J. Yen, “An incrementalapproach to building a cluster hierarchy,” in Data Mining, 2002.ICDM 2003. Proceedings. 2002 IEEE International Conference on.IEEE, 2002, pp. 705–708.
[101] N. Chen, A.-z. Chen, and L.-x. Zhou, “An incremental griddensity-based clustering algorithm,” Journal of software, vol. 13,no. 1, pp. 1–7, 2002.
[102] K. Kailing, H.-P. Kriegel, A. Pryakhin, and M. Schubert, “Cluster-ing multi-represented objects with noise,” in Advances in Knowl-edge Discovery and Data Mining. Springer, 2004, pp. 394–403.
[103] H.-J. Zeng, Z. Chen, and W.-Y. Ma, “A unified frameworkfor clustering heterogeneous web objects,” in Web InformationSystems Engineering, 2002. WISE 2002. Proceedings of the ThirdInternational Conference on. IEEE, 2002, pp. 161–170.
[104] K. Chaudhuri, S. M. Kakade, K. Livescu, and K. Sridharan,“Multi-view clustering via canonical correlation analysis,” inProceedings of the 26th annual international conference on machinelearning. ACM, 2009, pp. 129–136.
[105] A. Kumar and H. Daume, “A co-training approach for multi-view spectral clustering,” in Proceedings of the 28th InternationalConference on Machine Learning (ICML-11), 2011, pp. 393–400.
[106] G. Hinton, L. Deng, D. Yu, G. E. Dahl, A.-r. Mohamed, N. Jaitly,A. Senior, V. Vanhoucke, P. Nguyen, T. N. Sainath et al., “Deepneural networks for acoustic modeling in speech recognition: Theshared views of four research groups,” Signal Processing Magazine,IEEE, vol. 29, no. 6, pp. 82–97, 2012.
[107] G. E. Hinton and R. R. Salakhutdinov, “Reducing the dimension-ality of data with neural networks,” Science, vol. 313, no. 5786,pp. 504–507, 2006.
[108] J. Ngiam, A. Khosla, M. Kim, J. Nam, H. Lee, and A. Y. Ng,“Multimodal deep learning,” in Proceedings of the 28th Interna-tional Conference on Machine Learning (ICML-11), 2011, pp. 689–696.
[109] M. M. Najafabadi, F. Villanustre, T. M. Khoshgoftaar, N. Seliya,R. Wald, and E. Muharemagic, “Deep learning applications andchallenges in big data analytics,” Journal of Big Data, vol. 2, no. 1,pp. 1–21, 2015.
[110] P. B. Madhamshettiwar, S. R. Maetschke, M. J. Davis, A. Reverter,and M. A. Ragan, “Gene regulatory network inference: evalua-tion and application to ovarian cancer allows the prioritizationof drug targets,” Genome medicine, vol. 4, no. 5, pp. 1–16, 2012.
[111] H. Bolouri, “Modeling genomic regulatory networks with bigdata,” Trends in Genetics, vol. 30, no. 5, pp. 182–191, 2014.
[112] S. A. Thomas and Y. Jin, “Reconstructing biological gene regula-tory networks: where optimization meets big data,” EvolutionaryIntelligence, vol. 7, no. 1, pp. 29–47, 2014.
[113] H. Lee, A. Hsu, J. Sajdak, J. Qin, and P. Pavlidis, “Coexpressionanalysis of human genes across many microarray data sets,”Genome research, vol. 14, no. 6, pp. 1085–1094, 2004.
[114] N. Friedman, M. Linial, I. Nachman, and D. Pe’er, “Usingbayesian networks to analyze expression data,” J. of computationalbiology, vol. 7, no. 3-4, pp. 601–620, 2000.
[115] M. Davidich and S. Bornholdt, “Boolean network model predictscell cycle sequence of fission yeast,” PLoS One, vol. 3, no. 2, p.e1672, 2008.
[116] J. Faith, B. Hayete, J. Thaden, I. Mogno, J. Wierzbowski,G. Cottarel, S. Kasif, J. Collins, and T. Gardner, “Large-scale map-ping and validation of escherichia coli transcriptional regulationfrom a compendium of expression profiles,” PLoS biology, vol. 5,no. 1, p. e8, 2007.
[117] A. Margolin, I. Nemenman, K. Basso, C. Wiggins, G. Stolovitzky,R. Favera, and A. Califano, “Aracne: an algorithm for the recon-struction of gene regulatory networks in a mammalian cellularcontext,” BMC bioinformatics, vol. 7, no. Suppl 1, p. S7, 2006.
[118] P. Meyer, K. Kontos, F. Lafitte, and G. Bontempi, “Information-theoretic inference of large transcriptional regulatory networks,”EURASIP Journal on Bioinformatics and Systems Biology, vol. 2007,2007.
[119] S. Roy, D. K. Bhattacharyya, and J. K. Kalita, “Reconstructionof gene co-expression network from microarray data using localexpression patterns,” BMC bioinformatics, vol. 15, no. Suppl 7, p.S10, 2014.
[120] R. Agrawal, T. Imielinski, and A. Swami, “Mining associationrules between sets of items in large databases,” in ACM SIGMODRecord, vol. 22, no. 2. ACM, 1993, pp. 207–216.
[121] R. Agrawal, R. Srikant et al., “Fast algorithms for mining associa-tion rules,” in Proc. 20th int. conf. very large data bases, VLDB, vol.1215, 1994, pp. 487–499.
[122] M. Houtsma and A. Swami, “Set-oriented mining for associationrules in relational databases,” in Data Engineering, 1995. Proceed-ings of the Eleventh International Conference on. IEEE, 1995, pp.25–33.
[123] J. S. Park, M.-S. Chen, and P. S. Yu, An effective hash-based algorithmfor mining association rules. ACM, 1995, vol. 24, no. 2.
[124] A. Savasere, E. R. Omiecinski, and S. B. Navathe, “An efficientalgorithm for mining association rules in large databases,” 1995.
[125] H. Toivonen et al., “Sampling large databases for associationrules,” in VLDB, vol. 96, 1996, pp. 134–145.
[126] S. Brin, R. Motwani, J. D. Ullman, and S. Tsur, “Dynamic itemsetcounting and implication rules for market basket data,” in ACMSIGMOD Record, vol. 26, no. 2. ACM, 1997, pp. 255–264.
[127] J. Han and J. Pei, “Mining frequent patterns by pattern-growth: methodology and implications,” ACM SIGKDD explo-rations newsletter, vol. 2, no. 2, pp. 14–20, 2000.
[128] S. Roy and D. K. Bhattacharyya, “Opam: An efficient one passassociation mining technique without candidate generation,”Journal of Convergence Informarion Technology, vol. 3, no. 3, 2008.
[129] R. Srikant and R. Agrawal, “Mining quantitative association rulesin large relational tables,” in ACM SIGMOD Record, vol. 25, no. 2.ACM, 1996, pp. 1–12.
[130] B.-C. Chien, Z.-L. Lin, and T.-P. Hong, “An efficient clusteringalgorithm for mining fuzzy quantitative association rules,” inIFSA World Congress and 20th NAFIPS International Conference,2001. Joint 9th, vol. 3. IEEE, 2001, pp. 1306–1311.
[131] R. Agrawal and J. C. Shafer, “Parallel mining of associationrules,” IEEE Transactions on knowledge and Data Engineering, vol. 8,no. 6, pp. 962–969, 1996.
[132] J. S. Park, M.-S. Chen, and P. S. Yu, “Efficient parallel data miningfor association rules,” in Proceedings of the fourth internationalconference on Information and knowledge management. ACM, 1995,pp. 31–36.
[133] D. W. Cheung, J. Han, V. T. Ng, A. W. Fu, and Y. Fu, “A fastdistributed algorithm for mining association rules,” in Paralleland Distributed Information Systems, 1996., Fourth InternationalConference on. IEEE, 1996, pp. 31–42.
[134] D. W. Cheung and Y. Xiao, “Effect of data skewness in parallelmining of association rules,” in Research and Development inKnowledge Discovery and Data Mining. Springer, 1998, pp. 48–60.
[135] S. Moens, E. Aksehirli, and B. Goethals, “Frequent itemset miningfor big data,” in Big Data, 2013 IEEE International Conference on.IEEE, 2013, pp. 111–118.
[136] S. Thomas, S. Bodagala, K. Alsabti, and S. Ranka, “An efficientalgorithm for the incremental updation of association rules inlarge databases.” in KDD, 1997, pp. 263–266.
[137] Y. Aumann, R. Feldman, O. Lipshtat, and H. Manilla, “Borders:An efficient algorithm for association generation in dynamicdatabases,” Journal of Intelligent Information Systems, vol. 12, no. 1,pp. 61–73, 1999.
[138] H. Mannila and H. Toivonen, “Levelwise search and bordersof theories in knowledge discovery,” Data mining and knowledgediscovery, vol. 1, no. 3, pp. 241–258, 1997.
[139] S. Zhang, X. Wu, J. Zhang, and C. Zhang, “A decremental algo-rithm for maintaining frequent itemsets in dynamic databases,”in Data Warehousing and Knowledge Discovery. Springer, 2005, pp.305–314.

JOURNAL OF LATEX CLASS FILES, VOL. 13, NO. 9, SEPTEMBER 2014 19
[140] Cisco, “Cisco visual networking index: global mobile data trafficforecast update, 2014–2019,” Cisco Public Information, 2015.
[141] A. Choudhury, P. B. Nair, A. J. Keane et al., “A data parallelapproach for large-scale gaussian process modeling.” in SDM.SIAM, 2002, pp. 95–111.
[142] A. E. Raftery, T. Gneiting, F. Balabdaoui, and M. Polakowski, “Us-ing bayesian model averaging to calibrate forecast ensembles,”Monthly Weather Review, vol. 133, no. 5, pp. 1155–1174, 2005.
[143] R. Wright and Z. Yang, “Privacy-preserving bayesian networkstructure computation on distributed heterogeneous data,” inProceedings of the tenth ACM SIGKDD international conference onKnowledge discovery and data mining. ACM, 2004, pp. 713–718.
[144] J. Goecks, A. Nekrutenko, J. Taylor et al., “Galaxy: a compre-hensive approach for supporting accessible, reproducible, andtransparent computational research in the life sciences,” GenomeBiol, vol. 11, no. 8, p. R86, 2010.
[145] A. Matsunaga, M. Tsugawa, and J. Fortes, “Cloudblast: Combin-ing mapreduce and virtualization on distributed resources forbioinformatics applications,” in eScience, 2008. eScience’08. IEEEFourth International Conference on. IEEE, 2008, pp. 222–229.
[146] T. H. Stokes, R. A. Moffitt, J. H. Phan, and M. D. Wang, “chipartifact CORRECTion (caCORRECT): a bioinformatics systemfor quality assurance of genomics and proteomics array data,”Annals of biomedical engineering, vol. 35, no. 6, pp. 1068–1080, 2007.
[147] J. H. Phan, A. N. Young, and M. D. Wang, “omniBiomarker:a web-based application for knowledge-driven biomarker iden-tification,” Biomedical Engineering, IEEE Transactions on, vol. 60,no. 12, pp. 3364–3367, 2013.
[148] M. Liang, F. Zhang, G. Jin, and J. Zhu, “FastGCN: A GPUAccelerated Tool for Fast Gene Co-Expression Networks.” PloSone, vol. 10, no. 1, pp. e0 116 776–e0 116 776, 2014.
[149] A. S. Arefin, R. Berretta, and P. Moscato, “A GPU-based methodfor computing eigenvector centrality of gene-expression net-works,” in Proceedings of the Eleventh Australasian Symposiumon Parallel and Distributed Computing-Volume 140. AustralianComputer Society, Inc., 2013, pp. 3–11.
[150] D. G. McArt, P. Bankhead, P. D. Dunne, M. Salto-Tellez, P. Hamil-ton, and S.-D. Zhang, “cudaMap: a GPU accelerated programfor gene expression connectivity mapping,” BMC bioinformatics,vol. 14, no. 1, p. 305, 2013.
[151] A. Day, J. Dong, V. A. Funari, B. Harry, S. P. Strom, D. H. Cohn,and S. F. Nelson, “Disease gene characterization through large-scale co-expression analysis,” PLoS One, vol. 4, no. 12, p. e8491,2009.
[152] A. Day, M. R. Carlson, J. Dong, B. D. O’Connor, and S. F. Nelson,“Celsius: a community resource for Affymetrix microarray data,”Genome Biol, vol. 8, no. 6, p. R112, 2007.
[153] P. Langfelder and S. Horvath, “WGCNA: an R package forweighted correlation network analysis,” BMC bioinformatics,vol. 9, no. 1, p. 559, 2008.
[154] C. G. Rivera, R. Vakil, and J. S. Bader, “NeMo: network moduleidentification in Cytoscape,” BMC bioinformatics, vol. 11, no.Suppl 1, p. S61, 2010.
[155] G. D. Bader and C. W. Hogue, “An automated method for findingmolecular complexes in large protein interaction networks,” BMCbioinformatics, vol. 4, no. 1, p. 2, 2003.
[156] T. Nepusz, H. Yu, and A. Paccanaro, “Detecting overlapping pro-tein complexes in protein-protein interaction networks,” Naturemethods, vol. 9, no. 5, pp. 471–472, 2012.
[157] B. P. Kelley, B. Yuan, F. Lewitter, R. Sharan, B. R. Stockwell, andT. Ideker, “PathBLAST: a tool for alignment of protein interactionnetworks,” Nucleic acids research, vol. 32, no. suppl 2, pp. W83–W88, 2004.
[158] H. Nordberg, K. Bhatia, K. Wang, and Z. Wang, “BioPig: aHadoop-based analytic toolkit for large-scale sequence data,”Bioinformatics, vol. 29, no. 23, pp. 3014–3019, 2013.
[159] A. Schumacher, L. Pireddu, M. Niemenmaa, A. Kallio, E. Ko-rpelainen, G. Zanetti, and K. Heljanko, “SeqPig: simple andscalable scripting for large sequencing data sets in Hadoop,”Bioinformatics, vol. 30, no. 1, pp. 119–120, 2014.
[160] B. Langmead, M. C. Schatz, J. Lin, M. Pop, and S. L. Salzberg,“Searching for SNPs with cloud computing,” Genome Biol, vol. 10,no. 11, p. R134, 2009.
[161] B. Langmead, C. Trapnell, M. Pop, S. L. Salzberg et al., “Ultrafastand memory-efficient alignment of short DNA sequences to thehuman genome,” Genome Biol, vol. 10, no. 3, p. R25, 2009.
[162] R. Li, Y. Li, X. Fang, H. Yang, J. Wang, K. Kristiansen, andJ. Wang, “SNP detection for massively parallel whole-genomeresequencing,” Genome research, vol. 19, no. 6, pp. 1124–1132,2009.
[163] S. Zhao, K. Prenger, and L. Smith, “Stormbow: a cloud-basedtool for reads mapping and expression quantification in large-scale RNA-Seq studies,” International Scholarly Research Notices,vol. 2013, 2013.
[164] S. V. Angiuoli, M. Matalka, A. Gussman, K. Galens, M. Vangala,D. R. Riley, C. Arze, J. R. White, O. White, and W. F. Fricke,“CloVR: a virtual machine for automated and portable sequenceanalysis from the desktop using cloud computing,” BMC bioin-formatics, vol. 12, no. 1, p. 356, 2011.
[165] S. Zhao, K. Prenger, L. Smith, T. Messina, H. Fan, E. Jaeger,and S. Stephens, “Rainbow: a tool for large-scale whole-genomesequencing data analysis using cloud computing,” BMC genomics,vol. 14, no. 1, p. 425, 2013.
[166] S. Kurtz, “The vmatch large scale sequence analysis software,”Ref Type: Computer Program, pp. 4–12, 2003.
[167] A. C. Zambon, S. Gaj, I. Ho, K. Hanspers, K. Vranizan, C. T.Evelo, B. R. Conklin, A. R. Pico, and N. Salomonis, “GO-Elite: aflexible solution for pathway and ontology over-representation,”Bioinformatics, vol. 28, no. 16, pp. 2209–2210, 2012.
[168] M. P. van Iersel, T. Kelder, A. R. Pico, K. Hanspers, S. Coort,B. R. Conklin, and C. Evelo, “Presenting and exploring biologicalpathways with PathVisio,” BMC bioinformatics, vol. 9, no. 1, p.399, 2008.
[169] P. Yang, E. Patrick, S.-X. Tan, D. J. Fazakerley, J. Burchfield,C. Gribben, M. J. Prior, D. E. James, and Y. H. Yang, “Directionpathway analysis of large-scale proteomics data reveals novelfeatures of the insulin action pathway,” Bioinformatics, vol. 30,no. 6, pp. 808–814, 2014.
[170] P. Grosu, J. P. Townsend, D. L. Hartl, and D. Cavalieri, “PathwayProcessor: a tool for integrating whole-genome expression resultsinto metabolic networks,” Genome research, vol. 12, no. 7, pp.1121–1126, 2002.
[171] Y. S. Park, M. Schmidt, E. R. Martin, M. A. Pericak-Vance, andR.-H. Chung, “Pathway-PDT: a flexible pathway analysis tool fornuclear families,” BMC bioinformatics, vol. 14, no. 1, p. 267, 2013.
[172] W. Luo and C. Brouwer, “Pathview: an R/Bioconductor packagefor pathway-based data integration and visualization,” Bioinfor-matics, vol. 29, no. 14, pp. 1830–1831, 2013.
[173] S. Kumar, M. Nei, J. Dudley, and K. Tamura, “MEGA: a biologist-centric software for evolutionary analysis of DNA and proteinsequences,” Briefings in bioinformatics, vol. 9, no. 4, pp. 299–306,2008.
[174] M. S. Barker, K. M. Dlugosch, L. Dinh, R. S. Challa, N. C. Kane,M. G. King, and L. H. Rieseberg, “EvoPipes. net: bioinformatictools for ecological and evolutionary genomics,” Evolutionarybioinformatics online, vol. 6, p. 143, 2010.
Hirak Kashyap obtained Master of Technologydegree in Computer Science and Engineeringfrom National Institute of Technology, Rourkela,India. Currently, he is a Senior Research Fellowin the Department of Computer Science andEngineering at Tezpur University. He conductsresearch in reconfigurable and embedded sys-tems, architecture, and network security.

JOURNAL OF LATEX CLASS FILES, VOL. 13, NO. 9, SEPTEMBER 2014 20
Hasin A Ahmed obtained Master of ComputerApplications degree from Tezpur University, In-dia in the year 2009. Currently, he is a PhD can-didate in the Department of Computer Scienceand Engineering at Tezpur University. He con-ducts research in bioinformatics and data miningand has published his works in reputed journals.
Nazrul Hoque obtained Master of Technologydegree in Information Technology from TezpurUniversity, India in the year 2012. Currently, he isa PhD candidate in the Department of ComputerScience and Engineering at Tezpur University.His research interests are machine learning andnetwork security.
Swarup Roy obtained PhD degree in ComputerScience and Engineering from Tezpur Univer-sity, India in the year 2013. Currently, he is anAssistant Professor in Information Technology atNorth-Eastern Hill University, Shillong, India. Hisresearch interests are data mining and compu-tational biology.
Dhruba Kr Bhattacharyya received his Ph.D.in Computer Science from Tezpur University in1999. He is a Professor in the Computer Science& Engineering Department at Tezpur University.His research areas include data mining, bioin-formatics, network security, and big data ana-lytics. Prof. Bhattacharyya has published 220+research papers in the leading international jour-nals and conference proceedings. In addition, DrBhattacharyya has written/edited 8 books. He isa Programme Committee/Advisory Body mem-
ber of several international conferences/workshops.