big chicken: pollution and industrial poultry production...
TRANSCRIPT
Pollution and IndustrialPoultry Production in America

Cover photos, from left: David Harp, Robert Bennett/AGStock Images, David Harp
Chesapeake Bay Bridge: Michael Lutzky/The Washington Post/Getty Images

www.PewEnvironment.org
Chicken, once a distant third to beef and pork, is now the most popular meat in the United States. The average American eats almost 84 pounds of chicken a year, more than twice the amount eaten in 1970.
The American poultry industry has matched this change in appetite with an exponential increase in production. In 2007, for instance, 8.9 billion chickens were raised and sold as food in the United States, a jump of more than 1,400 percent since 1950. At the same time, chicken farms have mushroomed in size; by 2006, a typical operation produced an average of 605,000 birds in vast buildings of 20,000 square feet or more. Meanwhile, the number of individual farms raising chickens for food has plummeted by 98 percent in just over half a century. This transformation of the industry has been accompanied by an environmental challenge: In many cases, these large poultry farms pose major pollution problems for regional communities.
The Pew Environment Group’s new report, “Big Chicken: Pollution and Industrial Poultry Production in America,” describes how the industrialization and consolidation of the poultry business have concentrated production in what is now known as the Broiler Belt. In this area, which extends from eastern Texas through the
Joshua S. Reichert
Managing Director Pew Environment Group
July 27, 2011
southeastern United States and north to Maryland and Delaware, chickens outnumber people by as much as 400 to 1.
The waste produced by these concentrated poultry operations raises serious concerns about treatment and disposal, particularly along the shores of the largest estuary system in the United States, the Chesapeake Bay. The 523 million chickens produced each year in just Maryland and Delaware generate roughly 42 million cubic feet of chicken waste—enough to fill the dome of the U.S. Capitol about 50 times, or almost once a week.
Traditionally, farmers have managed this manure by spreading it on fields. But the combination of industrial-level production and the diminishing amount of cropland in these two states has resulted in more manure than crops can use, and the excess flows untreated into the streams and rivers that feed into the Chesapeake.
“Big Chicken” examines 50 years of data to take a fresh look at industrial poultry production and to make policy recommendations for managing chicken waste to mitigate its toll on our land and water. For more information about this serious problem, I encourage you to visit us at www.PewEnvironment.org/BigChicken.

Source Information
Broiler numbers and acreage were taken from the U.S. Department of Agriculture’s Census of Agriculture, a five-year survey of American farms.Data were gathered from the most recent Census of Agriculture (2007) and from 2002, 1997, 1992, 1987, 1982 and 1978, for each state and for each Maryland and Delaware county. For a historical perspective, Pew also gathered data at the state level from the 1950 Census of Agriculture. For each state and county, data were gathered from each of the censuses under the following categories: Broilers and Other Meat-Type Chickens Sold; Broiler Operations With Sales; and Total Cropland, which includes cropland harvested, cropland used only for pasture or grazing, cropland idle or used for cover crops or soil improvement but not
harvested and not pastured or grazed, cropland on which all crops failed or were abandoned, and cropland in cultivated summer fallow.
In some instances, USDA does not disclose the number of operations with sales at the state and/or county level so as not to identify individual farms within an area. This absence of data does not signify that the state or county is not a potential home to broilers or broiler operations. States or counties in which these data were not disclosed are not represented on the relevant maps, however.
State population data cited in the report are taken from the U.S. Census Bureau’s 2010 Census.
© The Pew Environment Group | Washington, D.C. | www.PewEnvironment.orgJuly 2011
The Pew Campaign to Reform Industrial Animal Agriculture
Joshua S. Reichert, Managing Director, Pew Environment Group
Karen Steuer, Director, Government Relations, Pew Environment GroupVelma Smith, Officer, Government Relations, Pew Environment GroupRobert Martin, Senior Officer, Reforming Industrial Animal AgricultureJulie Janovsky, Manager, Reforming Industrial Animal AgricultureMicaela Fischer, Senior Associate, Reforming Industrial Animal Agriculture
Acknowledgments
We would like to thank our many Pew Environment Group colleagues who contributed to this report: Adam Enatsky, Carol Hutchinson, Elizabeth Jennings, Alicia LaPorte, Jonathan Meyers, Jessica O’Neal, Mallory Shelter, Amanda Teuscher, Jerry Tyson and Liz Visser. We also thank Juan Thomassie for graphics and Albert Berces for report design. We owe special thanks to our colleague Pete Janhunen and to Jamie Shor for their assistance with communications.
The Pew Environment Group
The Pew Environment Group is the conservation arm of The Pew Charitable Trusts, a nongovernmental organization that works globally to establish pragmatic, science-based policies that protect our oceans, preserve our wildlands and promote clean energy.

CONTENTS
0103040506080915222428
Overview
More Chickens, Fewer Farms
A Frenzy of Consolidation
Diminishing Options for Contract Growers
Bigger and Faster
Geographic Consolidation
Big Chicken, Big Waste
The Chesapeake Bay—Front and Center
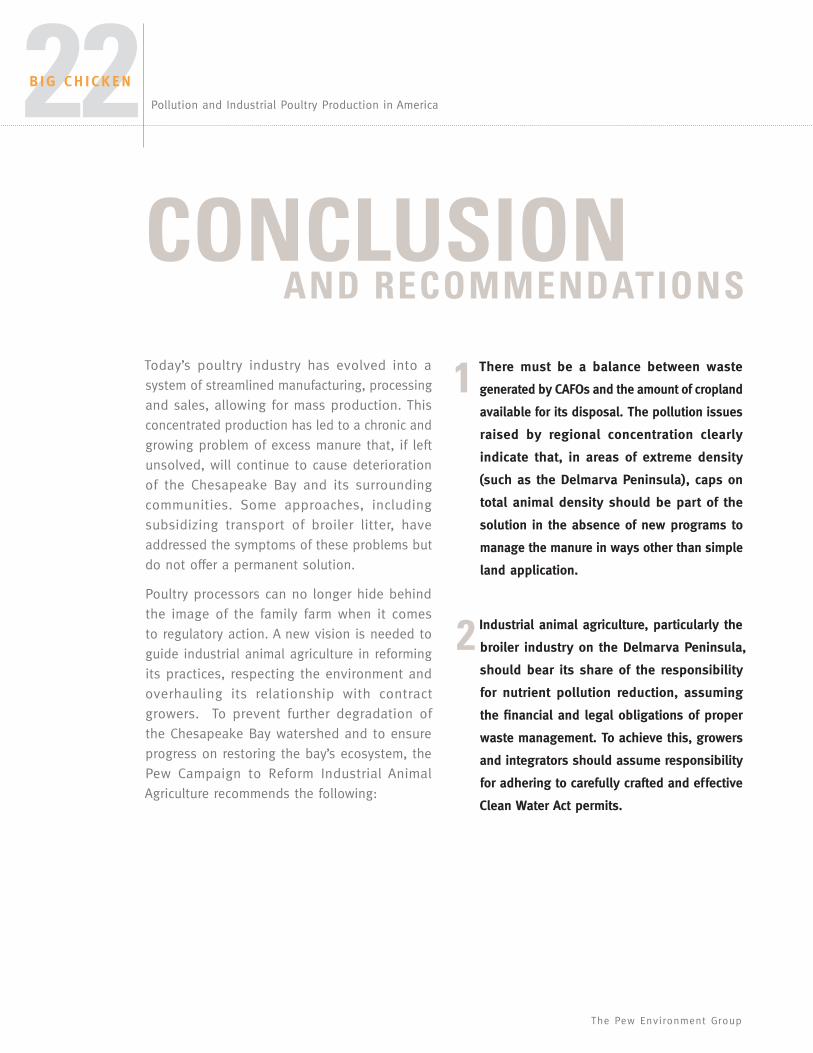
Conclusion and Recommendations
Endnotes
Glossary
Pollution and Industrial Poultry Production in America
BIG CHICKEN

01B iG Ch iCkEn
Pollution and Industrial Poultry Production in America
www.PewEnvironment.org
OvERvIEwIn nuggets, wings or strips, destined for the grill or cooked in the store, chicken is an American favorite. According to the American Meat Institute, chicken has become the No. 1 source of meat consumed by Americans, surpassing beef and pork by a significant margin.1
This shift in demand has been accompanied by a major change in how and where chickens are produced in the United States. As poultry consumption has grown, the number of businesses that raise the animals has dropped significantly, and the nature and geography of those operations have also changed.
In just over 50 years, the number of chickens produced annually in the United States has increased by more than 1,400 percent while the number of farms producing those birds has dropped by 98 percent. In 2011, a historically small number of operations, controlled by even fewer meat processing companies, known as integrators, dominates the production of American chicken. The size of individual operations has grown just as dramatically, and now the typical broiler chicken—a chicken raised for its meat— comes from a facility that produces more than 600,000 birds a year. These large-scale operations occupy a limited geographic area known as the
U.S. Per Capita Meat Consumption
100
90
80
70
60
50
40
30
20
10
0
1970 1972 1974 1976 1978 1980 1982 1984 1986 1988 1990 1992 1994 1996 1998 2000 2002 2004 2006 2008
PO
UN
DS
Chicken
Beef
Pork
Turkey
Source: USDA Economic Research Center, Food Availability Data System, Feb. 1, 2010.http://www.ers.usda.gov/Data/FoodConsumption/FoodAvailSpreadsheets.htm#mtpcc.

02B iG Ch iCkEn
Pollution and Industrial Poultry Production in America
The Pew Environment Group
inadequate policies and practices that govern industrial poultry production are reformed, environmental challenges will grow as broiler production continues to rise.
The Pew Campaign to Reform industrial Animal Agriculture recommends the following changes:
• Caps on total animal density.
• Shared financial and legal responsibility for proper waste management between farmers and corporate integrators.
• Monitoring and regulation of waste transported off concentrated animal feeding operation (CAFO) sites.
• A requirement that all medium and large CAFOs obtain Clean Water Act permits.
Industrial poultry production presents a host of
concerns not addressed in this report. These
include the overuse of antibiotics, pollution
caused by egg production, air quality problems
and the relationship between large corporations
and contract farmers. The Pew Charitable Trusts
will examine some of these issues in future reports.
American Broiler Belt. In many instances, they pose difficult environmental challenges for nearby and downstream communities.
Industrial poultry operations generally dispose of broiler waste by spreading it on open fields or cropland. However, many of them have little cropland associated with their facilities. As a result, an increasing number of farms and counties have more manure than can be used by local crops, and pollution problems occur when excess nutrients from manure are washed off the land and into local streams, rivers and other bodies of water. Nowhere has this problem of concentrated poultry production and manure-associated pollution become more evident than in the Chesapeake Bay region.
The poultry industry has evolved into a streamlined system of industrial mass production. But the requirements for responsible waste treatment and disposal have not kept pace, and today’s 600,000-bird production factories continue to be regulated like the small family farms they no longer resemble. Unless the
Phot
o: D
avid
Har
p
» Broiler chickens on the Delmarva Peninsula often spend their short lives in cavernous buildings.

03B iG Ch iCkEn
Pollution and Industrial Poultry Production in America
www.PewEnvironment.org
plants traded with one another in a system of open, often local markets. Farmers raising chickens for meat would sell to those who offered the best prices. In 1950, more than 1.6 million farms spread across the country were growing chickens for American consumers. By 2007, fully 98 percent of those chicken farms were gone, despite the fact that Americans were consuming even more chicken—more than 85 pounds per person per year, according to the U.S. Department of Agriculture (USDA).4 Over that same period, broiler sales jumped by 8 billion birds, or more than 1,400 percent.
During the early part of the 20th century, chickens were raised on small farms throughout the United States, and their meat was principally a byproduct of the egg industry. However, production of broilers—young chickens raised specifically for meat—nearly tripled between 1940 and 1945,2 in part because poultry, unlike beef, pork, veal and lamb, was not rationed during World War II. The availability of chicken encouraged consumption, as did research and technology developments that allowed the emerging broiler industry to expand rapidly.3
As the industry took hold, independent feed mills, hatcheries, producers and butchering
MORE CHICKEN, FEwER FARMS
Phot
o: J
ane
Thom
as
» These poultry houses are a short distance from the Chester River on Maryland’s Eastern Shore.

04B iG Ch iCkEn
Pollution and Industrial Poultry Production in America
The Pew Environment Group
A FRENZYOF CONSOLIDATION
As commercial opportunities for chicken meat sales expanded, the structure of the industry began to change. By the early 1940s, a few feed dealers who wanted to broaden the market began extending credit to farmers raising chickens and then accepting payment when the birds were sold to processing plants. These types of arrangements marked the beginning of a consolidation process in which a single entity gained control over various aspects of poultry production. In the early years of this “vertical integration,” feed store owners held a level of control at the front end of poultry production. A short time later, the meat processing companies took control further along the production chain. Today known as integrators, such companies now control virtually all aspects
of the business, from breeding of chicks, through processing and retailing, and often transporting a wide range of poultry products to grocery stores and restaurants.
In the past, as now, an integrator would attempt to ensure a supply of chickens sufficient to keep larger and larger processing plants running close to or at capacity. But rather than raising the chickens, integrators contracted with individual growers to manage their flocks.
By the mid-1950s, the broiler industry had transformed from an open-market system to one that would come to define industrial animal production: extensive vertical integration, based almost exclusively on contracts with farmers for raising the birds.5 According to the USDA, 95 percent of broiler producers in 1950 were independent; five years later, the number of independent growers had plummeted, accounting for only 10 percent of broiler production. At that point, 88 percent of broilers were produced under contract, and 2 percent were produced in company-owned broiler facilities.6
In pursuit of further efficiencies and profits, integrators engaged in a frenzy of consolidation throughout the 1950s and 1960s. Many of the independent poultry-producing businesses closed or were bought out by the integrators. These larger entities could coordinate production at each stage to avoid either overproduction or shortages and could purchase medicine, equipment and other supplies at bulk discounts. Ph
oto:
Dav
id H
arp
» Chickens are processed for market at a Delaware plant.

05B iG Ch iCkEn
Pollution and Industrial Poultry Production in America
www.PewEnvironment.org
DIMINISHING OPTIONS FOR CONTRACT
GROwERSToday, integrators generally breed their own chickens, not only to achieve the desired level of quality and characteristics that allow rapid weight gain with minimal feed, but also to produce birds of a uniform size that can be slaughtered, packaged and processed by machine rather than individually cut and prepared. The integrator chooses when to deliver chicks to a contract grower and when to collect grown birds for delivery to a processing facility.
Contracts between the integrators and individual growers typically specify that the integrators provide the chicks, the feed and veterinary services as well as other management direction. The growers provide the labor and chicken houses built to integrators’ specifications and generally are responsible for water and fuel for heating, management of manure, and disposal of other waste, including dead birds.7
Under common contract terms, the grower does not own or sell the birds and is not paid on a straightforward measure of weight and quality. Instead, the grower is paid for services and must follow the integrator’s directions as stipulated in the contract and provided by the integrator’s field staff. Although the grower may hold a mortgage on poultry houses in the range of a quarter million dollars or more, the contract frequently lasts only as long as it takes to raise a flock of chickens—in some cases, a matter of weeks.8 Numerous integrators compete for broiler sales in the national retail food and restaurant market, but one firm often will dominate a growing region or territory. Growers rarely receive multiple competitive contract offers.9
Phot
o: D
avid
Har
p
» newly hatched chickens don’t yet fill a Delmarva poultry house. As they grow, they will fill it wall to wall.

06B iG Ch iCkEn
Pollution and Industrial Poultry Production in America
The Pew Environment Group
BIGGER AND FASTERIn just over 50 years, the number of chickens produced annually in the United States has increased by more than 8 billion birds—a 1,400 percent increase—while the number of broiler farms has plummeted from more than 1.6 million in 1950 to just over 27,000 in 2007, a 98 percent
decline. These seemingly conflicting statistics result from the shifting of poultry production from traditional farms to an industrialized system of processing plants served by massive growing operations that produce not only more chickens, but bigger chickens at a faster rate.
U.S. Broiler Farms: What They Produce
1950 1978 1987 1997 2007
Farms10 1,636,705 31,743 27,645 27,737 27,091
Chickens 581,038,865 3,062,154,490 4,361,975,630 7,366,526,456 8,914,828,122
Unknown under 200,000,000 200,000,000 to 399,999,999 400,000,000 to 599,999,999 600,000,000 to 799,999,999 800,000,000 and over
numbers of Broiler Chickens Per State—1950 and 2007
1950 2007
Source: USDA Census of Agriculture
Source: USDA Census of Agriculture
07B iG Ch iCkEn
Pollution and Industrial Poultry Production in America
www.PewEnvironment.org
mortgages to pay for the initial investment and to finance upgrades required by new contracts.11
With the development of these large-scale concentrated animal feeding operations (CAFOs), barnyards have virtually disappeared, and many of today’s broiler operations have little land associated with them, other than land for the chicken houses and access roads. A 2009 USDA report noted that one-third of modern broiler operations have no associated cropland.12 This lack of associated cropland can have a profound impact on pollution and waste management.
Today, the number of birds raised by a single industrial poultry operation is staggering. According to a USDA report, the typical broiler in 2006 came from an operation that produced about 605,000 birds a year, compared with an operation producing 300,000 birds a year in 1987. The same report noted that whereas a typical chicken house built in the 1960s was about 12,750 square feet, newer houses average more than 20,000 square feet, and large houses built in 2005 and 2006 were larger still—up to 36,000 square feet. Increasingly, individual growers rely on multiple houses, and many carry large
Percentage of Broiler Operations by Size—1987 and 2007
1987
2007
90%
80%
70%
60%
50%
40%
30%
20%
10%
0%
500,000 broilers or more
300,000 to 499,999
200,000 to 299,999
100,000 to 199,999
60,000 to 99,999
90%
80%
70%
60%
50%
40%
30%
20%
10%
0%
Operations with:
Delaware
Delaware
Arkansas
Arkansas
Maryland
Maryland
Georgia
Georgia
» The size of individual broiler operations has soared in recent decades in the United States.
Source: USDA Census of Agriculture
08B iG Ch iCkEn
Pollution and Industrial Poultry Production in America
The Pew Environment Group
GEOGRAPHICAs vertical integration of broiler production was developing in the early 1950s, the poultry industry began to form a distinctive geographic footprint. Development of poultry regions was driven by a desire to limit the transportation costs for chicks, feed and live broilers13 and, according to some agricultural historians, by a cultural acceptance of the evolving contracting practices in some areas.14 By the late 20th century, most broiler farms were under contract to a single nearby processor.15 Today, virtually all commercial broiler production is carried out under contract, generally within 25 to 35 miles of processing and feed mills.16
The Delmarva Peninsula on the Eastern Shore of the Chesapeake Bay, with its proximity to large markets in New York and Philadelphia, became one of the first major poultry centers.17 During World War II, the poultry facilities in this slice of Delaware, Maryland and Virginia focused on feeding the troops, so the industry began to grow and consolidate elsewhere. In the Southern states, cotton-weary land, a ready supply of low-wage workers, a history of sharecropping and a landscape of small, privately owned parcels of land made the region prime for contract broiler production.18 Thus developed the Broiler Belt, an area extending from eastern Texas through Arkansas, Alabama, Georgia and much of the Southeast and north to Maryland and Delaware.
Today, the Broiler Belt has areas where chickens far outnumber people. Delaware, for example, produces roughly 270 chickens per person; Mississippi, 275; and Arkansas, 400.
CONSOLIDATION
State2007 Broilers
(sales in head)Percent of U.S. Total
Georgia 1,398,912,031 16%
Arkansas 1,171,556,369 13%
Alabama 1,016,230,625 11%
Mississippi 823,427,574 9%
North Carolina 781,416,896 9%
Texas 616,299,999 7%
Kentucky 309,769,263 3%
Maryland 296,373,113 3%
California 280,512,754 3%
Missouri 279,937,641 3%
virginia 249,184,367 3%
Delaware 246,098,878 3%
Oklahoma 242,228,335 3%
South Carolina 236,209,584 3%
Tennessee 206,132,684 2%
Source: USDA Census of Agriculture

09B iG Ch iCkEn
Pollution and Industrial Poultry Production in America
www.PewEnvironment.org
BIG BIG CHICKEN,wASTE
As broiler production increases, so does the production of the industry’s major waste product: chicken manure. Broiler litter—the mix of manure and bedding taken out of broiler houses—must be disposed of. Although possible uses for the litter, from biofuel to cattle feed,20 have been explored over the years, the majority is still handled as it was decades ago: It is spread on farm fields to enrich soil and fertilize crops.21
High in nutrients needed by crops, particularly nitrogen and phosphorus, broiler litter can be
The geographic consolidation of the broiler industry, which is more pronounced in certain regions of the Broiler Belt, such as northern Georgia, northern Alabama, eastern Maryland and southern Delaware, has advantages for meat processors but also carries a serious downside. As the USDA noted in a 2003 report, “Ever-growing numbers of animals per farm and per acre have increased the risk of water pollution.”19
The pollution problem has its roots in a simple combination of biology, geography and arithmetic.
Continued on Page 11
» Chicken manure is piled in a field in Sussex County, Del., where it will be spread as fertilizer for crops.
Phot
o: R
ober
t Ben
nett

10B iG Ch iCkEn
Pollution and Industrial Poultry Production in America
The Pew Environment Group
ExcessNutrients
OxygenLowOxygen
Nutrients such as nitrogen and phosphorus cycle naturally through the environment in various forms and—at the right levels in the right places—help sustain plant and animal life. They can cause serious degradation of water resources, however, when excessive amounts enter lakes, rivers, estuaries and other bodies of water.
Excess nutrients in water set off a chain reaction called eutrophication that starts with acceleration of algae growth and can lead to serious loss of aquatic life, beach closures, shellfish contamination and dramatic seasonal dead zones. The algae may be noxious or even toxic, and its presence on the water surface can block sunlight and lead to loss of
important underwater grasses that provide habitat for fish and other organisms. The algae’s decomposition, in turn, uses up oxygen needed to sustain aquatic life.
Dissolved oxygen is one important measure of the health of a water body. If oxygen levels drop too low, fish, crabs and other living things will be affected, experiencing growth or reproductive impairments or even death. The problems with low dissolved oxygen can be most pronounced in deeper waters and often occur during summer months, at the same time that shallow waters become too warm for some species. The amount of nutrients reaching U.S. waters has increased dramatically over the past 50 years.27
NUTRIENTS IN THE wATER: Too Much of a Good Thing
Illus
trat
ion:
Ber
ces
Desi
gn
» Excess nutrients in chicken manure can run off farm fields into the water, leading to algae growth, oxygen depletion and loss of aquatic life.

11B iG Ch iCkEn
Pollution and Industrial Poultry Production in America
www.PewEnvironment.org
Depending upon soil and other environmental factors, some practices employed to keep nutrients from running off the land in rainstorms simply route those pollutants into groundwater and from there to receiving streams.24 Research indicates that this may be the case in certain coastal areas, including the Chesapeake Bay region, where nearly half of the nitrogen flowing into the bay from nontidal streams comes from groundwater, and where well monitoring shows increasing levels of nitrates in deeper groundwater.25 In 2011, the National Academy of Sciences noted that soil phosphorus on the Delmarva Peninsula is an order of magnitude greater than what crops need.26 This “legacy phosphorus” associated with broiler litter application, warned the report authors, can mean trouble for the bay for years to come.
Out of Balance
Compared with commercial fertilizers, nutrient-rich litter can be a less expensive alternative for fertilizing cropland or turf, but its management has proven to be particularly challenging. As a result, broiler litter in the Broiler Belt is a
an effective fertilizer. But when overused, poorly managed or inappropriately timed, the nutrients in poultry manure can cause significant water quality problems.
All livestock manure contains nitrogen and phosphorus, but poultry manure often has a higher nutrient content than other types of manure, and those nutrients may not be present in the proportions needed by crops. Broiler litter frequently contains phosphorus and nitrogen in similar ratios,22 but many crops require far less phosphorus than nitrogen. When farmers follow long-standing practices and apply broiler litter based on a crop’s nitrogen needs, they over-apply phosphorus.
For many years, agricultural experts suggested that such overapplication was not a serious problem, because phosphorus moves into water mainly by being attached to sediment. Effective erosion control practices, they reasoned, could keep excess phosphorus on the land. After years of studying the movement of nutrients in the environment, however, scientists now know that a buildup of excess phosphorus in the soil can eventually result in additional phosphorus release into water.23
number of Broiler Chickens Per Acre of Cropland—1950 and 2007
Unknown under 25 25 to 49 50 to 99 100 to 199 200 and over
1950 2007
Continued From Page 9
Source: USDA Census of Agriculture
12B iG Ch iCkEn
Pollution and Industrial Poultry Production in America
The Pew Environment Group
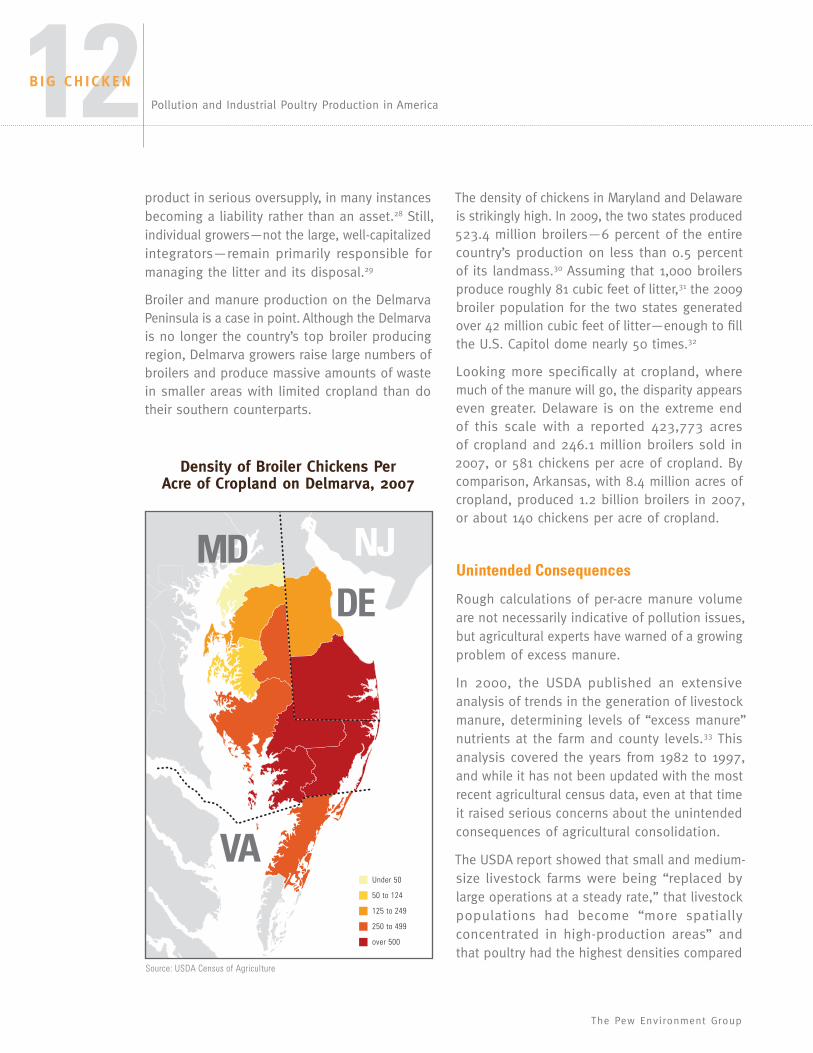
The density of chickens in Maryland and Delaware is strikingly high. In 2009, the two states produced 523.4 million broilers—6 percent of the entire country’s production on less than 0.5 percent of its landmass.30 Assuming that 1,000 broilers produce roughly 81 cubic feet of litter,31 the 2009 broiler population for the two states generated over 42 million cubic feet of litter—enough to fill the U.S. Capitol dome nearly 50 times.32
Looking more specifically at cropland, where much of the manure will go, the disparity appears even greater. Delaware is on the extreme end of this scale with a reported 423,773 acres of cropland and 246.1 million broilers sold in 2007, or 581 chickens per acre of cropland. By comparison, Arkansas, with 8.4 million acres of cropland, produced 1.2 billion broilers in 2007, or about 140 chickens per acre of cropland.
Unintended Consequences
Rough calculations of per-acre manure volume are not necessarily indicative of pollution issues, but agricultural experts have warned of a growing problem of excess manure.
In 2000, the USDA published an extensive analysis of trends in the generation of livestock manure, determining levels of “excess manure” nutrients at the farm and county levels.33 This analysis covered the years from 1982 to 1997, and while it has not been updated with the most recent agricultural census data, even at that time it raised serious concerns about the unintended consequences of agricultural consolidation.
The USDA report showed that small and medium-size livestock farms were being “replaced by large operations at a steady rate,” that livestock populations had become “more spatially concentrated in high-production areas” and that poultry had the highest densities compared
product in serious oversupply, in many instances becoming a liability rather than an asset.28 Still, individual growers—not the large, well-capitalized integrators—remain primarily responsible for managing the litter and its disposal.29
Broiler and manure production on the Delmarva Peninsula is a case in point. Although the Delmarva is no longer the country’s top broiler producing region, Delmarva growers raise large numbers of broilers and produce massive amounts of waste in smaller areas with limited cropland than do their southern counterparts.
DE
NJ
VA
MD
Under 50
50 to 124
125 to 249
250 to 499
over 500
Density of Broiler Chickens Per Acre of Cropland on Delmarva, 2007
Source: USDA Census of Agriculture

13B iG Ch iCkEn
Pollution and Industrial Poultry Production in America
www.PewEnvironment.org
Poultry
Feedlot Beef
Swine
Dairy
61%60% 18%
15%
7%
18%
16%
5%
USDA said, the poultry sector, which accounts for only 15 percent of the total number of confined animal operations, produces the most total nutrients of any livestock sector.37
Poultry and Pollution
Nutrients are found not only in broiler litter and other livestock manure, but also in commercial fertilizers, municipal wastewater discharges, storm water and even runoff from forested land. As a result, the question of how much pollution is directly tied to animal manure, let alone broiler litter, is not easy to answer. Although it is clear that no one to date has a definitive estimate of poultry’s share of pollution, it is also clear that major poultry-producing regions show evidence of water quality impacts.
In Georgia, for example, University of Georgia researchers found in 2002 that 13 counties in the state had excess phosphorus in the soil. Of those, 10 were areas where poultry was concentrated.38 Less than a decade earlier, only four counties had been identified as having excess phosphorus. A 1999 study by the U.S. Geological Survey (USGS)
with all livestock for all years. The analysis also showed a “dramatic increase” in poultry density between 1982 and 1997. More importantly, the report linked the spatial concentration to
“increased problems with the use and disposal of animal waste” and found that such problems had become more widespread with the shift to fewer but larger livestock operations.
With access to data on farm animal numbers, information on manure characteristics and more specific information on types of cropland, the USDA researchers analyzed the nutrient needs of local crops. That approach allowed them to estimate the ability of farmland to effectively utilize the manure nutrients. They found that an increasing number of farms and counties had more manure than could be used by local crops, and of the 1.5 billion pounds of excess nutrients found on farms, more than half were associated with poultry.34
As the USDA pointed out, poultry manure generally contains two to four times more nutrients than is contained in manure of other livestock types,35 and 40 percent of U.S. broiler production occurs on farms without any crop acreage.36 In fact, the
nitrogen Phosphorus
Excess nutrients: Where They Come From
Source: USDA

14B iG Ch iCkEn
Pollution and Industrial Poultry Production in America
The Pew Environment Group
With strong evidence of water problems linked to overapplication of poultry manure on area cropland, the city and the utility were able to reach a settlement that altered common practices.42
Today, new requirements for nutrient management planning have been put in place in the watershed, including lower limits on the amount of phosphorus that may be applied to the land, along with a court-supervised program of soil testing and monitoring as well as tracking of manure shipments. Because excess nutrients had already built up in the environment, however, water quality has not improved to the extent anticipated.43 In fact, in 2005, the Oklahoma attorney general sued 14 Arkansas poultry companies seeking compensation for damage to the Illinois River.44
found high levels of phosphorus in Georgia’s West Fork Little River, again in areas with intensive poultry production.39
Another area where broiler growth and concentration have been accompanied by water pollution problems lies in northwestern Arkansas and eastern Oklahoma. In the Eucha and Spavinaw watersheds within this poultry-rich region, nearly 44 million chickens were produced in roughly 2,450 chicken houses in 2010.40 Here as elsewhere, the waste disposal practice has been for broiler litter to be spread on cropland. Over time, this led to major problems with algal blooms, which in turn degraded drinking water supplies. When voluntary measures to curb out-of-control nutrient pollution failed, Tulsa and its Metropolitan Utility Authority, which supplies drinking water to Tulsa and more than a dozen other cities, went to court for relief.41
Phot
o: D
avid
Har
p
» Chicken houses and soybean crops share space on a farm on Maryland’s Eastern Shore.

15B iG Ch iCkEn
Pollution and Industrial Poultry Production in America
www.PewEnvironment.org
stem the loss of Chesapeake Bay resources such as rockfish, blue crabs and oysters and to reverse a trend of increasingly large seasonal dead zones. Scientists studying the bay also determined the dissolved oxygen levels required to sustain its living resources, with specific goals set for different areas, such as fish spawning and nursery locations, open water and shellfish areas.
Despite a prolonged and wide-ranging cleanup effort, nutrient reduction goals have not been reached, and the bay still shows the effects of excess nutrients. An analysis of biological monitoring data indicates that more than half of the streams in the watershed are rated as “poor” or “very poor,” bereft of snails, insects and other low-level organisms critical to a healthy aquatic
On the eastern edge of the Broiler Belt, problems with overapplication of manure and the buildup of pollutants in the environment have come to the fore in a tense public debate.
Seven states, the District of Columbia and the Environmental Protection Agency (EPA) are working together to restore the Chesapeake Bay with a precedent-setting but controversial “pollution diet” for the nation’s largest estuary. The livestock industry, including the poultry industry, is arguing against a recent uptick in the pace of cleanup efforts and the involvement of federal regulators in protecting the bay.
More than two decades ago, scientists recognized that dramatic reductions in the discharge of nutrients and sediment would be required to
Phot
o: P
aul S
oude
rs/P
hoto
Libr
ary
» Annapolis, Md., is a popular gateway to the Chesapeake Bay, the nation’s largest estuary.
FRONT AND CENTERTHE CHESAPEAKE BAY
16B iG Ch iCkEn
Pollution and Industrial Poultry Production in America
The Pew Environment Group
WesternBranch
Elizabeth River SouthernBranch
Elizabeth River
EasternBranchElizabethRiver
Lafayette River
Lynnhaven River
Appomattox River
Upper James RiverLower PamunkeyRiver
Upper Pamunkey RiverLower
MattaponiRiver
Upper MattaponiRiver
Middle Pocomoke RiverUpper Rappahannock River Upper Pocomoke River
Wicomico River
MiddlePatuxent
River
Upper Nanticoke River
WesternBranch
Upper PotomacRiver
AnacostiaRiver Upper
PatuxentRiver
Upper ChoptankRiver
Upper Chester River
C&D Canal
0% – 50%
51% – 75%
76% – 90%
91% – 99%
100% (PASS)
No Data
Source: U.S. Geological Survey
#
#
#
#
#
Norfolk
Richmond
Salisbury
Washington
Baltimore
#
UTM Zone 18N, NAD 83
Dissolved Oxygen (June - September, 2008 - 2010)Percent of Goal Achieved (3 Year Analysis)
Created by HW, 03/09/11
Percent of Goal AchievedAll Uses, Summer Period
0 25 5012.5 Kilometers
0 25 5012.5 Miles
Chesapeake Bay ProgramA Watershed Partnership
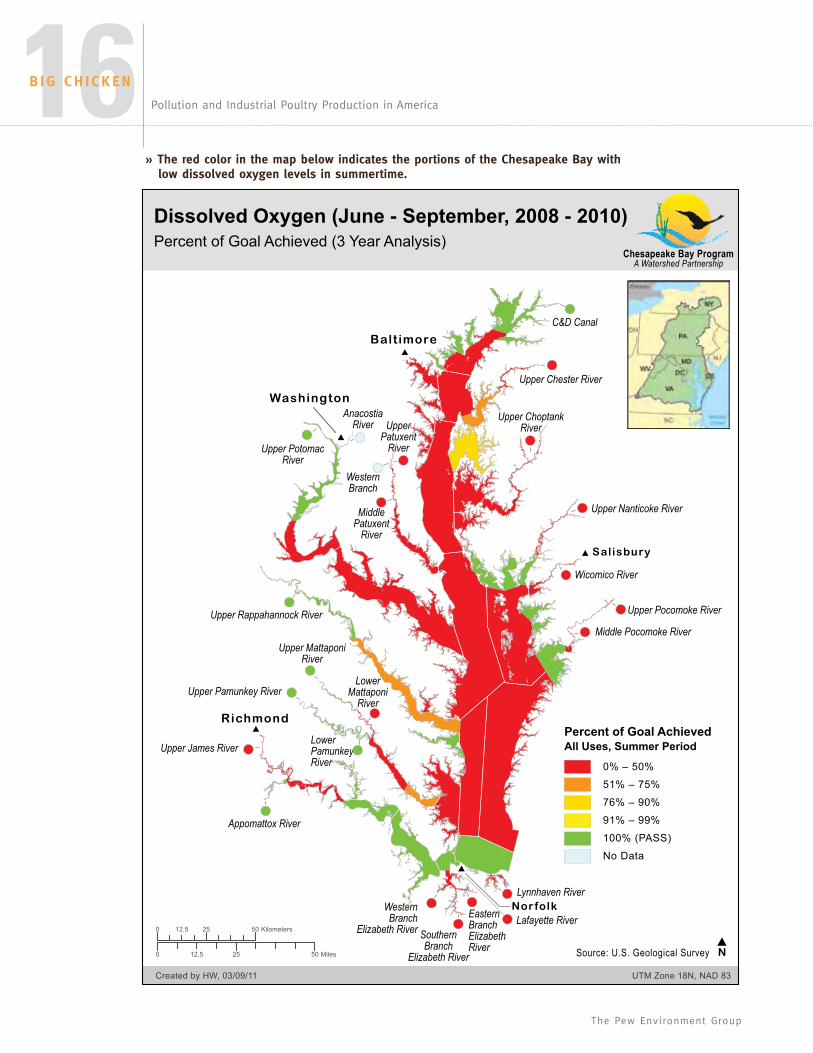
» The red color in the map below indicates the portions of the Chesapeake Bay with low dissolved oxygen levels in summertime.

17B iG Ch iCkEn
Pollution and Industrial Poultry Production in America
www.PewEnvironment.org
attributable in part to the leaching of manure pollutants into groundwater that feeds the river. Such a buildup in the groundwater could deliver pollutants to rivers and streams for years to come, as occurred in other areas, such as the Suwannee River Basin of Florida.51
A Lagging Regulatory Response
In theory, large livestock facilities have been regulated under the Clean Water Act for more than a quarter of a century. In practice, the regulatory impact of the law on the broiler industry and its enormous waste generation has been minimal at best, even in sensitive watersheds such as the Chesapeake Bay.
The modern-day Clean Water Act is widely credited with helping achieve dramatic reductions in water pollution across the country. Although the 1972 law’s ambitious goals of “zero discharge” and “fishable, swimmable waters” have not been achieved in many areas, the quality of U.S. waters has improved dramatically from the days before the law, when fish kills were commonplace and an oil slick floating on Ohio’s Cuyahoga River burst into flames.52
Many environmental policy analysts say the workhorse of the Clean Water Act has been the National Pollution Discharge Elimination System (NPDES) permit program, the section of the law that requires permitting or licensing of discrete or
“point sources” of pollution.53 Those permits, which may include specific limits on the concentration of pollutants associated with a facility, frequently compel the use of certain cleanup or control technologies and foster application of what amounts to good housekeeping practices to prevent violations of permit terms.
There is also broad agreement, echoed forcefully in a recent report from federal and state water regulators,54 that the law’s approach to diffuse or
environment.45 In 2009, the percentage of tidal tributaries and bay segments meeting dissolved oxygen goals was under 12 percent.46 (The red color in the map on the opposite page indicates the portions of the Chesapeake Bay with low dissolved oxygen levels in summertime from 2008 to 2010.)
Agriculture is by no means solely responsible for all of the bay’s problems, but despite years of voluntary and taxpayer-subsidized programs to curb farm-generated pollution, agriculture remains a significant source of the bay’s nutrients.47 In May 2010, the EPA reported that an estimated 19 percent of excess nitrogen and 26 percent of excess phosphorus were directly linked to animal manure in the watershed.48 Because there is no comprehensive water quality monitoring for runoff from manured cropland, the specific estimates, generated by a sophisticated and widely reviewed bay model, are subject to some debate, but one conclusion remains clear: Agriculture, particularly animal agriculture, will have to do more to protect the bay.
According to a new USDA report, the vast majority of bay cropland fertilized with manure is not being managed properly to reduce the loss of manure nutrients to the environment.49 This report, assessing the impact of agricultural conservation practices, found that roughly 38 percent of cropland in the watershed is fertilized with manure and that those acres have, on average, twice the nitrogen runoff of acres not being fertilized with manure. The same report also found that phosphorus losses were particularly high for cropland receiving manure.
An analysis of nutrient trends in the bay by the USGS shows modest yearly declines in nutrients overall but increasing levels of nutrients along two river segments, including the Choptank on Maryland’s Eastern Shore.50 This river, which runs through the Delmarva poultry region, shows increasing levels of nitrogen, which may be

18B iG Ch iCkEn
Pollution and Industrial Poultry Production in America
The Pew Environment Group
In 2003, the EPA issued regulations to cover dry-manure broiler operations and move toward addressing the issues of land application of manures. Finalized in 2008, the regulations called for permitting of large dry-manure broiler operations and other CAFOs and, for the first time, set requirements for land application of manure generated by those facilities. Growers, but not integrators, were required to address management of animal production areas, properly handle the storage of both wet and dry manure and, again for the first time, develop and follow nutrient management plans to control the loss of nitrogen and phosphorus from the fields where manure was applied. The latter requirement applied only to land “under the control” of the permit holder, and manure that left the facility was not subject to the permit requirements.
Implementation of the rule has been less than seamless. The EPA has no nationwide inventory of CAFO operations,55 and court rulings have complicated efforts to ensure that all operations likely to create water quality problems are, like many other businesses managing waste, covered by permits.56 The National Chicken Council, several of the large integrators and others have resisted efforts to require Clean Water Act permits or place new restrictions on land application of manure. Today, it is unclear just how many facilities will actually be subject to enforceable permits.
Multiple Strategies, Modest Results
Over the years, a variety of other efforts outside the Clean Water Act have been put in place to deal with pollution from poultry operations and other CAFOs.
Virginia, for example, passed legislation in 1999 requiring poultry operations with more than 20,000 broilers to acquire special state permits and implement nutrient management plans for
“non-point” pollution sources, such as cropland runoff, has been far less effective. In many bodies of water, uncontrolled non-point pollution now dominates pollutant flows and remains the primary obstacle to cleanup.
Although the law designates CAFOs as point sources, it also specifically exempts “agricultural stormwater” from the permitting requirements. In essence, then, large livestock operations have been given a unique and arguably ineffective dual regulatory status: regulated as point sources for waste in broiler houses and storage areas, but treated differently when that same waste runs off the cropland where it is applied.
In the mid-1970s, the EPA, in keeping with the approach used for other pollution sources, issued industry-specific regulations for CAFOs. These rules addressed leaks and spills from the storage of liquid manures in production areas but did not address management of manure used to fertilize crops. They also specifically excluded poultry facilities, such as most broiler operations, that manage and store manure in a dry state.
Phot
o: D
avid
Har
p
» Populations of blue crabs in the Chesapeake Bay have suffered from pollution related to sediments and nutrients flowing into the bay.

19B iG Ch iCkEn
Pollution and Industrial Poultry Production in America
www.PewEnvironment.org
from operations that could not use the waste as fertilizer.61 About 15 percent of the program costs were picked up by the poultry integrators.
In 1997, after an outbreak of the toxic marine organism Pfiesteria killed thousands of fish and sickened several watermen and others,62 Maryland took action to address the excess nutrients that appeared to be a catalyst for the costly episode. The Maryland Water Quality Improvement Act requires nearly all manure users to develop plans for the appropriate use of nutrients.63 Recent reports from the state indicate a high level of compliance with the initial submittal requirements but noncompliance related to updating and implementing the plans.64 Delaware followed suit with plan requirements in 1999, phasing in the mandate for plans from 2002 to 2007.65
In these bay states and elsewhere, many individual farmers have also taken voluntary action to control pollution. Many rely on federal
manure application.57 Those plans were to be based on crop needs for phosphorus rather than the traditional and more permissive approach of nitrogen-based application rates. Virginia’s broiler litter transport incentive program now subsidizes the movement of modest amounts of broiler litter outside the Chesapeake Bay watershed.58
In Maryland, a broader state transport assistance program covers a variety of livestock manures and provides special assistance to poultry growers in four lower Eastern Shore counties on the Delmarva.59 Funding for the Maryland program derives in part from general appropriations and contributions from integrator companies.60
Delaware, likewise, uses federal and state funding along with money from some integrators to move manure out of certain areas that lack sufficient cropland. In 2009, the program, which cost approximately $850,000, subsidized the relocation of roughly 65,000 tons of manure
Phot
o: D
avid
Har
p
» Chickens are caught to be placed in cages for transport to a processing facility in Delaware.
20B iG Ch iCkEn
Pollution and Industrial Poultry Production in America
The Pew Environment Group
dramatic reductions in nutrients long hoped for. As the report of the EPA’s state and federal Nutrient Innovations Task Group noted in 2009, livestock agricultural practices remain one of the largest sources of nutrient pollution nationwide.66
funding to build manure storage sheds, plant cover crops, retire highly erodible lands and create vegetative buffers between fertilized fields and water courses. All of those efforts, without question, have made useful incremental improvements, but they have not achieved the
Phot
o: D
avid
Har
p
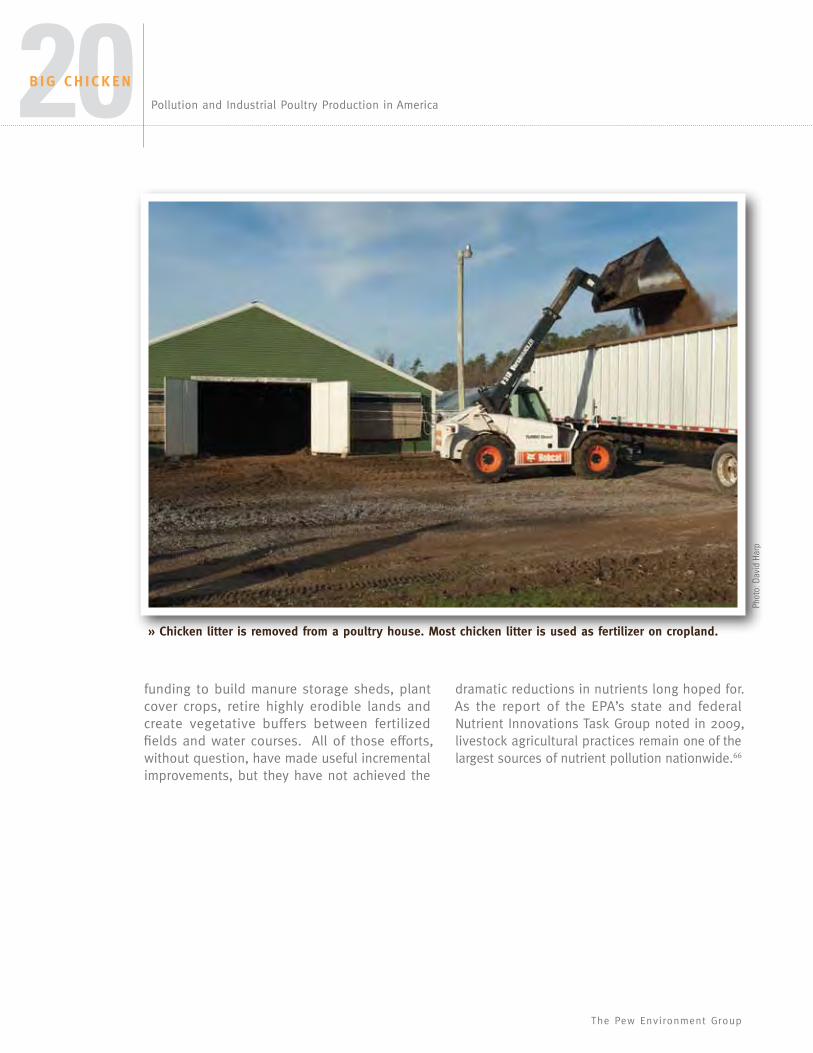
» Chicken litter is removed from a poultry house. Most chicken litter is used as fertilizer on cropland.
21B iG Ch iCkEn
Pollution and Industrial Poultry Production in America
www.PewEnvironment.org
to the report, manure was applied to crops at the wrong time on roughly 84 percent of acreage. The rate of manure application, according to the USDA, was inappropriate on approximately 70 percent of the acreage for nitrogen and 81 percent for phosphorus.
In our view, these striking deficiencies point to the fundamental and unresolved issue: too much manure in too small an area, a problem that appears to be growing across the Broiler Belt. It will only worsen if USDA projections for growth in poultry production are accurate and if regulatory controls do not catch up. The Pew Environment Group believes that the time to meet that challenge is now, and the place to begin is an area where there is a deep understanding of water resource threats, a long-standing commitment to restoration, and a history of multi-agency cooperation. The Chesapeake Bay should be priority number one.
Time for a New Approach
The problems of manure management are not new—they have evolved alongside a growing industry that now occupies pockets of the nation’s Broiler Belt with intense production. Associated problems have been seen for decades in areas from the Illinois River to the Chesapeake Bay, and during that time, policymakers have looked for practical solutions but often met harsh resistance from the poultry industry. The result of that tension is chicken production that has outpaced environmental management.
For the Chesapeake, in particular, the USDA’s recent assessment report may be the most telling. Despite a multitude of programs and more than two decades of education, the USDA finds that essentially every acre of farmland in the Chesapeake Bay watershed fertilized with animal manure requires better management.67 According
Phot
o: D
avid
Har
p
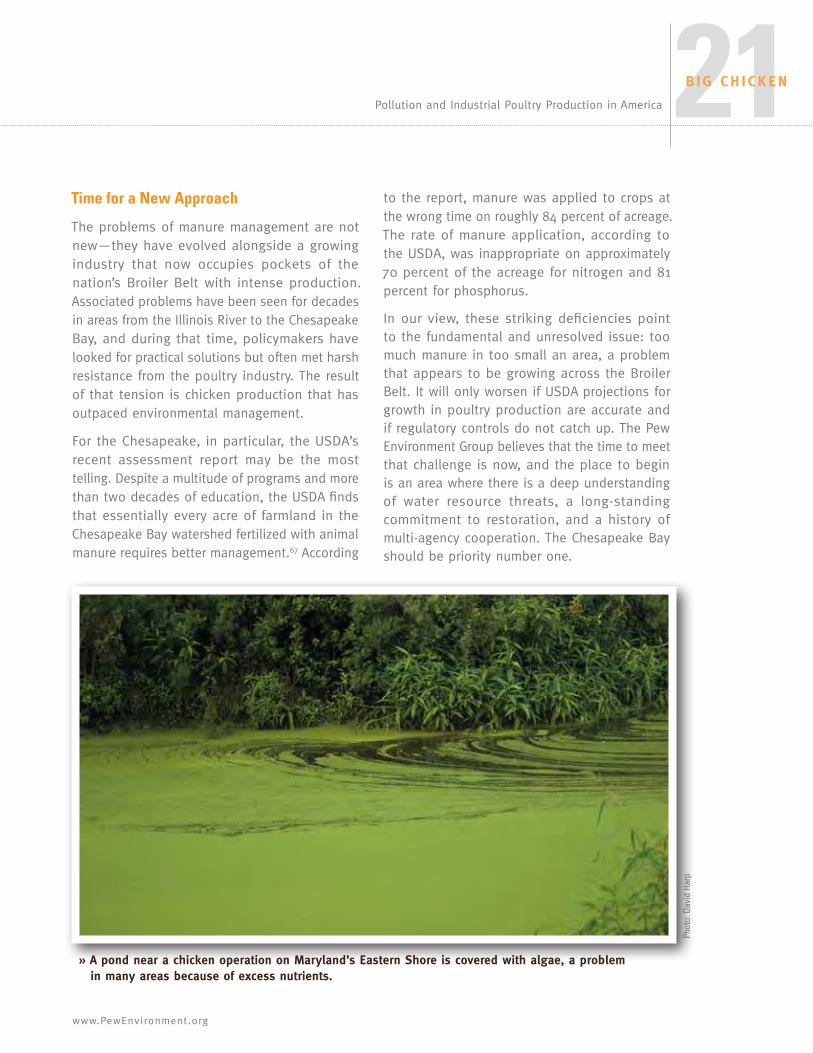
» A pond near a chicken operation on Maryland’s Eastern Shore is covered with algae, a problem in many areas because of excess nutrients.
22B iG Ch iCkEn
Pollution and Industrial Poultry Production in America
The Pew Environment Group
Today’s poultry industry has evolved into a
system of streamlined manufacturing, processing
and sales, allowing for mass production. This
concentrated production has led to a chronic and
growing problem of excess manure that, if left
unsolved, will continue to cause deterioration
of the Chesapeake Bay and its surrounding
communities. Some approaches, including
subsidizing transport of broiler litter, have
addressed the symptoms of these problems but
do not offer a permanent solution.
Poultry processors can no longer hide behind
the image of the family farm when it comes
to regulatory action. A new vision is needed to
guide industrial animal agriculture in reforming
its practices, respecting the environment and
overhauling its relationship with contract
growers. To prevent further degradation of
the Chesapeake Bay watershed and to ensure
progress on restoring the bay’s ecosystem, the
Pew Campaign to Reform Industrial Animal
Agriculture recommends the following:
There must be a balance between waste
generated by CAFOs and the amount of cropland
available for its disposal. The pollution issues
raised by regional concentration clearly
indicate that, in areas of extreme density
(such as the Delmarva Peninsula), caps on
total animal density should be part of the
solution in the absence of new programs to
manage the manure in ways other than simple
land application.
industrial animal agriculture, particularly the
broiler industry on the Delmarva Peninsula,
should bear its share of the responsibility
for nutrient pollution reduction, assuming
the financial and legal obligations of proper
waste management. To achieve this, growers
and integrators should assume responsibility
for adhering to carefully crafted and effective
Clean Water Act permits.
CONCLUSIONAND RECOMMENDATIONS
2
1

23B iG Ch iCkEn
Pollution and Industrial Poultry Production in America
www.PewEnvironment.org
Finally, Pew urges that regulations applied to
industrial animal agriculture in the Chesapeake
Bay region be considered for application
to this industry nationwide. By leveling the
regulatory playing field, public officials can put
a stop to the industry’s often-repeated threat
to move operations to states with minimum
pollution safeguards. These threats serve only
to undermine efforts to protect water supplies
and rural communities, and to force elected
officials and policymakers to establish “race to
the bottom” standards that benefit no one.
3
4
The EPA and the states should develop a
permit program for management of manure
transported of f CAFO sites. The permit
program should include careful coordination
and monitoring across watersheds when more
than one state is involved.
To prevent unintended and unmanaged pollutant
discharges from CAFOs, the bay states should
require all large and medium-size operations
to obtain Clean Water Act permits. States in
the Chesapeake watershed and the EPA should
proceed with the existing cleanup agreement
and timeline. Congress should continue to fully
fund the cleanup program and reject efforts to
stymie the process.
Phot
o: D
avid
Har
p

24B iG Ch iCkEn
Pollution and Industrial Poultry Production in America
The Pew Environment Group
1 The American Meat Institute fact sheet. 2009. U.S. Meat and Poultry Production & Consumption: An Overview. www.meatami.com/ht/a/GetDocumentAction/i/48781.
2 All statistics on number of farm operations, poultry inventory and broiler sales, unless otherwise noted, were gathered and derived from the National Agricultural Statistics Service’s Census of Agriculture from various years. www.agcensus.usda.gov.
3 MMartinez, S.W. April 1999. Vertical Coordination in the Pork and Broiler Industries: Implications for Pork and Chicken Products. Agricultural Economic Report No. 777. USDA Economic Research Service. www.ers.usda.gov/publications/aer777/aer777.pdf.
4 MacDonald, J.M. 2008. The Economic Organization of U.S. Broiler Production. Economic Information Bulletin No. 38. USDA Economic Research Service. www.ers.usda.gov/Publications/EIB38/EIB38.pdf.
5 Boyd, W., and M.J. Watts. 1997. “Agro-Industrial Just-in-Time: The chicken industry and postwar American capitalism.” In Globalising Food: Agrarian questions and global restructuring. D. Goodman and M. Watts (eds.). http://tiny.cc/62qxn.
6 Martinez. Vertical Coordination.7 Martinez, S.W. 2002. Vertical Coordination of Marketing Systems: Lessons From the Poultry, Egg and Pork Industries. USDA Economic Research Service.
www.ers.usda.gov/publications/aer807/aer807.pdf. For additional discussion of poultry contracting practices, see, for example: MacDonald, J., et al. November 2004. Contracts, Markets and Prices: Organizing the Production and Use of Agricultural Commodities. Agricultural Economic Report No. 837. USDA Economic Research Service. www.ers.usda.gov/publications/aer837/aer837.pdf. Ollinger, M., et al. 2005. Structural Change in the Meat, Poultry, Dairy and Grain Processing Industries. Economic Research Report No. 3. USDA Eco-nomic Research Service. www.ers.usda.gov/publications/err3/err3.pdf. Dicks, M.R. 2010. “Concentration and Competition in the Poultry Industry.” Presented at the Department of Justice and USDA joint public workshop on competition and regulatory issues in agriculture, Normal, Ala. www.justice.gov/atr/public/workshops/ag2010/016/AGW-15685-a.pdf.
8 Hamilton, N.D. 2002. “Broiler Contracting in the United States—A Current Contract Analysis Addressing Legal Issues and Grower Concerns.” 7 Drake Journal of Agricultural Law 43. www.nationalaglawcenter.org/assets/bibarticles/hamilton_broiler.pdf. And MacDonald, J.M., and W.D. McBride. 2009. The Transformation of U.S. Livestock Agriculture Scale, Efficiency and Risks. Economic Information Bulletin No. 43. USDA Economic Research Service. www.ers.usda.gov/Publications/EIB43/EIB43.pdf.
9 Key, N., and J.M. MacDonald. 2008. “Local Monopsony Power in the Market for Broilers? Evidence From a Farm Survey.” Presented at the annual meet-ing of the Agricultural and Applied Economics Association. http://ageconsearch.umn.edu/bitstream/6073/2/sp08ke30.pdf.
10 Numbers indicate broiler chickens sold and farms with broiler chicken sales, taken from the USDA Census of Agriculture through 2007. Census informa-tion: www.agcensus.usda.gov/Publications/2007/Full_Report/Volume_1,_Chapter_1_US/st99_1_001_001.pdf.
11 MacDonald, J.M. 2008. The Economic Organization of U.S. Broiler Production. Economic Information Bulletin No. 38. USDA Economic Research Service. www.ers.usda.gov/Publications/EIB38/EIB38.pdf.
12 MacDonald, J.M., and W.D. McBride. 2009. The Transformation of U.S. Livestock Agriculture Scale, Efficiency and Risks. Economic Information Bulletin No. 43. USDA Economic Research Service. www.ers.usda.gov/Publications/EIB43/EIB43.pdf.
13 Boyd, W. 2001. “Making Meat: Science, Technology and American Poultry Production.” Technology and Culture 42(4). http://birdflubook.com/resources/boyd631.pdf.
14 See, for example:
Striffler, S. 2005. Chicken: The Dangerous Transformation of America’s Favorite Food. Yale University Press.
Gisolfi, M.R. 2006. “From Crop Lien to Contract Farming: The Roots of Agribusiness in the American South, 1929-1939.” Agricultural History 80(2). www.jstor.org/stable/3744805.
Weinberg, C. 2003. Big Dixie Chicken Goes Global: Exports and the Rise of the North Georgia Poultry Industry. Business and Economic History On-Line. Vol. 1 www.h-net.org/~business/bhcweb/publications/BEHonline/2003/Weinberg.pdf.
15 Dimitri, C., E.C. Jaenicke and A.B. Effland. 2009. “Why Did Contracts Supplant the Cash Market in the Broiler Industry? An Economic Analysis Featuring Technological Innovation and Institutional Response.” Journal of Agricultural & Food Industrial Organization 7(1). www.bepress.com/jafio/vol7/iss1/art9.
ENDNOTES
25B iG Ch iCkEn
Pollution and Industrial Poultry Production in America
www.PewEnvironment.org
16 Cunningham, D.L. 2009. “Guide for Prospective Contract Broiler Producers,” University of Georgia, College of Agricultural Science and Environmental Sciences Bulletin 1167. www.caes.uga.edu/Publications/pubDetail.cfm?pk_id=6271.
17 Weinberg. Big Dixie Chicken.18 Gisolfi, “From Crop Lien to Contract Farming.” And Boyd, “Making Meat.”19 Ribaudo, M., et al. 2003. Manure Management for Water Quality: Costs to Animal Feeding Operations of Applying Manure Nutrients to Land. Agricul-
tural Economic Report No. 824. USDA Economic Research Service. www.ers.usda.gov/publications/aer824/aer824.pdf. 20 See, for example:
Perera, R., et al. 2010. Potential of Using Poultry Litter as a Feedstock for Energy Production. Louisiana Forest Products Development Center. Working Paper #88. www.lfpdc.lsu.edu/publications/working_papers/wp88.pdf.
Paudel, K.P., and C.S. McIntosh. 2000. “Economics of Poultry Litter Utilization and Optimal Environmental Policy for Phosphorus Disposal in Georgia” (presented at the annual meeting of the Southern Agricultural Economics Association, Lexington, Ky.). http://ageconsearch.umn.edu/bit-stream/23813/1/s00-03.pdf.
Baranyai, V., and S. Bradley. 2008. Turning Chesapeake Bay Watershed Poultry Manure and Litter into Energy: An Analysis of the Impediments and the Feasibility of Implementing Energy Technologies in the Chesapeake Bay Watershed in Order to Improve Water Quality. Chesapeake Bay Program Office. www.chesapeakebay.net/content/publications/cbp_17018.pdf.
21 Pelletier, B.A., J. Pease and D. Kenyon. 2001. Economic Analysis of Virginia Poultry Litter Transportation. Virginia Agricultural Experiment Station, Vir-ginia Polytechnic Institute and State University. http://scholar.lib.vt.edu/mirrors/vaes/01-1.pdf. And Ribaudo. Manure Management for Water Quality.
22 See, for example:
Kovzelove, C., T. Simpson and R. Korcak. 2010. Quantification and Implications of Surplus Phosphorus and Manure in Major Animal Production Regions of Maryland, Pennsylvania and Virginia. Water Stewardship. http://waterstewardshipinc.org/downloads/P_PAPER_FINAL_2-9-10.pdf.
“Phosphorus versus Nitrogen Manure Management.” Agronomy Guide. Penn State University College of Agricultural Sciences, Cooperative Extension. http://extension.psu.edu/agronomy-guide/cm/sec2/sec29a.
23 Sharpley, A., and R. Sheffield. 2001. “Phosphorus Management: Bridging the Interface Between Agriculture and Environment.” In USDA/EPA Livestock Environmental Stewardship Handbook. www.p2pays.org/ref/42/41277/Lesson34/34_Phosphorus_Management.html. And National Research Council of the National Academies. 2011. Achieving Nutrient and Sediment Reduction Goals in the Chesapeake Bay: An Evaluation of Program Strategies and Implementation. http://laboratoryequipment.com/uploadedFiles/Resources/Technology_Reports/NRC%20Chesapeake%20Bay%20Report_PREPUB.pdf.
24 See for example:
Sharpley and Sheffield. “Phosphorus Management;
Gollehon, N., et al. 2001. Confined Animal Production and Manure Nutrients, Agriculture Information Bulletin. USDA Economic Research Service, Resource Economics Division. www.ers.usda.gov/publications/aib771/aib771.pdf.
25 Phillips, S.W., and B.D. Lindsey. 2003. “The Influence of Ground Water on Nitrogen Delivery to the Chesapeake Bay.” USGS Fact Sheet FS-091-03. http://md.water.usgs.gov/publications/fs-091-03/html/index.html. And Goldman, E. 2005. “From Farm to Bay: Nitrogen’s Underground Passage.” In Chesapeake Quarterly 4(1). Maryland Sea Grant College.
26 National Research Council of the National Academies. 2011. Achieving Nutrient and Sediment Reduction Goals in the Chesapeake Bay: An Evaluation of Program Strategies and Implementation. http://laboratoryequipment.com/uploadedFiles/Resources/Technology_Reports/NRC%20Chesapeake%20Bay%20Report_PREPUB.pdf.
27 State-EPA Nutrient Innovations Task Group. 2009. An Urgent Call to Action: Report of the State-EPA Nutrient Innovations Task Group. www.epa.gov/waterscience/criteria/nutrient/nitgreport.pdf.
28 Young, K.B., et al. 2005. “How Far Can Poultry Litter Go? Cost Efficiency of New Technologies to Transport Litter to Fertilize Distant Crops.” http://arkan-saswater.org/319/pdf/03-900%20Litter%20Bank%20How%20Far%20Can%20Poultry%20Litter%20Go.pdf.
ENDNOTES
26B iG Ch iCkEn
Pollution and Industrial Poultry Production in America
The Pew Environment Group
ENDNOTES
29 See, for example:
Matthews, S.F. “Ag Production Contracts: Freedom to Contract, Public & Private Goods.” Missouri Agricultural Law Center. http://aglaw.missouri.edu/ag_production_contracts.htm#manure%20liability.
Goodwin, H.L., J. Hipp and J. Wimberly. 2000. “Off-Farm Litter Management and Third-Party Enterprises.” Winrock International. www.winrock.org/us_programs/files/Off-Farm%20Litter%20Management%20report.pdf.
Sinclair, W.N., and N.E. Horewitch. 2010. “Who Rules the Roost? CWA Liability After Md. Ruling.” Beveridge & Diamond. www.bdlaw.com/assets/attachments/260.pdf.
Piermattei, W. 2010. “Clinic Wins Key Ruling in Chesapeake Bay Pollution Lawsuit Against Poultry Industry.” Environmental Law at Maryland. Univer-sity of Maryland School of Law. No. 30, www.law.umaryland.edu/programs/environment/documents/F10_Newsletter.pdf.
30 Delmarva Poultry Industry fact sheets. 2009. “Facts About Delaware’s Broiler Chicken Industry” and “Facts about Maryland’s Broiler Chicken Industry.” www.dpichicken.org/faq_facts/docs/factsde2009.doc and www.dpichicken.org/faq_facts/docs/factsmd2009.doc.
31 Maryland Cooperative Extension. 1990. “Structures for Broiler Litter Manure Storage.” Fact Sheet 416. http://extension.umd.edu/publications/pdfs/fs416.pdf.
32 According to Gang, communications manager for the U.S. Capitol Visitor Center, the volume of the Capitol dome is about 850,000 cubic feet. http://host.madison.com/wsj/news/local/article_442ebd8c-928d-5029-abc6-51cd964744c0.html.
33 Kellogg, R.L., et. al. 2000. Manure Nutrients Relative to the Capacity of Cropland and Pastureland to Assimilate Nutrients: Spatial and Temporal Trends for the United States. USDA Natural Resources Conservation Service and Economic Research Service. www.nrcs.usda.gov/technical/NRI/pubs/manntr.pdf.
34 Kellogg. Manure Nutrients. 35 Gollehon, Confined Animal Production and Manure Nutrients. 36 MacDonald, J.M., et al. 2009. Manure Use for Fertilizer and for Energy: Report to Congress. USDA Economic Research Service. www.ers.usda.gov/Pub-
lications/AP/AP037/AP037.pdf.37 Ribaudo. Manure Management for Water Quality.38 Unger, H. Nov. 24, 2002. “Polluting Chickens: Health Threat Grows From Tons of Manure.” Atlanta Journal-Constitution. 39 Frick, E.A., and G.R. Buell. 1999. “Relation of Land Use to Nutrient and Suspended-Sediment Concentrations, Loads and Yields in the Upper Chat-
tahoochee River Basin, Georgia, 1993-1998.” Proceedings of the 1999 Georgia Water Resources Conference. http://ga.water.usgs.gov/nawqa/publications/pdf/1999fricknbuell.pdf.
40 USDA Natural Resources Conservation Service. Jan. 11, 2011. “Illinois River Sub-Basin and Eucha-Spavinaw Lake Watershed Initiative.” www.ar.nrcs.usda.gov/programs/illinois_spavinaw_initiative.html.
41 Lassek, P.J. Dec. 10, 2001. “Lawsuit filed against poultry industry, Arkansas town.” Associated Press. 42 Fisher, J.B., et al. 2009. “The History of Poultry Waste Contamination in the Illinois River Watershed as Determined from Sediment Cores Collected
from Tenkiller Ferry Reservoir.” Proceedings of the 2009 International Symposium on Environmental Science and Technology. www.lithochim.com/docu-ments/ISEST01%20Paper.pdf. U.S. EPA. Watershed Central Wiki. 2006. City of Tulsa’s Comprehensive Watershed Management Approach. https://wiki.epa.gov/watershed2/index.php/City_of_Tulsa_Comprehensive_Watershed_Management_Approach. And U. S. Water News Online. 2001. “Study finds chicken waste will continue to pollute Tulsa taps.”
43 DeLaune, P.B., et al. 2006. “The Eucha/Spavinaw phosphorus index: A court mandated index for litter management.” Journal of Soil and Water Conser-vation 61(2). https://engineering.purdue.edu/~ichaubey/Pubs/PB%20DeLaune_ESPI.pdf.
44 Barnes, S. June 14, 2005. “Oklahoma: Lawsuit on Pollution From Poultry.” New York Times. 45 U.S. EPA, Chesapeake Bay Program. Health of Freshwater Streams in the Chesapeake Bay Watershed. www.chesapeakebay.net/status_streamhealth.
aspx?menuitem=50423.46 Chesapeake Bay Program. 2009. Bay Barometer: A health and restoration assessment of the Chesapeake Bay Watershed. www.chesapeakebay.net/con-
tent/publications/cbp_50513.pdf. 47 See, for example:
Chesapeake Bay Program. Bay Barometer. 48 U.S. EPA. May 12, 2010. Guidance for Federal Land Management in the Chesapeake Bay Watershed. www.epa.gov/nps/chesbay502/pdf/chesbay_guid-
ance-all.pdf.

27B iG Ch iCkEn
Pollution and Industrial Poultry Production in America
www.PewEnvironment.org
ENDNOTES
49 USDA Natural Resources Conservation Service. 2011. Assessment of the Effects of Conservation Practices on Cultivated Cropland in the Chesapeake Bay Region. www.nrcs.usda.gov/technical/nri/ceap/chesapeake_bay/index.html.
50 U.S. Geological Survey. 2011. Monitoring Water-Quality Changes in the Chesapeake Bay Watershed. http://chesapeake.usgs.gov/featuremoni-toringwaterqualitychanges.html. And Blankenship, K. 2010. “New USGS method improves ability to track nutrients flowing into Bay: Streamflow monitoring reveals unsettling data about effectiveness of actions taken on the land.”Chesapeake Bay Journal. www.bayjournal.com/newsite/article.cfm?article=3950.
51 Katz, B.G., et al. 1999. Sources and Chronology of Nitrate Contamination in Spring Waters, Suwannee River Basin, Florida. USGS. Water-Resources Investigation Report 99-4252. http://fl.water.usgs.gov/PDF_files/wri99_4252_katz.pdf. Katz, B.G., and R. S. DeHan. The Suwannee River Basin Pilot Study: Issues for Watershed Management in Florida. USGS Fact Sheet FS-080-96. http://pubs.usgs.gov/fs/FS-080-96/FS-080-96.pdf. And Woods, C. 2001. “Florida research targets rising nitrates in Suwannee River Basin.” Southeast Farms Press. http://southeastfarmpress.com/florida-research-targets-rising-nitrates-suwannee-river-basin.
52 See, for example, “NOW” with Bill Moyers. Dec. 20, 2002, Science and Health: Troubled Waters—A Brief History of the Clean Water Act. www.pbs.org/now/science/cleanwater.html.
53 See for example:
Houck, O.A. 2002. The Clean Water Act TMDL Program: Law, Policy and Implementation.
Powers, A. “The Current Controversy Regarding TMLDS: Contemporary Perspectives; ‘TMDLS and Pollutant Trading’ ” (2003). Pace Law Faculty Publi-cations. Paper 193. http://digitalcommons.pace.edu/lawfaculty/193.
Boyd, J. 2000. The New Face of the Clean Water Act: A Critical Review of the EPA’s Proposed TMDL Rules. Discussion Paper 00-12. Resources for the Future. www.rff.org/documents/RFF-DP-00-12.pdf.
Birkeland, S. 2001. “EPA’s TMDL Program.” Ecology Law Quarterly 28(2). www.nationalaglawcenter.org/assets/bibarticles/birkeland_tmdl.pdf.
Murchison, K.M. 2005. “Learning From More Than Five-and-a-Half Decades of Federal Water Pollution Control Legislation: Twenty Lessons for the Future.” 32 B.C. s 527. http://lawdigitalcommons.bc.edu/ealr/vol32/iss3/4.
54 Urgent Call to Action. 55 Government Accountability Office. 2008. Concentrated Animal Feeding Operations: EPA Needs More Information and a Clearly Defined Strategy to Pro-
tect Air and Water Quality from Pollutants of Concern. GAO-08-944. www.gao.gov/new.items/d08944.pdf.56 Waterkeeper Alliance Inc. et al. v. Environmental Protection Agency. 399 F.3d 486 (2d Cir. 2005) and National Pork Producers Council et al. v. Environ-
mental Protection Agency, No. 08-61093 (5th Cir. Mar. 15, 2011).57 Pelletier et al. Virginia Poultry Litter Transportation.58 Virginia Department of Conservation and Recreation. November 2010. Report to the Governor and the General Assembly of Virginia on the Virginia
Water Quality Improvement Fund and the Cooperative Nonpoint Source Pollution Program. http://leg2.state.va.us/dls/h&sdocs.nsf/fc86c2b17a1cf388852570f9006f1299/417b54be6be72ac5852575c9006adfd2/$FILE/RD322.pdf.
59 “Maryland’s Manure Transport Program. Maryland Department of Agriculture, Office of Resource Conservation. Undated. www.mda.state.md.us/pdf/manuretransport.pdf.
60 Agriculture Cost Share program’s 2009 annual report. www.mda.state.md.us/pdf/macsar09.pdf.61 Delaware Nutrient Management Commission’s 2009 report. http://dda.delaware.gov/nutrients/forms/2009/2009_NM_AR.pdf.62 “Poultry waste suspected as catalyst for killer microorganism.” Aug. 10, 1997. Associated Press.63 Maryland Department of Agriculture. “Nutrient Management.” Undated. www.mda.state.md.us/resource_conservation/nutrient_management/index.php. 64 Maryland Department of Agriculture. Maryland Nutrient Management Program: 2010 Annual Report. http://www.mda.state.md.us/pdf/nmar10.pdf. 65 “Nutrient management program enters mandatory compliance phase.” Associated Press. July 15, 2002. 66 Urgent Call to Action.67 USDA. Natural Resources Conservation Service. 2011. Assessment of the Effects of Conservation Practices on Cultivated Cropland in the Chesapeake
Bay Region. www.nrcs.usda.gov/technical/nri/ceap/chesapeake_bay/CB_summary.pdf
28B iG Ch iCkEn
Pollution and Industrial Poultry Production in America
The Pew Environment Group
• Concentrated animal feeding operations (CAFOs) are a small subset of AFOs, with distinctions based primarily on size and pollution discharges. Only CAFOs are subject to regulation as point sources under the Clean Water Act.
• A broiler operation is considered large, and therefore regulated as a CAFO, if it has a capacity of 30,000 birds or more and uses liquid manure management, or if it has a capacity of 125,000 birds or more and uses dry manure management. Medium-size facilities may be regulated as CAFOs depending upon their design, operation and management. Smaller facilities are regulated on a case-by-case basis if regulators determine that a pollution problem exists.
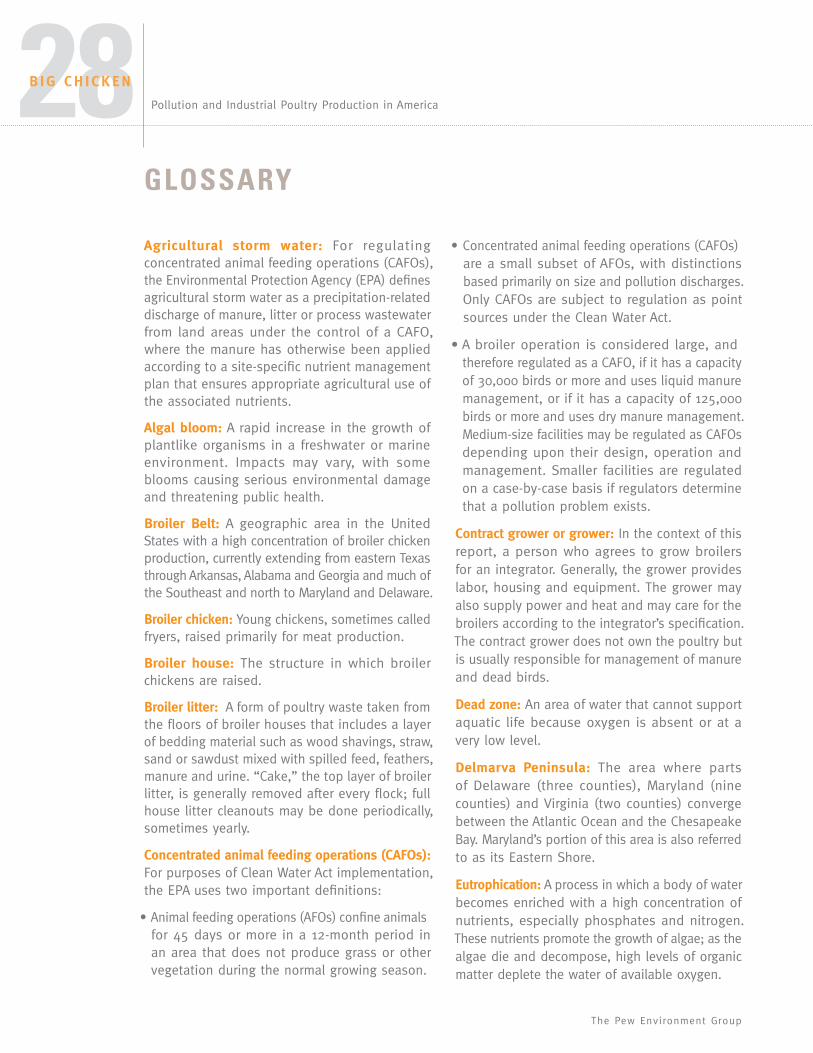
Contract grower or grower: In the context of this report, a person who agrees to grow broilers for an integrator. Generally, the grower provides labor, housing and equipment. The grower may also supply power and heat and may care for the broilers according to the integrator’s specification. The contract grower does not own the poultry but is usually responsible for management of manure and dead birds.
Dead zone: An area of water that cannot support aquatic life because oxygen is absent or at a very low level.
Delmarva Peninsula: The area where parts of Delaware (three counties), Maryland (nine counties) and Virginia (two counties) converge between the Atlantic Ocean and the Chesapeake Bay. Maryland’s portion of this area is also referred to as its Eastern Shore.
Eutrophication: A process in which a body of water becomes enriched with a high concentration of nutrients, especially phosphates and nitrogen. These nutrients promote the growth of algae; as the algae die and decompose, high levels of organic matter deplete the water of available oxygen.
Agricultural storm water: For regulating concentrated animal feeding operations (CAFOs), the Environmental Protection Agency (EPA) defines agricultural storm water as a precipitation-related discharge of manure, litter or process wastewater from land areas under the control of a CAFO, where the manure has otherwise been applied according to a site-specific nutrient management plan that ensures appropriate agricultural use of the associated nutrients.
Algal bloom: A rapid increase in the growth of plantlike organisms in a freshwater or marine environment. Impacts may vary, with some blooms causing serious environmental damage and threatening public health.
Broiler Belt: A geographic area in the United States with a high concentration of broiler chicken production, currently extending from eastern Texas through Arkansas, Alabama and Georgia and much of the Southeast and north to Maryland and Delaware.
Broiler chicken: Young chickens, sometimes called fryers, raised primarily for meat production.
Broiler house: The structure in which broiler chickens are raised.
Broiler litter: A form of poultry waste taken from the floors of broiler houses that includes a layer of bedding material such as wood shavings, straw, sand or sawdust mixed with spilled feed, feathers, manure and urine. “Cake,” the top layer of broiler litter, is generally removed after every flock; full house litter cleanouts may be done periodically, sometimes yearly.
Concentrated animal feeding operations (CAFOs): For purposes of Clean Water Act implementation, the EPA uses two important definitions:
• Animal feeding operations (AFOs) confine animals for 45 days or more in a 12-month period in an area that does not produce grass or other vegetation during the normal growing season.
GLOSSARY
29B iG Ch iCkEn
Pollution and Industrial Poultry Production in America
www.PewEnvironment.org
nPDES permits: Permits issued according to EPA’s National Pollutant Discharge Elimination System (NPDES) program, which was authorized by the Clean Water Act and prohibits the discharge of point source pollution into U.S. waters except in compliance with a special permit issued by EPA, a state or a tribal government.
Phosphorus: An element essential for biological life and critical to plant growth. Found in the earth, water and all living organisms, phosphorus cycles through the environment and in excess amounts can cause eutrophication in freshwater and marine environments.
Point source pollution: Under the Clean Water Act, pollution from any confined and discrete conveyance, such as a pipe, ditch, well, CAFO or vessel, from which pollutants are or may be discharged. The term does not include agricultural stormwater discharges and return flows from irrigated agriculture.
Poultry: In the context of this report, broiler chickens.
Processor: A business that manages and operates a plant that slaughters and eviscerates poultry and often performs other functions of production, processing and marketing.
Vertical integration: �In the context of this report, coordination or ownership by a single entity of production, processing, marketing and distribution. In broiler production, it involves contracting for “grow-out” services to raise flocks of chicks to processing weight. Many poultry companies are vertically integrated across the full range of broiler production phases and own breeder flocks, hatcheries, feed mills and processing plants. Ancillary services such as building and equipment supplies, transportation, fuel and financing may also be affiliated with the operation.
Geographic concentration: In the context of this report, the location and number of broiler growing operations and related facilities, such as breeding operations, feed mills and processing plants, within a geographic area.
Groundwater: The water below the earth’s surface that is found within the pore spaces and cracks between particles of soil, sand, gravel and bedrock.
Grower: See contract grower.
integrator: Commonly refers to the poultry-processing companies that have financial interests and decision-making power over multiple phases of the poultry production process. See vertical integration.
nitrates and nitrites: Nitrogen-oxygen molecules that nitrogen can create in water. High levels of nitrates in drinking water can pose a serious threat to the health of humans, particularly infants. See also nitrogen.
nitrogen: A nonmetallic element that is essential to life and moves through the environment in a complex cycle, transforming into a number of chemical forms, including organic nitrogen, ammonium, nitrite, nitrate and nitrogen gas. Nitrogen is critical to plant growth, but excess nitrogen in water can contribute to algal blooms, unhealthy levels of nitrates in drinking water and other water-quality problems.
non-point source pollution: Under the Clean Water Act, water pollution that originates from diffuse sources. Non-point source pollution is often caused when rain or snow-fed runoff picks up natural and human-made pollutants (including those from agricultural activities) and deposits them in lakes, rivers, wetlands, coastal waters and groundwater.
GLOSSARY

Philadelphia, Pa. 19103 Washington, D.C. 20004
215-575-9050 202-552-2000 www.PewEnvironment.org