bicuspid aortic valve aortopathies: an hemodynamics...
TRANSCRIPT
Full Terms & Conditions of access and use can be found athttps://www.tandfonline.com/action/journalInformation?journalCode=gcmb20
Computer Methods in Biomechanics and BiomedicalEngineering
ISSN: 1025-5842 (Print) 1476-8259 (Online) Journal homepage: https://www.tandfonline.com/loi/gcmb20
Bicuspid aortic valve aortopathies: Anhemodynamics characterization in dilated aortas
Diana Oliveira, Sílvia Aguiar Rosa, Jorge Tiago, Rui Cruz Ferreira, AnaFigueiredo Agapito & Adélia Sequeira
To cite this article: Diana Oliveira, Sílvia Aguiar Rosa, Jorge Tiago, Rui Cruz Ferreira, AnaFigueiredo Agapito & Adélia Sequeira (2019): Bicuspid aortic valve aortopathies: An hemodynamicscharacterization in dilated aortas, Computer Methods in Biomechanics and Biomedical Engineering,DOI: 10.1080/10255842.2019.1597860
To link to this article: https://doi.org/10.1080/10255842.2019.1597860
Published online: 08 Apr 2019.
Submit your article to this journal
Article views: 6
View Crossmark data
Bicuspid aortic valve aortopathies: An hemodynamics characterization indilated aortas
Diana Oliveiraa , S�ılvia Aguiar Rosab, Jorge Tiagoa, Rui Cruz Ferreirab, Ana Figueiredo Agapitob andAd�elia Sequeiraa
aDepartment of Mathematics and CEMAT, Instituto Superior T�ecnico, University of Lisbon, Lisbon, Portugal; bCardiology Department,Hospital de Santa Marta (CHLC), Lisboa, Portugal
ABSTRACTBicuspid aortic valve (BAV) aortopathy remains of difficult clinical management due to its het-erogeneity and further assessment of related aortic hemodynamics is necessary. The aim of thisstudy was to assess systolic hemodynamic indexes and wall stresses in patients with diverseBAV phenotypes and dilated ascending aortas. The aortic geometry was reconstructed frompatient-specific images while the aortic valve was generated based on patient-specific measure-ments. Physiologic material properties and boundary conditions were applied and fully coupledfluid-structure interaction (FSI) analysis were conducted. Our dilated aortic models were charac-terized by the presence of abnormal hemodynamics with elevated degrees of flow skewnessand eccentricity, regardless of BAV morphotype. Retrograde flow was also present. Both features,predicted by flow angle and flow reversal ratios, were consistently higher than those reportedfor non-dilated aortas. Right-handed helical flow was present, as well as elevated wall shearstress (WSS) on the outer ascending aortic wall. Our results suggest that the abnormal flowassociated with BAV may play a role in aortic enlargement and progress it further on alreadydilated aortas.
ARTICLE HISTORYReceived 31 May 2018Accepted 18 March 2019
KEYWORDSaortic dilation; aorthopathy;bicuspid aortic valve; fluid-structure interaction
1. Introduction
Bicuspid aortic valve (BAV) is the most commonform of congenital heart disease, affecting 0.5% to1.4% of the population (Guntheroth 2008). It hashigh phenotypic heterogeneity (Kang et al. 2013),associated with valvular pathologies (stenosis, regurgi-tation), and with the development of ascending aorticdilation (Corte et al. 2006, 2007). The reported preva-lence of dilation in these patients ranges from about30 to 80% in the adult BAV population (Corte et al.2007). Pathogenesis of aortic dilation in these patientsis still controversial: the genetic basis supports thepresence of a congenital defect in the aortic structure,which is backed by histopathological studies showingdegeneration of the media layer of the ascending aor-tic wall (Grewa et al. 2014). The hemodynamic theoryargues that the abnormal BAV dynamics causes per-turbations on blood flow patterns and hemodynamicstress on the aortic wall, leading to aortic dilation(Mahadevia et al. 2014). According to current know-ledge, the high heterogeneous expression of BAVaortopathy suggests that both genetic and hemo-dynamic factors coexist - a genetic predisposition in
these patients may weaken the aortic wall, conferringit with susceptibility for dilation, and the presence ofaltered hemodynamic might act as a triggering andmaintaining factor of that dilation (Padanget al. 2013).
According to this, research studies have tried tounderline mechanisms associated with dilation onsetand progression in the presence of a BAV.Computational works have provided further insighton the hemodynamic aspects of ascending aorticblood flow in this disease: flow eccentricity, skewness,helical patterns and abnormally elevated wall shearstress (WSS) have been reported by computational(Cao et al. 2017; Bonomi et al. 2015; Kimura et al.2017) and in vivo studies (Mahadevia et al. 2014;Rodriguez-Palomares et al. 2018). Nonetheless, furtherhemodynamics characterization of blood patterns inthe ascending aorta in cases of dilation is necessary.4D flow MRI studies are extensively used to assessaortic hemodynamics in BAV patients (Mahadeviaet al. 2014; Rodriguez-Palomares et al. 2018; Hopeet al. 2010). However, this imaging modality is unableto evaluate accurately and noninvasively relevant
CONTACT Diana Oliveira [email protected]� 2019 Informa UK Limited, trading as Taylor & Francis Group
COMPUTER METHODS IN BIOMECHANICS AND BIOMEDICAL ENGINEERINGhttps://doi.org/10.1080/10255842.2019.1597860
hemodynamic predictors such as WSS, due to lowtemporal and spatial resolutions (Markl et al. 2011).Thus, computational modelling becomes advantageousin this matter, providing with several hemodynamicindexes that can further describe the abnormal aortichemodynamics present in BAV patients.
The purpose of this study is to assess ascendingaortic hemodynamics in patients with dilated aortasand different BAV phenotypes. We propose a three-dimensional morphologic modelling of bicuspid aor-topathies that employs patient-specific aortic geome-tries and measurements for the geometricreconstruction of the valve leaflets. Then, we charac-terize aortic hemodynamics by computing indicesanalysing jet asymmetry, flow reversal, helicity andwall shear stress distributions.
2. Methods
2.1. Data acquisition and model generation
Three patient-specific non-calcified and non-regurgi-tant BAV cases were considered: two cusps without araphe (BAV 0), right-left fusion (BAV R-L) and right-non-coronary fusion (BAV R-NC), characterized byaortic dilation (aortic diameter > 40mm). Patientsunderwent computed tomography angiography of thethoracic aorta, scanned on a 64-slice multislice (slicethickness ¼ 1.25mm) computed tomography scanner(LightSpeed VCT XT, GE Healthcare, Milwaukee,USA). The contrast-enhanced scan was obtained usingVisipaqueTM (iodixanol) injected using automatedpump injectors through a peripheral vein followed bysaline bolus chase, in accordance with patient’sweight. Three-dimensional surface models of the aor-tic root (including aortic sinuses), ascending aortaand aortic arch were then created from these imagesthrough manual segmentation (3D-Slicer v.4.8.0).
An open-source tool (LifeVFSIMeshGeneration)was used to generate the aortic wall and a thicknessproportional to the radius of the lumen was employed(Faggiano et al. 2013a). This tool turns the dimensionof local triangular mesh elements proportional to thelocal lumen radius. This is computed by couplinginformation about the local distance between theinterface surface and the vessel centerlines and thelocal maximum inscribed sphere radius: this processyields adequate mesh refinement. The mathematicalformula employed for radius dependent meshing is
h ¼ a � rb; (1)
where h is the aortic wall thickness, r is the lumenlocal radius and a and b are fitting parameters.Literature values of wall thickness and lumen diam-eter were used to estimate a and b. A two-systemequation with wall thicknesses of 1.63mm and0.22mm corresponding to lumen diameters of 29mmand 3mm, respectively, was created using the equa-tion above, and fitting parameters were obtained(Reymond et al. 2012; Avolio 1980).
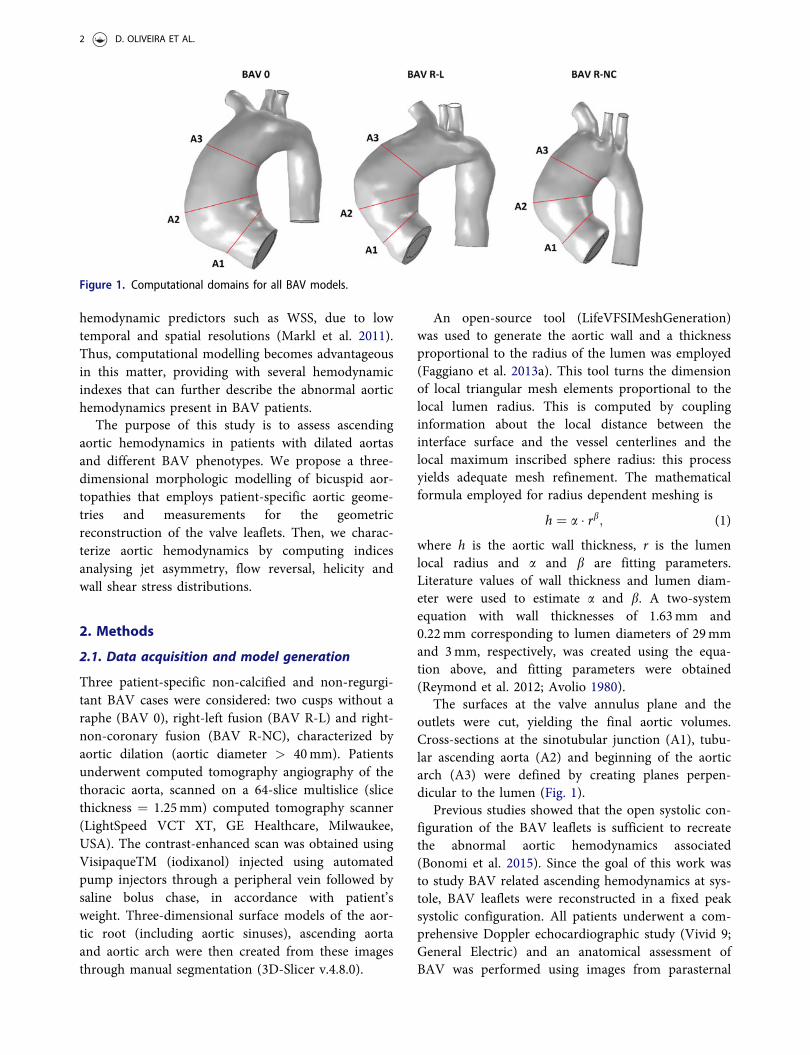
The surfaces at the valve annulus plane and theoutlets were cut, yielding the final aortic volumes.Cross-sections at the sinotubular junction (A1), tubu-lar ascending aorta (A2) and beginning of the aorticarch (A3) were defined by creating planes perpen-dicular to the lumen (Fig. 1).
Previous studies showed that the open systolic con-figuration of the BAV leaflets is sufficient to recreatethe abnormal aortic hemodynamics associated(Bonomi et al. 2015). Since the goal of this work wasto study BAV related ascending hemodynamics at sys-tole, BAV leaflets were reconstructed in a fixed peaksystolic configuration. All patients underwent a com-prehensive Doppler echocardiographic study (Vivid 9;General Electric) and an anatomical assessment ofBAV was performed using images from parasternal
Figure 1. Computational domains for all BAV models.
2 D. OLIVEIRA ET AL.
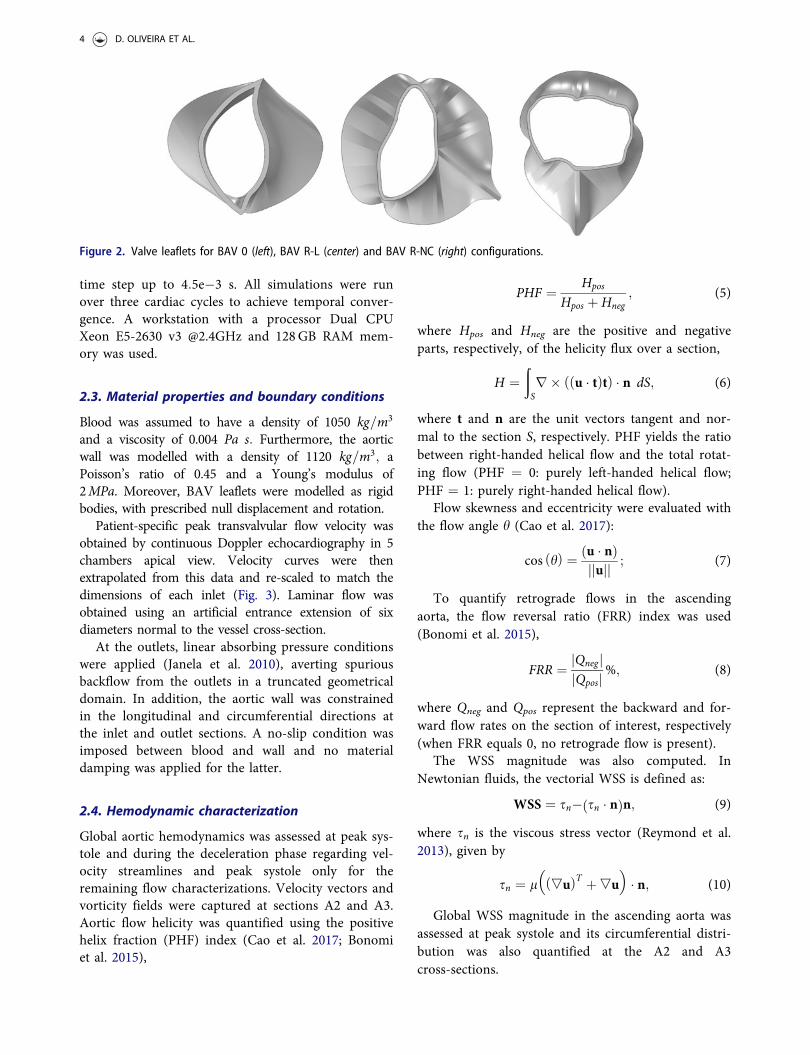
long and short axis views. Valve measurements werethen retrieved (Table 1). Characteristics impossible toobserve in these images (e.g. shape of the raphe) wereretrieved from previous computational works (Caoet al. 2016a, 2017), including the use of uniformthickness of 0.5mm for all configurations. Leafletswere created using SOLIDWORKS 2016 (DassaultSystemes, Inc, Velizy-Villacoublay, France) (Fig. 2).BAV configurations were then matched to therespective aortic volumes. Their position was adjustedthrough careful observation of angiographic and echo-cardiographic images.
2.2. Fluid-structure interaction framework andgrid settings
The wall deformation of the aorta under the action ofthe pulsatile blood flow has been pointed as crucial incomputational models, due to the compliant proper-ties of this structure (Azadani et al. 2012). In fact,computational results obtained by FSI and computa-tional fluid dynamics analysis may differ, as shown in(Mendez et al. 2018), where distinct stress distribu-tions and mean pressure values were emphasized.Therefore, it is important to have into account thedeformation of the ascending aortic wall when model-ling its hemodynamics.
A FSI framework was then adopted to model theinteraction between blood and the aortic wall. FSImodels using the Arbitrary Lagrangian-Eulerian(ALE) formulation (Fernandez et al. 2009) wereimplemented in COMSOL Multiphysics 5.0.
Blood was approximated as an incompressible,homogeneous and Newtonian fluid (Parker andThiriet 2009), modelled with the Navier-Stokes equa-tions for mass conservation (eq. 2) and linearmomentum (eq. 3).
� � u ¼ 0; (2)
qdudt
þ u�ð Þu� �
þ�P� lD uð Þð Þ ¼ f ; (3)
where u is the velocity vector, q is the blood density,P is the pressure, l is the dynamic blood viscosity, f
accounts for the action of external forces and D(u) isthe strain rate.
Following the work of other authors ((Cao et al.2016a; Atkins et al. 2014; Lantz et al. 2011)), the aor-tic wall was modelled as an isotropic, linear and elas-tic material, characterized by the linear elasticequation (eq. 4),
qsdg2
dt2�� � rð Þ ¼ 0; (4)
where qs is the constant density of the wall, g is thewall displacement vector and r is the Cauchy stressvector. Two coupling conditions were also consideredat the blood-wall interface, ensuring continuity ofvelocities and traction forces.
The aortic model was meshed with tetrahedral ele-ments. To improve numerical accuracy while mini-mizing the computational cost, a coarser grid wasused for the structure domain and a finer grid wascreated at the fluid domain. A structured hexahedralmesh was used for boundary layers in the fluid nearthe FSI interface. A mesh sensitivity analysis was per-formed. This consisted of measuring the relativeerrors (computed using the H1ðXÞ semi-norm andthe L2ðXÞ norm, where X represents the computa-tional domain) between approximate velocity solu-tions obtained under increasing mesh density, and thesolution obtained with the finest mesh. Mesh refine-ment was achieved by progressively decreasing elem-ent size. A suitable window of values appeared afterone million degrees of freedom (DOF) for the fluiddomain (L2ðXÞ<3%; H1ðXÞ semi-norm between 10%and 15%). The final computational grid yielded onemillion DOF for the fluid domain and an averagespatial resolution of 0.0009m and 0.0013m for thefluid and solid domains, respectively. No remeshingmethods were employed, but hyperelastic smoothingof the deformed mesh was applied.
A finite element discretization based on stabilizedP1þ P1 (Bazilevs et al. 2007) and P2 elements for thefluid and structure domains, respectively, wasemployed. A fully-coupled (nonlithic) approach wasused to solve fluid and solid equations. Each non-lin-ear iteration was tackled with the undamped Newton-Raphson method, with a Jacobian update at each timestep and a relative tolerance of 0.01. Linear iterationswere solved with the direct solver PARDISO (www.pardiso-project.org), used for solving large sparseequations. As to LU factorization, the matrix preor-dering algorithm Nested Dissection Multithreadedwas used (Petra et al. 2014). Time discretization washandled with a BDF solver (Hindmarsh et al. 2005)using an adaptative order (up to two) and an adaptive
Table 1. Patient-specific measurements retrieved from echo-cardiographic images.
BAV type
Dimensions
orificearea [mm]
ring diameter[mm]
raphelength [mm]
leafletheight [mm]
BAV 0 160 26.75 – 12.37BAV R-L 120 25.45 11.79 13BAV R-NC 240 26.76 13.08 11.32
COMPUTER METHODS IN BIOMECHANICS AND BIOMEDICAL ENGINEERING 3
time step up to 4:5e�3 s. All simulations were runover three cardiac cycles to achieve temporal conver-gence. A workstation with a processor Dual CPUXeon E5-2630 v3 @2.4GHz and 128GB RAM mem-ory was used.
2.3. Material properties and boundary conditions
Blood was assumed to have a density of 1050 kg=m3
and a viscosity of 0.004 Pa s: Furthermore, the aorticwall was modelled with a density of 1120 kg=m3; aPoisson’s ratio of 0.45 and a Young’s modulus of2MPa. Moreover, BAV leaflets were modelled as rigidbodies, with prescribed null displacement and rotation.
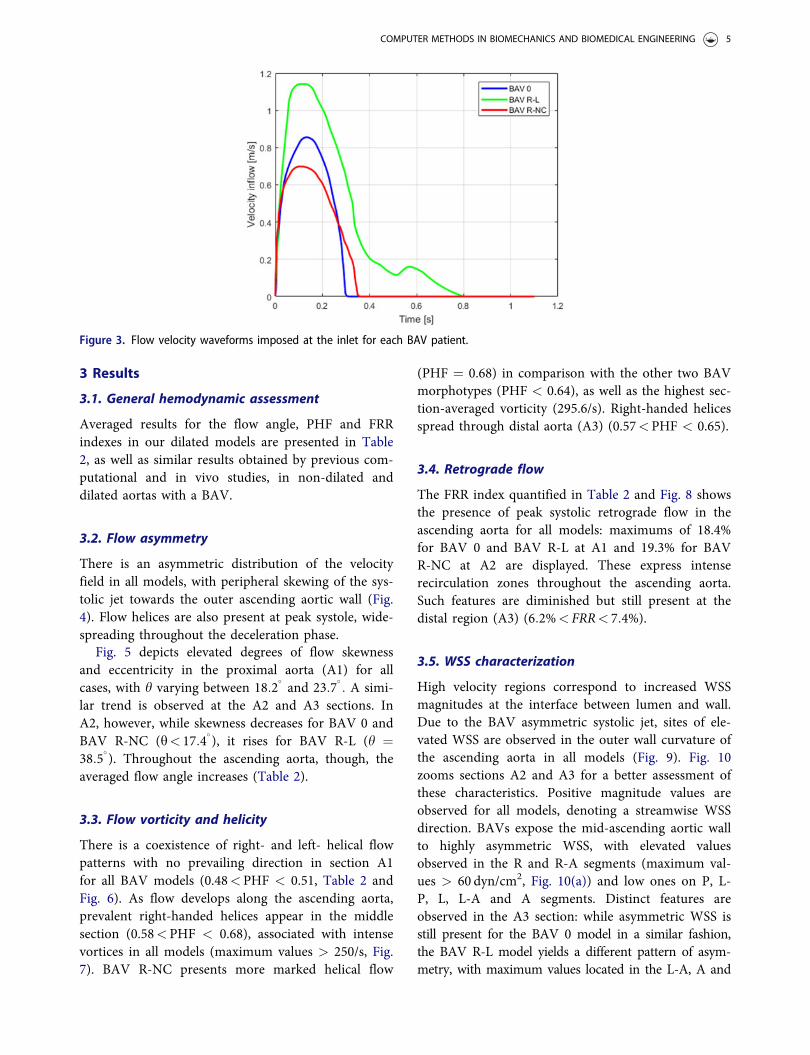
Patient-specific peak transvalvular flow velocity wasobtained by continuous Doppler echocardiography in 5chambers apical view. Velocity curves were thenextrapolated from this data and re-scaled to match thedimensions of each inlet (Fig. 3). Laminar flow wasobtained using an artificial entrance extension of sixdiameters normal to the vessel cross-section.
At the outlets, linear absorbing pressure conditionswere applied (Janela et al. 2010), averting spuriousbackflow from the outlets in a truncated geometricaldomain. In addition, the aortic wall was constrainedin the longitudinal and circumferential directions atthe inlet and outlet sections. A no-slip condition wasimposed between blood and wall and no materialdamping was applied for the latter.
2.4. Hemodynamic characterization
Global aortic hemodynamics was assessed at peak sys-tole and during the deceleration phase regarding vel-ocity streamlines and peak systole only for theremaining flow characterizations. Velocity vectors andvorticity fields were captured at sections A2 and A3.Aortic flow helicity was quantified using the positivehelix fraction (PHF) index (Cao et al. 2017; Bonomiet al. 2015),
PHF ¼ Hpos
Hpos þ Hneg; (5)
where Hpos and Hneg are the positive and negativeparts, respectively, of the helicity flux over a section,
H ¼ðSr� u � tð Þtð Þ � n dS; (6)
where t and n are the unit vectors tangent and nor-mal to the section S, respectively. PHF yields the ratiobetween right-handed helical flow and the total rotat-ing flow (PHF ¼ 0: purely left-handed helical flow;PHF ¼ 1: purely right-handed helical flow).
Flow skewness and eccentricity were evaluated withthe flow angle h (Cao et al. 2017):
cos hð Þ ¼ u � nð Þjjujj ; (7)
To quantify retrograde flows in the ascendingaorta, the flow reversal ratio (FRR) index was used(Bonomi et al. 2015),
FRR ¼ jQneg jjQposj%; (8)
where Qneg and Qpos represent the backward and for-ward flow rates on the section of interest, respectively(when FRR equals 0, no retrograde flow is present).
The WSS magnitude was also computed. InNewtonian fluids, the vectorial WSS is defined as:
WSS ¼ sn� sn � nð Þn; (9)
where sn is the viscous stress vector (Reymond et al.2013), given by
sn ¼ l �uð ÞT þ�u� �
� n; (10)
Global WSS magnitude in the ascending aorta wasassessed at peak systole and its circumferential distri-bution was also quantified at the A2 and A3cross-sections.
Figure 2. Valve leaflets for BAV 0 (left), BAV R-L (center) and BAV R-NC (right) configurations.
4 D. OLIVEIRA ET AL.
3 Results
3.1. General hemodynamic assessment
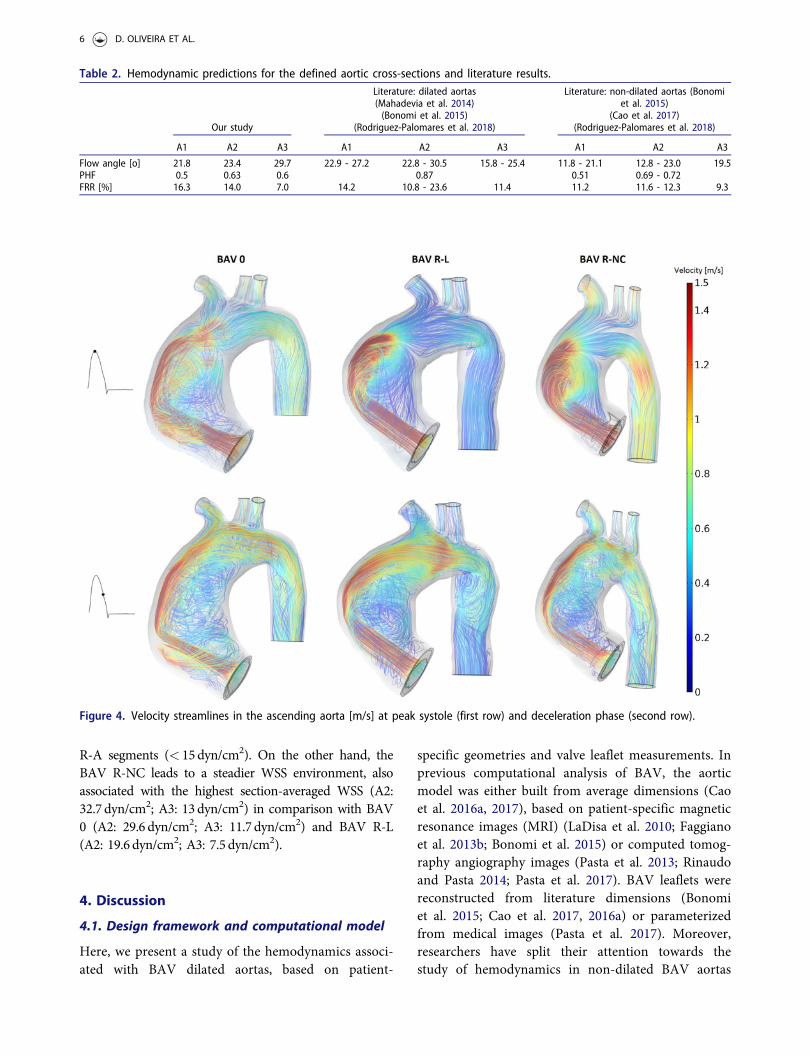
Averaged results for the flow angle, PHF and FRRindexes in our dilated models are presented in Table2, as well as similar results obtained by previous com-putational and in vivo studies, in non-dilated anddilated aortas with a BAV.
3.2. Flow asymmetry
There is an asymmetric distribution of the velocityfield in all models, with peripheral skewing of the sys-tolic jet towards the outer ascending aortic wall (Fig.4). Flow helices are also present at peak systole, wide-spreading throughout the deceleration phase.
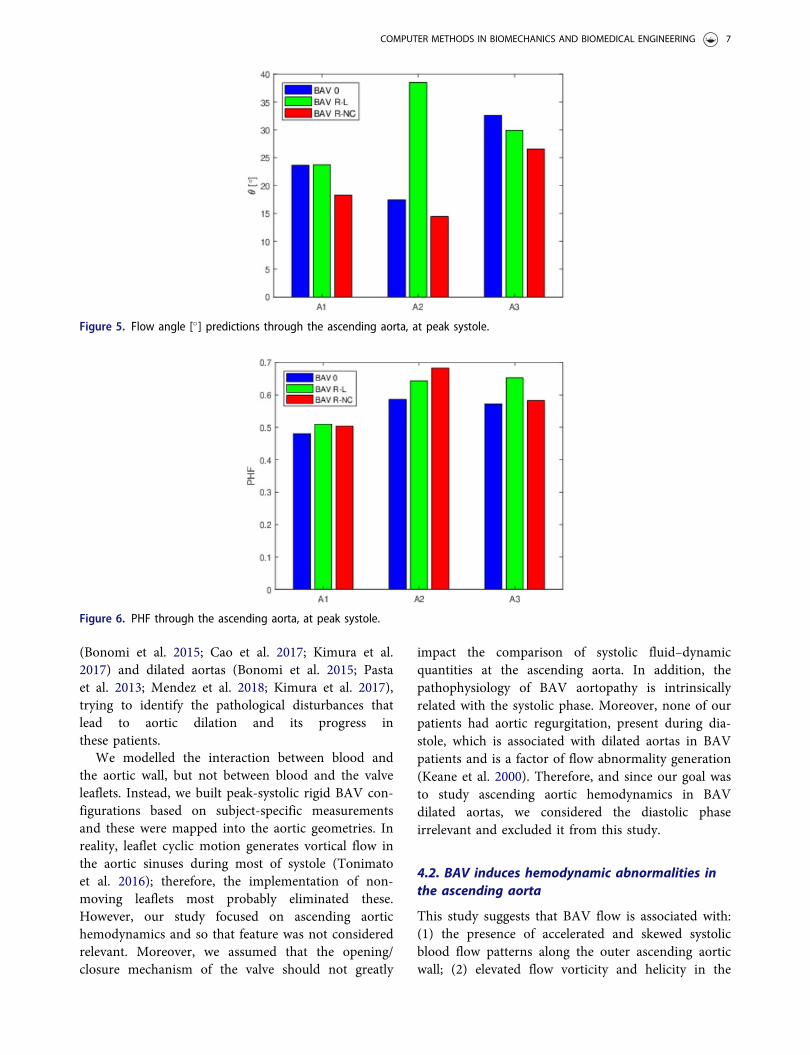
Fig. 5 depicts elevated degrees of flow skewnessand eccentricity in the proximal aorta (A1) for allcases, with h varying between 18:2
�and 23:7
�: A simi-
lar trend is observed at the A2 and A3 sections. InA2, however, while skewness decreases for BAV 0 andBAV R-NC (h< 17:4
�), it rises for BAV R-L (h ¼
38:5�). Throughout the ascending aorta, though, the
averaged flow angle increases (Table 2).
3.3. Flow vorticity and helicity
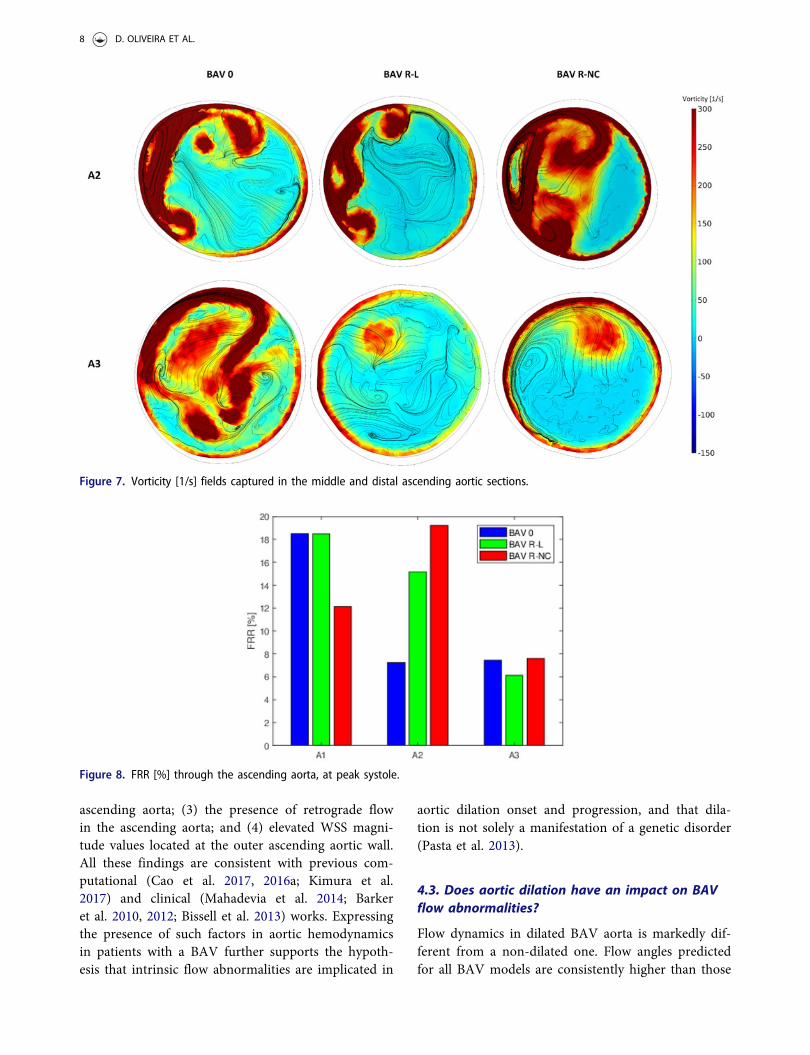
There is a coexistence of right- and left- helical flowpatterns with no prevailing direction in section A1for all BAV models (0.48<PHF < 0.51, Table 2 andFig. 6). As flow develops along the ascending aorta,prevalent right-handed helices appear in the middlesection (0.58<PHF < 0.68), associated with intensevortices in all models (maximum values > 250/s, Fig.7). BAV R-NC presents more marked helical flow
(PHF ¼ 0.68) in comparison with the other two BAVmorphotypes (PHF < 0.64), as well as the highest sec-tion-averaged vorticity (295.6/s). Right-handed helicesspread through distal aorta (A3) (0.57<PHF < 0.65).
3.4. Retrograde flow
The FRR index quantified in Table 2 and Fig. 8 showsthe presence of peak systolic retrograde flow in theascending aorta for all models: maximums of 18.4%for BAV 0 and BAV R-L at A1 and 19.3% for BAVR-NC at A2 are displayed. These express intenserecirculation zones throughout the ascending aorta.Such features are diminished but still present at thedistal region (A3) (6:2%< FRR< 7:4%).
3.5. WSS characterization
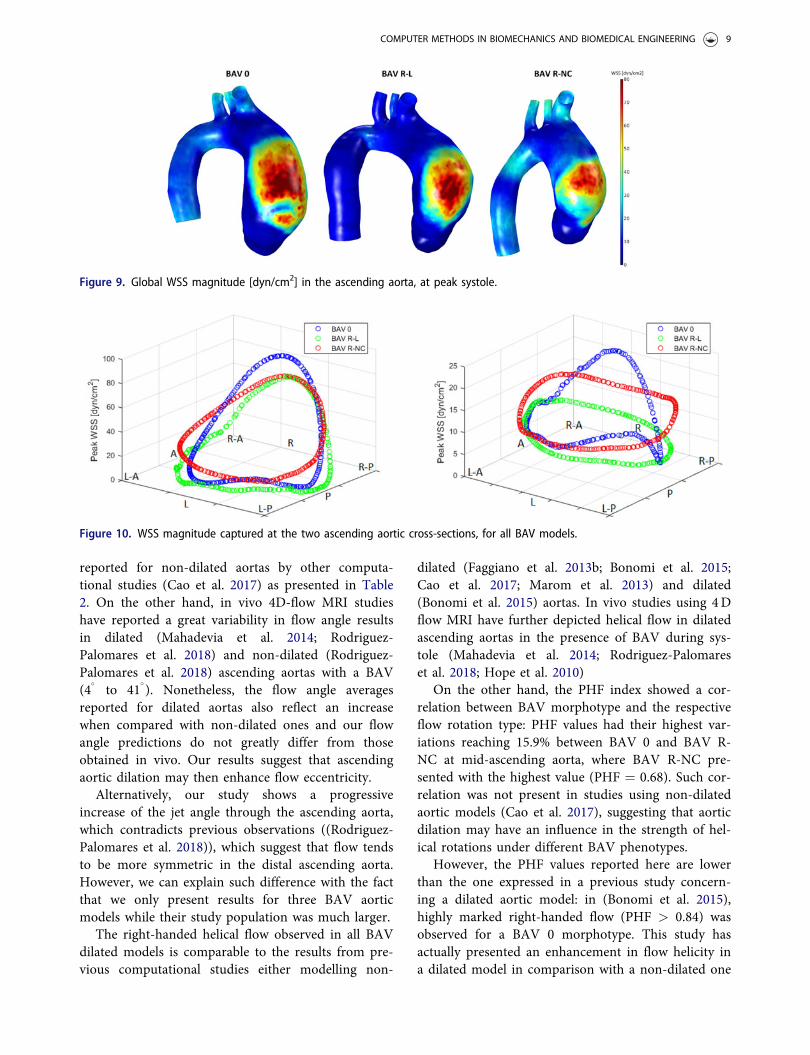
High velocity regions correspond to increased WSSmagnitudes at the interface between lumen and wall.Due to the BAV asymmetric systolic jet, sites of ele-vated WSS are observed in the outer wall curvature ofthe ascending aorta in all models (Fig. 9). Fig. 10zooms sections A2 and A3 for a better assessment ofthese characteristics. Positive magnitude values areobserved for all models, denoting a streamwise WSSdirection. BAVs expose the mid-ascending aortic wallto highly asymmetric WSS, with elevated valuesobserved in the R and R-A segments (maximum val-ues > 60 dyn/cm2, Fig. 10(a)) and low ones on P, L-P, L, L-A and A segments. Distinct features areobserved in the A3 section: while asymmetric WSS isstill present for the BAV 0 model in a similar fashion,the BAV R-L model yields a different pattern of asym-metry, with maximum values located in the L-A, A and
Figure 3. Flow velocity waveforms imposed at the inlet for each BAV patient.
COMPUTER METHODS IN BIOMECHANICS AND BIOMEDICAL ENGINEERING 5
R-A segments (< 15dyn/cm2). On the other hand, theBAV R-NC leads to a steadier WSS environment, alsoassociated with the highest section-averaged WSS (A2:32.7 dyn/cm2; A3: 13dyn/cm2) in comparison with BAV0 (A2: 29.6 dyn/cm2; A3: 11.7 dyn/cm2) and BAV R-L(A2: 19.6 dyn/cm2; A3: 7.5 dyn/cm2).
4. Discussion
4.1. Design framework and computational model
Here, we present a study of the hemodynamics associ-ated with BAV dilated aortas, based on patient-
specific geometries and valve leaflet measurements. Inprevious computational analysis of BAV, the aorticmodel was either built from average dimensions (Caoet al. 2016a, 2017), based on patient-specific magneticresonance images (MRI) (LaDisa et al. 2010; Faggianoet al. 2013b; Bonomi et al. 2015) or computed tomog-raphy angiography images (Pasta et al. 2013; Rinaudoand Pasta 2014; Pasta et al. 2017). BAV leaflets werereconstructed from literature dimensions (Bonomiet al. 2015; Cao et al. 2017, 2016a) or parameterizedfrom medical images (Pasta et al. 2017). Moreover,researchers have split their attention towards thestudy of hemodynamics in non-dilated BAV aortas
Table 2. Hemodynamic predictions for the defined aortic cross-sections and literature results.
Our study
Literature: dilated aortas(Mahadevia et al. 2014)(Bonomi et al. 2015)
(Rodriguez-Palomares et al. 2018)
Literature: non-dilated aortas (Bonomiet al. 2015)
(Cao et al. 2017)(Rodriguez-Palomares et al. 2018)
A1 A2 A3 A1 A2 A3 A1 A2 A3
Flow angle [o] 21.8 23.4 29.7 22.9 - 27.2 22.8 - 30.5 15.8 - 25.4 11.8 - 21.1 12.8 - 23.0 19.5PHF 0.5 0.63 0.6 0.87 0.51 0.69 - 0.72FRR [%] 16.3 14.0 7.0 14.2 10.8 - 23.6 11.4 11.2 11.6 - 12.3 9.3
Figure 4. Velocity streamlines in the ascending aorta [m/s] at peak systole (first row) and deceleration phase (second row).
6 D. OLIVEIRA ET AL.
(Bonomi et al. 2015; Cao et al. 2017; Kimura et al.2017) and dilated aortas (Bonomi et al. 2015; Pastaet al. 2013; Mendez et al. 2018; Kimura et al. 2017),trying to identify the pathological disturbances thatlead to aortic dilation and its progress inthese patients.
We modelled the interaction between blood andthe aortic wall, but not between blood and the valveleaflets. Instead, we built peak-systolic rigid BAV con-figurations based on subject-specific measurementsand these were mapped into the aortic geometries. Inreality, leaflet cyclic motion generates vortical flow inthe aortic sinuses during most of systole (Tonimatoet al. 2016); therefore, the implementation of non-moving leaflets most probably eliminated these.However, our study focused on ascending aortichemodynamics and so that feature was not consideredrelevant. Moreover, we assumed that the opening/closure mechanism of the valve should not greatly
impact the comparison of systolic fluid–dynamicquantities at the ascending aorta. In addition, thepathophysiology of BAV aortopathy is intrinsicallyrelated with the systolic phase. Moreover, none of ourpatients had aortic regurgitation, present during dia-stole, which is associated with dilated aortas in BAVpatients and is a factor of flow abnormality generation(Keane et al. 2000). Therefore, and since our goal wasto study ascending aortic hemodynamics in BAVdilated aortas, we considered the diastolic phaseirrelevant and excluded it from this study.
4.2. BAV induces hemodynamic abnormalities inthe ascending aorta
This study suggests that BAV flow is associated with:(1) the presence of accelerated and skewed systolicblood flow patterns along the outer ascending aorticwall; (2) elevated flow vorticity and helicity in the
Figure 5. Flow angle [�] predictions through the ascending aorta, at peak systole.
Figure 6. PHF through the ascending aorta, at peak systole.
COMPUTER METHODS IN BIOMECHANICS AND BIOMEDICAL ENGINEERING 7
ascending aorta; (3) the presence of retrograde flowin the ascending aorta; and (4) elevated WSS magni-tude values located at the outer ascending aortic wall.All these findings are consistent with previous com-putational (Cao et al. 2017, 2016a; Kimura et al.2017) and clinical (Mahadevia et al. 2014; Barkeret al. 2010, 2012; Bissell et al. 2013) works. Expressingthe presence of such factors in aortic hemodynamicsin patients with a BAV further supports the hypoth-esis that intrinsic flow abnormalities are implicated in
aortic dilation onset and progression, and that dila-tion is not solely a manifestation of a genetic disorder(Pasta et al. 2013).
4.3. Does aortic dilation have an impact on BAVflow abnormalities?
Flow dynamics in dilated BAV aorta is markedly dif-ferent from a non-dilated one. Flow angles predictedfor all BAV models are consistently higher than those
Figure 7. Vorticity [1/s] fields captured in the middle and distal ascending aortic sections.
Figure 8. FRR [%] through the ascending aorta, at peak systole.
8 D. OLIVEIRA ET AL.
reported for non-dilated aortas by other computa-tional studies (Cao et al. 2017) as presented in Table2. On the other hand, in vivo 4D-flow MRI studieshave reported a great variability in flow angle resultsin dilated (Mahadevia et al. 2014; Rodriguez-Palomares et al. 2018) and non-dilated (Rodriguez-Palomares et al. 2018) ascending aortas with a BAV(4
�to 41
�). Nonetheless, the flow angle averages
reported for dilated aortas also reflect an increasewhen compared with non-dilated ones and our flowangle predictions do not greatly differ from thoseobtained in vivo. Our results suggest that ascendingaortic dilation may then enhance flow eccentricity.
Alternatively, our study shows a progressiveincrease of the jet angle through the ascending aorta,which contradicts previous observations ((Rodriguez-Palomares et al. 2018)), which suggest that flow tendsto be more symmetric in the distal ascending aorta.However, we can explain such difference with the factthat we only present results for three BAV aorticmodels while their study population was much larger.
The right-handed helical flow observed in all BAVdilated models is comparable to the results from pre-vious computational studies either modelling non-
dilated (Faggiano et al. 2013b; Bonomi et al. 2015;Cao et al. 2017; Marom et al. 2013) and dilated(Bonomi et al. 2015) aortas. In vivo studies using 4Dflow MRI have further depicted helical flow in dilatedascending aortas in the presence of BAV during sys-tole (Mahadevia et al. 2014; Rodriguez-Palomareset al. 2018; Hope et al. 2010)
On the other hand, the PHF index showed a cor-relation between BAV morphotype and the respectiveflow rotation type: PHF values had their highest var-iations reaching 15.9% between BAV 0 and BAV R-NC at mid-ascending aorta, where BAV R-NC pre-sented with the highest value (PHF ¼ 0.68). Such cor-relation was not present in studies using non-dilatedaortic models (Cao et al. 2017), suggesting that aorticdilation may have an influence in the strength of hel-ical rotations under different BAV phenotypes.
However, the PHF values reported here are lowerthan the one expressed in a previous study concern-ing a dilated aortic model: in (Bonomi et al. 2015),highly marked right-handed flow (PHF > 0.84) wasobserved for a BAV 0 morphotype. This study hasactually presented an enhancement in flow helicity ina dilated model in comparison with a non-dilated one
Figure 9. Global WSS magnitude [dyn/cm2] in the ascending aorta, at peak systole.
Figure 10. WSS magnitude captured at the two ascending aortic cross-sections, for all BAV models.
COMPUTER METHODS IN BIOMECHANICS AND BIOMEDICAL ENGINEERING 9

(see Table 2). Nonetheless, additional data from othercomputational studies concerning the remaining BAVphenotypes in cases of aortic dilation would beneeded to validate our results.
Our dilated aortic models with a BAV also lead tothe presence of retrograde flow in the ascendingaorta, associated with elevated values of FRR. Othercomputational (Bonomi et al. 2015; Faggiano et al.2013b) and in vivo (Rodriguez-Palomares et al. 2018)works also denoted this feature, and an increase inthe FRR index on dilated cases versus non-dilatedones. The progressive decrease of this index throughthe ascending aorta observed in our models is also incorrelation with the literature (see Table 2).Nonetheless, such elevated values of FRR are thoughtto induce an asymmetric increase and directional var-iations in the WSS in the ascending aorta, contribu-ting to dilation (Rodriguez-Palomares et al. 2018). Itis not clear, though, if this parameter is related to theonset of aortic dilation or its progression; however,since retrograde flow is also present in non-dilatedaortas (see Table 2), previous studies suggest thatsuch flow can act as a causal agent of dilation,becoming enhanced with greater aortic enlargementand bolstering the dilation process (Rodriguez-Palomares et al. 2018).
Lastly, flow reversal was dependent on BAVmorphology, with the FRR index showing distinct fea-tures among BAV types. A previous computationalwork found a correlation between decreased valve ori-fice area and increased FRR percentages (Bonomiet al. 2015). This particular reason might explain whyseveral of our FRR percentages (e.g. 19.3% for BAVR-NC) are more similar to those found in stenotic/low entrance flow rate models.
Peak WSS magnitudes obtained for our aorticmodels are in the same range as those reported byother computational studies employing dilated aortas(Pasta et al. 2017) and lower than those obtained withnon-dilated models (Cao et al. 2017, 2016a). Similarfindings are present in computational (Bonomi et al.2015) and in vivo studies (Mahadevia et al. 2014;Bissell et al. 2013), where higher degrees of ascendingaortic dilation were associated with lower WSS values.Nonetheless, previous 4D flow studies using non-dilated aortas have suggested that abnormally highWSS may anticipate the onset of aortopathy and con-tribute to its triggering (Piatti et al. 2017).
Peak WSS distribution and magnitude was alsoaffected by leaflet fusion type, although asymmetricWSS was present at A2 for all models. Different pat-terns were seen distally, with the BAV R-NC
generating a more moderate/even WSS environment.Nonetheless, previous computational (Cao et al. 2017;Pasta et al. 2017) and clinical (Mahadevia et al. 2014;Barker et al. 2010; Bissell et al. 2013) studies alsoreported asymmetric regional WSS in patients withdistinct BAV morphologies.
4.4. Clinical applications
In line with previous works, our study shows thatflow abnormalities in the ascending aorta with a BAVare enhanced in dilated cases when compared to non-dilated ones, as demonstrated by the quantification offlow asymmetry and retrograde flow, for example.Our computational model can therefore help explainthe pathophysiologic process concerning BAV aorto-pathies through the detailed study of ascending aortichemodynamics in these cases.
Our findings favor the proposals of previous stud-ies of using hemodynamic characterizations, such asflow angle (Mahadevia et al. 2014), flow asymmetryand the presence of vortices (Faggiano et al. 2013b) aspredictors of the localization of elevated WSS in theascending aorta and consequently as possible indica-tor of the risk of dilation in these patients. The use ofour computational model can aid doctors in riskstratification, by estimating patients with a larger riskfor dilation onset and progression.
5. Limitations
Some limitations were present in this work. First, thiswas a pilot study to test the framework developed ina small sample that hindered quantitative statisticalcomparisons. A large cohort of patients would beneeded to 1) validate the results hereby presented; 2)further access the potential of this preliminary frame-work for clinical translation of data. For complete-ness, the addition of a non-dilated aortic model witha BAV would have been beneficial for compari-son purposes.
Second, the computational model suffers from sev-eral limitations. The main one concerns the adoptionof rigid leaflets, whose related assumptions have beenaddressed and discussed. Additionally, leaflet tissueproperties were discarded. Future work will beemployed towards the inclusion of moving leafletsand the subsequent study of flow patterns in the aor-tic sinuses derived from leaflet cyclic motion.
Moreover, the aortic wall was built using thicknessdata from literature. Since patient-specific vessel wallthickness is crucial to accurately predict WSS (Neil
10 D. OLIVEIRA ET AL.
and Kerckhoffs 2010; Pasta et al. 2013), efforts shouldbe made regarding its use. Finally, the aortic wall tis-sue was assumed isotropic, although it is anisotropicin behaviour (Pasta et al. 2013).
6. Conclusions
Our study demonstrated that: 1) abnormal hemo-dynamics is present in dilated aortas with a BAV,enhanced in comparison with non-dilated ones, and2) the flow metrics and WSS regional characteristicsemployed here can provide insight into that abnormalbehaviour. Further validation is necessary: clinicaltranslation depends on large scale validation studies,standardization of technical procedures and cost-effectiveness evaluation. Despite the limitations notedabove, this non-invasive approach can be relevant tostudy the impact of transvalvular flow in the ascend-ing aortic wall in BAV patients, providing importantinformation in dilated and non-dilated aortas.
Disclosure statement
No potential conflict of interest was reported bythe authors.
Funding
The partial financial support from the Portuguese FCT -Fundac~ao para a Ciencia e a Tecnologia through the grantSFRH/BPD/109574/2015, the project UID/Multi/04621/2013of the CEMAT - Center for Computational and StochasticMathematics, Instituto Superior T�ecnico, University ofLisbon, Portugal and the UT Austin—Portugal Program(Advanced Computing) are deeply acknowledged.
ORCID
Diana Oliveira http://orcid.org/0000-0002-8151-1333
References
Atkins SK, Cao K, Rajamannan NM, Sucosky P. 2014.Bicuspid aortic valve hemodynamics induces abnormalmedial remodeling in the convexity of porcine ascendingaortas. Biomech Model Mechanobiol. 13(6):1209–1225.
Avolio AP. 1980. Physiological simulation of blood flow inthe aorta: Multi-branched model of the human arterialsystem. Med Biol Eng Comput. 18(6):709–718.
Azadani AN, Chitsaz S, Matthews PB, Jaussaud N, Leung J,Tsinman T, Ge L, Tseng EE. 2012. Comparison of mech-anical properties of human ascending aorta and aorticsinuses. Ann Thorac Surg. 93(1):87–94.
Barker AJ, Lanning C, Shandas R. 2010. Quantification ofhemodynamic wall shear stress in patients with bicuspidaortic valve using phase-contrast MRI. Ann Biomed Eng.38(3):788–800.
Barker AJ, Markl M, B€urk J, Lorenz R, Bock J, Bauer S,Schulz-Menger J, von Knobelsdorff-Brenkenhoff F. 2012.Bicuspid aortic valve is associated with altered wall shearstress in the ascending aorta. Circ Cardiovasc Imaging.5(4):457–466.
Bazilevs Y, Calo V, Tezduyar T, Hughes T. 2007. YZ b dis-continuity capturing for advection-dominated processeswith application to arterial drug delivery. Int J NumerMeth Fluids. 54(6–8):593–608.
Bissell MM, Hess AT, Biasiolli L, Glaze SJ, Loudon M,Pitcher A, Davis A, Prendergast B, Markl M, Barker AJ,et al. 2013. Aortic dilation in bicuspid aortic valve dis-ease: flow pattern is a major contributor and differs withvalve fusion type. Circ Cardiovasc Imaging. 6(4):499–507.
Bonomi D, Vergara C, Faggiano E, Stevanella M, Conti C,Redaelli A, Puppini G, Faggian G, Formaggia L, LucianiGB. 2015. Influence of the aortic valve leaflets on thefluid-dynamics in aorta in presence of a normally func-tioning bicuspid valve. Biomech Model Mechanobiol.14(6):1349–1361.
Cao K, Sucosky P. 2016. Computational comparison ofregional stress and deformation characteristics in tricus-pid and bicuspid aortic valve leaflets. Int J Numer MethBiomed Engng. 33(3):e02798.
Cao K, Buka�C M, Sucosky P. 2016. Three-dimensionalmacro-scale assessment of regional and temporal wallshear stress characteristics on aortic valve leaflets.Comput Methods Biomech Biomed Engin. 19(6):603–613.
Cao K, Atkins SK, McNally A, Liu J, Sucosky P. 2017.Simulations of morphotype-dependent hemodynamics innon-dilated bicuspid aortic valve aortas. J Biomech. 50:63–70.
Corte A, Romano G, Tizzano F, Amarelli C, De Santo L,De Feo M, Scardone M, Dialetto G, Covino F, CotrufoM. 2006. Echocardiographic anatomy of ascending aortadilatation: Correlations with aortic valve morphology andfunction. Int J Cardiol. 113(3):320–326.
Corte A, Bancone C, Quarto C, Dialetto G, Covino F,Scardone M, Caianiello G, Cotrufo M. 2007. Predictorsof ascending aortic dilatation with bicuspid aortic valve:a wide spectrum of disease expression. Eur JCardiothorac. 31:397–405.
Faggiano E, Formaggia L, Antiga L. 2013. An open-sourcetool for patient-specific fluid-structure vessel mesh gener-ation. Fifth International Symposium on Modelling ofPhysiological Flows; Chia Laguna, Italy.
Faggiano E, Antiga L, Puppini G, Quarteroni A, Luciani G,Vergara C. 2013. Helical flows and asymmetry of bloodjet in dilated ascending aorta with normally functioningbicuspid valve. Biomech Model Mechanobiol. 12(4):801–813.
Fernandez M, Formaggia L, Gerbeau JF, Quarteroni A.2009. The derivation of the equations for fluids andstructure. In: Formaggia L, Quarteroni A, Veneziani A,editors. Cardiovascular Mathematics. Modeling and
COMPUTER METHODS IN BIOMECHANICS AND BIOMEDICAL ENGINEERING 11

simulation of the circulatory system. Milano: Springer; p.76–121.
Grewa N, Groot A, Poelmann R, Klautz R, Lindeman J,Goumans M, Palmen M, Mohamed S, Sievers H, BogersA, DeRuiter M. 2014. Ascending aorta dilation in associ-ation with bicuspid aortic valve: A maturation defect ofthe aortic wall. J Thorac Cardiovasc Surg. 148(4):1583–1590.
Guntheroth WG. 2008. A critical review of the AmericanCollege of Cardiology/American Heart Association prac-tice guidelines on bicuspid aortic valve with dilatedascending aorta. Am J Cardiol. 102(1):107–110.
Hindmarsh AC, Brown PN, Grant KE, Lee SL, Serban R,Shumaker DE, Woodward CS. 2005. Sundials: Suite ofnonlinear and differential/algebraic equation solvers.ACM Trans Math Softw. 31(3):363.
Hope MD, Hope TA, Meadows AK, Ordovas KG, UrbaniaTH, Alley MT, Higgins CB. 2010. Bicuspid aortic valve:four-dimensional MR evaluation of ascending aortic sys-tolic flow patterns. Radiology. 255(1):53–61.
Janela J, Moura A, Sequeira A. 2010. Absorbing boundaryconditions for a 3D non-Newtonian fluid-structure inter-action model for blood flow in arteries. J Eng Sci. 48(11):1332–1349.
Kang J, Song H, Yang D, Baek S, Kim D, Song J, Kang D,Lim T, Song J. 2013. Association between bicuspid aorticvalve phenotype and patterns of valvular dysfunction andbicuspid aortopathy: Comprehensive evaluation usingMDCT and echocardiography. JACC CardiovascImaging. 6(2):150–161.
Keane MG, Wiegers SE, Plappert T, Pochettino A, BavariaJE, Sutton MG. 2000. Bicuspid aortic valves are associ-ated with aortic dilatation out of proportion to coexistentvalvular lesions. Circulation. 102(19 Suppl 3):III35–III39.
Kimura N, Nakamura M, Komiya K, Nishi S, YamaguchiA, Tanaka O, Misawa Y, Adachi H, Kawahito K. 2017.Patient-specific assessment of hemodynamics by compu-tational fluid dynamics in patients with bicuspid aortop-athy. J Thorac Cardiovasc Surg. 153(4):52–62.
LaDisa JF, Jr, Taylor CA, Feinstein JA. 2010. Aortic coarc-tation: recent developments in experimental and compu-tational methods to assess treatments for this simplecondition. Prog Pediatr Cardiol. 30(1):45–49.
Lantz J, Renner J, Karlsson M. 2011. Wall shear stress in asubject specific human aorta influence of fluid-structureinteraction. Int J Appl Mechanics. 3(4):759–778.
Mahadevia R, Barker AJ, Schnell S, Entezari P, Kansal P,Fedak PW, Malaisrie SC, McCarthy P, Collins J, Carr J,Markl M. 2014. Bicuspid aortic cusp fusion morphologyalters aortic three-dimensional outflow patterns, wallshear stress, and expression of aortopathy. Circulation.129(6):673–682.
Markl M, Kilner P, Ebbers T. 2011. Comprehensive 4D vel-ocity mapping of the heart and great vessels by cardio-vascular magnetic resonance. J Cardiovasc Magn Reson.13(7):1–22.
Marom G, Kim HS, Rosenfeld M, Raanani E, Haj–Ali R,Luca A, Pilato M, Scardulla C. 2013. Fully coupled fluid-structure interaction model of congenital bicuspid aorticvalves: effect of asymmetry on hemodynamics. Med BiolEng Comput. 51(8):839–848.
Mendez V, Di Giuseppe M, Pasta S. 2018. Comparison ofhemodynamic and structural indices of ascending thor-acic aortic aneurysm as predicted by 2-way FSI, CFDrigid wall simulation and patient-specific displacement-based FEA. Comput Bio Med. 100:221–229.
Neil ML, Kerckhoffs R. 2010. Current progress in patient-specific modeling. Brief Bioinform. 11(1):111–126.
Padang R, Bannon PG, Jeremy R, Richmond DR,Semsarian C, Vallely M, Wilson M, Yan TD. 2013. Thegenetic and molecular basis of bicuspid aortic valve asso-ciated thoracic aortopathy: a link to phenotype hetero-geneity. Ann Cardiothorac Surg. 2(1):83–91.
Parker K, Thiriet M. 2009. Physiology and pathology of thecardiovascular system: a physical perspective. In:Formaggia L, Quarteroni A, Veneziani A, editors.Cardiovascular Mathematics. Modeling and simulation ofthe circulatory system. Milano: Springer; pp. 1–47.
Pasta S, Rinaudo A, Luca A, Pilato M, Scardulla C, GleasonTG, Vorp DA. 2013. Difference in hemodynamic andwall stress of ascending thoracic aortic aneurysms withbicuspid and tricuspid aortic valve. J Biomech. 46(10):1729–1738.
Pasta S, Gentile G, Raffa GM, Scardulla F, Bellavia D, LucaA, Pilato M, Scardulla C. 2017. Three–dimensional para-metric modeling of bicuspid aortopathy and comparisonwith computational flow predictions. Artif Organs. 41(9):92–102.
Petra CG, Schenk O, Lubin M, G€aertner K. 2014. An aug-mented incomplete factorization approach for computingthe schur complement in stochastic optimization. SIAM JSci Comput. 36(2):C139–C162.
Piatti P, Sturla F, Bissell M, Pirola S, Lombardi M,Nesteruk I, Della Corte A, Redaelli A, Votta E. 2017. 4Dflow analysis of BAV-related fluid-dynamic alterations:evidences of wall shear stress alterations in absence ofclinically-relevant aortic anatomical remodeling. FrontPhysiol. 8(441):1–17.
Reymond P, Crosetto P, Deparis S, Quarteroni A,Stergiopulos N. 2013. Physiological simulation of bloodflow in the aorta: Comparison of hemodynamic indicesas predicted by 3-D FSI, 3-D rigid wall and 1-D models.Med Eng Phys. 35(6):784–791.
Richards KE, Deserranno D, Donal E, Greenberg NL,Thomas JD, Garcia MJ. 2004. Influence of structuralgeometry on the severity of bicuspid aortic stenosis. AmJ Physiol Heart Circ Physiol. 287(3):1410–1416.
Rinaudo A, Pasta S. 2014. Regional variation of wall shearstress in ascending thoracic aortic aneurysms. Proc InstMech Eng H. 228(6):627–638.
Rodriguez-Palomares JF, Dux-Santoy L, Guala A, Kale A,Maldonado G, Teixido-Tura G, Galian L, Huguet M,Valente F, Gutierrez L, et al. 2018. Aortic flow patternsand wall shear stress maps by 4D-flow cardiovascularmagnetic resonance in the assessment of aortic dilatationin bicuspid aortic valve disease. J Cardiovasc MagnReson. 20(28):1–15.
Tonimato R, Salmon J, Susin F, Ducci A, Burriesci G. 2016.Physiological vortices in the sinuses of Valsalva: An invitro approach for bio-prosthetic valve. J Biomech.43(13):2635–2643.
12 D. OLIVEIRA ET AL.