bibliometric study on dutch academic medical centers 1998 … · bibliometric study on dutch...
TRANSCRIPT

Bibliometric study on Dutch academic medical centers
1998-2013/2014
Research report to the Deans of Medical Sciences (DMW) in the Netherlands
June 2015
Center for Science & Technology Studies (CWTS) [email protected]
NFU-kenmerk: 15.7831Registratiedatum: 13-7-2015

2
Contents
1. Introduction .................................................................................................................... 3
2. Results ............................................................................................................................. 5
2.1 General results of bibliometric analysis ...................................................................... 5
2.2 Research profiles ........................................................................................................ 26
2.3 Landscape of Dutch academic medical centers ........................................................ 45
2.4 Analysis of top-research ............................................................................................. 57
2.5 Analysis of the publication strategy: research profiles with MNJS values ............... 71
2.6 The Brute force indicator for Dutch UMCS (p * MNCS values) ................................. 80
3. Final remarks ............................................................................................................... 81
Literature ......................................................................................................................... 83
Appendix A: Explanation of the bibliometric indicators of CWTS................ 84
Appendix B: Changes in the bibliometric indicators of CWTS ...................... 93

3
1. Introduction In this report, a bibliometric study is conducted on the research performed within the
Dutch academic medical centers. The study consists of two separate parts, of which the
first part is presented in this report. The current part of the study is based on a
comparison on the output in journals covered by Thomson Scientific in their Web of
Science (WoS), on the overall level of academic medical centers in the Netherlands. The
second part of the study consists of a lower-level analysis of the organizational structure
within each medical center. The findings from that part of the study will be reported
confidentially to each medical center separately.
The present report relates to the publication output of the academic medical centers at
Dutch universities. The medical centers supplied publication lists to CWTS, which were
matched with the CWTS in-house bibliometric data-system. The bibliometric analysis is
covering the period 1998-2013/2014 for all eight academic medical centers. This study
is an update of the study conducted in 2014/2015, for the update CWTS was supplied
with the year 2013 as an additional year to the data collected for the previous studies.
In this year’s analysis, the option was suggested to backwardly add publications to the
existing datasets for de UMC benchmark analysis. For several years, the dataset is only
altered with publications from the most recent year, now three UMCS have taken the
opportunity to add additional publications to the dataset used for the UMC benchmark
study. The three UMCS that had used this option are UMCG, UvA AMC, and LU MC. The
reason for the other UMCS not to supply with additional publication data was the time
aspect in the data collection against the light of the deadline for delivering publication
data for the benchmark study.
We considered only papers classified in the WoS as normal articles, letters and reviews,
published in source serials processed for the WoS database. Please note that in the
indicator set of CWTS (see below), letters are weighted with 0.25. Other document types,
such as meeting abstracts, ‘editorials’, ‘editorial material’, corrections, comments, and
book reviews were not included. Also, papers in non-WoS source journals are not
counted. A few journals are only partially processed for the WoS. Here, only papers
processed for the WoS were included.

4
Overview of bibliometric indicators P Number of papers (normal articles, letters, and reviews) published in
journals processed for the Web of Science (WoS).
TCS Number of citations recorded in WoS journals to all papers involved.
Self-citations are excluded.
MCS Average number of citations per publication, or citation per publication
ratio. Self-citations are excluded.
MNCS The impact of a research unit’s articles, compared to the world citation
average in the subfields in which the research unit is active.
MNJS The impact of the journals in which a research unit has published (the
research unit’s journal selection), compared to the world citation
average in the subfields covered by these journals.
MNCS/MNJS The impact of a research unit’s articles, compared to the average
citation rate of the research unit’s journals (not printed in the data-
tables).
PP(uncited) Percentage of articles not cited during the time period considered.
%Self Cit Percentage of self-citations. A self-citation is defined as a citation in
which the citing and the cited paper have at least one author in common
(first author or co-author).
PP(top 10%) The share of the number of papers that are among the 10% most
frequently cited of all similar papers in the period 1998-2013/2014.
Int Cov This indicates the degree to which a unit refers themselves to the
literature covered in the WoS. The reference behavior of a unit thus
indicates whether the journal literature is important for the scholarly
communication in a field, and as such can be interpreted as indicator of
the applicability of bibliometrics in an assessment context.

5
2. Results
2.1 General results of bibliometric analysis
In Table 1a and 1b, the overall bibliometric scores for the eight academic medical
centers in the Netherlands are shown for the periods 1998-2013/2014 and 2009-
2013/2014, respectively. Table 2 contains the trend data for every single medical center
in the period 1998-2013/2014. Table 3 contains likewise results, limited to papers with
first authorships of the respective medical center. Table 4 contains overall and trend
data for the eight academic medical centers combined, as a cluster of Dutch academic
(bio)medical research.
In the standard tables, we have introduced a change in citation impact measurement in
comparison with last year’s analysis. We have moved back to the method in which
citation impact is measured for five year maximum in block of publication years of four
year maximum. This works as follows: for the first year in a four year block the impact is
measured for five years, for the next year in the block we apply a four year citation
window, for the third year in the block we apply a three year citation window, and for
the last year in the block we apply a two year citation window. As an example, for the
publication years 1998-2001, we apply a citation window that stretches the period 1998-
2002, with a five year citation window 1998-2002 for the papers of 1998, a four year
citation window of 1999-2002 for the 1999 publications, a three year citation window
(2000-2002) for the year 2000, and finally a two year citation window (2001-2002) for
the 2001 publications. This moves through time like roof tiles, in which the next period
overlaps the previous. This approach has several advantages, namely in the first place
the full usage of all publication years in the analysis in a similar fashion, which creates a
consistent approach, and secondly, the aspect that publications contribute to each block
in a different way, maturing in time, and overall creating a more smooth development of
research impact measurements. With respect to this latter aspect, we have to stress that
due to smaller output numbers, on lower levels of aggregation (such as projects or small
teams), these outcomes tend to fluctuate more as compared with output numbers
related to aggregates on higher levels (universities, UMCS, or divisions within UMCS).
This approach is also used for the longer periods analyzed in the study (1998-
2013/2014 and 2009-2013/2014). In the case of the former period, we measure the full
impact of publications from 1998 up and until 2014, that is, covering 17 years, and
covering six years for the 2009 publications. In the case of the latter period, the first

6
year measured is 2009, with a six year citation window, and the last year is 2013, with a
two year citation window (2013-2014).

7
Table 1a: Bibliometric statistics of Dutch academic medical centers, 1998-2013/2014
P TCS MCS MNCS MNJS PP(top 10%) PP(uncited) %Self Cit Int Cov
Erasmus MC 29620,50 917253,25 30,97 1,64 1,41 18% 5% 16% 89%
LU MC 21771,50 631370,00 29,00 1,51 1,37 17% 5% 17% 92%
Radboud UMC 22603,25 563265,25 24,92 1,44 1,32 16% 5% 17% 90%
UMC Maastricht 20586,75 574080,00 27,89 1,54 1,28 16% 5% 16% 87%
UMCG 19569,75 453472,50 23,17 1,42 1,35 16% 7% 17% 90%
UU UMC 22574,75 664116,25 29,42 1,58 1,42 18% 5% 15% 91%
UvA AMC 28469,25 748125,50 26,28 1,50 1,35 16% 6% 16% 90%
VUmc 20040,50 589048,25 29,39 1,66 1,35 19% 6% 16% 89%

8
Table 1b: Bibliometric statistics of Dutch academic medical centers, 2009-2013/2014
P TCS MCS MNCS MNJS PP(top 10%) PP(uncited) %Self Cit Int Cov
Erasmus MC 11963,25 180771,50 15,11 1,76 1,53 20% 9% 21% 90%
LU MC 8718,75 128467,75 14,73 1,63 1,49 19% 9% 22% 92%
Radboud UMC 9460,00 125328,00 13,25 1,63 1,46 18% 10% 21% 90%
UMC Maastricht 8221,25 106637,00 12,97 1,61 1,38 18% 10% 21% 88%
UMCG 9237,25 117949,25 12,77 1,57 1,47 18% 11% 21% 90%
UU UMC 9578,00 134574,50 14,05 1,68 1,53 19% 9% 20% 92%
UvA AMC 12607,50 161894,25 12,84 1,59 1,44 18% 10% 20% 90%
VUmc 9163,50 128271,25 14,00 1,74 1,44 20% 10% 21% 89%

9
Table 2: Bibliometric statistics of Dutch academic medical centers, trend analysis, 1998-2013/2014
Erasmus MC
Period P TCS MCS MNCS MNJS PP(top 10%) PP(uncited) %Self Cit Int Cov
Erasmus MC 1998- 2001 5190,75 47626,25 9,18 1,55 1,33 16% 18% 21% 88%
Erasmus MC 1999- 2002 5326,75 48287,25 9,07 1,49 1,32 16% 17% 21% 89%
Erasmus MC 2000- 2003 5503,00 53906,50 9,80 1,59 1,35 17% 16% 20% 89%
Erasmus MC 2001- 2004 5866,25 58973,75 10,05 1,57 1,34 17% 16% 20% 90%
Erasmus MC 2002- 2005 6455,00 68945,75 10,68 1,57 1,33 17% 14% 20% 89%
Erasmus MC 2003- 2006 7014,75 77317,25 11,02 1,56 1,35 17% 14% 20% 90%
Erasmus MC 2004- 2007 7515,00 82369,00 10,96 1,54 1,35 17% 12% 20% 90%
Erasmus MC 2005- 2008 7880,00 87332,25 11,08 1,55 1,38 17% 12% 20% 90%
Erasmus MC 2006- 2009 8202,00 92696,25 11,30 1,63 1,43 18% 12% 20% 90%
Erasmus MC 2007- 2010 8456,50 98934,50 11,70 1,71 1,48 20% 10% 21% 90%
Erasmus MC 2008- 2011 8750,25 109414,75 12,50 1,72 1,50 20% 10% 21% 90%
Erasmus MC 2009- 2012 9325,00 119244,50 12,79 1,79 1,55 20% 10% 21% 90%
Erasmus MC 2010- 2013 9772,75 120435,50 12,32 1,76 1,54 20% 10% 22% 90%

10
LU MC
Period P TCS MCS MNCS MNJS PP(top 10%) PP(uncited) %Self Cit Int Cov
LU MC 1998- 2001 4261,00 38530,00 9,04 1,45 1,29 16% 17% 21% 91%
LU MC 1999- 2002 4210,25 37680,25 8,95 1,41 1,29 15% 16% 20% 91%
LU MC 2000- 2003 4212,25 37977,75 9,02 1,33 1,29 14% 15% 20% 92%
LU MC 2001- 2004 4333,25 39768,25 9,18 1,36 1,29 15% 14% 21% 92%
LU MC 2002- 2005 4532,50 41659,00 9,19 1,34 1,29 15% 13% 21% 92%
LU MC 2003- 2006 4861,00 45986,25 9,46 1,36 1,29 15% 13% 21% 92%
LU MC 2004- 2007 5215,75 54532,50 10,46 1,44 1,32 16% 12% 20% 92%
LU MC 2005- 2008 5538,00 58753,75 10,61 1,50 1,35 17% 11% 21% 92%
LU MC 2006- 2009 5787,75 64574,50 11,16 1,52 1,41 17% 11% 21% 92%
LU MC 2007- 2010 6175,00 73123,25 11,84 1,65 1,47 18% 10% 21% 93%
LU MC 2008- 2011 6485,00 78410,00 12,09 1,65 1,49 19% 10% 22% 92%
LU MC 2009- 2012 6856,50 84674,75 12,35 1,64 1,50 19% 10% 23% 92%
LU MC 2010- 2013 7190,25 92027,00 12,80 1,66 1,50 19% 10% 23% 92%

11
Radboud UMC
Period P TCS MCS MNCS MNJS PP(top 10%) PP(uncited) %Self Cit Int Cov
Radboud UMC 1998- 2001 3891,00 27573,00 7,09 1,31 1,19 14% 20% 22% 87%
Radboud UMC 1999- 2002 3945,50 28466,50 7,21 1,30 1,21 14% 19% 23% 88%
Radboud UMC 2000- 2003 4246,00 31610,25 7,44 1,28 1,20 14% 18% 22% 89%
Radboud UMC 2001- 2004 4466,75 34517,50 7,73 1,26 1,20 13% 18% 22% 89%
Radboud UMC 2002- 2005 4900,50 39305,00 8,02 1,24 1,21 13% 15% 21% 89%
Radboud UMC 2003- 2006 5338,50 42900,00 8,04 1,26 1,21 13% 15% 21% 89%
Radboud UMC 2004- 2007 5464,25 47206,25 8,64 1,32 1,25 14% 13% 21% 89%
Radboud UMC 2005- 2008 5744,25 53637,00 9,34 1,40 1,30 15% 13% 20% 90%
Radboud UMC 2006- 2009 5942,75 59445,00 10,00 1,50 1,35 16% 12% 20% 90%
Radboud UMC 2007- 2010 6151,00 66298,25 10,78 1,61 1,42 17% 12% 20% 90%
Radboud UMC 2008- 2011 6721,25 74688,25 11,11 1,59 1,45 18% 12% 21% 90%
Radboud UMC 2009- 2012 7224,50 81150,75 11,23 1,62 1,47 19% 11% 21% 91%
Radboud UMC 2010- 2013 7869,00 87895,50 11,17 1,64 1,47 19% 11% 22% 90%

12
UMC Maastricht
Period P TCS MCS MNCS MNJS PP(top 10%) PP(uncited) %Self Cit Int Cov
UMC Maastricht 1998- 2001 3634,50 26542,75 7,30 1,48 1,17 14% 23% 21% 84%
UMC Maastricht 1999- 2002 3951,25 30891,75 7,82 1,43 1,18 14% 22% 21% 85%
UMC Maastricht 2000- 2003 4255,00 36715,75 8,63 1,46 1,22 15% 19% 20% 85%
UMC Maastricht 2001- 2004 4514,75 34823,50 7,71 1,35 1,20 15% 18% 21% 86%
UMC Maastricht 2002- 2005 4775,50 38198,75 8,00 1,33 1,18 14% 16% 21% 86%
UMC Maastricht 2003- 2006 5056,50 43580,50 8,62 1,38 1,21 15% 15% 21% 87%
UMC Maastricht 2004- 2007 5230,50 46833,75 8,95 1,41 1,22 15% 13% 21% 87%
UMC Maastricht 2005- 2008 5248,25 49155,00 9,37 1,42 1,24 15% 13% 21% 87%
UMC Maastricht 2006- 2009 5385,50 51851,25 9,63 1,48 1,31 16% 12% 21% 88%
UMC Maastricht 2007- 2010 5503,25 53578,50 9,74 1,54 1,35 17% 11% 21% 88%
UMC Maastricht 2008- 2011 5895,25 57388,50 9,73 1,55 1,36 18% 13% 22% 88%
UMC Maastricht 2009- 2012 6412,00 69071,25 10,77 1,63 1,39 18% 12% 22% 88%
UMC Maastricht 2010- 2013 6791,25 72920,00 10,74 1,60 1,38 18% 12% 22% 88%

13
UMCG
Period P TCS MCS MNCS MNJS PP(top 10%) PP(uncited) %Self Cit Int Cov
UMCG 1998- 2001 2729,75 17917,25 6,56 1,27 1,22 13% 22% 23% 88%
UMCG 1999- 2002 2853,25 20632,50 7,23 1,28 1,22 13% 20% 21% 89%
UMCG 2000- 2003 3041,50 22222,75 7,31 1,28 1,21 13% 20% 20% 89%
UMCG 2001- 2004 3293,00 26069,75 7,92 1,32 1,22 14% 19% 19% 89%
UMCG 2002- 2005 3695,00 28581,00 7,74 1,28 1,20 13% 19% 20% 89%
UMCG 2003- 2006 4199,50 33124,00 7,89 1,24 1,21 13% 17% 20% 89%
UMCG 2004- 2007 4578,00 38227,25 8,35 1,26 1,22 13% 16% 20% 89%
UMCG 2005- 2008 5014,00 41309,00 8,24 1,25 1,26 13% 15% 20% 90%
UMCG 2006- 2009 5487,00 46222,75 8,42 1,33 1,31 14% 14% 21% 90%
UMCG 2007- 2010 5939,50 53955,25 9,08 1,46 1,39 16% 12% 21% 90%
UMCG 2008- 2011 6460,75 64785,75 10,03 1,53 1,44 17% 12% 21% 90%
UMCG 2009- 2012 7086,25 76509,00 10,80 1,58 1,48 18% 12% 21% 90%
UMCG 2010- 2013 7658,00 84012,50 10,97 1,58 1,49 18% 12% 22% 90%

14
UU UMC
Period P TCS MCS MNCS MNJS PP(top 10%) PP(uncited) %Self Cit Int Cov
UU UMC 1998- 2001 3982,00 36380,50 9,14 1,52 1,34 17% 18% 19% 89%
UU UMC 1999- 2002 4203,00 38713,75 9,21 1,53 1,35 16% 17% 19% 90%
UU UMC 2000- 2003 4362,25 41748,00 9,57 1,51 1,34 16% 16% 19% 90%
UU UMC 2001- 2004 4495,25 45948,25 10,22 1,53 1,33 16% 15% 18% 90%
UU UMC 2002- 2005 4750,75 49864,00 10,50 1,49 1,32 16% 14% 17% 91%
UU UMC 2003- 2006 5111,25 49087,50 9,60 1,41 1,30 15% 14% 18% 91%
UU UMC 2004- 2007 5315,75 52693,25 9,91 1,43 1,33 16% 12% 19% 91%
UU UMC 2005- 2008 5578,00 58290,75 10,45 1,51 1,38 17% 11% 19% 91%
UU UMC 2006- 2009 5897,50 63231,50 10,72 1,56 1,44 17% 11% 19% 91%
UU UMC 2007- 2010 6159,25 69017,75 11,21 1,65 1,50 18% 10% 19% 91%
UU UMC 2008- 2011 6674,75 77928,75 11,68 1,68 1,53 19% 9% 20% 92%
UU UMC 2009- 2012 7392,25 87079,25 11,78 1,70 1,54 20% 9% 21% 92%
UU UMC 2010- 2013 7944,50 96327,50 12,13 1,70 1,54 20% 10% 21% 92%

15
UvA AMC
Period P TCS MCS MNCS MNJS PP(top 10%) PP(uncited) %Self Cit Int Cov
UvA AMC 1998- 2001 4726,50 38937,75 8,24 1,43 1,27 15% 18% 21% 89%
UvA AMC 1999- 2002 4841,00 41621,00 8,60 1,43 1,26 15% 17% 20% 89%
UvA AMC 2000- 2003 5074,50 42592,50 8,39 1,40 1,25 15% 17% 21% 90%
UvA AMC 2001- 2004 5337,25 47814,25 8,96 1,42 1,26 16% 16% 20% 90%
UvA AMC 2002- 2005 5665,75 53436,00 9,43 1,40 1,25 15% 15% 20% 90%
UvA AMC 2003- 2006 6165,75 59371,00 9,63 1,38 1,26 15% 15% 20% 90%
UvA AMC 2004- 2007 6568,25 62714,25 9,55 1,41 1,30 16% 14% 20% 90%
UvA AMC 2005- 2008 7012,00 68371,50 9,75 1,46 1,33 15% 14% 20% 90%
UvA AMC 2006- 2009 7572,50 75961,50 10,03 1,48 1,36 16% 13% 20% 90%
UvA AMC 2007- 2010 8103,25 85124,25 10,50 1,57 1,41 17% 13% 20% 90%
UvA AMC 2008- 2011 8854,00 93799,50 10,59 1,56 1,42 17% 13% 21% 90%
UvA AMC 2009- 2012 9756,25 104137,00 10,67 1,58 1,43 18% 12% 21% 90%
UvA AMC 2010- 2013 10504,50 118668,25 11,30 1,63 1,46 18% 12% 21% 90%

16
VUmc
Period P TCS MCS MNCS MNJS PP(top 10%) PP(uncited) %Self Cit Int Cov
VUmc 1998- 2001 3299,00 27691,75 8,39 1,51 1,25 16% 17% 22% 88%
VUmc 1999- 2002 3415,50 29863,75 8,74 1,51 1,26 17% 16% 21% 89%
VUmc 2000- 2003 3553,50 30468,75 8,57 1,47 1,25 17% 16% 21% 89%
VUmc 2001- 2004 3721,50 34128,00 9,17 1,48 1,25 16% 15% 21% 90%
VUmc 2002- 2005 4096,75 40220,25 9,82 1,47 1,24 16% 14% 20% 90%
VUmc 2003- 2006 4353,00 44665,50 10,26 1,51 1,26 17% 13% 19% 90%
VUmc 2004- 2007 4535,25 48728,75 10,74 1,52 1,30 17% 11% 19% 89%
VUmc 2005- 2008 4679,75 50872,75 10,87 1,53 1,33 17% 11% 19% 89%
VUmc 2006- 2009 4738,50 52437,50 11,07 1,60 1,39 19% 11% 20% 90%
VUmc 2007- 2010 5208,25 57286,25 11,00 1,73 1,44 20% 11% 20% 89%
VUmc 2008- 2011 6075,25 67321,75 11,08 1,72 1,45 20% 12% 21% 89%
VUmc 2009- 2012 6926,50 81652,75 11,79 1,74 1,45 20% 11% 21% 89%
VUmc 2010- 2013 7906,25 97093,00 12,28 1,76 1,44 20% 11% 22% 89%

17
Table 3: Bibliometric statistics of Dutch academic medical centers, first authorships only, 1998-2013/2014
Erasmus MC
Period P TCS MCS MNCS MNJS PP(top 10%) PP(uncited) %Self Cit Int Cov
1998 - 2013 17098,50 447187,50 26,15 1,41 1,32 16% 5% 16% 90%
2009 - 2013 6604,75 79854,00 12,09 1,49 1,39 17% 9% 20% 90%
1998 - 2001 3216,25 23878,50 7,42 1,32 1,28 14% 19% 21% 88%
1999 - 2002 3299,50 25534,50 7,74 1,31 1,27 14% 18% 21% 89%
2000 - 2003 3338,50 27144,25 8,13 1,36 1,29 14% 16% 20% 89%
2001 - 2004 3514,75 29964,75 8,53 1,38 1,27 15% 17% 20% 90%
2002 - 2005 3805,00 33878,50 8,90 1,40 1,26 15% 14% 20% 90%
2003 - 2006 4069,75 38783,75 9,53 1,42 1,28 15% 14% 19% 90%
2004 - 2007 4353,00 41763,00 9,59 1,39 1,28 15% 13% 19% 90%
2005 - 2008 4539,25 42844,75 9,44 1,38 1,31 15% 13% 20% 90%
2006 - 2009 4717,50 45068,00 9,55 1,45 1,35 16% 13% 20% 90%
2007 - 2010 4812,00 47624,75 9,90 1,49 1,37 17% 11% 20% 90%
2008 - 2011 4963,75 51436,00 10,36 1,48 1,39 17% 11% 20% 90%
2009 - 2012 5147,00 53376,75 10,37 1,51 1,40 17% 11% 20% 90%
2010 - 2013 5359,75 51964,25 9,70 1,48 1,39 17% 11% 21% 90%

18
LU MC
Period P TCS MCS MNCS MNJS PP(top 10%) PP(uncited) %Self Cit Int Cov
1998 - 2013 11372,00 284553,00 25,02 1,28 1,26 14% 5% 16% 93%
2009 - 2013 4343,50 50684,75 11,67 1,31 1,33 15% 9% 19% 93%
1998 - 2001 2360,75 17772,00 7,53 1,22 1,23 13% 19% 20% 91%
1999 - 2002 2273,25 17166,50 7,55 1,22 1,22 13% 17% 19% 92%
2000 - 2003 2236,75 17559,00 7,85 1,19 1,23 13% 16% 20% 92%
2001 - 2004 2276,00 18765,00 8,24 1,22 1,23 14% 15% 20% 93%
2002 - 2005 2384,75 19351,00 8,11 1,23 1,24 14% 14% 20% 93%
2003 - 2006 2529,00 21457,75 8,48 1,25 1,23 13% 14% 20% 93%
2004 - 2007 2780,25 25752,25 9,26 1,32 1,25 14% 13% 20% 93%
2005 - 2008 2969,00 28121,25 9,47 1,33 1,26 14% 12% 20% 93%
2006 - 2009 3058,25 29331,50 9,59 1,32 1,28 14% 12% 19% 93%
2007 - 2010 3280,00 32958,75 10,05 1,37 1,32 15% 11% 19% 93%
2008 - 2011 3350,00 32395,75 9,67 1,36 1,34 15% 11% 20% 93%
2009 - 2012 3450,50 33977,75 9,85 1,33 1,34 15% 11% 20% 93%
2010 - 2013 3568,25 34920,50 9,79 1,31 1,34 15% 10% 20% 93%
19
Radboud UMC
Period P TCS MCS MNCS MNJS PP(top 10%) PP(uncited) %Self Cit Int Cov
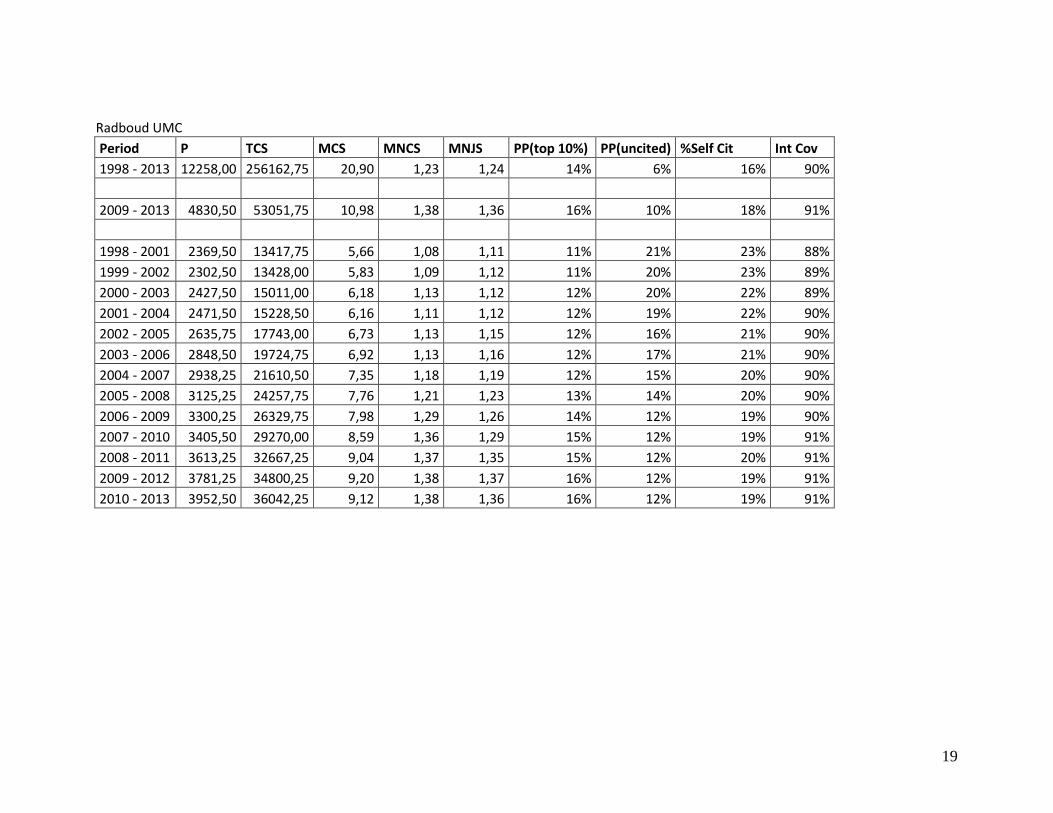
1998 - 2013 12258,00 256162,75 20,90 1,23 1,24 14% 6% 16% 90%
2009 - 2013 4830,50 53051,75 10,98 1,38 1,36 16% 10% 18% 91%
1998 - 2001 2369,50 13417,75 5,66 1,08 1,11 11% 21% 23% 88%
1999 - 2002 2302,50 13428,00 5,83 1,09 1,12 11% 20% 23% 89%
2000 - 2003 2427,50 15011,00 6,18 1,13 1,12 12% 20% 22% 89%
2001 - 2004 2471,50 15228,50 6,16 1,11 1,12 12% 19% 22% 90%
2002 - 2005 2635,75 17743,00 6,73 1,13 1,15 12% 16% 21% 90%
2003 - 2006 2848,50 19724,75 6,92 1,13 1,16 12% 17% 21% 90%
2004 - 2007 2938,25 21610,50 7,35 1,18 1,19 12% 15% 20% 90%
2005 - 2008 3125,25 24257,75 7,76 1,21 1,23 13% 14% 20% 90%
2006 - 2009 3300,25 26329,75 7,98 1,29 1,26 14% 12% 19% 90%
2007 - 2010 3405,50 29270,00 8,59 1,36 1,29 15% 12% 19% 91%
2008 - 2011 3613,25 32667,25 9,04 1,37 1,35 15% 12% 20% 91%
2009 - 2012 3781,25 34800,25 9,20 1,38 1,37 16% 12% 19% 91%
2010 - 2013 3952,50 36042,25 9,12 1,38 1,36 16% 12% 19% 91%

20
UMC Maastricht
Period P TCS MCS MNCS MNJS PP(top 10%) PP(uncited) %Self Cit Int Cov
1998 - 2013 10559,00 234152,50 22,18 1,27 1,21 14% 5% 16% 87%
2009 - 2013 3934,75 41511,25 10,55 1,38 1,29 16% 10% 20% 89%
1998 - 2001 2054,25 10324,25 5,03 1,08 1,11 11% 24% 24% 84%
1999 - 2002 2128,25 11001,00 5,17 1,07 1,12 11% 24% 25% 84%
2000 - 2003 2234,25 12657,00 5,66 1,11 1,12 11% 21% 24% 85%
2001 - 2004 2323,50 13056,25 5,62 1,08 1,12 11% 20% 23% 85%
2002 - 2005 2443,00 15250,25 6,24 1,14 1,12 12% 16% 22% 86%
2003 - 2006 2546,50 17136,00 6,73 1,16 1,15 12% 16% 22% 86%
2004 - 2007 2682,75 18973,25 7,07 1,22 1,17 13% 14% 21% 87%
2005 - 2008 2772,50 21295,50 7,68 1,24 1,18 13% 14% 21% 87%
2006 - 2009 2881,00 21882,25 7,60 1,25 1,23 13% 14% 21% 88%
2007 - 2010 2926,75 23449,00 8,01 1,30 1,25 13% 13% 21% 88%
2008 - 2011 2978,25 24835,25 8,34 1,33 1,28 15% 13% 21% 88%
2009 - 2012 3094,50 27144,75 8,77 1,38 1,29 16% 12% 21% 89%
2010 - 2013 3180,75 27019,25 8,49 1,38 1,29 16% 12% 20% 89%

21
UMCG
Period P TCS MCS MNCS MNJS PP(top 10%) PP(uncited) %Self Cit Int Cov
1998 - 2013 10803,75 202794,00 18,77 1,13 1,22 12% 7% 16% 90%
2009 - 2013 4571,50 45065,75 9,86 1,23 1,31 14% 12% 18% 91%
1998 - 2001 1767,25 8979,25 5,08 0,99 1,13 10% 25% 24% 88%
1999 - 2002 1825,25 10033,00 5,50 1,01 1,13 9% 22% 21% 89%
2000 - 2003 1860,50 10417,75 5,60 1,02 1,12 9% 21% 21% 89%
2001 - 2004 1964,50 11309,00 5,76 1,07 1,14 10% 21% 20% 90%
2002 - 2005 2185,50 13056,75 5,97 1,04 1,12 10% 20% 20% 90%
2003 - 2006 2444,00 14618,25 5,98 1,03 1,14 10% 18% 20% 90%
2004 - 2007 2698,75 17711,75 6,56 1,05 1,15 10% 17% 20% 90%
2005 - 2008 2938,25 19008,50 6,47 1,04 1,17 10% 16% 20% 90%
2006 - 2009 3155,50 21782,75 6,90 1,12 1,21 12% 15% 20% 90%
2007 - 2010 3315,50 24000,25 7,24 1,19 1,25 12% 13% 20% 91%
2008 - 2011 3479,25 26840,75 7,71 1,21 1,27 13% 13% 20% 91%
2009 - 2012 3597,75 30053,75 8,35 1,23 1,30 14% 13% 19% 91%
2010 - 2013 3695,50 29745,25 8,05 1,22 1,32 13% 14% 19% 91%

22
UU UMC
Period P TCS MCS MNCS MNJS PP(top 10%) PP(uncited) %Self Cit Int Cov
1998 - 2013 12542,75 295556,25 23,56 1,32 1,31 15% 5% 14% 92%
2009 - 2013 5105,50 56068,75 10,98 1,41 1,37 16% 9% 19% 92%
1998 - 2001 2331,00 16638,25 7,14 1,27 1,24 15% 20% 19% 90%
1999 - 2002 2445,00 17976,75 7,35 1,26 1,26 14% 19% 19% 90%
2000 - 2003 2528,25 19018,00 7,52 1,22 1,24 13% 17% 19% 91%
2001 - 2004 2582,25 19967,75 7,73 1,24 1,24 13% 16% 19% 91%
2002 - 2005 2671,00 21746,50 8,14 1,22 1,26 13% 15% 18% 92%
2003 - 2006 2843,25 22109,25 7,78 1,18 1,26 12% 15% 18% 91%
2004 - 2007 2948,00 24251,25 8,23 1,23 1,29 13% 13% 18% 91%
2005 - 2008 3142,00 26314,75 8,38 1,28 1,33 14% 12% 18% 91%
2006 - 2009 3307,75 28448,00 8,60 1,32 1,35 15% 12% 18% 92%
2007 - 2010 3418,00 30943,25 9,05 1,37 1,37 16% 11% 18% 92%
2008 - 2011 3634,25 33784,00 9,30 1,37 1,37 16% 11% 19% 93%
2009 - 2012 3910,50 36205,25 9,26 1,42 1,38 16% 10% 19% 93%
2010 - 2013 4233,00 38532,00 9,10 1,41 1,37 16% 11% 19% 92%

23
UvA AMC
Period P TCS MCS MNCS MNJS PP(top 10%) PP(uncited) %Self Cit Int Cov
1998 - 2013 12594,75 292828,25 23,25 1,30 1,26 14% 7% 15% 91%
2009 - 2013 5225,75 56528,50 10,82 1,37 1,33 15% 11% 19% 91%
1998 - 2001 2421,75 16524,75 6,82 1,24 1,19 13% 19% 20% 89%
1999 - 2002 2379,00 17833,25 7,50 1,26 1,19 14% 19% 19% 90%
2000 - 2003 2368,50 18063,50 7,63 1,26 1,20 14% 18% 19% 90%
2001 - 2004 2432,00 19337,75 7,95 1,28 1,21 15% 18% 19% 90%
2002 - 2005 2519,50 20668,25 8,20 1,24 1,20 14% 18% 19% 90%
2003 - 2006 2719,00 22968,25 8,45 1,22 1,21 13% 16% 19% 91%
2004 - 2007 2881,00 24399,25 8,47 1,25 1,25 14% 14% 20% 91%
2005 - 2008 3105,50 25411,50 8,18 1,28 1,28 13% 15% 20% 91%
2006 - 2009 3333,25 28020,00 8,41 1,27 1,29 13% 14% 19% 91%
2007 - 2010 3565,00 30948,75 8,68 1,33 1,33 15% 14% 19% 91%
2008 - 2011 3855,75 33653,50 8,73 1,33 1,31 15% 14% 20% 91%
2009 - 2012 4098,75 36958,75 9,02 1,38 1,33 16% 13% 20% 91%
2010 - 2013 4320,25 40724,75 9,43 1,39 1,34 15% 13% 19% 91%

24
VUmc
Period P TCS MCS MNCS MNJS PP(top 10%) PP(uncited) %Self Cit Int Cov
1998 - 2013 9930,00 260719,25 26,26 1,43 1,23 16% 6% 15% 89%
2009 - 2013 4000,00 45033,75 11,26 1,44 1,29 17% 12% 20% 90%
1998 - 2001 1851,50 13717,50 7,41 1,39 1,17 15% 19% 20% 88%
1999 - 2002 1927,25 14903,50 7,73 1,37 1,18 15% 17% 20% 89%
2000 - 2003 1981,75 14619,00 7,38 1,34 1,18 15% 16% 21% 89%
2001 - 2004 2060,75 15818,50 7,68 1,30 1,17 14% 16% 21% 90%
2002 - 2005 2244,50 18296,75 8,15 1,30 1,16 14% 15% 21% 90%
2003 - 2006 2321,75 20398,25 8,79 1,34 1,17 15% 14% 19% 90%
2004 - 2007 2390,75 21932,75 9,17 1,36 1,19 15% 12% 19% 90%
2005 - 2008 2471,75 23366,75 9,45 1,38 1,22 15% 13% 19% 90%
2006 - 2009 2479,75 23364,50 9,42 1,43 1,26 16% 12% 19% 90%
2007 - 2010 2645,25 24798,75 9,37 1,47 1,29 17% 11% 19% 90%
2008 - 2011 2888,00 26718,25 9,25 1,45 1,29 17% 13% 20% 90%
2009 - 2012 3086,75 29366,50 9,51 1,47 1,30 18% 13% 20% 90%
2010 - 2013 3354,25 32068,00 9,56 1,43 1,29 17% 13% 21% 89%

25
Table 4: Bibliometric statistics of all Dutch academic medical centers combined, 1998-2013/2014
Period P TCS MCS MNCS MNJS PP(top 10%) PP(uncited) %Self Cit Int Cov
1998- 2013 152574,00 4147109,50 27,18 1,50 1,33 16% 6% 16% 90%
2009- 2013 63716,25 842114,75 13,22 1,61 1,42 18% 10% 20% 90%
1998- 2001 27003,75 213099,50 7,89 1,40 1,24 15% 19% 21% 88%
1999- 2002 27674,25 226853,50 8,20 1,40 1,24 15% 18% 21% 89%
2000- 2003 28725,25 245284,00 8,54 1,41 1,25 15% 17% 20% 89%
2001- 2004 29966,75 261504,25 8,73 1,39 1,24 15% 17% 20% 89%
2002- 2005 3.130,25 292842,25 9,11 1,39 1,24 15% 15% 20% 90%
2003- 2006 34675,50 322287,50 9,29 1,39 1,25 15% 15% 20% 90%
2004- 2007 36689,25 351576,00 9,58 1,41 1,27 15% 13% 20% 90%
2005- 2008 38739,75 381529,00 9,85 1,43 1,31 16% 13% 20% 90%
2006- 2009 40746,75 408431,50 10,02 1,48 1,34 16% 12% 20% 90%
2007- 2010 42778,25 445072,00 10,40 1,56 1,39 17% 12% 20% 90%
2008- 2011 45745,50 491269,25 10,74 1,58 1,41 18% 12% 21% 90%
2009- 2012 49353,75 547873,00 11,10 1,61 1,43 18% 11% 21% 90%
2010- 2013 52693,25 591925,50 11,23 1,62 1,43 18% 11% 21% 90%
26
2.2 Research profiles
In the research profiles for the eight medical centers, displayed in Figures 1 to 8 (with
a) and b) figures describing the period 1998-2013/2014 and 2009-2013/2014
respectively), the output per academic medical center is displayed to the 1% level of the
output (fields with smaller shares than 1% are not displayed). Per medical center, the
total share displayed in the profile with respect to the total output is indicated. We have
produced the profiles for the full period covered (now 1998 to 2013/2014), and the last
five year period 2009-2013/2014. This five year period is already shown in the tables,
and is now also introduced in the profiles, as it shows the most recent situation of the
performance per UMC.
While reading and using the profiles, it is important to keep in mind that these profiles
display information of the output and impact per UMC across fields, particularly focused
on the comparison between UMCS. These profiles do not provide information on the
level of organizational units within every single UMC, as there exists in this analysis no
organic link between the units producing papers, and the fields these papers belong to.
For that particular information, every UMC has its own internal analysis. So the output
and impact in for example Immunology can be compared between UMCS, but does not
allow any kind of conclusion of the level of units involved in immunological research
within every UMC.
In general, around 80% of the output of the medical centers is displayed in the research
profiles.
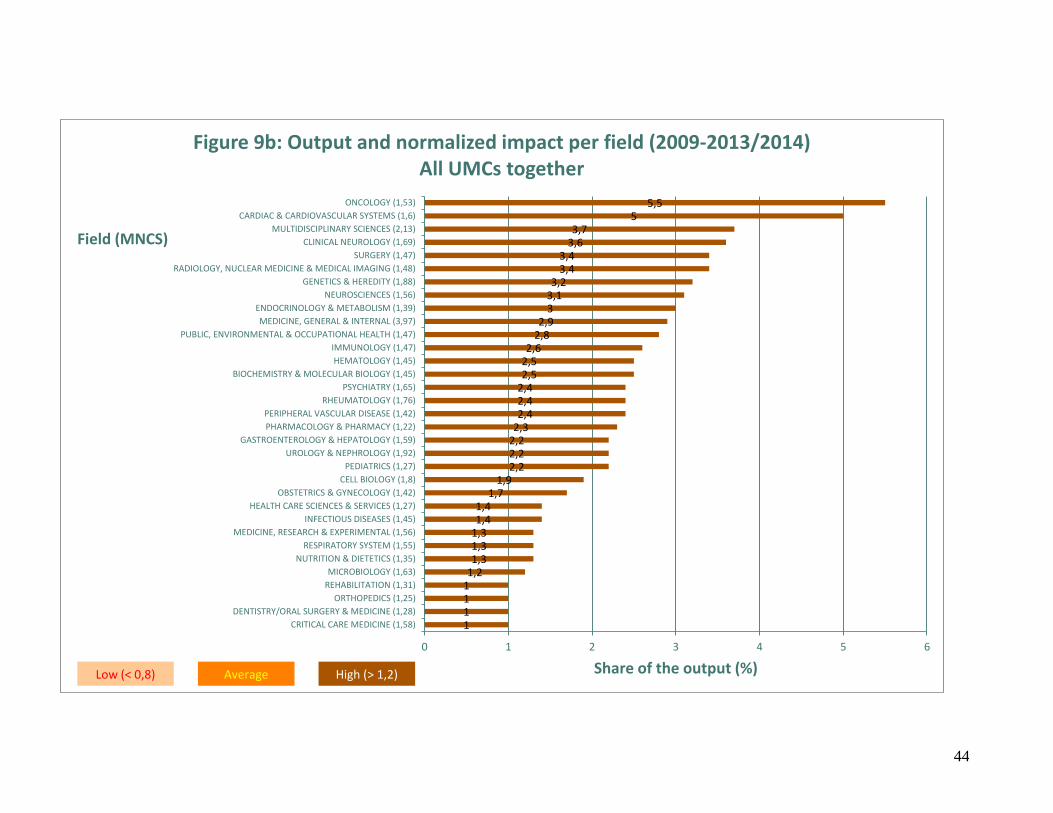
In Figure 9, the research profile covering the period 2009-2013/2014 for the combined
output of academic medical centers is displayed.

27
111111,21,31,31,41,41,51,61,6
1,82,32,42,52,52,62,6
2,82,9
33,13,1
3,43,53,6
4,14,3
7,28,3
0 1 2 3 4 5 6 7 8 9
CRITICAL CARE MEDICINE (1,26)
VIROLOGY (1,34)
PATHOLOGY (1,42)
OPHTHALMOLOGY (1,57)
RHEUMATOLOGY (1,92)
MEDICINE, RESEARCH & EXPERIMENTAL (1,45)
INFECTIOUS DISEASES (1,47)
HEALTH CARE SCIENCES & SERVICES (1,38)
RESPIRATORY SYSTEM (1,6)
MULTIDISCIPLINARY SCIENCES (4,52)
MICROBIOLOGY (1,49)
OBSTETRICS & GYNECOLOGY (1,38)
PSYCHIATRY (1,18)
CELL BIOLOGY (1,39)
BIOCHEMISTRY & MOLECULAR BIOLOGY (1,27)
PEDIATRICS (1,33)
NEUROSCIENCES (1,3)
PHARMACOLOGY & PHARMACY (1,11)
UROLOGY & NEPHROLOGY (1,57)
PERIPHERAL VASCULAR DISEASE (1,63)
GASTROENTEROLOGY & HEPATOLOGY (1,65)
IMMUNOLOGY (1,32)
MEDICINE, GENERAL & INTERNAL (5,1)
HEMATOLOGY (1,54)
CLINICAL NEUROLOGY (1,81)
RADIOLOGY, NUCLEAR MEDICINE & MEDICAL IMAGING (1,45)
PUBLIC, ENVIRONMENTAL & OCCUPATIONAL HEALTH (1,62)
GENETICS & HEREDITY (1,77)
SURGERY (1,44)
ENDOCRINOLOGY & METABOLISM (1,28)
CARDIAC & CARDIOVASCULAR SYSTEMS (1,76)
ONCOLOGY (1,55)
Share of the output (%)
Field (MNCS)
Figure 1a: Output and normalized impact per field (1998-2013/2014)Erasmus MC
Low (< 0,8) Average High (> 1,2)

28
1,11,11,11,11,21,31,41,41,51,5
1,81,81,9
2,22,32,32,32,42,42,4
2,72,72,82,8
3,33,5
3,84,24,3
7,27,5
0 1 2 3 4 5 6 7 8
VIROLOGY (1,5)
CRITICAL CARE MEDICINE (1,44)
MICROBIOLOGY (1,78)
MEDICINE, RESEARCH & EXPERIMENTAL (1,64)
DERMATOLOGY (2,16)
RHEUMATOLOGY (1,98)
RESPIRATORY SYSTEM (1,78)
INFECTIOUS DISEASES (1,64)
OBSTETRICS & GYNECOLOGY (1,45)
HEALTH CARE SCIENCES & SERVICES (1,36)
CELL BIOLOGY (1,54)
PSYCHIATRY (1,34)
BIOCHEMISTRY & MOLECULAR BIOLOGY (1,31)
UROLOGY & NEPHROLOGY (2,19)
NEUROSCIENCES (1,54)
MULTIDISCIPLINARY SCIENCES (3,53)
PERIPHERAL VASCULAR DISEASE (1,36)
MEDICINE, GENERAL & INTERNAL (6,51)
IMMUNOLOGY (1,54)
PHARMACOLOGY & PHARMACY (1,19)
PEDIATRICS (1,28)
CLINICAL NEUROLOGY (1,76)
RADIOLOGY, NUCLEAR MEDICINE & MEDICAL IMAGING (1,38)
HEMATOLOGY (1,87)
GASTROENTEROLOGY & HEPATOLOGY (1,75)
ENDOCRINOLOGY & METABOLISM (1,22)
PUBLIC, ENVIRONMENTAL & OCCUPATIONAL HEALTH (1,85)
GENETICS & HEREDITY (2,27)
SURGERY (1,43)
CARDIAC & CARDIOVASCULAR SYSTEMS (1,64)
ONCOLOGY (1,85)
Share of the output (%)
Field (MNCS)
Figure 1b: Output and normalized impact per field (2009-2013/2014)Erasmus MC
Low (< 0,8) Average High (> 1,2)

29
111,11,11,11,2
1,41,41,4
1,71,71,81,9
22,12,2
2,42,62,72,7
3,13,2
3,63,8
4,34,54,54,6
55,7
6,9
0 1 2 3 4 5 6 7 8
TRANSPLANTATION (1,24)
INFECTIOUS DISEASES (1,32)
DERMATOLOGY (1,86)
PUBLIC, ENVIRONMENTAL & OCCUPATIONAL HEALTH (1,44)
VIROLOGY (1,29)
RESPIRATORY SYSTEM (1,85)
MICROBIOLOGY (1,72)
MEDICINE, RESEARCH & EXPERIMENTAL (1,69)
PATHOLOGY (1,3)
GASTROENTEROLOGY & HEPATOLOGY (1,52)
PEDIATRICS (1,24)
PSYCHIATRY (1,45)
OBSTETRICS & GYNECOLOGY (1,18)
UROLOGY & NEPHROLOGY (1,75)
CELL BIOLOGY (1,41)
PHARMACOLOGY & PHARMACY (1,08)
MULTIDISCIPLINARY SCIENCES (2,92)
PERIPHERAL VASCULAR DISEASE (1,37)
NEUROSCIENCES (1,24)
SURGERY (1,51)
CLINICAL NEUROLOGY (1,51)
MEDICINE, GENERAL & INTERNAL (3,7)
BIOCHEMISTRY & MOLECULAR BIOLOGY (1,17)
RADIOLOGY, NUCLEAR MEDICINE & MEDICAL IMAGING (1,25)
ENDOCRINOLOGY & METABOLISM (1,2)
RHEUMATOLOGY (2)
GENETICS & HEREDITY (1,75)
HEMATOLOGY (1,29)
IMMUNOLOGY (1,19)
CARDIAC & CARDIOVASCULAR SYSTEMS (1,5)
ONCOLOGY (1,31)
Share of the output (%)
Field (MNCS)
Figure 2a: Output and normalized impact per field (1998-2013/2014)LU MC
Low (< 0,8) Average High (> 1,2)

30
11111,11,11,21,21,31,41,51,6
1,81,91,9
2,22,32,3
2,62,82,9
33,33,4
3,73,8
4,34,4
4,85,7
6,57
0 1 2 3 4 5 6 7 8
TRANSPLANTATION (1,42)
RESPIRATORY SYSTEM (1,47)
GERIATRICS & GERONTOLOGY (1,16)
VIROLOGY (1,41)
INFECTIOUS DISEASES (1,47)
PUBLIC, ENVIRONMENTAL & OCCUPATIONAL HEALTH (1,6)
PATHOLOGY (1,35)
BIOCHEMICAL RESEARCH METHODS (1,52)
MICROBIOLOGY (2,15)
MEDICINE, RESEARCH & EXPERIMENTAL (1,8)
GASTROENTEROLOGY & HEPATOLOGY (2,02)
PEDIATRICS (1,21)
PHARMACOLOGY & PHARMACY (1,23)
UROLOGY & NEPHROLOGY (1,7)
OBSTETRICS & GYNECOLOGY (1,4)
CELL BIOLOGY (1,53)
PERIPHERAL VASCULAR DISEASE (1,21)
PSYCHIATRY (1,66)
NEUROSCIENCES (1,38)
SURGERY (1,61)
BIOCHEMISTRY & MOLECULAR BIOLOGY (1,33)
MEDICINE, GENERAL & INTERNAL (3,63)
CLINICAL NEUROLOGY (1,69)
RADIOLOGY, NUCLEAR MEDICINE & MEDICAL IMAGING (1,43)
IMMUNOLOGY (1,18)
HEMATOLOGY (1,13)
MULTIDISCIPLINARY SCIENCES (2,49)
ENDOCRINOLOGY & METABOLISM (1,26)
GENETICS & HEREDITY (2,31)
RHEUMATOLOGY (2,17)
CARDIAC & CARDIOVASCULAR SYSTEMS (1,45)
ONCOLOGY (1,4)
Share of the output (%)
Field (MNCS)
Figure 2b: Output and normalized impact per field (2009-2013/2014)LU MC
Low (< 0,8) Average High (> 1,2)

31
11,11,21,31,31,41,41,41,41,5
1,71,71,71,81,81,81,9
22,12,1
2,42,5
2,82,8
3,13,2
3,43,4
3,94,14,2
5,37,1
0 1 2 3 4 5 6 7 8
PHYSIOLOGY (1,05)
PATHOLOGY (1,4)
GASTROENTEROLOGY & HEPATOLOGY (1,35)
ENGINEERING, BIOMEDICAL (1,19)
HEALTH CARE SCIENCES & SERVICES (1,22)
MEDICINE, RESEARCH & EXPERIMENTAL (1,34)
OTORHINOLARYNGOLOGY (1,15)
PERIPHERAL VASCULAR DISEASE (1,32)
CARDIAC & CARDIOVASCULAR SYSTEMS (1,44)
INFECTIOUS DISEASES (1,48)
PSYCHIATRY (1,26)
PUBLIC, ENVIRONMENTAL & OCCUPATIONAL HEALTH (1,42)
DERMATOLOGY (1,49)
MICROBIOLOGY (1,5)
CELL BIOLOGY (1,36)
OBSTETRICS & GYNECOLOGY (1,13)
MULTIDISCIPLINARY SCIENCES (2,44)
PEDIATRICS (1,07)
ENDOCRINOLOGY & METABOLISM (1,1)
HEMATOLOGY (1,52)
IMMUNOLOGY (1,48)
RHEUMATOLOGY (1,75)
DENTISTRY/ORAL SURGERY & MEDICINE (1,19)
PHARMACOLOGY & PHARMACY (1,13)
SURGERY (1,37)
RADIOLOGY, NUCLEAR MEDICINE & MEDICAL IMAGING (1,76)
BIOCHEMISTRY & MOLECULAR BIOLOGY (1,24)
MEDICINE, GENERAL & INTERNAL (3,04)
UROLOGY & NEPHROLOGY (1,77)
CLINICAL NEUROLOGY (1,29)
NEUROSCIENCES (1,21)
GENETICS & HEREDITY (1,67)
ONCOLOGY (1,36)
Share of the output (%)
Field (MNCS)
Figure 3a: Output and normalized impact per field (1998-2013/2014)Radboud UMC
Low (< 0,8) Average High (> 1,2)

32
1111,11,21,31,31,41,51,51,51,61,71,71,7
1,9222,12,1
2,42,42,5
2,82,82,92,92,9
3,33,6
4,24,3
5,36,5
0 1 2 3 4 5 6 7
RESPIRATORY SYSTEM (1,15)
PATHOLOGY (1,42)
REHABILITATION (1,46)
PERIPHERAL VASCULAR DISEASE (1,4)
ENGINEERING, BIOMEDICAL (1,07)
OTORHINOLARYNGOLOGY (1,43)
MEDICINE, RESEARCH & EXPERIMENTAL (1,52)
DERMATOLOGY (1,82)
CARDIAC & CARDIOVASCULAR SYSTEMS (1,57)
GASTROENTEROLOGY & HEPATOLOGY (1,65)
PUBLIC, ENVIRONMENTAL & OCCUPATIONAL HEALTH (1,86)
PEDIATRICS (1,24)
HEALTH CARE SCIENCES & SERVICES (1,11)
INFECTIOUS DISEASES (1,7)
CELL BIOLOGY (1,88)
OBSTETRICS & GYNECOLOGY (1,2)
PSYCHIATRY (1,53)
ENDOCRINOLOGY & METABOLISM (1,2)
MICROBIOLOGY (1,53)
HEMATOLOGY (1,67)
PHARMACOLOGY & PHARMACY (1,31)
IMMUNOLOGY (1,55)
RHEUMATOLOGY (1,81)
BIOCHEMISTRY & MOLECULAR BIOLOGY (1,43)
DENTISTRY/ORAL SURGERY & MEDICINE (1,3)
MEDICINE, GENERAL & INTERNAL (3,91)
SURGERY (1,45)
UROLOGY & NEPHROLOGY (2,61)
RADIOLOGY, NUCLEAR MEDICINE & MEDICAL IMAGING (2,09)
MULTIDISCIPLINARY SCIENCES (2,03)
NEUROSCIENCES (1,5)
CLINICAL NEUROLOGY (1,47)
GENETICS & HEREDITY (2,03)
ONCOLOGY (1,57)
Share of the output (%)
Field (MNCS)
Figure 3b: Output and normalized impact per field (2009-2013/2014)Radboud UMC
Low (< 0,8) Average High (> 1,2)

33
11111,11,11,1
1,31,41,41,41,51,51,61,61,71,7
222,22,32,3
2,52,62,6
2,82,9
3,13,1
3,33,6
3,83,8
4,24,5
4,8
0 1 2 3 4 5 6
NURSING (1,61)TOXICOLOGY (1,3)
MEDICINE, RESEARCH & EXPERIMENTAL (1,56)REHABILITATION (1,31)
SPORT SCIENCES (1,6)
EDUCATION, SCIENTIFIC DISCIPLINES (1,73)OPHTHALMOLOGY (1,35)
PHYSIOLOGY (1,28)
PEDIATRICS (1,25)CELL BIOLOGY (1,47)
IMMUNOLOGY (1,08)
PSYCHOLOGY, CLINICAL (1,22)MULTIDISCIPLINARY SCIENCES (2)
OBSTETRICS & GYNECOLOGY (1,43)GASTROENTEROLOGY & HEPATOLOGY (1,14)
PSYCHOLOGY, MULTIDISCIPLINARY (1,49)
RESPIRATORY SYSTEM (2,14)UROLOGY & NEPHROLOGY (1,82)
GENETICS & HEREDITY (1,27)
PHARMACOLOGY & PHARMACY (1,21)HEMATOLOGY (1,24)
HEALTH CARE SCIENCES & SERVICES (1,49)
BIOCHEMISTRY & MOLECULAR BIOLOGY (1,24)RHEUMATOLOGY (1,84)
RADIOLOGY, NUCLEAR MEDICINE & MEDICAL IMAGING (1,47)SURGERY (1,48)
MEDICINE, GENERAL & INTERNAL (4,22)NEUROSCIENCES (1,15)
CLINICAL NEUROLOGY (1,66)ENDOCRINOLOGY & METABOLISM (1,27)
PUBLIC, ENVIRONMENTAL & OCCUPATIONAL HEALTH (1,31)PSYCHIATRY (1,44)
NUTRITION & DIETETICS (1,35)PERIPHERAL VASCULAR DISEASE (1,39)
ONCOLOGY (1,37)CARDIAC & CARDIOVASCULAR SYSTEMS (1,83)
Share of the output (%)
Field (MNCS)
Figure 4a: Output and normalized impact per field (1998-2013/2014)UMC Maastricht
Low (< 0,8) Average High (> 1,2)

34
11,11,11,11,1
1,31,31,31,31,31,41,51,61,71,81,91,9
22,22,32,42,5
2,82,92,9
33,13,23,3
3,63,63,7
4,44,7
5,2
0 1 2 3 4 5 6
PHYSIOLOGY (1,71)
NURSING (2,15)
IMMUNOLOGY (1,23)
MEDICINE, RESEARCH & EXPERIMENTAL (1,79)
GERIATRICS & GERONTOLOGY (2,18)
TOXICOLOGY (1,44)
CELL BIOLOGY (2)
EDUCATION, SCIENTIFIC DISCIPLINES (1,68)
OPHTHALMOLOGY (1,53)
PEDIATRICS (1,37)
REHABILITATION (1,25)
PSYCHOLOGY, MULTIDISCIPLINARY (1,75)
GASTROENTEROLOGY & HEPATOLOGY (1,13)
RESPIRATORY SYSTEM (1,73)
PHARMACOLOGY & PHARMACY (1,27)
OBSTETRICS & GYNECOLOGY (1,67)
UROLOGY & NEPHROLOGY (1,63)
HEMATOLOGY (1,51)
BIOCHEMISTRY & MOLECULAR BIOLOGY (1,37)
RHEUMATOLOGY (2,06)
GENETICS & HEREDITY (1,34)
HEALTH CARE SCIENCES & SERVICES (1,43)
MEDICINE, GENERAL & INTERNAL (4,88)
NEUROSCIENCES (1,32)
SURGERY (1,6)
PSYCHIATRY (1,74)
MULTIDISCIPLINARY SCIENCES (1,65)
CLINICAL NEUROLOGY (1,66)
RADIOLOGY, NUCLEAR MEDICINE & MEDICAL IMAGING (1,44)
ENDOCRINOLOGY & METABOLISM (1,4)
NUTRITION & DIETETICS (1,39)
PUBLIC, ENVIRONMENTAL & OCCUPATIONAL HEALTH (1,17)
PERIPHERAL VASCULAR DISEASE (1,41)
ONCOLOGY (1,51)
CARDIAC & CARDIOVASCULAR SYSTEMS (1,64)
Share of the output (%)
Field (MNCS)
Figure 4b: Output and normalized impact per field (2009-2013/2014)UMC Maastricht
Low (< 0,8) Average High (> 1,2)

35
11,11,11,21,31,31,4
1,61,71,8
22,12,22,22,22,32,42,42,42,52,52,5
333,13,23,33,43,4
3,75,7
6,3
0 1 2 3 4 5 6 7
SPORT SCIENCES (1,26)
ENGINEERING, BIOMEDICAL (1,03)
TRANSPLANTATION (1,1)
MICROBIOLOGY (1,35)
MEDICINE, RESEARCH & EXPERIMENTAL (0,96)
CELL BIOLOGY (1,12)
OBSTETRICS & GYNECOLOGY (1,16)
PSYCHOLOGY, MULTIDISCIPLINARY (1,35)
RHEUMATOLOGY (1,71)
REHABILITATION (1,19)
PUBLIC, ENVIRONMENTAL & OCCUPATIONAL HEALTH (1,21)
MULTIDISCIPLINARY SCIENCES (1,82)
PERIPHERAL VASCULAR DISEASE (1,23)
ENDOCRINOLOGY & METABOLISM (1,06)
IMMUNOLOGY (1,15)
UROLOGY & NEPHROLOGY (1,78)
RESPIRATORY SYSTEM (1,54)
PEDIATRICS (1,15)
GASTROENTEROLOGY & HEPATOLOGY (1,45)
DENTISTRY/ORAL SURGERY & MEDICINE (1,24)
BIOCHEMISTRY & MOLECULAR BIOLOGY (1,15)
HEMATOLOGY (1,23)
RADIOLOGY, NUCLEAR MEDICINE & MEDICAL IMAGING (1,36)
CLINICAL NEUROLOGY (1,26)
PHARMACOLOGY & PHARMACY (1,05)
MEDICINE, GENERAL & INTERNAL (3,81)
GENETICS & HEREDITY (2,06)
SURGERY (1,37)
NEUROSCIENCES (1,26)
PSYCHIATRY (1,72)
CARDIAC & CARDIOVASCULAR SYSTEMS (1,54)
ONCOLOGY (1,24)
Share of the output (%)
Field (MNCS)
Figure 5a: Output and normalized impact per field (1998-2013/2014)UMCG
Low (< 0,8) Average High (> 1,2)

36
11111,11,21,2
1,41,71,81,81,9
22,12,22,22,22,32,32,32,32,32,4
2,62,9
33,13,23,2
3,844,1
5,35,5
0 1 2 3 4 5 6
DERMATOLOGY (1,34)
TRANSPLANTATION (1,24)
MICROBIOLOGY (1,48)
ORTHOPEDICS (0,98)
HEALTH CARE SCIENCES & SERVICES (1,07)
CELL BIOLOGY (1,61)
MEDICINE, RESEARCH & EXPERIMENTAL (0,99)
SPORT SCIENCES (1,32)
PSYCHOLOGY, MULTIDISCIPLINARY (1,43)
OBSTETRICS & GYNECOLOGY (1,12)
RHEUMATOLOGY (1,94)
GASTROENTEROLOGY & HEPATOLOGY (1,58)
IMMUNOLOGY (1,44)
RESPIRATORY SYSTEM (1,56)
REHABILITATION (1,25)
PERIPHERAL VASCULAR DISEASE (1,21)
UROLOGY & NEPHROLOGY (1,81)
PUBLIC, ENVIRONMENTAL & OCCUPATIONAL HEALTH (1,11)
HEMATOLOGY (1,39)
BIOCHEMISTRY & MOLECULAR BIOLOGY (1,25)
DENTISTRY/ORAL SURGERY & MEDICINE (1,32)
ENDOCRINOLOGY & METABOLISM (1,21)
PHARMACOLOGY & PHARMACY (1,14)
PEDIATRICS (1,02)
NEUROSCIENCES (1,69)
CLINICAL NEUROLOGY (1,31)
RADIOLOGY, NUCLEAR MEDICINE & MEDICAL IMAGING (1,4)
SURGERY (1,41)
MEDICINE, GENERAL & INTERNAL (4,38)
GENETICS & HEREDITY (2,58)
MULTIDISCIPLINARY SCIENCES (1,75)
PSYCHIATRY (1,98)
ONCOLOGY (1,49)
CARDIAC & CARDIOVASCULAR SYSTEMS (1,62)
Share of the output (%)
Field (MNCS)
Figure 5b: Output and normalized impact per field (2009-2013/2014)UMCG
Low (< 0,8) Average High (> 1,2)

37
1
1,2
1,3
1,4
1,6
1,9
2
2
2,4
2,5
2,6
2,7
2,7
2,7
2,8
2,9
2,9
3,1
3,1
3,5
3,6
3,7
3,9
3,9
4
4,4
4,5
4,8
0 1 2 3 4 5 6
NUTRITION & DIETETICS (1,46)
MEDICINE, RESEARCH & EXPERIMENTAL (1,26)
RESPIRATORY SYSTEM (1,35)
INFECTIOUS DISEASES (1,43)
MICROBIOLOGY (1,57)
PUBLIC, ENVIRONMENTAL & OCCUPATIONAL HEALTH (1,67)
UROLOGY & NEPHROLOGY (1,32)
OBSTETRICS & GYNECOLOGY (1,66)
MULTIDISCIPLINARY SCIENCES (3,2)
RHEUMATOLOGY (1,63)
GASTROENTEROLOGY & HEPATOLOGY (1,21)
PSYCHIATRY (1,75)
PHARMACOLOGY & PHARMACY (1,15)
GENETICS & HEREDITY (1,94)
PEDIATRICS (1,36)
ENDOCRINOLOGY & METABOLISM (1,22)
CELL BIOLOGY (2,01)
BIOCHEMISTRY & MOLECULAR BIOLOGY (1,75)
MEDICINE, GENERAL & INTERNAL (3,85)
IMMUNOLOGY (1,16)
PERIPHERAL VASCULAR DISEASE (1,63)
HEMATOLOGY (1,31)
NEUROSCIENCES (1,27)
SURGERY (1,35)
RADIOLOGY, NUCLEAR MEDICINE & MEDICAL IMAGING (1,37)
CARDIAC & CARDIOVASCULAR SYSTEMS (1,63)
ONCOLOGY (1,35)
CLINICAL NEUROLOGY (1,47)
Share of the output (%)
Field (MNCS)
Figure 6a: Output and normalized impact per field (1998-2013/2014)UU UMC
Low (< 0,8) Average High (> 1,2)
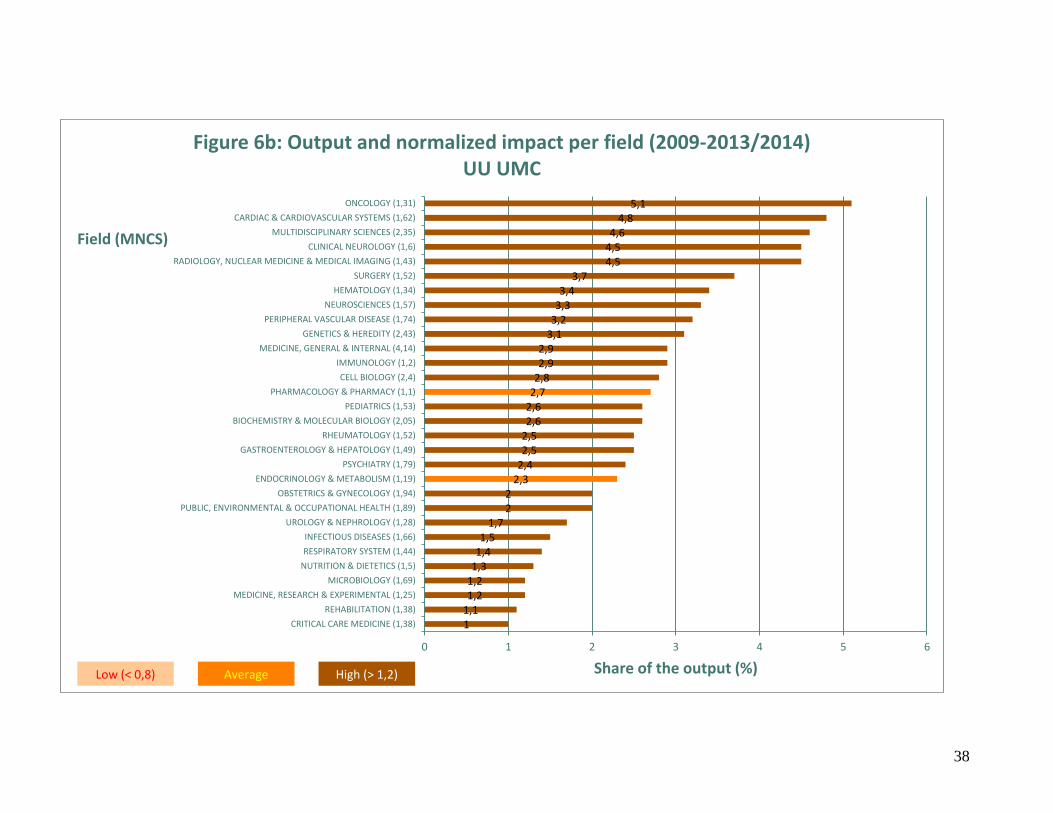
38
11,11,21,21,31,41,5
1,722
2,32,42,52,52,62,62,72,82,92,9
3,13,23,33,4
3,74,54,54,6
4,85,1
0 1 2 3 4 5 6
CRITICAL CARE MEDICINE (1,38)
REHABILITATION (1,38)
MEDICINE, RESEARCH & EXPERIMENTAL (1,25)
MICROBIOLOGY (1,69)
NUTRITION & DIETETICS (1,5)
RESPIRATORY SYSTEM (1,44)
INFECTIOUS DISEASES (1,66)
UROLOGY & NEPHROLOGY (1,28)
PUBLIC, ENVIRONMENTAL & OCCUPATIONAL HEALTH (1,89)
OBSTETRICS & GYNECOLOGY (1,94)
ENDOCRINOLOGY & METABOLISM (1,19)
PSYCHIATRY (1,79)
GASTROENTEROLOGY & HEPATOLOGY (1,49)
RHEUMATOLOGY (1,52)
BIOCHEMISTRY & MOLECULAR BIOLOGY (2,05)
PEDIATRICS (1,53)
PHARMACOLOGY & PHARMACY (1,1)
CELL BIOLOGY (2,4)
IMMUNOLOGY (1,2)
MEDICINE, GENERAL & INTERNAL (4,14)
GENETICS & HEREDITY (2,43)
PERIPHERAL VASCULAR DISEASE (1,74)
NEUROSCIENCES (1,57)
HEMATOLOGY (1,34)
SURGERY (1,52)
RADIOLOGY, NUCLEAR MEDICINE & MEDICAL IMAGING (1,43)
CLINICAL NEUROLOGY (1,6)
MULTIDISCIPLINARY SCIENCES (2,35)
CARDIAC & CARDIOVASCULAR SYSTEMS (1,62)
ONCOLOGY (1,31)
Share of the output (%)
Field (MNCS)
Figure 6b: Output and normalized impact per field (2009-2013/2014)UU UMC
Low (< 0,8) Average High (> 1,2)
39
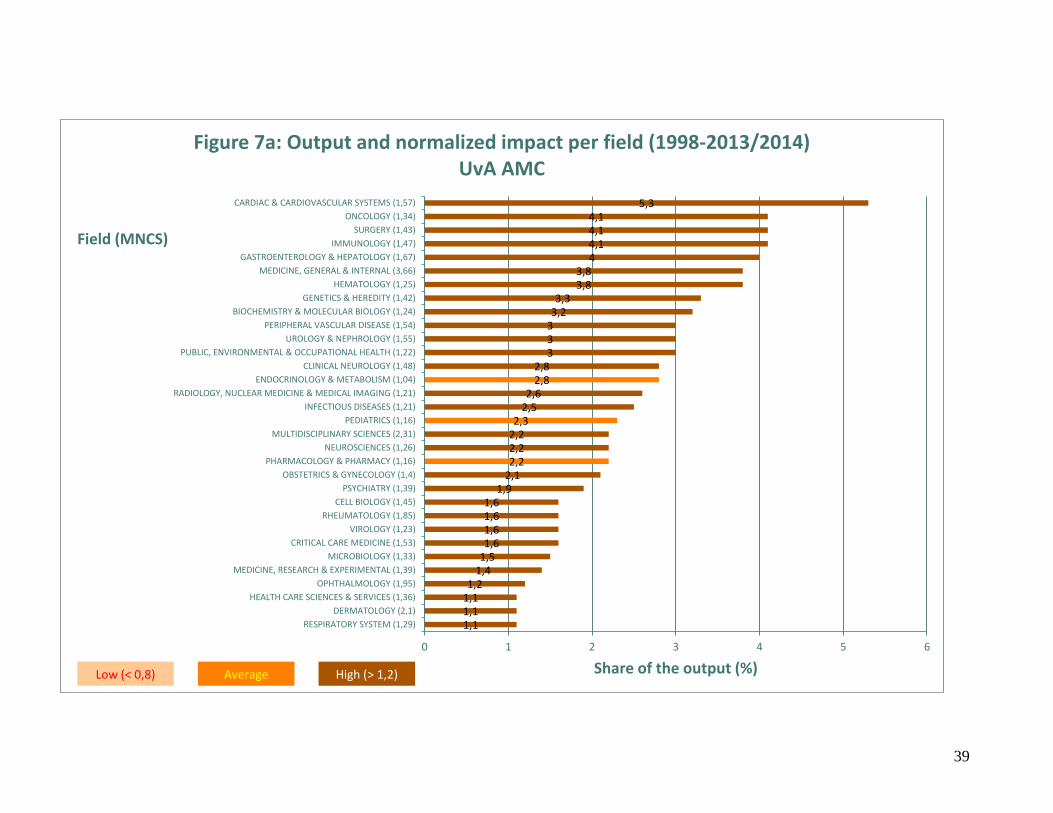
1,11,11,11,2
1,41,51,61,61,61,6
1,92,12,22,22,22,3
2,52,6
2,82,8
3333,23,3
3,83,8
44,14,14,1
5,3
0 1 2 3 4 5 6
RESPIRATORY SYSTEM (1,29)
DERMATOLOGY (2,1)
HEALTH CARE SCIENCES & SERVICES (1,36)
OPHTHALMOLOGY (1,95)
MEDICINE, RESEARCH & EXPERIMENTAL (1,39)
MICROBIOLOGY (1,33)
CRITICAL CARE MEDICINE (1,53)
VIROLOGY (1,23)
RHEUMATOLOGY (1,85)
CELL BIOLOGY (1,45)
PSYCHIATRY (1,39)
OBSTETRICS & GYNECOLOGY (1,4)
PHARMACOLOGY & PHARMACY (1,16)
NEUROSCIENCES (1,26)
MULTIDISCIPLINARY SCIENCES (2,31)
PEDIATRICS (1,16)
INFECTIOUS DISEASES (1,21)
RADIOLOGY, NUCLEAR MEDICINE & MEDICAL IMAGING (1,21)
ENDOCRINOLOGY & METABOLISM (1,04)
CLINICAL NEUROLOGY (1,48)
PUBLIC, ENVIRONMENTAL & OCCUPATIONAL HEALTH (1,22)
UROLOGY & NEPHROLOGY (1,55)
PERIPHERAL VASCULAR DISEASE (1,54)
BIOCHEMISTRY & MOLECULAR BIOLOGY (1,24)
GENETICS & HEREDITY (1,42)
HEMATOLOGY (1,25)
MEDICINE, GENERAL & INTERNAL (3,66)
GASTROENTEROLOGY & HEPATOLOGY (1,67)
IMMUNOLOGY (1,47)
SURGERY (1,43)
ONCOLOGY (1,34)
CARDIAC & CARDIOVASCULAR SYSTEMS (1,57)
Share of the output (%)
Field (MNCS)
Figure 7a: Output and normalized impact per field (1998-2013/2014)UvA AMC
Low (< 0,8) Average High (> 1,2)

40
1,11,21,31,31,41,4
1,81,81,81,9
2,42,42,52,52,52,62,72,82,8
3,13,13,23,33,4
3,9444,24,2
6,1
0 1 2 3 4 5 6 7
ORTHOPEDICS (1,03)
RESPIRATORY SYSTEM (1,38)
HEALTH CARE SCIENCES & SERVICES (1,12)
VIROLOGY (1,14)
CELL BIOLOGY (1,9)
MEDICINE, RESEARCH & EXPERIMENTAL (1,43)
CRITICAL CARE MEDICINE (1,68)
RHEUMATOLOGY (2,23)
NEUROSCIENCES (1,51)
PHARMACOLOGY & PHARMACY (1,16)
PSYCHIATRY (1,46)
BIOCHEMISTRY & MOLECULAR BIOLOGY (1,37)
PEDIATRICS (1,17)
ENDOCRINOLOGY & METABOLISM (1,21)
INFECTIOUS DISEASES (1,25)
OBSTETRICS & GYNECOLOGY (1,51)
CLINICAL NEUROLOGY (1,71)
PERIPHERAL VASCULAR DISEASE (1,41)
RADIOLOGY, NUCLEAR MEDICINE & MEDICAL IMAGING (1,22)
IMMUNOLOGY (1,83)
UROLOGY & NEPHROLOGY (1,57)
PUBLIC, ENVIRONMENTAL & OCCUPATIONAL HEALTH (1,14)
GENETICS & HEREDITY (1,79)
HEMATOLOGY (1,33)
SURGERY (1,56)
GASTROENTEROLOGY & HEPATOLOGY (1,73)
MEDICINE, GENERAL & INTERNAL (3,77)
ONCOLOGY (1,33)
MULTIDISCIPLINARY SCIENCES (1,97)
CARDIAC & CARDIOVASCULAR SYSTEMS (1,63)
Share of the output (%)
Field (MNCS)
Figure 7b: Output and normalized impact per field (2009-2013/2014)UvA AMC
Low (< 0,8) Average High (> 1,2)

41
1111,11,11,11,21,31,41,41,51,51,51,61,71,81,91,9
2,12,32,32,3
2,52,52,5
33,13,23,23,2
3,44,3
4,76,1
7,9
0 1 2 3 4 5 6 7 8 9
RESPIRATORY SYSTEM (1,45)
SPORT SCIENCES (1,68)
PSYCHOLOGY, MULTIDISCIPLINARY (1,33)
CRITICAL CARE MEDICINE (1,26)
ORTHOPEDICS (1,63)
REHABILITATION (1,59)
MICROBIOLOGY (1,31)
CELL BIOLOGY (1,43)
MEDICINE, RESEARCH & EXPERIMENTAL (1,59)
UROLOGY & NEPHROLOGY (1,5)
GERIATRICS & GERONTOLOGY (1,58)
HEALTH CARE SCIENCES & SERVICES (1,64)
PATHOLOGY (1,89)
NUTRITION & DIETETICS (1,32)
PERIPHERAL VASCULAR DISEASE (1,54)
MULTIDISCIPLINARY SCIENCES (2,43)
GASTROENTEROLOGY & HEPATOLOGY (1,35)
PHARMACOLOGY & PHARMACY (1,32)
OBSTETRICS & GYNECOLOGY (1,37)
BIOCHEMISTRY & MOLECULAR BIOLOGY (1,25)
PEDIATRICS (1,22)
HEMATOLOGY (1,72)
SURGERY (1,56)
CARDIAC & CARDIOVASCULAR SYSTEMS (1,75)
GENETICS & HEREDITY (2,11)
MEDICINE, GENERAL & INTERNAL (3,65)
RADIOLOGY, NUCLEAR MEDICINE & MEDICAL IMAGING (1,59)
PUBLIC, ENVIRONMENTAL & OCCUPATIONAL HEALTH (1,54)
IMMUNOLOGY (1,57)
RHEUMATOLOGY (1,56)
PSYCHIATRY (1,57)
NEUROSCIENCES (1,8)
ENDOCRINOLOGY & METABOLISM (1,67)
CLINICAL NEUROLOGY (2,1)
ONCOLOGY (1,54)
Share of the output (%)
Field (MNCS)
Figure 8a: Output and normalized impact per field (1998-2013/2014)VUmc
Low (< 0,8) Average High (> 1,2)

42
111111,11,11,21,31,31,41,51,51,6
1,91,91,91,9
2,12,1
2,32,4
2,62,72,82,9
3,13,23,3
3,83,9
44,2
6,27
0 1 2 3 4 5 6 7 8
CRITICAL CARE MEDICINE (1,51)
INFECTIOUS DISEASES (1,45)
RESPIRATORY SYSTEM (1,62)
SPORT SCIENCES (1,62)
PATHOLOGY (1,9)
ORTHOPEDICS (1,43)
REHABILITATION (1,28)
PSYCHOLOGY, MULTIDISCIPLINARY (1,36)
MEDICINE, RESEARCH & EXPERIMENTAL (1,67)
UROLOGY & NEPHROLOGY (1,56)
CELL BIOLOGY (1,79)
PERIPHERAL VASCULAR DISEASE (1,4)
GERIATRICS & GERONTOLOGY (1,49)
PHARMACOLOGY & PHARMACY (1,47)
HEMATOLOGY (1,94)
HEALTH CARE SCIENCES & SERVICES (1,49)
GASTROENTEROLOGY & HEPATOLOGY (1,46)
NUTRITION & DIETETICS (1,14)
OBSTETRICS & GYNECOLOGY (1,3)
BIOCHEMISTRY & MOLECULAR BIOLOGY (1,43)
SURGERY (1,77)
IMMUNOLOGY (1,99)
PEDIATRICS (1,23)
CARDIAC & CARDIOVASCULAR SYSTEMS (1,92)
MEDICINE, GENERAL & INTERNAL (3,93)
RADIOLOGY, NUCLEAR MEDICINE & MEDICAL IMAGING (1,71)
GENETICS & HEREDITY (2,69)
RHEUMATOLOGY (1,67)
MULTIDISCIPLINARY SCIENCES (2,05)
PUBLIC, ENVIRONMENTAL & OCCUPATIONAL HEALTH (1,36)
NEUROSCIENCES (2,15)
PSYCHIATRY (1,67)
ENDOCRINOLOGY & METABOLISM (1,91)
CLINICAL NEUROLOGY (2,42)
ONCOLOGY (1,54)
Share of the output (%)
Field (MNCS)
Figure 8b: Output and normalized impact per field (2009-2013/2014)VUmc
Low (< 0,8) Average High (> 1,2)

43
1111,11,21,31,31,31,4
1,71,9
22,12,22,32,32,42,52,62,6
2,9333,13,23,23,33,43,53,6
4,65,9
0 1 2 3 4 5 6 7
DENTISTRY/ORAL SURGERY & MEDICINE (1,21)
DERMATOLOGY (1,66)
PATHOLOGY (1,49)
HEALTH CARE SCIENCES & SERVICES (1,38)
NUTRITION & DIETETICS (1,35)
INFECTIOUS DISEASES (1,33)
RESPIRATORY SYSTEM (1,57)
MEDICINE, RESEARCH & EXPERIMENTAL (1,45)
MICROBIOLOGY (1,46)
OBSTETRICS & GYNECOLOGY (1,32)
CELL BIOLOGY (1,47)
MULTIDISCIPLINARY SCIENCES (2,69)
PEDIATRICS (1,23)
RHEUMATOLOGY (1,69)
PSYCHIATRY (1,47)
GASTROENTEROLOGY & HEPATOLOGY (1,44)
UROLOGY & NEPHROLOGY (1,63)
PERIPHERAL VASCULAR DISEASE (1,47)
PUBLIC, ENVIRONMENTAL & OCCUPATIONAL HEALTH (1,43)
PHARMACOLOGY & PHARMACY (1,14)
HEMATOLOGY (1,33)
BIOCHEMISTRY & MOLECULAR BIOLOGY (1,3)
GENETICS & HEREDITY (1,56)
MEDICINE, GENERAL & INTERNAL (3,6)
IMMUNOLOGY (1,31)
ENDOCRINOLOGY & METABOLISM (1,27)
RADIOLOGY, NUCLEAR MEDICINE & MEDICAL IMAGING (1,41)
NEUROSCIENCES (1,29)
SURGERY (1,37)
CLINICAL NEUROLOGY (1,56)
CARDIAC & CARDIOVASCULAR SYSTEMS (1,63)
ONCOLOGY (1,38)
Share of the output (%)
Field (MNCS)
Figure 9a: Output and normalized impact per field (1998-2013/2014)All UMCs together
Low (< 0,8) Average High (> 1,2)
44
11111,21,31,31,31,41,4
1,71,9
2,22,22,22,32,42,42,42,52,52,6
2,82,9
33,13,2
3,43,4
3,63,7
55,5
0 1 2 3 4 5 6
CRITICAL CARE MEDICINE (1,58)
DENTISTRY/ORAL SURGERY & MEDICINE (1,28)
ORTHOPEDICS (1,25)
REHABILITATION (1,31)
MICROBIOLOGY (1,63)
NUTRITION & DIETETICS (1,35)
RESPIRATORY SYSTEM (1,55)
MEDICINE, RESEARCH & EXPERIMENTAL (1,56)
INFECTIOUS DISEASES (1,45)
HEALTH CARE SCIENCES & SERVICES (1,27)
OBSTETRICS & GYNECOLOGY (1,42)
CELL BIOLOGY (1,8)
PEDIATRICS (1,27)
UROLOGY & NEPHROLOGY (1,92)
GASTROENTEROLOGY & HEPATOLOGY (1,59)
PHARMACOLOGY & PHARMACY (1,22)
PERIPHERAL VASCULAR DISEASE (1,42)
RHEUMATOLOGY (1,76)
PSYCHIATRY (1,65)
BIOCHEMISTRY & MOLECULAR BIOLOGY (1,45)
HEMATOLOGY (1,45)
IMMUNOLOGY (1,47)
PUBLIC, ENVIRONMENTAL & OCCUPATIONAL HEALTH (1,47)
MEDICINE, GENERAL & INTERNAL (3,97)
ENDOCRINOLOGY & METABOLISM (1,39)
NEUROSCIENCES (1,56)
GENETICS & HEREDITY (1,88)
RADIOLOGY, NUCLEAR MEDICINE & MEDICAL IMAGING (1,48)
SURGERY (1,47)
CLINICAL NEUROLOGY (1,69)
MULTIDISCIPLINARY SCIENCES (2,13)
CARDIAC & CARDIOVASCULAR SYSTEMS (1,6)
ONCOLOGY (1,53)
Share of the output (%)
Field (MNCS)
Figure 9b: Output and normalized impact per field (2009-2013/2014)All UMCs together
Low (< 0,8) Average High (> 1,2)

45
2.3 Landscape of Dutch academic medical centers
In this section, the focus is on various aspects of scientific activity, like first authorships,
international cooperation, single address output. As this section contains descriptions
on various aspects of scientific research and publishing, its contents summarizes the
situation among the Dutch academic medical centers.
Figure 10a and Figure 10b contain the combined insight of output numbers in the
period 1998-2013/2014 and 2009-2013/2014 respectively, and the field normalized
impact (MNCS) of this output. Figure 11a contains the combined insight of output
numbers in the period 1998-2013/2014 and the journal-to-field normalized impact
(MNJS) of this output, while Figure 11b contains similar information for the period
2009-2013/2014. Figure 12a contains the combined insight of output numbers in the
period 1998-2013/2014 and the journal impact (MNCS/MNJS) of this output, whereas
Figure 12b contains similar data for the period 2009-2013/2014.
Figures 13a to 13c display the trend scores for the three impact indicators displayed in
the three previous sets of graphs, MNCS, MNJS, and MNCS/MNJS. This is added to
show the development behind the two snap shots presented by the previous graphs.
Figure 14a and Figure 14b contain the output resulting from first authorships as a
share of the total output of the eight Dutch academic medical centers, combined with
the MNCS values of that part of their output, in the periods 1998-2013/2014 and 2009-
2013/2014.
Figure 15 contains the trend impact data behind the development of first authored
publications by each of the Dutch UMCS.
Figure 16a and Figure 16b focus on the part of the output of the Dutch academic
medical centers that results from international collaboration, while Figure 18a and
Figure 18b concentrate on the share of the output that is the results from every
individual academic medical center, in which no other institute is involved.
Figures 17 and 19 contain trend impact data (MNCS) for both the characteristics of
scientific activity, international co-publishing and single address output, to show the
development behind the two sets of graphs presented previously.

46
Figure 10a: Output compared to average field impact, 1998-2013/2014
Erasmus MC
LU MC
Radboud UMC
UMC Maastricht
UMCG
UU UMC
UvA AMC
VUmc
0,80
0,90
1,00
1,10
1,20
1,30
1,40
1,50
1,60
1,70
1,80
0,00 5000,00 10000,00 15000,00 20000,00 25000,00 30000,00 35000,00
mncs
Total publications
Figure 10b: Output compared to average field impact, 2009-2013/2014
Erasmus MC
LU MC Radboud UMCUMC Maastricht
UMCG
UU UMC
UvA AMC
VUmc
0,80
1,00
1,20
1,40
1,60
1,80
2,00
0,00 2000,00 4000,00 6000,00 8000,00 10000,00 12000,00 14000,00
mncs
total publications

47
Figure 11a: Output compared to average journal-to-field impact, 1998-
2013/2014
Erasmus MC
LU MC
Radboud UMC
UMC Maastricht
UMCG
UU UMC
UvA AMCVUmc
0,80
0,90
1,00
1,10
1,20
1,30
1,40
1,50
0,00 5000,00 10000,00 15000,00 20000,00 25000,00 30000,00 35000,00
mnjs
total publications
Figure 11b: Output compared to average journal-to-field impact, 2009-
2013/2014
Erasmus MC
LU MC
Radboud UMC
UMC Maastricht
UMCG
UU UMC
UvA AMCVUmc
0,80
0,90
1,00
1,10
1,20
1,30
1,40
1,50
1,60
0,00 2000,00 4000,00 6000,00 8000,00 10000,00 12000,00 14000,00
mnjs
total publications

48
Figure 12a: Output compared to average journal impact, 1998-2013/2014
Erasmus MC
LU MCRadboud UMC
UMC Maastricht
UMCG
UU UMC UvA AMC
VUmc
0,80
0,85
0,90
0,95
1,00
1,05
1,10
1,15
1,20
1,25
0,00 5000,00 10000,00 15000,00 20000,00 25000,00 30000,00 35000,00
mncs/mnjs
total publications
Figure 12b: Output compared to average journal impact, 2009-2013/2014
Erasmus MC
LU MC
Radboud UMC
UMC Maastricht
UMCG
UU UMCUvA AMC
VUmc
0,80
0,85
0,90
0,95
1,00
1,05
1,10
1,15
1,20
1,25
0,00 2000,00 4000,00 6000,00 8000,00 10000,00 12000,00 14000,00
mncs/mnjs
total publications

49
Figure 13a: Trend analysis of the field-normalized impact (MNCS) for all Dutch
UMCS, 1998-2013/2014.
0,80
1,00
1,20
1,40
1,60
1,80
2,00
1998-2001
1999-2002
2000-2003
2001-2004
2002-2005
2003-2006
2004-2007
2005-2008
2006-2009
2007-2010
2008-2011
2009-2012
2010-2013
Erasmus MC
LU MC
Radboud UMC
UMC Maastricht
UMCG
UU UMC
UvA AMC
VUmc
mncs
total publications
Figure 13b: Trend analysis of the journal-to-field normalized impact (MNJS) for
all Dutch UMCS, 1998-2013/2014.
0,80
0,90
1,00
1,10
1,20
1,30
1,40
1,50
1,60
1998-2001
1999-2002
2000-2003
2001-2004
2002-2005
2003-2006
2004-2007
2005-2008
2006-2009
2007-2010
2008-2011
2009-2012
2010-2013
Erasmus MC
LU MC
Radboud UMC
UMC Maastricht
UMCG
UU UMC
UvA AMC
VUmc
mnjs
total publications

50
Figure 13c: Trend analysis of the average journal impact, (MNCS/MNJS) for all
Dutch UMCS, 1998-2013/2014.
0,80
0,85
0,90
0,95
1,00
1,05
1,10
1,15
1,20
1,25
1,30
1998-2001
1999-2002
2000-2003
2001-2004
2002-2005
2003-2006
2004-2007
2005-2008
2006-2009
2007-2010
2008-2011
2009-2012
2010-2013
Erasmus MC
LU MC
Radboud UMC
UMC Maastricht
UMCG
UU UMC
UvA AMC
VUmc
mncs/mnjs
total publications

51
Figure 14a: Output compared to average field impact (MNCS), first authorships
only, 1998-2013/2014
Erasmus MC
LU MC
Radboud UMC
UMC Maastricht
UMCG
UU UMCUvA AMC
VUmc
0,80
0,90
1,00
1,10
1,20
1,30
1,40
1,50
0 2000 4000 6000 8000 10000 12000 14000 16000 18000
mncs
total publications
Figure 14b: Output compared to average field impact (MNCS), first authorships
only, 2009-2013/2014
Erasmus MC
LU MC
Radboud UMCUMC Maastricht
UMCG
UU UMC
UvA AMC
VUmc
0,00
0,20
0,40
0,60
0,80
1,00
1,20
1,40
1,60
0 1000 2000 3000 4000 5000 6000 7000
mncs
total publications

52
Figure 15: Trend analysis of the field-normalized impact (MNCS) for all Dutch
UMCS (first authorship output), 1998-2013/2014.
0,80
0,90
1,00
1,10
1,20
1,30
1,40
1,50
1,60
1998-2001
1999-2002
2000-2003
2001-2004
2002-2005
2003-2006
2004-2007
2005-2008
2006-2009
2007-2010
2008-2011
2009-2012
2010-2013
Erasmus MC
LU MC
Radboud UMC
UMC Maastricht
UMCG
UU UMC
UvA AMC
VUmc
mncs
total publications

53
Figure 16a: Output compared to average field impact (MNCS), international
cooperation only, 1998-2013/2014
Erasmus MC
LU MC
Radboud UMCUMC Maastricht
UMCG
UU UMC
UvA AMC
VUmc
0,80
1,00
1,20
1,40
1,60
1,80
2,00
2,20
2,40
0 2000 4000 6000 8000 10000 12000 14000
mncs
total publications
Figure 16b: Output compared to average field impact (MNCS), international
cooperation only, 2009-2013/2014
Erasmus MC
LU MC
Radboud UMC
UMC Maastricht
UMCG
UU UMC
UvA AMC
VUmc
0,80
1,00
1,20
1,40
1,60
1,80
2,00
2,20
2,40
0 1000 2000 3000 4000 5000 6000 7000
mncs
total publications

54
Figure 17: Trend analysis of the field-normalized impact (MNCS) for all Dutch
UMCS (international cooperation output), 1998-2013/2014
0,80
1,00
1,20
1,40
1,60
1,80
2,00
2,20
2,40
2,60
1998-2001
1999-2002
2000-2003
2001-2004
2002-2005
2003-2006
2004-2007
2005-2008
2006-2009
2007-2010
2008-2011
2009-2012
2010-2013
Erasmus MC
LU MC
Radboud UMC
UMC Maastricht
UMCG
UU UMC
UvA AMC
VUmc
mncs
total publications

55
Figure 18a: Output compared to average field impact (MNCS), single institute
only, 1998-2012/20123
Erasmus MC
LU MC
Radboud UMC
UMC Maastricht
UMCG
UU UMC
UvA AMC
VUmc
0,80
0,90
1,00
1,10
1,20
1,30
1,40
0 1000 2000 3000 4000 5000 6000 7000 8000
mncs
total publications
Figure 18b: Output compared to average field impact (MNCS), single institute
only, 2009-2013/2014
Erasmus MC
LU MC
Radboud UMC
UMC Maastricht
UMCG
UU UMC
UvA AMC
VUmc
0,80
0,90
1,00
1,10
1,20
1,30
1,40
1,50
0 500 1000 1500 2000 2500 3000
mncs
total publications

56
Figure 19: Trend analysis of the field-normalized impact (MNCS) for all Dutch
UMCS (single institute output), 1998-2013/2014.
0,80
0,90
1,00
1,10
1,20
1,30
1,40
1,50
1,60
1998-2001
1999-2002
2000-2003
2001-2004
2002-2005
2003-2006
2004-2007
2005-2008
2006-2009
2007-2010
2008-2011
2009-2012
2010-2013
Erasmus MC
LU MC
Radboud UMC
UMC Maastricht
UMCG
UU UMC
UvA AMC
VUmc
mncs
total publications

57
2.4 Analysis of top-research
Per medical center, a break-down into different classes of journal impact is made. While
the data in Table 1 show the overall situation, Table 5 contains the results of an analysis
when the publications from each medical center are analyzed according to the journal-
to-field impact classes that the publications can be counted in.
We distinguish five classes, the first class is the set of publications where the MNJS of
the journal is ranging between 0.00 and 0.40 (Class A), the second class is ranging from
0.41 to 0.80 (Class B), the third class is ranging from 0.81 to 1.20 (Class C), the fourth
class ranges from 1.21 to 1.60 (Class D), while finally the fifth class contains all
publications in journals with a higher MNJS value as 1.61 (Class E).

58
Table 5a: Distribution of output of Dutch academic medical centers over journal impact classes, 1998-2013/2014
P TCS MCS MNCS MNJS PP(top 10%) PP(uncited) %Self Cit Int Cov
Erasmus MC A 1442,75 11183,25 7,75 0,33 0,28 1% 17% 19% 88%
Erasmus MC B 6301,00 90360,00 14,34 0,73 0,63 5% 7% 18% 89%
Erasmus MC C 8819,75 176088,75 19,97 1,09 0,99 11% 5% 18% 89%
Erasmus MC D 3155,00 85720,25 27,17 1,55 1,29 17% 4% 16% 89%
Erasmus MC E 9902,00 553901,00 55,94 2,92 2,49 36% 2% 15% 90%
LU MC A 1183,25 8908,00 7,53 0,31 0,27 1% 19% 19% 89%
LU MC B 4863,50 75270,25 15,48 0,74 0,63 5% 7% 18% 91%
LU MC C 6517,50 138906,75 21,31 1,14 0,99 11% 5% 18% 92%
LU MC D 2228,50 55694,75 24,99 1,32 1,29 15% 3% 17% 92%
LU MC E 6978,75 352590,25 50,52 2,65 2,45 34% 2% 16% 93%
Radboud UMC A 1221,25 10510,00 8,61 0,34 0,28 1% 14% 17% 88%
Radboud UMC B 5305,00 70752,50 13,34 0,69 0,63 4% 8% 17% 89%
Radboud UMC C 6779,00 124884,25 18,42 1,06 0,98 10% 5% 18% 89%
Radboud UMC D 2397,75 52290,25 21,81 1,35 1,30 16% 4% 16% 89%
Radboud UMC E 6900,25 304828,25 44,18 2,62 2,38 33% 2% 16% 91%
UMC Maastricht A 1128,00 9122,75 8,09 0,33 0,27 1% 18% 20% 85%
UMC Maastricht B 4630,75 66866,75 14,44 0,73 0,63 5% 8% 17% 86%
UMC Maastricht C 6379,75 127382,25 19,97 1,15 0,99 11% 5% 17% 87%
UMC Maastricht D 2341,00 61467,75 26,26 1,49 1,29 17% 3% 16% 87%
UMC Maastricht E 6107,25 309240,50 50,63 2,79 2,27 33% 2% 14% 88%

59
P TCS MCS MNCS MNJS PP(top 10%) PP(uncited) %Self Cit Int Cov
UMCG A 1098,75 7454,50 6,78 0,31 0,27 1% 19% 18% 87%
UMCG B 4221,00 52450,75 12,43 0,68 0,63 4% 10% 17% 89%
UMCG C 5955,50 101648,25 17,07 1,03 0,99 10% 6% 17% 89%
UMCG D 2180,25 41890,25 19,21 1,33 1,29 15% 6% 18% 89%
UMCG E 6114,25 250028,75 40,89 2,54 2,41 32% 3% 16% 90%
UU UMC A 858,75 6618,00 7,71 0,34 0,28 1% 16% 16% 89%
UU UMC B 4873,00 69614,50 14,29 0,71 0,63 5% 8% 16% 91%
UU UMC C 6658,75 133752,50 20,09 1,10 0,99 10% 5% 16% 91%
UU UMC D 2509,00 61834,75 24,65 1,39 1,29 16% 4% 16% 91%
UU UMC E 7675,25 392296,50 51,11 2,76 2,46 35% 2% 14% 92%
UvA AMC A 1681,50 12668,00 7,53 0,32 0,27 1% 20% 19% 88%
UvA AMC B 6698,75 91590,25 13,67 0,71 0,62 5% 9% 17% 89%
UvA AMC C 8143,50 157823,25 19,38 1,09 0,99 10% 6% 17% 90%
UvA AMC D 3227,25 79653,75 24,68 1,42 1,29 17% 4% 17% 89%
UvA AMC E 8718,25 406390,25 46,61 2,74 2,47 34% 3% 15% 91%
VUmc A 912,00 7199,25 7,89 0,34 0,28 1% 20% 19% 88%
VUmc B 4276,75 61118,00 14,29 0,75 0,63 5% 8% 18% 88%
VUmc C 6265,50 125979,50 20,11 1,18 0,99 12% 5% 17% 89%
VUmc D 2200,25 59370,75 26,98 1,57 1,29 20% 5% 16% 89%
VUmc E 6386,00 335380,75 52,52 2,96 2,37 37% 3% 15% 90%

60
Table 5b: Distribution of output of Dutch academic medical centers over journal impact classes, 2009-2013/2014
P TCS MCS MNCS MNJS PP(top 10%) PP(uncited) %Self Cit Int Cov
Erasmus MC A 367,75 1090,00 2,96 0,33 0,28 0% 30% 22% 88%
Erasmus MC B 2188,75 13306,75 6,08 0,76 0,63 6% 15% 22% 89%
Erasmus MC C 3671,50 32381,50 8,82 1,10 1,00 11% 9% 22% 89%
Erasmus MC D 1383,25 18195,50 13,15 1,53 1,29 17% 7% 18% 89%
Erasmus MC E 4352,00 115797,75 26,61 3,01 2,61 37% 4% 21% 91%
LU MC A 304,75 1111,50 3,65 0,37 0,29 2% 35% 23% 90%
LU MC B 1653,50 11849,75 7,17 0,77 0,64 6% 13% 22% 92%
LU MC C 2811,50 28162,25 10,02 1,15 1,00 12% 8% 21% 92%
LU MC D 900,25 9576,75 10,64 1,34 1,29 16% 7% 21% 92%
LU MC E 3048,75 77767,50 25,51 2,76 2,59 35% 4% 22% 93%
Radboud UMC A 291,25 1068,00 3,67 0,41 0,30 1% 29% 22% 89%
Radboud UMC B 1943,50 11110,25 5,72 0,69 0,64 4% 16% 22% 89%
Radboud UMC C 2852,50 24780,25 8,69 1,08 0,99 11% 10% 21% 90%
Radboud UMC D 1096,25 10133,25 9,24 1,32 1,30 15% 8% 22% 89%
Radboud UMC E 3276,50 78236,25 23,88 2,86 2,51 37% 4% 20% 91%
UMC Maastricht A 284,00 800,00 2,82 0,32 0,29 0% 37% 31% 84%
UMC Maastricht B 1625,00 9580,25 5,90 0,73 0,63 5% 17% 21% 87%
UMC Maastricht C 2727,75 24034,00 8,81 1,13 0,99 11% 10% 22% 88%
UMC Maastricht D 1008,00 10965,75 10,88 1,44 1,30 17% 6% 23% 89%
UMC Maastricht E 2576,50 61257,00 23,78 2,89 2,41 36% 5% 20% 89%

61
P TCS MCS MNCS MNJS PP(top 10%) PP(uncited) %Self Cit Int Cov
UMCG A 327,50 913,00 2,79 0,31 0,27 1% 34% 25% 86%
UMCG B 1728,25 10540,50 6,10 0,71 0,63 5% 17% 19% 89%
UMCG C 2881,00 22941,75 7,96 1,02 0,99 9% 11% 21% 90%
UMCG D 1138,75 11597,25 10,18 1,40 1,30 16% 10% 22% 89%
UMCG E 3161,75 71956,75 22,76 2,72 2,56 35% 5% 21% 91%
UU UMC A 258,50 931,25 3,60 0,38 0,29 1% 30% 21% 90%
UU UMC B 1769,75 10729,00 6,06 0,72 0,64 5% 15% 21% 91%
UU UMC C 2948,25 26080,25 8,85 1,06 1,00 10% 9% 22% 92%
UU UMC D 1065,50 11081,00 10,40 1,38 1,29 16% 7% 20% 91%
UU UMC E 3536,00 85753,00 24,25 2,87 2,59 37% 4% 20% 93%
UvA AMC A 545,50 1414,25 2,59 0,31 0,27 1% 36% 26% 88%
UvA AMC B 2696,50 16279,00 6,04 0,72 0,63 5% 15% 22% 89%
UvA AMC C 3797,00 31861,75 8,39 1,04 1,00 10% 10% 21% 90%
UvA AMC D 1479,75 15427,75 10,43 1,39 1,30 17% 7% 22% 89%
UvA AMC E 4088,75 96911,50 23,70 2,93 2,61 36% 5% 19% 91%
VUmc A 325,50 902,00 2,77 0,33 0,28 1% 38% 26% 88%
VUmc B 1785,00 10335,50 5,79 0,76 0,63 6% 17% 23% 87%
VUmc C 2966,75 26929,25 9,08 1,18 0,99 12% 9% 22% 89%
VUmc D 992,50 10705,25 10,79 1,52 1,30 19% 9% 20% 88%
VUmc E 3093,75 79399,25 25,66 3,06 2,50 38% 4% 21% 91%

62
Another method of showing the distribution over the five classes is shown in Figures
20a and 20b. While Figure 20a contains the alphabetical representation of the medical
centers, the data in Figure 20b are sorted by descending share in the two highest
classes (thus containing all publications in journals with a MNJS value higher than 1.20).
Additional graph 20c displays the level of the impact (MNCS scores) for each of the
academic medical centers, to provide an impression of the average effect of the
publishing across various classes of journal impact.
Similar analyses are conducted for the more recent period 2009-2013/2014, resulting in
consecutive graphs Figure 21a (displaying the alphabetical; order of the UMC’s and the
distribution of output over classes of MNJS values), Figure 21b, which displays the
ordered UMC’s, by grouping the two highest MNJS-value classes, and finally Figure 21c,
which displays the actual impact scores related to the distribution of output over MNJS-
classes.
Figure 20a: Distribution of output over journal-to-field impact classes (MNJS),
1998-2013/2014 0% 10% 20% 30% 40% 50% 60% 70% 80% 90% 100%
Erasmus MC
LU MC
Radboud UMC
UMC Maastricht
UMCG
UU UMC
UvA AMC
VUmc
0 >MNJS <=0.40
0.40 > MNJS <= 0.80
0.80 > MNJS <= 1.20
1.20 > MNJS <=1.60
MNJS > 1.60

63
Figure 20b: Distribution of output over journal-to-field impact classes (by
descending highest share in the two classes MNJS > 1.20), 1998-2013/2014 0% 10% 20% 30% 40% 50% 60% 70% 80% 90% 100%
UU UMC
Erasmus MC
VUmc
UMCG
LU MC
UvA AMC
Radboud UMC
UMC Maastricht
0 >MNJS <=0.40
0.40 > MNJS <= 0.80
0.80 > MNJS <= 1.20
1.20 > MNJS <=1.60
MNJS > 1.60
Figure 20c: Impact level (MNCS) of output over journal-to-field impact classes,
1998-2013/2014
0,00
0,50
1,00
1,50
2,00
2,50
3,00
3,50
Erasmus MC LU MC Radboud UMC UMC Maastricht UMCG UU UMC UvA AMC VUmc
0 >MNJS <=0.40
0.40 > MNJS <= 0.80
0.80 > MNJS <= 1.20
1.20 > MNJS <=1.60
MNJS > 1.60
mncs

64
Figure 21a: Distribution of output over journal-to-field impact classes (MNJS),
2009-2013/2014 0% 10% 20% 30% 40% 50% 60% 70% 80% 90% 100%
Erasmus MC
LU MC
Radboud UMC
UMC Maastricht
UMCG
UU UMC
UvA AMC
VUmc
0 >MNJS <=0.40
0.40 > MNJS <= 0.80
0.80 > MNJS <= 1.20
1.20 > MNJS <=1.60
MNJS > 1.60
Figure 21b: Distribution of output over journal-to-field impact classes (by
descending highest share in the two classes MNJS > 1.20), 2009-2013/2014 0% 10% 20% 30% 40% 50% 60% 70% 80% 90% 100%
UU UMC
Erasmus MC
UMCG
Radboud UMC
LU MC
VUmc
UvA AMC
UMC Maastricht
0 >MNJS <=0.40
0.40 > MNJS <= 0.80
0.80 > MNJS <= 1.20
1.20 > MNJS <=1.60
MNJS > 1.60

65
Figure 21c: Impact level (MNCS) of output over journal-to-field impact classes,
2009-2013/2014
0,00
0,50
1,00
1,50
2,00
2,50
3,00
3,50
Erasmus MC LU MC Radboud UMC UMC Maastricht UMCG UU UMC UvA AMC VUmc
0 >MNJS <=0.40
0.40 > MNJS <= 0.80
0.80 > MNJS <= 1.20
1.20 > MNJS <=1.60
MNJS > 1.60
mncs
Yet another aspect of publishing in top journals is shown in Figures 22 and 23.
In Figure 22, one finds the number of publications in the field Medicine, General and
Internal. This field contains general medicine journals with a multidisciplinary medical
content, like The Lancet, JAMA, the New England Journal of Medicine, etc. The field
also contains some local/national general medicine journals as well as journals in small
specialties, like family practice, diabetes research, etc. In this profile, the benchmark
indicator is not MNCS, but we have chosen MNCS/MNJS, as this is a more accurate
indicator in this particular case, describing the performance in top-journals.
Figure 23 contains the output numbers in international multidisciplinary journals like
Science, Nature, and the Proceedings of the National Academy of Sciences of the
USA. Again, as above, in this profile, the benchmark indicator is not MNCS, but we have
chosen MNCS/MNJS, as this is a more accurate indicator in this particular case,
describing the performance in top-journals. As in the previous research profiles, the
color coding in the graph indicates the impact level, dark colored bars indicate a high
impact, while the lighter colored bars indicate an average impact level.

66
Figure 22: Output numbers compared to average journal impact (MNCS/MNJS)
in Medicine, general & internal, 2009-2013/2014. 0,00 100,00 200,00 300,00 400,00 500,00 600,00
Erasmus MC (1,54)
LU MC (1,09)
Radboud UMC (1,28)
UMC Maastricht (1,47)
UMCG (1,16)
UU UMC (1,13)
UvA AMC (1,23)
VUmc (1,44)
Figure 23: Output numbers compared to average journal impact (MNCS/MNJS)
in Multidisciplinary journals, 2009-2012/20123.

67
0,00 100,00 200,00 300,00 400,00 500,00 600,00
Erasmus MC (1,34)
LU MC (1,44)
Radboud UMC (1,18)
UMC Maastricht (1,14)
UMCG (1,05)
UU UMC (1,19)
UvA AMC (1,09)
VUmc (1,12)

68
A third bibliometric approach of scientific top research or excellence is shown in Table 6
and Figure 24. As indicated before, the top paper analysis can be extended to other
parts of the total publications set, and accordingly, other parts of the distribution of
impact over publications. Here we present the presence of Dutch academic medical
centers among respectively the top-50%, top-20%, the top-10%, the top-5%, the top-2%
and the top-1% most highly cited publications in the fields these centers are active in. In
Table 6, we present the output that relates to the actual numbers of publications per
UMC within the various sub-sets of the total distribution most highly cited publications
in the fields these centers are active in, while Figure 24 displays these relative outcomes
for the eight Dutch academic medical centers graphically.

69
Table 6: Overview of the presence of Dutch academic medical centers in the top-x most highly cited publications, 1998-2013/2014
p 98-2012
P in Top 1% PP(top 1%)
P in Top 2% PP(top 2%)
P in Top 5% PP(top 5%)
P in Top 10% PP(top 10%)
P in Top 20% PP(top 20%)
P in Top 50% PP(top 50%)
Erasmus MC 29620,5 702,3 2% 1298,9 4% 2914,8 10% 5404,0 18% 9617,7 32% 19747,8 67%
LU MC 21771,5 433,0 2% 833,5 4% 1936,6 9% 3669,4 17% 6748,6 31% 14270,0 66%
Radboud UMC 22603,25 413,2 2% 791,6 4% 1864,8 8% 3590,6 16% 6696,6 30% 14557,2 64%
UMC Maastricht 20586,75 453,1 2% 793,1 4% 1788,6 9% 3362,2 16% 6264,1 30% 13501,4 66%
UMCG 19569,75 324,9 2% 668,9 3% 1556,7 8% 3044,4 16% 5761,7 29% 12633,6 65%
UU UMC 22574,75 461,1 2% 895,9 4% 2129,9 9% 4010,9 18% 7321,5 32% 15149,7 67%
UvA AMC 28469,25 590,7 2% 1070,0 4% 2478,3 9% 4692,7 16% 8672,2 30% 18386,6 65%
VUmc 20040,5 468,3 2% 913,1 5% 2073,8 10% 3778,8 19% 6764,4 34% 13598,0 68%

70
Figure 24: Presence of the Dutch academic medical centers in Top-50% / Top-
20% / Top-10% / Top-5% / Top-2% and Top-1% most highly cited publications
worldwide, 1998-2013/2014
0%
10%
20%
30%
40%
50%
60%
70%
80%
Erasmus MC LU MC Radboud UMC UMC Maastricht UMCG UU UMC UvA AMC VUmc
PP(top_1%)
PP(top_2%)
PP(top_5%)
PP(top_10%)
PP(top_20%)
PP(top_50%)

71
2.5 Analysis of the publication strategy: research profiles with MNJS values
In this section, we focus on the journals in which the output was published across the
fields in which the medical centers were active in. These profiles are similar to the
research profiles, with this difference that the MNJS is now used to indicate the impact
in the field, not as an indicator of the field impact, but rather as an indicator of the
journal impact position in the field. The period analyzed is the period 2009-2013/2014.
Figures 25 through 32 contain such profiles for the eight academic medical centers.

72
1,11,11,11,11,21,31,41,41,51,5
1,81,81,9
2,22,32,32,32,42,42,4
2,72,72,82,8
3,33,5
3,84,24,3
7,27,5
0 1 2 3 4 5 6 7 8
VIROLOGY (1,08)
CRITICAL CARE MEDICINE (1,33)
MICROBIOLOGY (1,26)
MEDICINE, RESEARCH & EXPERIMENTAL (1,59)
DERMATOLOGY (1,55)
RHEUMATOLOGY (1,68)
RESPIRATORY SYSTEM (1,44)
INFECTIOUS DISEASES (1,17)
OBSTETRICS & GYNECOLOGY (1,4)
HEALTH CARE SCIENCES & SERVICES (1,2)
CELL BIOLOGY (1,58)
PSYCHIATRY (1,38)
BIOCHEMISTRY & MOLECULAR BIOLOGY (1,52)
UROLOGY & NEPHROLOGY (1,78)
NEUROSCIENCES (1,56)
MULTIDISCIPLINARY SCIENCES (2,64)
PERIPHERAL VASCULAR DISEASE (1,38)
MEDICINE, GENERAL & INTERNAL (4,22)
IMMUNOLOGY (1,32)
PHARMACOLOGY & PHARMACY (1,25)
PEDIATRICS (1,29)
CLINICAL NEUROLOGY (1,63)
RADIOLOGY, NUCLEAR MEDICINE & MEDICAL IMAGING (1,3)
HEMATOLOGY (1,53)
GASTROENTEROLOGY & HEPATOLOGY (1,5)
ENDOCRINOLOGY & METABOLISM (1,21)
PUBLIC, ENVIRONMENTAL & OCCUPATIONAL HEALTH (1,46)
GENETICS & HEREDITY (2,04)
SURGERY (1,29)
CARDIAC & CARDIOVASCULAR SYSTEMS (1,54)
ONCOLOGY (1,58)
Share of the output (%)
Field (MNJS)
Figure 25: Output and journal impact per field (2009-2013/2014)Erasmus MC
Low (< 0,8) Average High (> 1,2)

73
11111,11,11,21,21,31,41,51,6
1,81,91,9
2,22,32,3
2,62,82,9
33,33,4
3,73,8
4,34,4
4,85,7
6,57
0 1 2 3 4 5 6 7 8
TRANSPLANTATION (1,24)
RESPIRATORY SYSTEM (1,29)
GERIATRICS & GERONTOLOGY (1,27)
VIROLOGY (1,2)
INFECTIOUS DISEASES (1,3)
PUBLIC, ENVIRONMENTAL & OCCUPATIONAL HEALTH (1,5)
PATHOLOGY (1,33)
BIOCHEMICAL RESEARCH METHODS (1,39)
MICROBIOLOGY (1,37)
MEDICINE, RESEARCH & EXPERIMENTAL (1,51)
GASTROENTEROLOGY & HEPATOLOGY (1,61)
PEDIATRICS (1,17)
PHARMACOLOGY & PHARMACY (1,24)
UROLOGY & NEPHROLOGY (1,43)
OBSTETRICS & GYNECOLOGY (1,24)
CELL BIOLOGY (1,38)
PERIPHERAL VASCULAR DISEASE (1,41)
PSYCHIATRY (1,34)
NEUROSCIENCES (1,25)
SURGERY (1,38)
BIOCHEMISTRY & MOLECULAR BIOLOGY (1,32)
MEDICINE, GENERAL & INTERNAL (3,34)
CLINICAL NEUROLOGY (1,63)
RADIOLOGY, NUCLEAR MEDICINE & MEDICAL IMAGING (1,28)
IMMUNOLOGY (1,17)
HEMATOLOGY (1,23)
MULTIDISCIPLINARY SCIENCES (1,73)
ENDOCRINOLOGY & METABOLISM (1,24)
GENETICS & HEREDITY (1,99)
RHEUMATOLOGY (1,69)
CARDIAC & CARDIOVASCULAR SYSTEMS (1,58)
ONCOLOGY (1,46)
Share of the output (%)
Field (MNJS)
Figure 26: Output and journal impact per field (2009-2013/2014)LU MC
Low (< 0,8) Average High (> 1,2)

74
1111,11,21,31,31,41,51,51,51,61,71,71,7
1,9222,12,1
2,42,42,5
2,82,82,92,92,9
3,33,6
4,24,3
5,36,5
0 1 2 3 4 5 6 7
RESPIRATORY SYSTEM (1,25)
PATHOLOGY (1,28)
REHABILITATION (1,29)
PERIPHERAL VASCULAR DISEASE (1,23)
ENGINEERING, BIOMEDICAL (1,22)
OTORHINOLARYNGOLOGY (1,13)
MEDICINE, RESEARCH & EXPERIMENTAL (1,37)
DERMATOLOGY (1,49)
CARDIAC & CARDIOVASCULAR SYSTEMS (1,35)
GASTROENTEROLOGY & HEPATOLOGY (1,45)
PUBLIC, ENVIRONMENTAL & OCCUPATIONAL HEALTH (1,43)
PEDIATRICS (1,19)
HEALTH CARE SCIENCES & SERVICES (1,19)
INFECTIOUS DISEASES (1,44)
CELL BIOLOGY (1,35)
OBSTETRICS & GYNECOLOGY (1,37)
PSYCHIATRY (1,48)
ENDOCRINOLOGY & METABOLISM (1,2)
MICROBIOLOGY (1,37)
HEMATOLOGY (1,26)
PHARMACOLOGY & PHARMACY (1,42)
IMMUNOLOGY (1,14)
RHEUMATOLOGY (1,57)
BIOCHEMISTRY & MOLECULAR BIOLOGY (1,23)
DENTISTRY/ORAL SURGERY & MEDICINE (1,13)
MEDICINE, GENERAL & INTERNAL (3,04)
SURGERY (1,36)
UROLOGY & NEPHROLOGY (1,8)
RADIOLOGY, NUCLEAR MEDICINE & MEDICAL IMAGING (1,45)
MULTIDISCIPLINARY SCIENCES (1,72)
NEUROSCIENCES (1,35)
CLINICAL NEUROLOGY (1,49)
GENETICS & HEREDITY (1,99)
ONCOLOGY (1,45)
Share of the output (%)
Field (MNJS)
Figure 27: Output and journal impact per field (2009-2013/2014)Radboud UMC
Low (< 0,8) Average High (> 1,2)

75
11,11,11,11,1
1,31,31,31,31,31,41,51,61,71,81,91,9
22,22,32,42,5
2,82,92,9
33,13,23,3
3,63,63,7
4,44,7
5,2
0 1 2 3 4 5 6
PHYSIOLOGY (1,41)
NURSING (1,55)
IMMUNOLOGY (1,04)
MEDICINE, RESEARCH & EXPERIMENTAL (1,44)
GERIATRICS & GERONTOLOGY (1,29)
TOXICOLOGY (1,38)
CELL BIOLOGY (1,25)
EDUCATION, SCIENTIFIC DISCIPLINES (1,32)
OPHTHALMOLOGY (1,28)
PEDIATRICS (1,17)
REHABILITATION (1,2)
PSYCHOLOGY, MULTIDISCIPLINARY (1,41)
GASTROENTEROLOGY & HEPATOLOGY (1,25)
RESPIRATORY SYSTEM (1,28)
PHARMACOLOGY & PHARMACY (1,19)
OBSTETRICS & GYNECOLOGY (1,44)
UROLOGY & NEPHROLOGY (1,28)
HEMATOLOGY (1,29)
BIOCHEMISTRY & MOLECULAR BIOLOGY (1,15)
RHEUMATOLOGY (1,46)
GENETICS & HEREDITY (1,27)
HEALTH CARE SCIENCES & SERVICES (1,22)
MEDICINE, GENERAL & INTERNAL (3,33)
NEUROSCIENCES (1,12)
SURGERY (1,33)
PSYCHIATRY (1,52)
MULTIDISCIPLINARY SCIENCES (1,45)
CLINICAL NEUROLOGY (1,44)
RADIOLOGY, NUCLEAR MEDICINE & MEDICAL IMAGING (1,28)
ENDOCRINOLOGY & METABOLISM (1,33)
NUTRITION & DIETETICS (1,35)
PUBLIC, ENVIRONMENTAL & OCCUPATIONAL HEALTH (1,31)
PERIPHERAL VASCULAR DISEASE (1,21)
ONCOLOGY (1,44)
CARDIAC & CARDIOVASCULAR SYSTEMS (1,45)
Share of the output (%)
Field (MNJS)
Figure 28: Output and journal impact per field (2009-2013/2014)UMC Maastricht
Low (< 0,8) Average High (> 1,2)

76
11111,11,21,2
1,41,71,81,81,9
22,12,22,22,22,32,32,32,32,32,4
2,62,9
33,13,23,2
3,844,1
5,35,5
0 1 2 3 4 5 6
DERMATOLOGY (1,53)
TRANSPLANTATION (1,29)
MICROBIOLOGY (1,37)
ORTHOPEDICS (1,06)
HEALTH CARE SCIENCES & SERVICES (1,14)
CELL BIOLOGY (1,26)
MEDICINE, RESEARCH & EXPERIMENTAL (1,19)
SPORT SCIENCES (1,31)
PSYCHOLOGY, MULTIDISCIPLINARY (1,49)
OBSTETRICS & GYNECOLOGY (1,35)
RHEUMATOLOGY (1,46)
GASTROENTEROLOGY & HEPATOLOGY (1,71)
IMMUNOLOGY (1,24)
RESPIRATORY SYSTEM (1,38)
REHABILITATION (1,18)
PERIPHERAL VASCULAR DISEASE (1,26)
UROLOGY & NEPHROLOGY (1,61)
PUBLIC, ENVIRONMENTAL & OCCUPATIONAL HEALTH (1,21)
HEMATOLOGY (1,29)
BIOCHEMISTRY & MOLECULAR BIOLOGY (1,19)
DENTISTRY/ORAL SURGERY & MEDICINE (1,23)
ENDOCRINOLOGY & METABOLISM (1,3)
PHARMACOLOGY & PHARMACY (1,28)
PEDIATRICS (1,36)
NEUROSCIENCES (1,4)
CLINICAL NEUROLOGY (1,32)
RADIOLOGY, NUCLEAR MEDICINE & MEDICAL IMAGING (1,31)
SURGERY (1,26)
MEDICINE, GENERAL & INTERNAL (3,78)
GENETICS & HEREDITY (2)
MULTIDISCIPLINARY SCIENCES (1,66)
PSYCHIATRY (1,53)
ONCOLOGY (1,47)
CARDIAC & CARDIOVASCULAR SYSTEMS (1,52)
Share of the output (%)
Field (MNJS)
Figure 29: Output and journal impact per field (2009-2013/2014)UMCG
Low (< 0,8) Average High (> 1,2)

77
11,11,21,21,31,41,5
1,722
2,32,42,52,52,62,62,72,82,92,9
3,13,23,33,4
3,74,54,54,6
4,85,1
0 1 2 3 4 5 6
CRITICAL CARE MEDICINE (1,4)
REHABILITATION (1,2)
MEDICINE, RESEARCH & EXPERIMENTAL (1,43)
MICROBIOLOGY (1,44)
NUTRITION & DIETETICS (1,41)
RESPIRATORY SYSTEM (1,42)
INFECTIOUS DISEASES (1,52)
UROLOGY & NEPHROLOGY (1,37)
PUBLIC, ENVIRONMENTAL & OCCUPATIONAL HEALTH (1,66)
OBSTETRICS & GYNECOLOGY (1,48)
ENDOCRINOLOGY & METABOLISM (1,27)
PSYCHIATRY (1,65)
GASTROENTEROLOGY & HEPATOLOGY (1,49)
RHEUMATOLOGY (1,47)
BIOCHEMISTRY & MOLECULAR BIOLOGY (1,7)
PEDIATRICS (1,37)
PHARMACOLOGY & PHARMACY (1,27)
CELL BIOLOGY (1,73)
IMMUNOLOGY (1,22)
MEDICINE, GENERAL & INTERNAL (3,68)
GENETICS & HEREDITY (2,06)
PERIPHERAL VASCULAR DISEASE (1,25)
NEUROSCIENCES (1,47)
HEMATOLOGY (1,25)
SURGERY (1,39)
RADIOLOGY, NUCLEAR MEDICINE & MEDICAL IMAGING (1,25)
CLINICAL NEUROLOGY (1,67)
MULTIDISCIPLINARY SCIENCES (1,98)
CARDIAC & CARDIOVASCULAR SYSTEMS (1,41)
ONCOLOGY (1,42)
Share of the output (%)
Field (MNJS)
Figure 30: Output and journal impact per field (2009-2013/2014)UU UMC
Low (< 0,8) Average High (> 1,2)

78
1,11,21,31,31,41,4
1,81,81,81,9
2,42,42,52,52,52,62,72,82,8
3,13,13,23,33,4
3,9444,24,2
6,1
0 1 2 3 4 5 6 7
ORTHOPEDICS (1,07)
RESPIRATORY SYSTEM (1,32)
HEALTH CARE SCIENCES & SERVICES (1,17)
VIROLOGY (1,06)
CELL BIOLOGY (1,51)
MEDICINE, RESEARCH & EXPERIMENTAL (1,26)
CRITICAL CARE MEDICINE (1,3)
RHEUMATOLOGY (1,69)
NEUROSCIENCES (1,3)
PHARMACOLOGY & PHARMACY (1,29)
PSYCHIATRY (1,31)
BIOCHEMISTRY & MOLECULAR BIOLOGY (1,22)
PEDIATRICS (1,22)
ENDOCRINOLOGY & METABOLISM (1,21)
INFECTIOUS DISEASES (1,27)
OBSTETRICS & GYNECOLOGY (1,42)
CLINICAL NEUROLOGY (1,53)
PERIPHERAL VASCULAR DISEASE (1,34)
RADIOLOGY, NUCLEAR MEDICINE & MEDICAL IMAGING (1,24)
IMMUNOLOGY (1,48)
UROLOGY & NEPHROLOGY (1,19)
PUBLIC, ENVIRONMENTAL & OCCUPATIONAL HEALTH (1,22)
GENETICS & HEREDITY (1,55)
HEMATOLOGY (1,22)
SURGERY (1,41)
GASTROENTEROLOGY & HEPATOLOGY (1,54)
MEDICINE, GENERAL & INTERNAL (3,08)
ONCOLOGY (1,4)
MULTIDISCIPLINARY SCIENCES (1,81)
CARDIAC & CARDIOVASCULAR SYSTEMS (1,59)
Share of the output (%)
Field (MNJS)
Figure 31: Output and journal impact per field (2009-2013/2014)UvA AMC
Low (< 0,8) Average High (> 1,2)

79
111111,11,11,21,31,31,41,51,51,6
1,91,91,91,9
2,12,1
2,32,4
2,62,72,82,9
3,13,23,3
3,83,9
44,2
6,27
0 1 2 3 4 5 6 7 8
CRITICAL CARE MEDICINE (1,37)
INFECTIOUS DISEASES (1,23)
RESPIRATORY SYSTEM (1,44)
SPORT SCIENCES (1,47)
PATHOLOGY (1,35)
ORTHOPEDICS (1,05)
REHABILITATION (1,26)
PSYCHOLOGY, MULTIDISCIPLINARY (1,47)
MEDICINE, RESEARCH & EXPERIMENTAL (1,52)
UROLOGY & NEPHROLOGY (1,2)
CELL BIOLOGY (1,35)
PERIPHERAL VASCULAR DISEASE (1,31)
GERIATRICS & GERONTOLOGY (1,29)
PHARMACOLOGY & PHARMACY (1,35)
HEMATOLOGY (1,36)
HEALTH CARE SCIENCES & SERVICES (1,15)
GASTROENTEROLOGY & HEPATOLOGY (1,45)
NUTRITION & DIETETICS (1,17)
OBSTETRICS & GYNECOLOGY (1,26)
BIOCHEMISTRY & MOLECULAR BIOLOGY (1,19)
SURGERY (1,36)
IMMUNOLOGY (1,43)
PEDIATRICS (1,17)
CARDIAC & CARDIOVASCULAR SYSTEMS (1,55)
MEDICINE, GENERAL & INTERNAL (2,72)
RADIOLOGY, NUCLEAR MEDICINE & MEDICAL IMAGING (1,39)
GENETICS & HEREDITY (2,04)
RHEUMATOLOGY (1,47)
MULTIDISCIPLINARY SCIENCES (1,82)
PUBLIC, ENVIRONMENTAL & OCCUPATIONAL HEALTH (1,28)
NEUROSCIENCES (1,52)
PSYCHIATRY (1,38)
ENDOCRINOLOGY & METABOLISM (1,27)
CLINICAL NEUROLOGY (1,78)
ONCOLOGY (1,49)
Share of the output (%)
Field (MNJS)
Figure 32: Output and journal impact per field (2009-2013/2014)VUmc
Low (< 0,8) Average High (> 1,2)

80
2.6 The Brute force indicator for Dutch UMCS (P * MNCS values)
In this section, the focus will be on what is called the ‘brute force’ of a research
organization, analog to the ranking of universities (see http://www.LeidenRanking.com
the rankings of universities). ‘Brute force’ is the product of the total number of
publications in a period (P, multiplied by the field-normalized impact score MNCS. The
advantage of this indicator is found in the combination of two indicators that normally
describe two different aspects or dimensions of scientific performance.
Figure 34 contains the trend in Brute force scores for the eight Dutch academic medical
centers
Figure 33: Trend in the Brute Force of Dutch UMCS (P*MNCS), 1998-2013/2014.
0
2000
4000
6000
8000
10000
12000
14000
16000
18000
20000
1998-2001
1999-2002
2000-2003
2001-2004
2002-2005
2003-2006
2004-2007
2005-2008
2006-2009
2007-2010
2008-2011
2009-2012
2010-2013
Erasmus MC
LU MC
Radboud UMC
UMC Maastricht
UMCG
UU UMC
UvA AMC
VUmc

81
3. Final remarks
We start this final section with a few general comments on the use of bibliometric
indicators for the assessment of research performance. It is our experience in previous
studies on research performance in the natural and life sciences, medicine, the
humanities, and in the social and behavioral sciences, that bibliometric indicators
provide useful information to a peer review committee evaluating research performance.
These studies revealed a fair correspondence between the results of bibliometric
analyses on the one hand, and judgments on scientific quality by peers on the other
hand. In our view, a quality judgment on a research unit, department or institute can
only be given by peers, based on a detailed insight into content and nature of the
research conducted by the group or institute in question. The citation-based indicators
applied in this study, measure the impact at the short or middle-long term of research
activities at the international research front, as reflected in publication and citation
patterns. Impact and scientific quality are not necessarily identical concepts.
Bibliometric indicators cannot be interpreted properly without background knowledge
on both the research units that are evaluated, and the subfields in which the research
units are active. In fact, in previous studies we have encountered a few cases in which a
bibliometric indicator pointed in one direction (e.g., a low impact), while statements by
peers or even other indicators pointed in another direction (e.g., a high quality).
Analyzing such discrepancies from a bibliometric point of view, specific limitations
related to the bibliometric methodology applied in the study in question may be
identified. While in most cases such limitations do hardly affect the results or have no
effect at all, in exceptional cases the bibliometric outcomes may provide an incomplete
or even distorted picture. For instance, the classification of journals into subfields
(‘journal categories’) may be less appropriate for some research units, particularly when
they are active in topics of a multidisciplinary nature. Then, in the calculation of the
impact compared to the world subfield citation average, this world average may not be
representative for the subfield in which such a research group or institute is active. If
there are strong indications that the definition of the (sub)field in terms of WOS journal
categories is inadequate, then the journal-based world average (JCSm) is more
appropriate. In particular, this latter case pertains to developing new interdisciplinary
fields.

82
A second limitation concerns the coverage of the Citation Indices (CI). In specific
subfields, particularly in applied or technical sciences, the WOS coverage may be less
adequate. Consequently, for research units who are active in such technical/applied
subfields, the bibliometric results may provide an incomplete picture. A second point
concerns non-WOS publications (e.g., articles in journals that are not or no longer
covered by CI). For a number of research units, valuable additional information may be
obtained by retrieving impact data for non-WOS publications.
Another example of a limitation of bibliometric analysis relates to time delays. It may
take several years for a collection of papers to generate a high impact. We have analyzed
research units that had generated only a moderate impact at the time. Confronted with
the bibliometric results, several peers stated that these research units had recently made
important contributions to the field. When we updated the results after a few years,
several research units indeed showed a sharply rising impact curve.
We do not wish to imply that all discrepancies between bibliometric indicators and peer
judgments are necessarily due to problems or limitations of the bibliometric methods
applied. Equally, it would not be appropriate to attribute such discrepancies only to
peers expressing incorrect or biased views on the scientific quality of a research unit.
Still reasoning from the point of view of the bibliometrician, discrepancies between
bibliometric indicators and peer judgments often constitute a research problem in itself
and often, a considerable effort is required to examine a discrepancy in sufficient detail.
Nevertheless, also peer review has its disadvantages (van Raan 1996). Therefore, the
appropriate combination of peer-based qualitative assessment and quantitative,
particularly bibliometric indicators appears to be the most successful approach in order
to reinforce objectivity, transparency, comparability and reproducibility in the
assessment of research performance.

83
Literature
Glänzel, W. (1992). Publication Dynamics and Citation Impact: A Multi-Dimensional Approach to
Scientometric Research Evaluation. In: P. Weingart, R. Sehringer, M. Winterhager (Eds.),
Representations of Science and Technology. DSWO Press, Leiden 1992, 209-224.
Proceedings of the International Conference on Science and Technology Indicators, Bielefeld
(Germany), 10-12 June, 1990.
Gonzale-Albo, B & M. Bordons (2011). Articles vs. proceedings papers: Do they differ in research
relevance and impact? A case study in the Library and Information Science field. Journal of
Informetrics, 5, 369-381.
Leeuwen, T.N. van, E.J. Rinia and A.F.J. van Raan (1996). Bibliometric Profiles of Academic Physics
Research in the Netherlands. Research Report to the Netherlands Organisation for Scientific
Research (NWO), Physics Division (FOM), Utrecht. Leiden: Center for Science and Technology
Studies, Report 96-09.
Moed, H.F., R.E. de Bruin and T.N. van Leeuwen (1995). New Bibliometric Tools for the Assessment
of National Research Performance: Database Description Overview of Indicators and First
Applications. Scientometrics, 33, 381-425.
Nederhof, A.J., (1988), The validity and reliability of evaluation of scholarly performance. In: A.F.J.
van Raan (ed) handbook of quantitative studies of science and technology. Amsterdam:
North Holland/Elsevier Science Publishers, pp. 193-228
Price, D.S. (1963), Little Science, Big Science. New York: Columbia University Press
van Raan, A.F.J. (1996), Advanced bibliometric methods as quantitative core of peer review based
evaluation and foresight exercises, Scientometrics, 36, 397-420.
van Raan, A.F.J. (2000). The Interdisciplinary Nature of Science. Theoretical Framework and
Bibliometric-Empirical Approach. In: P. Weingart and N. Stehr (Eds.). Practicing
Interdisciplinarity. Toronto: University of Toronto Press.
Waltman, L., N.J.van Eck, T.N. van Leeuwen, M.S. Visser, and A.F.J. van Raan, Towards a new crown
indicator: Some theoretical considerations, Journal of Informetrics, 2011, 5 (1), 37-47
Waltman, L., N.J.van Eck, T.N. van Leeuwen, M.S. Visser, and A.F.J. van Raan, Towards a new crown
indicator: An empirical analysis. Scientometrics, 2011, 87 (3), page 467-481

84
Appendix A: Explanation of the bibliometric
indicators of CWTS

85
1. Data collection
1.1 Introduction
Bibliometrics is the quantitative study of written products of research. It is assumed that
scientific subjects develop at an international research front (Price, 1963). Research
results are communicated in publications that are submitted to evaluation by
professional colleagues. In the references of their papers, scientists acknowledge
relevant publications by others, as they build on previous work. Therefore, the number
of times a publication is referred to gives a partial indication of the ‘impact’ of a
publication, its reception and use by scientists at the research front.
In nearly all scientific fields, the scientific journal is by far the most important medium
of communication. The Web of Science database (from here on WoS), which consists of
the citation indexes known under acronyms such as SCI, SSCI and A&HCI claims to cover
the most important ‘leading’ international journals and serials (such as Annual Reviews)
with a well-functioning referee system. In addition, the overall citation rate of journals is
considered, as well as their timeliness of publication, and adherence to international
editorial conventions. Regularly, a limited number of new journals are added, while
other journals are no longer covered. More ‘peripheral’ journals, often national in scope,
are usually not covered by the CI. The WoS counts about 11,000 journals during the last
decade.
Both statistical requirements and imperfections in the citation process (for a discussion
see Nederhof, 1988) make it desirable to aggregate across individuals, publications, and
citations. As scientific (sub)fields differ in publication and citation patterns (as visible in
differences in for example length of reference lists, or age of cited literature), it is
usually not meaningful to compare directly the raw impact of publications from one
(sub)field with those of a different (sub)field. Therefore, in our studies raw impact scores
are compared to the impact of similar publications within the same journal, or within the
same (sub)field.
1.2 Specifics on data collection
The present study relates to the publication output of the academic medical centers at
Dutch universities. The medical centers supplied publication lists to CWTS, which were
matched with the CWTS in-house bibliometric data-system. The bibliometric analysis is
covering the period 1998-2013/2014 for all eight academic medical centers. This study

86
is an update of the study conducted in 2014/2015, for the update CWTS was supplied
with the year 2013 as an additional year to the data collected for the previous studies.
Actually, the publication data collected in this study are publication years: papers are
included for the year in which they were published in the journal, which does not
necessarily coincide with the moment the publications are processed for the WoS. In this
year’s analysis, the option was suggested to backwardly add publications to the existing
datasets for de UMC benchmark analysis. For several years, the dataset is only altered
with publication form the last year, now three UMCS have taken the opportunity to add
additional publications to the dataset used for the UMC benchmark study. The three
UMCS that had used this option are UMCG, UvA AMC, and LU MC. The reason for the
other UMCS not to supply with additional publication data was the time aspect in the
data collection against the light of the deadline for delivering publication data for the
benchmark study.
We considered only papers classified in the WoS as normal articles, letters and reviews,
published in source serials processed for the WoS database. Please note that in the
indicator set of CWTS (see below), letters are weighted with 0.25. Other document types,
such as meeting abstracts, ‘editorials’, ‘editorial material’, corrections, comments, and
book reviews were not included. Also, papers in non-WoS source journals are not
counted. A few journals are only partially processed for the WoS. Here, only papers
processed for the WoS were included.
A statement needs to be made on a specific type of articles in the WoS database. This
concerns the articles published in journals, but forthcoming from a scientific
conference. These regular journal articles were in 2008 re-classified as proceedings
papers, but after a short while, realizing this was an error, this was changed again in to
article/proceeding paper. For this study, this does not influence the results, as we still
consider these publications as regular journal articles, and are treated as such. In the
future, when the CWTS WoS database also contains proceedings publications, a new
situation arises, and adequate steps will be taken to handle these new document types
correctly (for a report of this issue see Gonzalez-Albo & Bordons, 2011).

87
2. Bibliometric indicators
2.1 Output and impact indicators
We calculated the following indicators. The numbering of the indicators corresponds to
the position these indicators have in the data tables.
A first statistic gives the total number of papers published by the research unit during
the entire period (P). We considered only papers classified as normal articles, letters,
and reviews. Meeting abstracts, corrections, and editorials are not included. In a few
cases, a paper is published in a journal for which no citation data are available, or that is
not assigned to a CI journal category. These papers are not considered in the calculation
of the indicators presented in the tables below.
The next indicator gives the total number of citations received, without self-citations
(TCS). In the calculation of all our impact indicators, we disregard author self-citations.
We classify a citation as an author self-citation if the citing publication and the cited
publication have at least one author name (i.e., last name and initials) in common. In
this way, we ensure that our indicators focus on measuring only the contribution and
impact of the work of a researcher on the work of other members of the scientific
community. Sometimes self-citations can serve as a mechanism for self-promotion
rather than as a mechanism for indicating relevant related work. The impact of the work
of a researcher on his own work is therefore ignored. As an indication of the self-citation
rate we present the percentage of self-citations (% Self Cit), relative to the total number
of citations received (Self Cit)).
A next indicator is the average number of citations per publication calculated while self-
citations are not included (MCS).
Another indicator is the percentage of articles not cited during the time period
considered (PP(uncited)), excluding self-citations.
International reference values: FCS and JCS
Two international reference values are computed. A first value represents the expected mean citation rate of
the subfields (journal categories) in which the research unit is active (FMCS, the Field Mean Citation Score).
Our definition of subfields is based on a classification of scientific journals into categories developed by
Thomson Reuters. Although this classification is certainly not perfect, it is at present the only classification
available in the WoS. In calculating FMCS, we apply the following procedure. The FMCS takes into account both
the type of paper (e.g., normal article, review, and so on), as well as the specific years in which the research
unit's papers were published. For example, the number of citations received during the period 2005 - 2012 by

88
a letter published by a research unit in 2005 in field X is compared to the average number of citations received
during the same period (2005 - 2012) by all letters published in the same field (X) in the same year (2005).
Self-citations are excluded from the computation of FMCS.
In most cases, a research unit is active in more than one subfield (i.e., journal category). In those cases, we
apply various field impact scores, as related to the individual publications, the selection of the fields being
determined by the journals the research unit has used to publish its’ research findings. When a journal is
classified in multiple subfields, as happens frequently in the WoS, citation scores are computed as follows.
Basically, a paper in a journal classified in N subfields is counted as 1/N paper in each subfield, and so are its
FMCS scores, so this creates per individual publication an expected mean field citation score.
The second reference value presents the expected mean citation rate of the journals in which the research unit
has published (JMCS, the Journal Mean Citation Score). We apply the same exact method for calculating JMCS
as we did for FMCS.
Main indicators
The most important indicators compare the number of citations per individual
publication within the output of a research unit (CS) to the two international reference
values, namely the corresponding field and journal expected citation scores of individual
publications (JMCS and FMCS, respectively), by calculating the ratio for every single
publication against both expected citation scores. Self-citations are excluded in the
calculation of the ratios CS/FMCS and CS/JMCS, to prevent that citation scores are
affected by divergent self-citation behavior. Over all ratios of individual publications, we
calculate a mean impact score, for both the fields as well as the journals in which the
institute has published.
The overall field normalized impact indicator for an institute output is MNCS, the Mean
Normalized Citation Score. As this indicator focuses on the broader environment of the
group’s output, this indicator seems the most suitable indicator of the international
position of a research unit. If the MNCS is above (below) 1.0, this means that the output
of the research unit is cited more (less) frequently than an 'average' publication in the
subfield(s) in which the research unit is active. The FMCS values of the individual
publications constitute a world subfield average in a specific (combination of)
subfield(s). In this way, one may obtain an indication of the international position of a
research unit, in terms of its impact compared to a 'world' average. This 'world' average
is calculated for the total population of articles published in WoS journals assigned to a
particular subfield or journal category. As a rule, about 70-80 percent of these papers
are authored by scientists from the United States, Canada, Western Europe, Australia and
Japan. Therefore, this 'world' average is dominated by the Western world.

89
A second important indicator, MNJS, is above (below) 1.0 if the citation score of the
journal set in which the research unit has published exceeds the citation score of all
papers published in the subfield(s) to which the journals belong. In this case, one can
conclude that the research unit publishes in journals with a relatively high (low) impact.
The MNCS/MNJS indicator indicates the impact of papers closely to the publication
pattern of research units, that is, the journals in which the units have published. If the
ratio MNCS/MNJS is above 1.0, the impact of a research unit's papers exceeds the
impact of all articles published in the set of journals in which the particular research unit
has published its papers (the research unit's journal set). A limitation of this indicator is
that low impact publications published in low impact journals may get a similar score as
high impact publications published in high impact journals. Due to this latter
disadvantage, we do not print these scores in the data tables, the indicator is present in
the landscaping part of the study however, just as in the part of the study focusing on
visibility in top journals in general medicine and multidisciplinary sciences.
It should be noted that the MNCS, MNJS and the MNCS/MNJS indicators are not
independent. The value of each one of these follows directly from the values of the other
two indicators.
For a more detailed discussion on the differences between the former set of CWTS
indicators and the current one we refer to the Appendix B.
2.2 Research profiles: analysis of disciplinary orientation
The disciplinary orientation or research profile of a research center is analyzed by
classifying its papers according to scientific (sub-)fields. In the WoS, publications are
classified by means of the journal in which they appear into (sub-)field categories such
as ‘Genetics & heredity’, ‘Oncology’, ‘Virology, and so on. These WoS journal subject
categories are attached to each publication of a research unit. Subsequently, these
publications are aggregated for each WoS subfield, and output and impact indicators are
computed separately for these aggregates. The purpose of this procedure is to show
how frequently a center has published papers in various subfields of science, what and
how the impact of the center is in its main subfield(s) of activity.
If a paper appears in a journal that is classified in more than one subject category, the
paper (and its citations) is proportionally distributed over the subject categories. Thus, a
paper with 7 citations published in a journal categorized in three subject categories is
counted as 0.33 publication with 2.33 citations in each subject category.

90
As an indication, if the ratio MNCS is lower than 0.8, the impact is said to be ‘low’
(graphically indicated by a ‘lightest colored’ bar), if the ratio is higher than 1.2, the
impact is designated as ‘high’ (graphically indicated by a ‘dark colored’ bar), while a
ratio between 0.8 and 1.2 is called ‘average’ (subsequently indicated by a ‘light colored’
bar).
2.3 Analysis of scientific collaboration
The analysis of the various types of scientific cooperation is based upon a typology of
papers, which is based on the addresses attached to the publications. In case of the
paper carrying only one address, the publications is automatically labeled as a single
institute publication. In case of the appearance of at least two different country names
on one publication, the publication is automatically considered an international
cooperation. The remaining set of publications, carrying two or more addresses within
one country, are considered to be the result of national cooperation.
Any classification such as this one has some drawbacks. For example, the typology
applied has the disadvantage that in the case of international cooperation publications,
if a paper also carries two addresses from one country, the international dimension is
the dominant factor in labeling the publication. Furthermore, in case of publications
labeled as national cooperation, it can happen that these are actually two addresses of
one and the same main institution, which makes it an intra-mural cooperation. However,
the typology has been designed in order to have mutually exclusive classes thus
simplifying the collaboration networks.
2.4 Journal impact profiles: journal to field impact of Dutch academic medical centers
In this analysis we have changed the focus to the choice of the journals in which the
researchers in the medical centers published their findings. In a similar way of
presenting the research profiles, we now indicate the impact per field not by using the
field normalized impact indicator MNCS, but apply the MNJS, to indicate the impact
level of the journals (in their respective field(s)) in which the researchers have published
their output in the period of analysis.
2.5 Top paper analysis
In addition to the MNCS indicator, we use another important impact indicator. This is
the proportion of publications belonging to the top 10%most highly cited, denoted by
PP(top 10%). For each publication of a research group, we determine whether it belongs

91
to the top 10% based on its number of citations of all WoS publications in the same field
(i.e., the same WoS subject category) and from the same publication year. The PP(top
10%) indicator of a research entity equals the proportion of its publications belonging to
this top 10%. As for MCS and MNCS indicators, letters are given less weight than articles
and reviews in the calculation of the PP(top 10%) indicator. If a research group has a
PP(top 10%) indicator of 10%, it means that the actual number of top 10% publications of
the group equals the expected number. A PP(top 10%) indicator of, for instance, 20%
means that a group has twice as many top 10% publications as expected. Of course, the
choice to focus on top 10% publications is somewhat arbitrary. Next to the PP(top 10%)
indicator, we also calculate PP(top 1%), PP(top 2%), PP(top 5%), or PP(top 20%) and PP(top
50%) indicators. In the main tables, we use the PP(top 10%) indicator. The other PP(top
x%) indicators are presented as a separate analysis in the study.
2.6 Coverage of a bibliometric analysis
Finally, the indicator Int Cov shows the degree of the total set of references of a unit
referring back to the WoS database, thereby indicating the degree of relevance of that
WoS covered literature for the communication processes in the field(s) in which the unit
is active. A high score means that many references point directly towards the WoS
database, and thus that WoS literature is important for the communication process of
the unit. This indicates the relevance of the application of bibliometric techniques in the
research assessment of the unit. By inclusion of this indicator in the standard tables, we
hope to put the scores in the respective data lines in context (as low scores clearly
indicate the extra care one should take in interpreting the results presented in the
table).
2.7 Basic elements of bibliometric analysis
All above discussed indicators are important in a bibliometric analysis as they relate to
different aspects of publication and citation characteristics. Generally, we consider
MNCS as an important indicator for analyzing research performance. This indicator
relates the measured impact of a research group or institute to a worldwide, field-
specific reference value. Therefore, it is a powerful internationally standardized impact
indicator. This indicator enables us to observe immediately whether the performance of
a research institute/group or institute is significantly far below (indicator value < 0.5),
below (indicator value 0.5 - 0.8), about (0.8 - 1.2), above (1.2 - 2.0), or far above (>2.0)
the international (western world dominated) impact standard of the field. The higher the
aggregation level, the larger the volume in publications and the more difficult it is to

92
have an average impact significantly above the international level. At the ‘meso-level’
(e.g., a large institute, or faculty, about 500 – 1,000 publications per year), a MNCS
value above 1.2, could be considered that the institute’s impact as a whole is
significantly above (western-) world average. Therefore, it is important to split up large
institutes into smaller groups (e.g. through the specific analysis of the different UMCs).
Only this allows a more precise assessment of research performance. Otherwise,
excellent work will be ‘hidden’ within the bulk of a large institute or faculty. We stress
that the other indicators provided in the tables, such as PP(uncited) or %Self Cit do
contribute to a further understanding of the research performance analysis of units
under study. Together these indicators tend to inform the user of bibliometrics on a
variety of aspects in research performance analysis.

93
Appendix B: Changes in the bibliometric indicators
of CWTS
Centre for Science and Technology Studies (CWTS)
Leiden University
13 February 2011

94
Introduction
This report provides a short summary of the changes in the bibliometric indicators
of CWTS. These changes are the result of internal discussions within CWTS and also of
recent insights in the bibliometric literature. The emphasis in this report is on the
CPP/FCSm indicator and the MNCS indicator. For a long time, CWTS has been using the
CPP/FCSm indicator, but this indicator is going to be replaced by the MNCS indicator.
Both indicators will be discussed and the advantages and disadvantages of the MNCS
indicator compared with the CPP/FCSm indicator will be summarized. Some other
changes in the bibliometric indicators of CWTS will be mentioned briefly.
CWTS is well aware of the importance of continuity in the use of bibliometric
indicators. For this reason, the new indicators will sometimes be used together with the
old ones in studies of CWTS. When necessary, the new indicators will also be calculated
retroactively.
Definitions of the CPP/FCSm indicator and the MNCS indicator
The CPP/FCSm (citations per publication / mean field citation score) indicator is
defined as
neee
nccc
n
n
21
21CPP/FCSm ,
where n denotes the number of publications, ci
denotes the actual number of citations of
publication i, and ei
denotes the expected number of citations of publication i. The
expected number of citations of a publication is given by the average number of
citations of all publications that appeared in the same field and the same year and that
have the same document type (article, letter, or review).
The MNCS (mean normalized citation score) indicator is defined as
n
n
e
c
e
c
e
c
n
2
2
1
11MNCS .
As can be seen from the above formulas, the essential difference between the CPP/FCSm
indicator and the MNCS indicator is that the former indicator is defined as a ratio of
averages while the latter indicator is defined as an average of ratios.
The following example illustrates the calculation of both indicators. Suppose there
are three publications, and suppose these publications have the following
characteristics:
Publication Field Publication
year
Actual citations Expected
citations
1 Psychiatry 2005 25 10
2 Surgery 2005 20 20
3 Surgery 2008 15 5
This yields the following indicators:
71.1352010
3152025CPP/FCSm
,
17.25
15
20
20
10
25
3
1MNCS
.

95
Advantages and disadvantages of the MNCS indicator
The MNCS indicator has two important advantages compared with the CPP/FCSm
indicator:
All publications have equal weight in the MNCS indicator, while in the CPP/FCSm
indicator older publications and publications from fields with a lot of citation
traffic have more weight.
The MNCS indicator is consistent, while the CPP/FCSm indicator is not.
Consistency means that the way in which researchers, departments, or
universities are being ranked satisfies certain logical conditions.
The MNCS indicator has two disadvantages compared with the CPP/FCSm indicator:
The MNCS indicator can be very sensitive to citations to recent publications.
Publications of the document type letter need to be treated in a special way in
the MNCS indicator.
These advantages and disadvantages are discussed in more detail below.
Equal weighing of publications in the MNCS indicator
Older publications and publications from fields with a lot of citation traffic on
average have a relatively large number of citations. These publications also have a large
expected number of citations. In the numerator of the CPP/FCSm indicator, citations to
publications from different fields and different publication years are added together. In
the denominator, the same is done with expected citations. This causes older
publications and publications from fields with a lot of citation traffic to have a relatively
high weight in the CPP/FCSm indicator. In the MNCS indicator, the number of citations of
a publication is compared directly with the expected number of citations of the
publication, without first aggregating over publications. In this way, all publications have
equal weight in the indicator. CWTS regards equal weighing of publications from
different fields and different publication years as the most natural way to determine the
citation score of a set of publications.
The numerical example given in the previous section illustrates the difference
between the CPP/FCSm indicator and the MNCS indicator. In this example, publications 1
and 3 have many more citations than expected. Publication 2 has exactly the expected
number of citations. Publication 2 originates from a field in which there is much more
citation traffic than in the field of publication 1. Furthermore, publication 2 is much
older than publication 3. For these reasons, publication 2 has a larger expected number
of citations than publications 1 and 3, and consequently publication 2 has more weight
in the CPP/FCSm indicator. Since publication 2 has a lower citation impact than
publications 1 and 3 (after correcting for field and publication year), giving more weight
to this publication leads to a lower citation score. This explains why the MNCS indicator,
which gives equal weight to all publications, yields a higher citation score than the
CPP/FCSm indicator.
Consistency of the MNCS indicator
Suppose there are two universities (or departments or researchers), A and B, which
have the same number of publications. Suppose the citation score of A exceeds the
citation score of B. Suppose next that A and B jointly produce a new publication. Since it
is a joint publication and, consequently, A and B make the same improvement, it is
natural to expect that with the new publication included the citation score of A still
exceeds the one of B. An indicator that guarantees this is called consistent. The
CPP/FCSm indicator is not consistent. In certain cases, the way in which this indicator
ranks two units relative to each other changes in a counter-intuitive manner. The MNCS
indicator is consistent and therefore does not have this problem.
Sensitivity of the MNCS indicator to citations to recent publications
Recent publications have a small expected number of citations. In some cases, a
relatively small number of citations to a recent publication can therefore be sufficient to
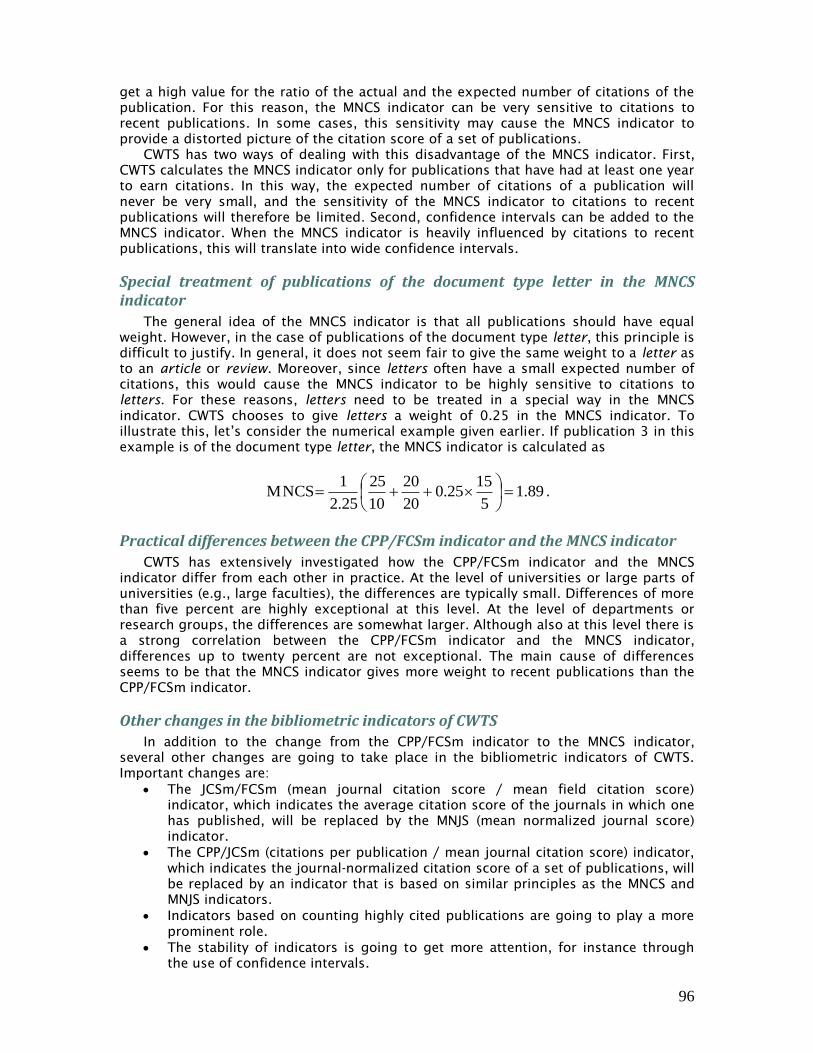
96
get a high value for the ratio of the actual and the expected number of citations of the
publication. For this reason, the MNCS indicator can be very sensitive to citations to
recent publications. In some cases, this sensitivity may cause the MNCS indicator to
provide a distorted picture of the citation score of a set of publications.
CWTS has two ways of dealing with this disadvantage of the MNCS indicator. First,
CWTS calculates the MNCS indicator only for publications that have had at least one year
to earn citations. In this way, the expected number of citations of a publication will
never be very small, and the sensitivity of the MNCS indicator to citations to recent
publications will therefore be limited. Second, confidence intervals can be added to the
MNCS indicator. When the MNCS indicator is heavily influenced by citations to recent
publications, this will translate into wide confidence intervals.
Special treatment of publications of the document type letter in the MNCS indicator
The general idea of the MNCS indicator is that all publications should have equal
weight. However, in the case of publications of the document type letter, this principle is
difficult to justify. In general, it does not seem fair to give the same weight to a letter as
to an article or review. Moreover, since letters often have a small expected number of
citations, this would cause the MNCS indicator to be highly sensitive to citations to
letters. For these reasons, letters need to be treated in a special way in the MNCS
indicator. CWTS chooses to give letters a weight of 0.25 in the MNCS indicator. To
illustrate this, let’s consider the numerical example given earlier. If publication 3 in this
example is of the document type letter, the MNCS indicator is calculated as
89.15
1525.0
20
20
10
25
25.2
1MNCS
.
Practical differences between the CPP/FCSm indicator and the MNCS indicator
CWTS has extensively investigated how the CPP/FCSm indicator and the MNCS
indicator differ from each other in practice. At the level of universities or large parts of
universities (e.g., large faculties), the differences are typically small. Differences of more
than five percent are highly exceptional at this level. At the level of departments or
research groups, the differences are somewhat larger. Although also at this level there is
a strong correlation between the CPP/FCSm indicator and the MNCS indicator,
differences up to twenty percent are not exceptional. The main cause of differences
seems to be that the MNCS indicator gives more weight to recent publications than the
CPP/FCSm indicator.
Other changes in the bibliometric indicators of CWTS
In addition to the change from the CPP/FCSm indicator to the MNCS indicator,
several other changes are going to take place in the bibliometric indicators of CWTS.
Important changes are:
The JCSm/FCSm (mean journal citation score / mean field citation score)
indicator, which indicates the average citation score of the journals in which one
has published, will be replaced by the MNJS (mean normalized journal score)
indicator.
The CPP/JCSm (citations per publication / mean journal citation score) indicator,
which indicates the journal-normalized citation score of a set of publications, will
be replaced by an indicator that is based on similar principles as the MNCS and
MNJS indicators.
Indicators based on counting highly cited publications are going to play a more
prominent role.
The stability of indicators is going to get more attention, for instance through
the use of confidence intervals.

97
More information
More information on the changes in the bibliometric indicators of CWTS is available
in the publications listed below. In these publications, the decision to move from the
CPP/FCSm indicator to the MNCS indicator is discussed in more detail. References to
other relevant literature are provided as well.
Waltman, L., van Eck, N.J., van Leeuwen, T.N., Visser, M.S., & van Raan, A.F.J. (2011).
Towards a new crown indicator: Some theoretical considerations. Journal of
Informetrics, 5(1), 37–47. Available on http://dx.doi.org/10.1016/j.joi.2010.08.001.
Waltman, L., van Eck, N.J., van Leeuwen, T.N., Visser, M.S., & van Raan, A.F.J. (2011).
Towards a new crown indicator: An empirical analysis. Scientometrics 87 (3), 467-
481 . Available on http://arxiv.org/abs/1004.1632.