bias and confounding - kupublicifsv.sund.ku.dk/~pka/epie11/bias-conf-sf.pdf · epidemiology bias...
TRANSCRIPT

EPIDEMIOLOGYEPIDEMIOLOGY
BIAS AND CONFOUNDINGBIAS AND CONFOUNDING
September September September September
Søren FriisSøren Friis
Institut for Epidemiologisk KræftforskningInstitut for Epidemiologisk Kræftforskning
Kræftens BekæmpelseKræftens Bekæmpelse
EPIDEMIOLOGYEPIDEMIOLOGY
BIAS AND CONFOUNDINGBIAS AND CONFOUNDING
September September 20112011September September 20112011
Søren FriisSøren Friis
Institut for Epidemiologisk KræftforskningInstitut for Epidemiologisk Kræftforskning
Kræftens BekæmpelseKræftens Bekæmpelse


The accuracy of a result is determined by the degree
of absence of systematic variation (validity), and the
degree of absence of random variation (precision)
The accuracy of a result is determined by the degree
of absence of systematic variation (validity), and the
degree of absence of random variation (precision)
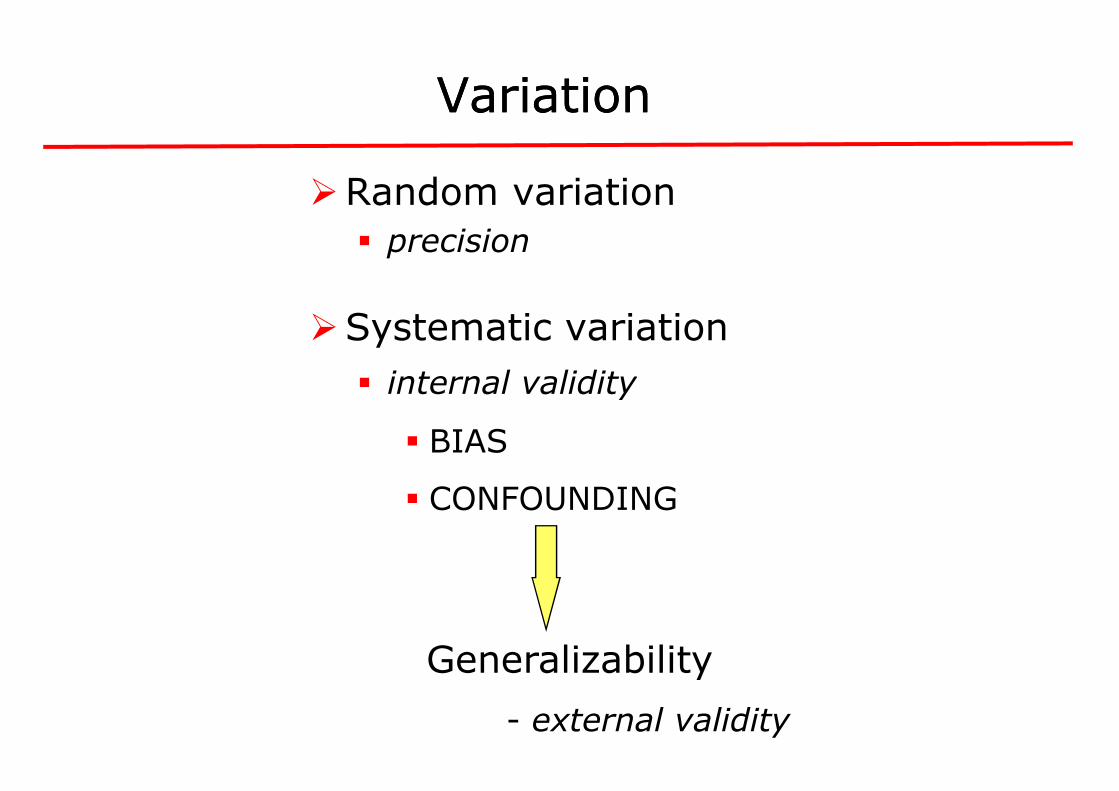
VariationVariation
�Random variation
� precision
�Systematic variation
� internal validity� internal validity
� BIAS
� CONFOUNDING
Generalizability
- external validity
VariationVariation
Random variation
Systematic variation
internal validityinternal validity
CONFOUNDING
Generalizability
external validity

Two cohort studies of the same research question
Exposure
Diseased
Healthy
Study 1
+ 40 160- 20 180
Study 2
+ 10 26- 5 31
Study 1: RR = 2.0 p = 0.005
Study 2: RR = 2.0 p = 0.14
Two cohort studies of the same research question
Healthy Total
IP (%)
160 200 20 180 200 10
26 36 28 31 36 14
p = 0.005
p = 0.14
95% CI = 1.23 - 3.25
95% CI = 0.79 - 5.10

Random variationRandom variation
�Can be reduced by increasing the number of study participants thereby increasing the statistical precision
�Dependent on methodological choices�Dependent on methodological choices
�For a given result, the degree of chance variability is quantified by the confidence interval
Random variationRandom variation
Can be reduced by increasing the number of study participants thereby increasing the
Dependent on methodological choicesDependent on methodological choices
For a given result, the degree of chance variability is quantified by the confidence interval

Likely
Yes
Bias in selectionor measurement
Chance
Bias in Bias in epidemiologicepidemiologic
LikelyChance
Confounding
Cause
No
Likely Unlikely
epidemiologicepidemiologic studiesstudies
NoYes
Likely Unlikely
Cause

BiasBias
definitiondefinition
�Deviation of results or inferences from the
truth, or processes leading to such deviation.
Any trend in the collection, analysis,
interpretation, publication, or review of data
that can lead to conclusions that are
systematically different from the truth”
(Murphy)
BiasBias
definitiondefinition
Deviation of results or inferences from the
truth, or processes leading to such deviation.
Any trend in the collection, analysis,
interpretation, publication, or review of data
that can lead to conclusions that are
systematically different from the truth”

BiasBias
nomenclaturenomenclature
”Popularity bias, centripetal bias, rebias, diagnostic suspicion bias, unmopinion bias, wrong sample size bias, admission rate bias, prevalenceincidence bias, diagnostic vogue bias, diagnostic purity bias, procedure selection bias, missing clinical data bias, nonprocedure selection bias, missing clinical data bias, noncontemporaneous control bias, starting time bias, migrator bias, membership bias, non-respondent bias, volunteer bias, insensitive measure bias, underlying cause bias, endunacceptability bias, obsequiouness bias, expectation bias, substitution bias, family information bias, exposure suspicion bias, recall bias, attention bias, instrument bias”
BiasBias
nomenclaturenomenclature
, referral filter bias, diagnostic access nmasking bias, mimicry bias, previous
opinion bias, wrong sample size bias, admission rate bias, prevalence-incidence bias, diagnostic vogue bias, diagnostic purity bias, procedure selection bias, missing clinical data bias, non-procedure selection bias, missing clinical data bias, non-contemporaneous control bias, starting time bias, migrator bias,
respondent bias, volunteer bias, insensitive measure bias, underlying cause bias, end-digit preference bias, unacceptability bias, obsequiouness bias, expectation bias, substitution bias, family information bias, exposure suspicion bias, recall bias, attention bias, instrument bias”
(Sackett, 1979)

Bias Bias
nomenclaturenomenclature
�SELECTION BIAS
�INFORMATION BIAS
Bias Bias
nomenclaturenomenclature
SELECTION BIAS
INFORMATION BIAS

Selection BiasSelection Bias
� Selection of study groups (on the basis of exposure or
outcome) is influenced by the other study axis (exposure or
outcome)
� Selective recruitment of study subjects with specific � Selective recruitment of study subjects with specific
characteristics related to exposure and outcome
� i.e, the relation between exposure and outcome is different for those who participate and those who were theoretically eligible for study but were not chosen to participate
Bias occurring outside the study material
Selection BiasSelection Bias
Selection of study groups (on the basis of exposure or
outcome) is influenced by the other study axis (exposure or
Selective recruitment of study subjects with specific Selective recruitment of study subjects with specific
characteristics related to exposure and outcome
i.e, the relation between exposure and outcome is different for those who participate and those who were theoretically eligible for study but
Bias occurring outside the study material

SelectionSelection bias in bias in
� The selection or classification of exposed and non
exposed individuals is related to the outcome
Ex:Ex:
� Retrospective cohort study
� ”Healthy worker/patient effect”
� ”Protopathic bias” (”reverse causation”)
� Depletion of susceptibles
� Confounding by indication
bias in bias in cohortcohort studiesstudies
The selection or classification of exposed and non-
exposed individuals is related to the outcome
Retrospective cohort study
”Healthy worker/patient effect”
”Protopathic bias” (”reverse causation”)
Depletion of susceptibles
Confounding by indication

RetrospectiveRetrospective
� In the late 1970s, the Centers for Dwhether exposure to atmospheric nuclear weapons testing in Nevada in the mid-1950s had caused an increase in leukaemia (and other cancers) among troops who had been present at the particular tests
� 76% of the troops were enrolled in the study. Of these, 82% were traced by the investigators, while 18% contacted the investigators on their own by the investigators, while 18% contacted the investigators on their own initiative
� Problems?
DeathParticipation dependent on outcomeLimited information on exposure level
Caldwell et al. Leukemia among participants in military maneuvers of a nuclear bombtest: a preliminary report. JAMA 1980; 244: 1575
RetrospectiveRetrospective cohortcohort studystudy
r Disease Control, USA, wished to assess whether exposure to atmospheric nuclear weapons testing in Nevada in
1950s had caused an increase in leukaemia (and other cancers) among troops who had been present at the particular tests
76% of the troops were enrolled in the study. Of these, 82% were traced by the investigators, while 18% contacted the investigators on their own by the investigators, while 18% contacted the investigators on their own
Participation dependent on outcomeLimited information on exposure level
Caldwell et al. Leukemia among participants in military maneuvers of a nuclear bomb-test: a preliminary report. JAMA 1980; 244: 1575-8

RetrospectiveRetrospective
� From the service records of the Royal New Zealand Navy, Pearce et alidentified 500 servicemen who had participated in nuclear weapons testing in the Pacific area in 1957-were in service during that time but not involved in the nuclear testing were selected as controls
� Follow-up of index- and control persons through 1987 was performed by linkage to the national cancer registry and death certificatesby linkage to the national cancer registry and death certificates
� Mortality was similar in the two groups, but there was an excess of leukaemias in servicemen involved in the nuclear tests
� Strengths: Participation independent on outcome, nearly complete follow-up
� Limitations: Limited information on confounders, including radiation exposure other than from the nuclear tests
*Pearce et al. Follow-up of New Zealand participants in British atmospheric nuclear weapons tests in the Pacific. BMJ 1990, 300, 1161-1162
RetrospectiveRetrospective cohortcohort studystudy
From the service records of the Royal New Zealand Navy, Pearce et al*
identified 500 servicemen who had participated in nuclear weapons -58. Personnel from three ships that
were in service during that time but not involved in the nuclear testing
and control persons through 1987 was performed by linkage to the national cancer registry and death certificatesby linkage to the national cancer registry and death certificates
Mortality was similar in the two groups, but there was an excess of leukaemias in servicemen involved in the nuclear tests
Participation independent on outcome, nearly complete
Limited information on confounders, including radiation exposure other than from the nuclear tests
up of New Zealand participants in British atmospheric nuclear weapons tests in

ProtopathicProtopathic
� “Reverse causation”
� The exposure, typically for a drug, changes as a result of early disease manifestations
� The first symptoms of the outcome of interest are the reasons for prescription of the drug reasons for prescription of the drug
� Use of analgesics (NSAIDs) for back pain caused by undiagnosed cancer, e.g., prostate or pancreas cancer
� Use of NSAIDs for joint pain occurring prior to exacerbation and diagnosis of Crohn’s disease
� Changes in lifestyle and/or dietary habits because of early disease symptoms (e.g. gastrointestinal discomfort)
Ex:
ProtopathicProtopathic biasbias
The exposure, typically for a drug, changes as a result of early disease manifestations
The first symptoms of the outcome of interest are the reasons for prescription of the drug reasons for prescription of the drug
Use of analgesics (NSAIDs) for back pain caused by undiagnosed cancer, e.g., prostate or pancreas cancer
Use of NSAIDs for joint pain occurring prior to exacerbation and
Changes in lifestyle and/or dietary habits because of early disease symptoms (e.g. gastrointestinal discomfort)

Risk of stomach cancer among users of proton pump inhibitors (acid suppressive drug)
ProtopathicProtopathic
First year follow-up
1-14 year
Poulsen et al. Proton pump inhibitors and risk of stomach cancer. British Journal of Cancer 2009; 100:1503-7
Risk of stomach cancer among users of proton pump inhibitors (acid suppressive drug)
ProtopathicProtopathic biasbias
IRR 95% CI IRR 95% CI
9.0 6.9-11.7
1.2 0.8-2.0
Poulsen et al. Proton pump inhibitors and risk of stomach cancer. British Journal of

HazardHazard functionfunction
Outcome
”Depletion of susceptibles”
functionfunction
”Depletion of susceptibles”
Exposure

Start of treatment (n=300)
Follow-up
Start of Start of studystudy
Ideal
Study population(n=150)
Remained on treatment (n=150)
Survival cohort
Follow-up
Stopped treatment/developed disease/adverse event/died(n=150)
Study population(n=150)
Survival cohort
Follow-up

SolutionSolution
� Restrict the study to persons who start a course of treatment within the study period
� Apply an appropriate ”treatment-window depending on the given treatment(s) and indication(s)
� Primarily an option in register-based studies with information on treatment and other relevant variables information on treatment and other relevant variables
� Limitations:
� Reduced sample size (study power)
� High representation of individuals in short
� Limited long-term follow-up
� Overrepresentation of ”poor/non-of earlier/other treatment
Ref: Ray-W. Am J Epidemiol 2003; 158: 915
SolutionSolution
Restrict the study to persons who start a course of treatment within
-free washout period”, with a time window depending on the given treatment(s) and indication(s)
based studies with continuous information on treatment and other relevant variables information on treatment and other relevant variables
Reduced sample size (study power)
High representation of individuals in short-term treatment
-compliers” and patients with poor effect
W. Am J Epidemiol 2003; 158: 915-920

Selection bias in caseSelection bias in case
�Selection of cases or controls into a study is
related to their exposure status
Ex:Ex:
� “Diagnostic bias”� referral
� self-selection
� Non-participation/non
� Selection of control group
Selection bias in caseSelection bias in case--control studiescontrol studies
Selection of cases or controls into a study is
related to their exposure status
participation/non-response
Selection of control group

Exposure Cases
+ a = fA - c = fC
Total a+c = f (A+C)
f = sampling fraction for cases = (a+c)/(A+C)g = sampling fraction for controls = (b+d)/(B+D)
The sampling fractions f og g must be identical for exposed and nonexposed individuals
Controls
b = gB
d = gD
a+c = f (A+C) b+d = g (B+D)
= sampling fraction for cases = (a+c)/(A+C) = sampling fraction for controls = (b+d)/(B+D)
The sampling fractions f og g must be identical for exposed

+ organic solvents
- organic solvents
Selection bias in caseSelection bias in case
+ organic solvents
- organic solvents
If the assessment of the diagnosexposure, there is risk of selection bias in a case
”Painter syndrome”
Selection bias in caseSelection bias in case--control studiescontrol studies
Population controls
osis is influenced by the history of exposure, there is risk of selection bias in a case-control study

Eligible study populationExposure Case Control
+ 107 193- 143 557
Total 250 750
OR = 2.2
Selection bias in caseSelection bias in case
NonNon--participation/Nonparticipation/Non
Examined study population
Non-participation/responseExposure Case
+ 10% (11)- 28% (40)
20% (51)
Examined study population
Exposure Case
+ 96 - 103
Total 199
OR = 2.7
population Control Total
193 300 557 700
750 1000
Selection bias in caseSelection bias in case--control studiescontrol studies
participation/Nonparticipation/Non--responseresponse
Examined study population
participation/response Control
10% (11) 28% (54) 28% (40) 28% (156)
20% (51) 28% (210)
Examined study population
Control Total
139 235 401 504
540 739

Selection of controlsSelection of controls
CCasease--control designcontrol design
� The control group should provide an estimate of the
exposure distribution in the source population for cases
(“study base”)(“study base”)
� ”The controls should represent the population of
nondiseased persons who would have been eligible for
inclusion as cases had they developed the disease of
interest”
Selection of controlsSelection of controls
control designcontrol design
The control group should provide an estimate of the
exposure distribution in the source population for cases
”The controls should represent the population of
nondiseased persons who would have been eligible for
inclusion as cases had they developed the disease of

Selection of controlsSelection of controls
CCasease--control designcontrol design
“check list”
� Would controls be cases if they had developed the disease?
� Are controls healthy or diseased?� Are controls healthy or diseased?
� Is the exposure associated with the probability of being selected as control?
High testosteron level and risk ofwith benign prostate hyperplasia
Ex:
Hormone replacement therapy (HRT) and risk of endometrial cancer. The controls were women undergoing diagnostic evaluation for endometrial cancer, but subsequently determined not to have cancer
Selection of controlsSelection of controls
control designcontrol design
Would controls be cases if they had developed the
Are controls healthy or diseased?Are controls healthy or diseased?
Is the exposure associated with the probability of being
of prostate cancer. The controls were men with benign prostate hyperplasia
Hormone replacement therapy (HRT) and risk of endometrial cancer. The controls were women undergoing diagnostic evaluation for endometrial cancer, but subsequently determined not to have cancer

Selection of controlsSelection of controls
CCasease--control designcontrol design
Why then use patients as controls?
� Study base cannot be identified
� Minimize impact of selection factors applying to cases� Minimize impact of selection factors applying to cases
� Reduce information bias
� Reduce non-participation/non
� Need for blood samples and other “invasive” tests
� Logistic considerations
Selection of controlsSelection of controls
control designcontrol design
Why then use patients as controls?
Study base cannot be identified
Minimize impact of selection factors applying to casesMinimize impact of selection factors applying to cases
participation/non-response
Need for blood samples and other “invasive” tests

Information biasInformation bias
�DIFFERENTIAL
Systematic differences between study groups in the collection, interpretation, or reporting of information on the other study axis (exposure or outcome)
�NON-DIFFERENTIAL
Misclassification of exposure or outcome independent of the other study axis
Information biasInformation bias
Systematic differences between study groups in the collection, interpretation, or reporting of information on the other study axis (exposure or outcome)
Misclassification of exposure or outcome independent of the

Information bias in cohort studiesInformation bias in cohort studies
� Ascertainment of outcome is different for exposed and
non-exposed individuals
Ex:
� “Diagnostic bias”
• Women presenting with symptoms of thromboembolism are more likely to be hospitalised (and diagnosed) if they use oral contraceptives
• Smokers may be more likely to seek medical attention for smoking-related diseases
� Loss to follow-up
Information bias in cohort studiesInformation bias in cohort studies
Ascertainment of outcome is different for exposed and
Women presenting with symptoms of thromboembolism are more likely to be hospitalised (and diagnosed) if they use oral
Smokers may be more likely to seek medical attention for

CohortCohort studies studies -- LossLoss
Enrolled study population
Exposure Disease Healthy
+ 107 193
- 143 557
Total 250 750
RR = 1.7
Examined study populationExamined study population
Exposure Disease Healthy
+ 96 139
- 103 401
Total 199 540
RR = 2.0
Loss to follow-up
Exposure Disease Healthy
+ 10% (11) 28% (54)
- 28% (40) 28% (156)
LossLoss to followto follow--upup
Enrolled study population
Healthy Total
193 300
557 700
750 1000
Examined study population Examined study population
Healthy Total
139 235
401 504
540 739
Healthy Total
28% (54) 22% (65)
28% (156) 28% (196)

Information bias in caseInformation bias in case
� Ascertainment of exposure status is different for cases and controls
Ex:
recall bias
“interviewer” bias
• An interviewer who is aware of the disease status and hypothesis of the study may tend to “probe” more intensively for exposure history among cases
• Data abstractors with knowledge of disease status and study hypothesis may tend to scan records of cases with more scrutiny
Information bias in caseInformation bias in case--control studiescontrol studies
Ascertainment of exposure status is different for cases and
An interviewer who is aware of the disease status and hypothesis of the study may tend to “probe” more intensively for exposure
Data abstractors with knowledge of disease status and study hypothesis may tend to scan records of cases with more scrutiny

� In a case-control study, the investigators examined the association between alcohol use and liver cirrhosis
� Cases and (population) controls were interviewed to obtain detailed information on alcohol use
Information bias in caseInformation bias in case
� Problems?
Alcohol use “sensitive question”
Study subjects, in particular cases, may not report their true consumption
The interviewer may be influenced by awareness of the disease status of the study subjects
Alcohol consumption varies over time, particularly among cases
control study, the investigators examined the association between alcohol use and liver cirrhosis
Cases and (population) controls were interviewed to obtain detailed information on alcohol use
Information bias in caseInformation bias in case--control studiescontrol studies
Study subjects, in particular cases, may not report their true consumption
The interviewer may be influenced by awareness of the disease status of
Alcohol consumption varies over time, particularly among cases

Information bias in caseInformation bias in case
Recall biasRecall bias
� Exposure experience reported differently by cases and
controls
� over- or underreporting depending on research questionquestion
� Interest in seeking explanation
� “Sensitive question”
Mothers of children with congenital malformations may recall drug use and other exposures during pregnancy better than controls
Diseases with long latency are particularly prone to recall bias (e.g. sun exposure during childhood and melanoma)
Ex:
Information bias in caseInformation bias in case--control studiescontrol studies
Recall biasRecall bias
Exposure experience reported differently by cases and
or underreporting depending on research
Interest in seeking explanation
Mothers of children with congenital malformations may recall drug use and other exposures during pregnancy better than
Diseases with long latency are particularly prone to recall bias (e.g. sun exposure during childhood and melanoma)

Theoretical definition
NonNon--differential misclassificationdifferential misclassification
Empirical definition
Measurement error
Theoretical definition
differential misclassificationdifferential misclassification
Empirical definition
Measurement error

Disagreement between theoretical Disagreement between theoretical
and empirical definition?and empirical definition?
Ex:
� ‘Vitamins’ and ’cancer’
� ‘Passive smoking’ and ‘heart disease’� ‘Passive smoking’ and ‘heart disease’
� ‘Aspirin’ and ‘heart disease’
Precise criteria for ascertainment of exposure and outcome
Disagreement between theoretical Disagreement between theoretical
and empirical definition?and empirical definition?
‘Passive smoking’ and ‘heart disease’‘Passive smoking’ and ‘heart disease’
‘Aspirin’ and ‘heart disease’
Precise criteria for ascertainment of exposure and outcome

NonNon--differential misclassificationdifferential misclassification
� Misclassification of exposure or outcome is independent on the other study axis (exposure or outcome)
� Most often “conservative” bias (risk estimate towards the null)
Ex:
� Study of the association between alcohol use and cancer risk during a short observation period
� Drugs prescribed for one person are not used or used by another person
� Register-based ascertainment of exposure and outcomes (e.g. administrative registers)
differential misclassificationdifferential misclassification
Misclassification of exposure or outcome is independent on the other study axis (exposure or
Most often “conservative” bias (risk estimate towards
Study of the association between alcohol use and cancer risk during a short observation period
Drugs prescribed for one person are not used or used by
based ascertainment of exposure and outcomes (e.g.

AdvantagesAdvantages withwith recordrecord
Data Data specificityspecificity
recordrecord linkagelinkage studiesstudies
specificityspecificity and and sensitivitysensitivity

NonNon--differential misclassification differential misclassification
Important considerationsImportant considerations
� Theoretical versus empirical definition
� ex: diet/cancer
� Induction time
� relevant exposure time window?• ex: drug use/cancer, smoking/AMI, smoking/lung cancer• ex: drug use/cancer, smoking/AMI, smoking/lung cancer
� Exposure
� type
� pattern
� timing
� duration• ex: dietary fat/AMI
� Disease
� criteria?• stroke (ex: hemorrhagic vs. thrombotic)
differential misclassification differential misclassification
Important considerationsImportant considerations
Theoretical versus empirical definition
relevant exposure time window?ex: drug use/cancer, smoking/AMI, smoking/lung cancerex: drug use/cancer, smoking/AMI, smoking/lung cancer
stroke (ex: hemorrhagic vs. thrombotic)

”Thus it is easy to prove that the wearing of tall hats and the
carrying of umbrellas enlarges the chest, prolongs life, and confers
comparative immunity from disea
classes which use these articles a
than the class which never dreams of possessing such things”
ConfoundingConfounding
than the class which never dreams of possessing such things”
George Bernard Shaw:
Preface to The Doctor’s dilemma (1906)
”Thus it is easy to prove that the wearing of tall hats and the
carrying of umbrellas enlarges the chest, prolongs life, and confers
sease; for the statistics show that the
s are bigger, healthier, and live longer
than the class which never dreams of possessing such things”
ConfoundingConfounding
than the class which never dreams of possessing such things”
(1906)

ConfoundingConfounding
Mixture of an effect of exposure on outcome with the effect of a third factor
… mixing of effects ..
latin: “confundere” = to mix/blend
ConfoundingConfounding
Mixture of an effect of exposure on outcome with the
latin: “confundere” = to mix/blend

ConfoundingConfounding
Exposure X
do not represent an intermediate link between exposure and outcome
Exposure
Confounder
Associated with the exposure
X
ConfoundingConfounding
OutcomeX
do not represent an intermediate link between exposure and outcome
Outcome
Confounder
independent predictor of the
studied outcome
X

Alcohol
Individuals who drink are more frequently smokers than individuals who do not drink
Crude OR = 2.1
True OR
Smokingdrink
� The association between alcohol use and lung cancer risk is due to a higher prevalence of smoking among drinkers
� The association do not reflect a causal relationship but a correlation between alcohol consumption and smoking
Lung cancer
Smokers have, independent of their alcohol consumption, an increased risk of lung cancer
Crude OR = 2.1
True OR ~ 1.0
Smoking
The association between alcohol use and lung cancer risk is due to a higher prevalence of smoking among drinkers
The association do not reflect a causal relationship but a correlation between alcohol consumption and smoking

AMI
Table A: All study subjects (n=8000)
Low physical activity 105
High physical activity 25
RR = 26.25/6.25 = 4.2
ConfoundingConfounding in a in a
RR = 26.25/6.25 = 4.2
Sub-table B1: Overweight
Low physical activity 90
High physical activity 10
RR = 3.0
Sub-table B2: Normal weight
Low physical activity 15
High physical activity 15
RR = 3.0
AMI PY IR
(per 1000)
105 4000 26.25
25 4000 6.25
in a in a cohortcohort studystudy
90 3000 30.0
10 1000 10.0
15 1000 15.0
15 3000 5.0
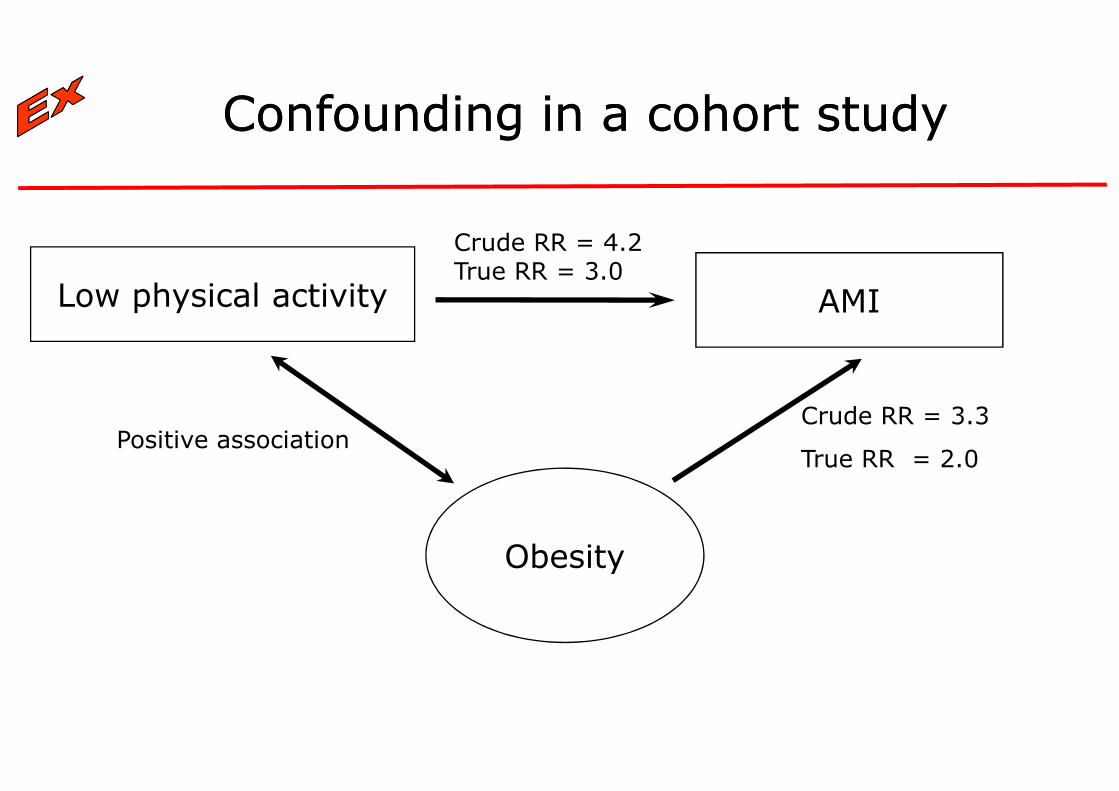
ConfoundingConfounding in a in a
Low physical activity
Crude RR = 4.2 True RR = 3.0
Obesity
Positive association
in a in a cohortcohort studystudy
AMI
Crude RR = 4.2 True RR = 3.0
Obesity
Crude RR = 3.3
True RR = 2.0

Use of oral contraceptives
Women who take OCTs have – on average -lower BMI than non-users
True > Crude RR
Obesity
users
� Example of ”negative confounding”
� Important always to consider the size and direction of potential confounders, especially for confounders for which adjustment are not possible in neither design or analysis
Deep venous thrombosis
Obesity is an independent risk factor for DVT
True > Crude RR
Obesity
”negative confounding”
Important always to consider the size and direction of potential confounders, especially for confounders for which adjustment are not possible in neither design or analysis

ConfoundingConfounding
� fullfill the two first criteria for a confounder
A factor representing an intermediate step in the causal chain from exposure to outcome will
� if treated as a confounder result in bias toward the null hypothesis
Ex.
Alcohol use in relation to risk of cardiovascular disease, with adjustment for serum level of HDL cholesterol
ConfoundingConfounding
fullfill the two first criteria for a confounder
A factor representing an intermediate step in the causal chain from exposure to outcome will:
if treated as a confounder result in bias toward the null
Alcohol use in relation to risk of cardiovascular disease, with adjustment for serum level of HDL cholesterol

IN DESIGN
� Randomization
ControlControl of of confoundingconfounding
� Restriction
� Matching
� Case-crossover
IN ANALYSIS
� Standardization
confoundingconfounding
� Stratification
� Multivariate analysis

ConfounderConfounder controlcontrol
RandomizationRandomization
Study subjects are randomly allocated to “exposure therapy”
or to “comparison therapy”. S
subsequently registered in each study arm
Ex: Patients are randomly allocated
placebo
� ”Golden standard” in studies of intended effects (e.g. drugs)
� Controls for known as well as unknown or unmeasurable confounders
� Often demands considerable resources
� Logistic/ethical considerations d
controlcontrol in designin design
RandomizationRandomization
Study subjects are randomly allocated to “exposure therapy”
”. Study outcome(s) of interest are
subsequently registered in each study arm
allocated to therapy with a new drug or to
”Golden standard” in studies of intended effects (e.g. drugs)
Controls for known as well as unknown or unmeasurable
Often demands considerable resources
s depending on the scientific question

The study includes individuals with specific characteristics,
thus avoiding (minimizing) potential confounding by these
characteristics
ConfounderConfounder controlcontrol
RestrictionRestriction
Ex: A study of physical activity and cardiovascular disease included
only men aged 50-60 years
� Risk of residual confounding if restriction is too broad
� Reduce the number of eligible study subjects, potentially yielding low statistical precision
� Reduces generalizability
� May alternatively be applied in the analysis
The study includes individuals with specific characteristics,
thus avoiding (minimizing) potential confounding by these
controlcontrol in designin design
RestrictionRestriction
A study of physical activity and cardiovascular disease included
Risk of residual confounding if restriction is too broad
Reduce the number of eligible study subjects, potentially yielding
May alternatively be applied in the analysis

ConfounderConfounder controlcontrol
MatchingMatching
� For each exposed individual, one (or more) nonindividual(s) are selected matched on specific characteristics to the exposed individualcharacteristics to the exposed individual
� Intuitively an imitation of the randomized trial
controlcontrol in designin design
MatchingMatching
For each exposed individual, one (or more) non-individual(s) are selected matched on specific characteristics to the exposed individualcharacteristics to the exposed individual
Intuitively an imitation of the randomized trial

ConfounderConfounder controlcontrol
AimsAims
� To evaluate the effect of the exposure(s) in relation to the outcome(s) adjusted for other predictors of the studied outcome(s) outcome(s)
� To evaluate potential interaction/effect modification
controlcontrol in in analysisanalysis
AimsAims
To evaluate the effect of the exposure(s) in relation to the outcome(s) adjusted for other predictors of the studied
To evaluate potential interaction/effect modification

� Indirect standardization
� Stratum-specific rates from a reference population are applied to the studied
(exposed) population
� Is the number of outcomes in the studied population higher (orlower) than would be expected if the incidence rates in the
ConfounderConfounder controlcontrol
StandardizationStandardization
lower) than would be expected if the incidence rates in thestudied population were the same as in the reference population?
� Direct standardization
� Rates from the studied population are applied to a
reference population (non-exposed population or external population)
� Intuitively simply methods
� Can only incorporate few variables
specific rates from a reference population are applied to the studied
Is the number of outcomes in the studied population higher (orlower) than would be expected if the incidence rates in the
controlcontrol in designin design
StandardizationStandardization
lower) than would be expected if the incidence rates in thestudied population were the same as in the reference population?
Rates from the studied population are applied to a
exposed population or external
Intuitively simply methods
Can only incorporate few variables

ConfounderConfounder controlcontrol
StratificationStratification
The material is stratified into categories (strata) of each potential confounder
Risk estimates are computed for each strata that may be Risk estimates are computed for each strata that may be combined to summary estimates
� Intuitively simple
� Becomes complicated if many strata
controlcontrol in in analysisanalysis
StratificationStratification
The material is stratified into categories (strata) of each
Risk estimates are computed for each strata that may be Risk estimates are computed for each strata that may be combined to summary estimates
Becomes complicated if many strata

Physical activity and mortality
Level of activity Deaths Person
Table A. Alle ages
Low to moderate 532
High 66
Tabel B1 35-45 yrs
Low to moderate 3
High 4
Tabel B2 45-55 yrs
Tabel B2 45-55 yrs
Low to moderate 62
High 20
Tabel B3 55-65 yrs
Low to moderate 183
High 34
Tabel B4 65-75 yrs
Low to moderate 284
High 8
Mantel-Haenszel RR, adjusted for age
Physical activity and mortality
Person-years Incidence
per 10000
RR
65000 81.8 3.4
27700 23.8 1.0 (ref)
5900 5.1 1.1
8300 4.8
17600 35.2 1.9
11000 18.2
23700 77.2 1.7
7400 45.9
17800 159.6 2.0
1000 80.0
adjusted for age = 1.8
ConfounderConfounder controlcontrol
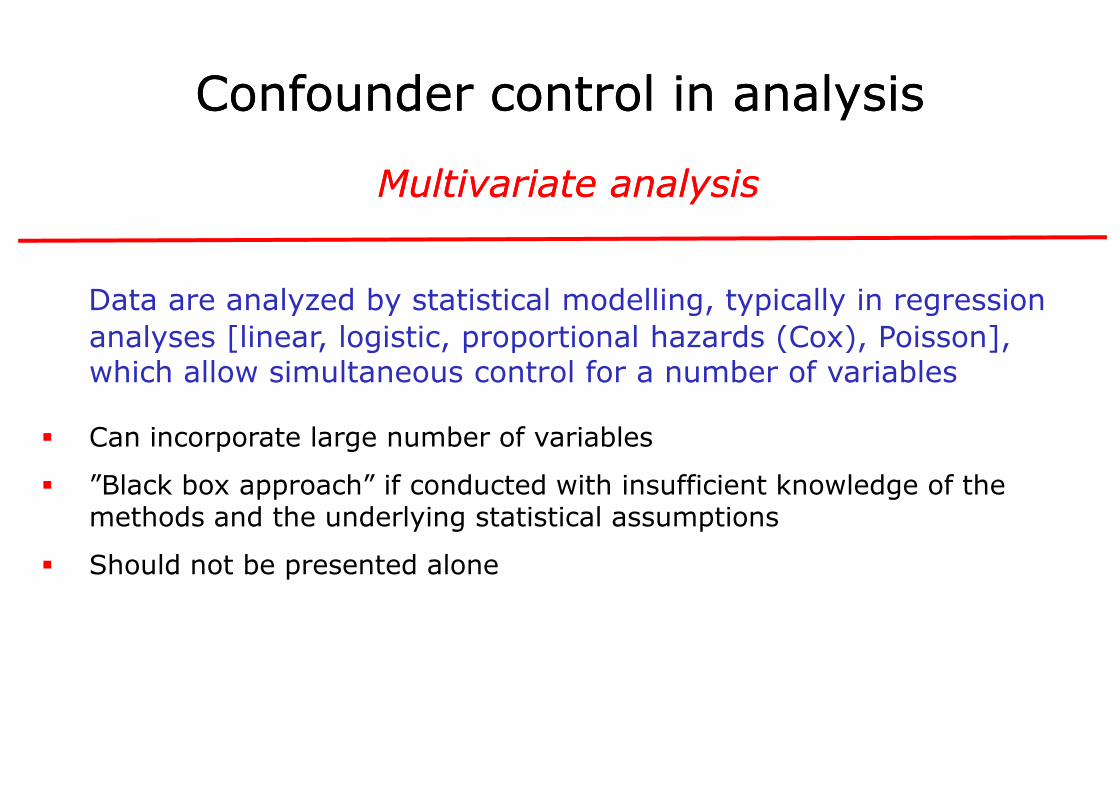
MultivariateMultivariate
Data are analyzed by statistical modelling, typically in regression
analyses [linear, logistic, proportional hazards (Cox), Poisson], which allow simultaneous control for a number of variables
� Can incorporate large number of variables
� ”Black box approach” if conducted with insufficient knowledge of the methods and the underlying statistical assumptions
� Should not be presented alone
controlcontrol in in analysisanalysis
MultivariateMultivariate analysisanalysis
Data are analyzed by statistical modelling, typically in regression
analyses [linear, logistic, proportional hazards (Cox), Poisson], which allow simultaneous control for a number of variables
Can incorporate large number of variables
”Black box approach” if conducted with insufficient knowledge of the methods and the underlying statistical assumptions

CONFOUNDINGCONFOUNDING
“Can only be controlled for“Can only be controlled for
if you have thought of it!”
CONFOUNDINGCONFOUNDING
“Can only be controlled for“Can only be controlled for
if you have thought of it!”

EffectEffect modificationmodification
Exposure
Effect modifier
� The effect of one factor on outcome is modified by levels of another factor
� Important to present and discuss
� A factor may be both a confounder and an effect modifier
Effect modifier
modificationmodification
Effect modifier
Outcome
The effect of one factor on outcome is modified by levels of another
Important to present and discuss
A factor may be both a confounder and an effect modifier
Effect modifier

Cohort study: Association between smoking and cancer
Table A. All ages
Stratification according to age
EffectEffect modificationmodification
Stratification according to age
20-29 years
30-39 years
40+ years
Mantel-Haenszel OR, adjusted for age
between smoking and cervical
Exp RR
-Smoking 1.0 +Smoking 3.6
according to age
modificationmodification
according to age
-Smoking 1.0
+Smoking 7.9
-Smoking 1.0
+Smoking 3.9
-Smoking 1.0
+Smoking 1.8
adjusted for age = 3.4

ConfoundingConfounding
The indication(s) for treatment or the reason(s) for
choosing one treatment in preference to another are
associated with the risk of the studied outcome(s)
� Confounding by disease (being treated)
� Confounding by severity/prognosis
� (Shared risk factors)
� (Protopathic bias/reverse causation)
by by indicationindication
The indication(s) for treatment or the reason(s) for
choosing one treatment in preference to another are
associated with the risk of the studied outcome(s)
Confounding by disease (being treated)
Confounding by severity/prognosis
(Protopathic bias/reverse causation)

ConfoundingConfounding
A A fewfew examplesexamples
� Red car & accidents, RR~1.2
� Blood transfusion & 24 h mortality, RR~6
� Blood transfusion & Hepatitis, RR~6
� Aspirin & Mortality
� Calcium channel blockers & Myocardial infarction
� HRT & Myocardial infarction
INTERPRETATION?
by by indicationindication
examplesexamples
Red car & accidents, RR~1.2
Blood transfusion & 24 h mortality, RR~6
Blood transfusion & Hepatitis, RR~6
Calcium channel blockers & Myocardial infarction
HRT & Myocardial infarction
INTERPRETATION?

Is the disease being treated associated with the outcome?
No
ConfoundingConfounding
Can potentially compare to undiseased or diseased
Is the disease being treated associated with the outcome?
Yes or unknown
by by indicationindication
Is disease severity associated with the outcome?
Can disease severity be measured?

�Confounding by indication is the Achilles heel of pharmacoepidemiology
�Observational studies only provides measures of associations
ConfoundingConfounding
� “Risk ratio” should be interpreted as “association ratio”
�Evaluate any relation between indication and outcome of interest, determinants of treatment of choice (“the art of medicine”), shared risk factors, and potential protopathic bias
Confounding by indication is the Achilles heel of
Observational studies only provides measures of associations
by by indicationindication
“Risk ratio” should be interpreted as “association ratio”
Evaluate any relation between indication and outcome of interest, determinants of treatment of choice (“the art of medicine”), shared risk factors, and potential protopathic

All
A
B
ConfoundingConfounding
HypotheticalHypothetical
RR = 18%/7% = 2.5
Severe disease
A
B
RR = 20%/40% =0.5
Mild to moderate disease
A
B
RR = 2%/4% = 0.5
Death
Yes No Total
202 898 1100
8 102 110
ConfoundingConfounding by by severityseverity
HypotheticalHypothetical cohortcohort studystudy
200 800 1000
4 6 10
2 98 100
4 96 100

MiettinensMiettinens
AnticoagulantsAnticoagulants
Exposure: Use of anticoagulants
Outcome: Deep venous thrombosis (DVT)Outcome: Deep venous thrombosis (DVT)
True rate ratio (RR): <1
Analysis adjusted for age and gender:
Analysis adjusted for age, gender and other known risk factors for DVT:
MiettinensMiettinens exerciseexercise
AnticoagulantsAnticoagulants and DVTand DVT
Exposure: Use of anticoagulants
Outcome: Deep venous thrombosis (DVT)Outcome: Deep venous thrombosis (DVT)
Analysis adjusted for age and gender: RR = 27
Analysis adjusted for age, gender and other known risk factors for DVT: RR = 4

MiettinensMiettinens
ConclusionsConclusions
Confounding by indication can be very strong
Often impossible to fully adjust for confounding Often impossible to fully adjust for confounding by indication in studies with nondesign
Miettinen OS. The need for randomization in the study of intended effects. Stat Med 1983; 2: 267-71.
MiettinensMiettinens exerciseexercise
ConclusionsConclusions
Confounding by indication can be very strong
Often impossible to fully adjust for confounding Often impossible to fully adjust for confounding by indication in studies with non-randomized
Miettinen OS. The need for randomization in the study of intended

Evaluation of biasEvaluation of bias
� Definition of exposure(s) and outcome(s)
� Study design and sample size
� Time sequence
� Selection of study population
� representative of population in study base?
� comparison group?
� Ascertainment of exposure and outcome � Ascertainment of exposure and outcome
� instrument
� methods of assessment similar for each study group?
� knowledge of hypothesis and the other study axis (exposure/outcome)?
• study subject/observer
� Recording and computation of results
� same methods for each study group?
� allocation of person-time appropriate?
� varying results with severity of disease?
Evaluation of biasEvaluation of bias
Definition of exposure(s) and outcome(s)
representative of population in study base?
Ascertainment of exposure and outcome
Theoretical vs.
empirical definition?Ascertainment of exposure and outcome
methods of assessment similar for each study
knowledge of hypothesis and the other study
same methods for each study group?
time appropriate?
varying results with severity of disease?
empirical definition?
Precision?
Selection bias?
Information bias?

Bias in epidemiologic studies Bias in epidemiologic studies
Important aspectsImportant aspects
�Be careful with the first study
� Difficult to disprove hypotheses
�Main principles
� Comparability
� Validity
� Completeness
Bias in epidemiologic studies Bias in epidemiologic studies
Important aspectsImportant aspects
Be careful with the first study
Difficult to disprove hypotheses