bia 658 – social network analysis - final report kanad chatterjee
TRANSCRIPT

1
BIA 658 – Social Network Analysis
Marketing Research Analysis using Facebook Network
Instructor: Prof. Yasuaki Sakamoto
By: Kanad Chatterjee
Spring 2014

2
Contents
Introduction ........................................................................................................... 3
Key User Identification ........................................................................................... 3 Connectors or Hubs (Influence parameter – Degree) .................................................. 4 Brokers or Bridges (Influence parameter – Betweenness) .......................................... 5 Speed of Propagation (Influence Parameter – Closeness) .......................................... 6 Shortest Path between Nodes ..................................................................................... 7
Community Identification (Using Facebook likes data) ........................................... 8 Attribute Addition to Nodes for Community Identification ............................................. 9 Community Identification – “Local Business” ............................................................. 10 Community Identification – “Small Business” ............................................................. 11
Geo-‐Specific Analysis ............................................................................................ 12 Country-wise Grouping .............................................................................................. 13 Country-specific Network Extraction .......................................................................... 14 Engagement Quadrant ......................................................................................... 15
References ........................................................................................................... 16

3
Introduction In the present world as well as in the immediate foreseeable future the influencing power that social networking websites such as Facebook and Twitter have over their users can not be denied. These sites have become the hotbeds for media campaigns ranging from consumer goods to elections. Businesses have been prompt to cash in on the potential that these social networking sites hold. More than 42% of B2B companies and almost 64% B2C companies have acquired at least one major client through the use of effective Facebook campaigns. As part of this project we have therefore tried to come up with various analyses that are specific to analyzing Facebook data, but could be conveniently used for other such sites as well to identify core interest groups for specific businesses and devise marketing and advertising strategies. The analysis undertaken can be broadly grouped as:
• Key Users (Nodes) identification § Connectors or Hubs § Brokers § Speed of propagation
• Community Identification • Geo-spatial analysis • Engagement quadrant
The data used for the analysis is the personal Facebook data for the team members (Kanad Chatterjee & Kanika Jain) and added Facebook data from few of their friends and family obtained with their consent, through the use of Netvizz application provided by Facebook. The data utilized for the analysis are “Basic Data” (shows Users and connections amongst them) and the “Likes” data (shows what various Users have liked and the for the items liked their popularity). The intent is to be able to identify influential nodes who can then be studied further to categorize them into potential consumers, partners, suppliers etc.
Key User Identification To effectively understand any social network and harness its power we need to identify who clearly the roles that various users are playing in the network – who are the leaders, influencers, connectors etc. We also need to be able to answer questions such as - what clusters exist within the network and who are in them? Who is (are) at the core of the network and who is at the periphery?

4
Connectors or Hubs (Influence parameter – Degree) Degree of a node is the measure of the number of direct connections that the node has with other nodes within the network. Therefore nodes with highest degree are the most active and can be thought of as “Connectors or Hubs”. These are the nodes that most effectively connect other nodes across the network that are not directly connected to each other. In the figure below the nodes are sized by their Degree measure giving us a clear picture of who the top connectors are in this particular network. For instance, we observe that “Gaurav Jain”, “Ashish Agrawal” and “Pallavi Vaid” are the top connectors in terms of direct connections, meaning they would be most effective in spreading information across the network.
Nodes sized by Degree to show top Connectors or Hubs

5
Brokers or Bridges (Influence parameter – Betweenness) Although the nodes with higher Degree measures have more direct connections within the network, there are other nodes that might be better placed in terms of location, measured by Betweenness Centrality. Nodes with high betweenness have great influence over what does or does not flow over the network. They can therefore be seen as information brokers and play a crucial role in any social network. These are the people through which majority of all information with pass through from one end of the network to another. An interesting observation here is that though “Gaurav Jain” and “Pallavi Vaid” both had more direct connections as compared to “Ashish Agrawal, he has a higher betweenness suggesting that he would be better placed to control the flow of information across the various communities.
Nodes sized by Betweenness Centrality to show top Brokers or Bridges

6
Speed of Propagation (Influence Parameter – Closeness) While Degree and Betweenness show which nodes have more influence in terms of effectiveness and flow-control of information across the network, another parameter, Closeness Centrality, defines how quickly a node will be able to propagate the information across the network. The nodes with higher Closeness Centrality will have the earliest visibility of any information flowing through the network and will also be the quickest to spread any information through the network, making them ideal candidates for blitz advertisement or branding campaigns. For instance, in the figure below “Himanshu Upadhyay”, “Namrata Lal” and “Vaibhav Jain” are the best propagators.
Nodes sized by Closeness Centrality to show top Propagators

7
Shortest Path between Nodes As part of this project anything similar, the Facebook data from multiple users network is combined to create a larger network. And therefore it could very well happen that the businesses undertaking the analysis do not have any existing connection whatsoever to the most influential nodes through any other nodes. However, if such connections already exist it would prove beneficial to identify the same and use them for possible referrals when going in for any targeted advertisements or business pitches.
Shortest Path between any two nodes selected. Path shown is Directed from Kanika Jain to Ashish Agrawal

8
Community Identification (Using Facebook likes data) Every user within the Facebook network generally builds up memberships to some groups over the period of their subscription. These followership or “likes” can be used to map out users whom we would like to target as part of out marketing and advertising analysis. The way we approached this area was to assign separate attribute values to each User or Node based on the groups they expressed interest in. This would ensure that Community identification is very clean and would also help us study the various groups and their individual dynamics separately in Gephi, using filters for the various groups that we might be interested in. Another advantage of assigning multiple attributes to Users or Nodes using groups is to be able to easily identify cross-pollinators across groups. The attribute creation is accomplished by the way of writing simple “Join” queries between the “Basic” and “Likes” user data, through the use of a SQL database and queries.
9
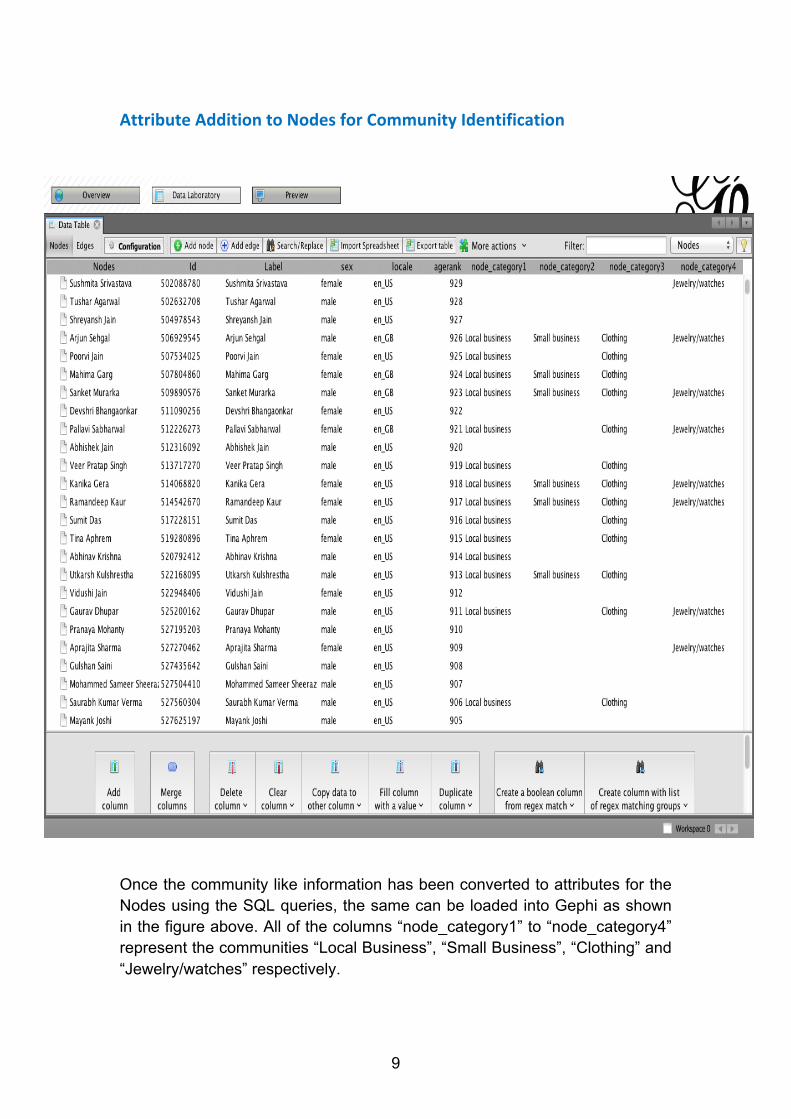
Attribute Addition to Nodes for Community Identification
Once the community like information has been converted to attributes for the Nodes using the SQL queries, the same can be loaded into Gephi as shown in the figure above. All of the columns “node_category1” to “node_category4” represent the communities “Local Business”, “Small Business”, “Clothing” and “Jewelry/watches” respectively.

10
Community Identification – “Local Business”
The figure above shows the community “Local Business”, with the nodes sized by “Degree” and coloured by countries. This has been achieved by filtering the nodes based on the attribute “node_category1” that we created for identifying this particular community using the method described just above. This gives us insights into people who are interested in local businesses. They might comprise of consumers, possible future partners or suppliers for our own business. However, identification and segregation of users into such groups will require further information and analysis, such as text analysis of their like comments on Facebook, gathered through possible web scraping.
Nodes sized by Degree, Coloured by Country. Filtered on attribute node_category1=”Local Business”
11
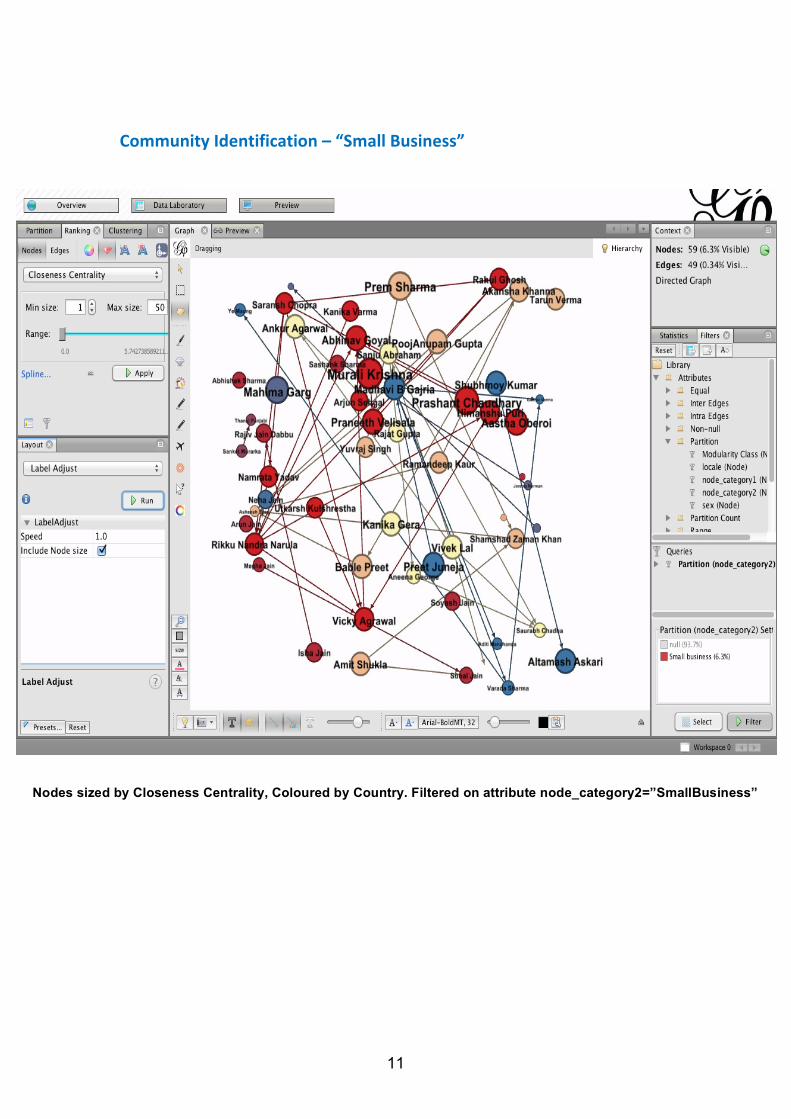
Community Identification – “Small Business”
Nodes sized by Closeness Centrality, Coloured by Country. Filtered on attribute node_category2=”SmallBusiness”

12
Geo-‐Specific Analysis All social networks have an underlying spatial architecture and the information flows through these geographically linked spaces often strongly influences attitudes and behaviours. People interact with their neighbours and the outcome of these interactions could be multifold e.g. change to their perception of certain products or services (either positive or negative), changes to their shopping patterns etc. Therefore we would like to identify all the geographical locations that our Facebook network consists of. The added advantage that Gephi provides us is the ability to group the Users or Nodes based on their geographical coordinates (Latitudes and Longitudes) using plugins such as “GeoLayout” or “Map of the World”. Now, we might not always have access to the exact location data for the users, because the availability of the same depends on individual privacy settings that users have on these social networks. However, in the absence of such straightforward location information, it is often possible to derive the same using some other attributes that are readily available. Here we have pursued an approach wherein we have used the “locale” information provided as part of the “likes” data from Facebook to derive the location information for the users. The “locale” data is a combination of the ISO Language and Country Codes respectively, concatenated using an underscore. The basic format is “ll_CC”, where ll is a two-letter language code, and CC is a two-letter country code. For instance, “en_US” represents U.S. English, “en_IN” represents Indian English. For this project we have used a simple “IF” function in excel to convert these “locales” into the respective country information e.g. “en_US” translates to “USA”, “en_IN” translates to “India” etc. Once we have the country attribute allocated to each node, we can bound all such nodes within the latitudinal and longitudinal limits for each country. For this project it was accomplished by using the RANDOM function in Excel with inputs as the lowest and highest latitudes and longitudes for the country, e.g. nodes with country as USA were bound between 24.52o N latitude to 49.38o N latitude, and from approximately 66.95o W longitude to 124.77o W longitude.
13
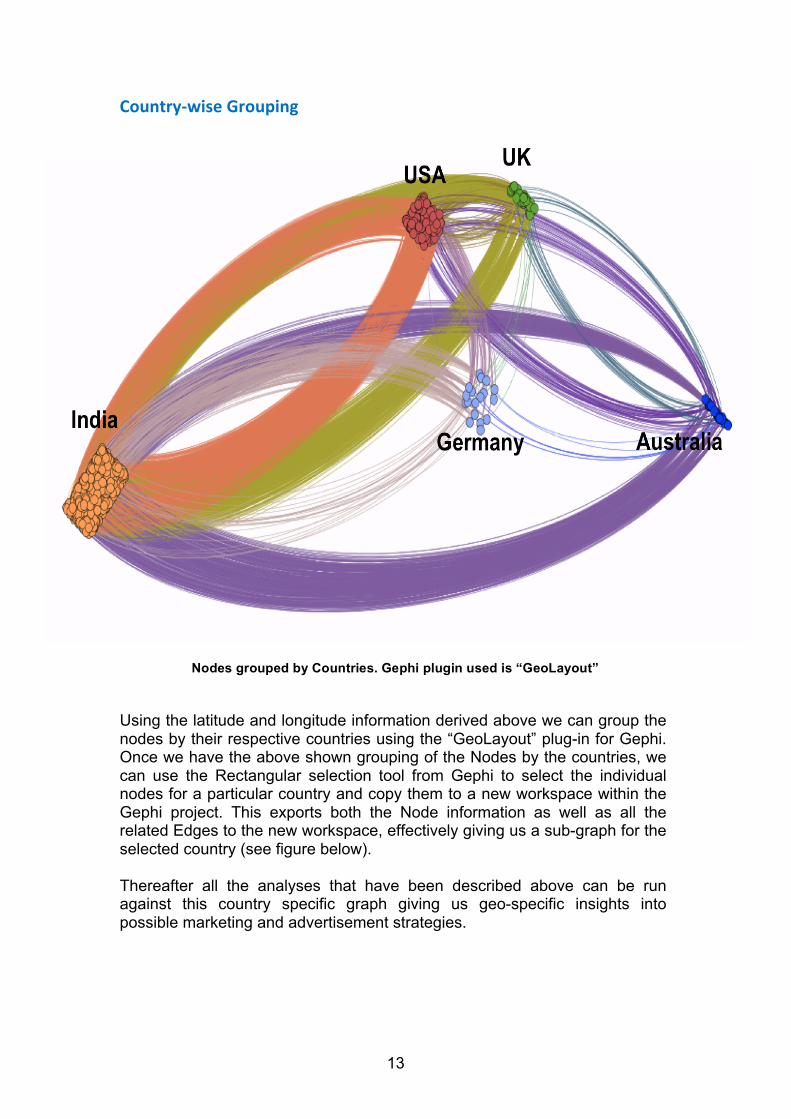
Country-‐wise Grouping
Using the latitude and longitude information derived above we can group the nodes by their respective countries using the “GeoLayout” plug-in for Gephi. Once we have the above shown grouping of the Nodes by the countries, we can use the Rectangular selection tool from Gephi to select the individual nodes for a particular country and copy them to a new workspace within the Gephi project. This exports both the Node information as well as all the related Edges to the new workspace, effectively giving us a sub-graph for the selected country (see figure below). Thereafter all the analyses that have been described above can be run against this country specific graph giving us geo-specific insights into possible marketing and advertisement strategies.
Nodes grouped by Countries. Gephi plugin used is “GeoLayout”

14
Country-‐specific Network Extraction
The figure above shows the network that we have for United Kingdom once we pull all the Nodes for UK into a separate workspace. The nodes have been sized by the “Degree” measure, giving us a clear picture of who the most influential individuals are within this geography. From this graph we also observe that the network within the UK geography is fairly well connected. In effect that means this network has a small world property and therefore information is going to propagate fairly quickly across this network. Therefore advertising campaigns utilizing this network has a chance of being fairly quick and effective.
Nodes grouped by Countries. Gephi plugin used is “GeoLayout”

15
Engagement Quadrant
The figure above gives us what we could term as an “Engagement Quadrant”. We have “Closeness Centrality” (Speediness parameter) mapped on the X-axis and “Degree” (Influence parameter) mapped on the Y-axis. And the Nodes have been sized on “Betweenness Centrality”. Then the graph has been divided into four quadrants to categorize the nodes into the four categories as defined in the figure. This quadrant helps us identify the relative importance of people within the network based on multiple criteria and come up with engagement strategies
16
accordingly. For instance, users in the “High Influence & High Propagator” category could very well be targeted to run some incentivized marketing or advertisement campaigns.
References
1. http://www.orgnet.com/sna.html 2. http://www.slideshare.net/gcheliotis/social-network-analysis-3273045 3. https://persuasionradio.wordpress.com/2010/05/06/using-netvizz-
gephi-to-analyze-a-facebook-network/ 4. http://noduslabs.com/cases/russian-protest-network-analysis-
facebook-gephi-netvizz/ 5. Hansen, Derek et al. (2010). Analyzing Social Media Networks with
NodeXL. Morgan Kaufmann. p. 32. ISBN 978-0-12-382229-1.