bi- and uniciliated ependymal cells define continuous
TRANSCRIPT

ARTICLE
Received 8 Aug 2016 | Accepted 31 Oct 2016 | Published 9 Jan 2017
Bi- and uniciliated ependymal cells definecontinuous floor-plate-derived tanycytic territoriesZaman Mirzadeh1, Yael Kusne1, Maria Duran-Moreno2, Elaine Cabrales1, Sara Gil-Perotin2, Christian Ortiz3,
Bin Chen3, Jose Manuel Garcia-Verdugo2, Nader Sanai1 & Arturo Alvarez-Buylla4
Multiciliated ependymal (E1) cells line the brain ventricles and are essential for brain
homeostasis. We previously identified in the lateral ventricles a rare ependymal subpopula-
tion (E2) with only two cilia and unique basal bodies. Here we show that E2 cells form a
distinct biciliated epithelium extending along the ventral third into the fourth ventricle. In the
third ventricle floor, apical profiles with only primary cilia define an additional uniciliated (E3)
epithelium. E2 and E3 cells’ ultrastructure, marker expression and basal processes indicate
that they correspond to subtypes of tanycytes. Using sonic hedgehog lineage tracing, we
show that the third and fourth ventricle E2 and E3 epithelia originate from the anterior floor
plate. E2 and E3 cells complete their differentiation 2–3 weeks after birth, suggesting a link to
postnatal maturation. These data reveal discrete bands of E2 and E3 cells that may relay
information from the CSF to underlying neural circuits along the ventral midline.
DOI: 10.1038/ncomms13759 OPEN
1 Division of Neurological Surgery, Barrow Neurological Institute, Phoenix, Arizona 85013, USA. 2 Laboratory of Comparative Neurobiology, InstitutoCavanilles, CIBERNED, Universidad de Valencia, Valencia 46980, Spain. 3 Department of Molecular, Cell and Developmental Biology, University of California,Santa Cruz, California 95064, USA. 4 Department of Neurological Surgery and The Eli and Edythe Broad Center for Regeneration Medicine and Stem CellResearch, University of California, 35 Medical Center Way, Room RMB-1036, Campus Box 0525, San Francisco, California 94143, USA. Correspondence andrequests for materials should be addressed to Z.M. (email: [email protected]) or to A.A.-B. (email: [email protected]).
NATURE COMMUNICATIONS | 8:13759 | DOI: 10.1038/ncomms13759 | www.nature.com/naturecommunications 1

The ependymal epithelium lines the adult brain ventricles,where it plays key roles in cerebrospinal fluid (CSF) flowand brain homeostasis1,2. Cilia, a distinguishing feature of
ependymal cells, are critical to their development and function3–5.Using high-resolution imaging of the ependymal surface6, wepreviously identified an ependymal cell apical profile in the lateralventricles (LVs), with only 2 (9þ 2) cilia. These biciliatedependymal cells, called E2 cells, have two large basal bodieswith elaborate raceme-like appendages. The function and originof E2 cells remains unknown. These cells are extremely rare in theLVs, making them difficult to study.
Ependymal cells’ planar orientation3,4 is essential for propellingCSF7 and establishing chemorepellent gradients guidingmigratory neuroblasts in the adult brain8. Ependymal cells areintegral to the pinwheel organization and function of theadult germinal niche in the ventricular-subventricular zone6,9.Tanycytes, a subpopulation of ependymal cells bearing long basalprocesses, are abundant in the third ventricle and linecircumventricular organs10, where fenestrated capillaries permitneuroendocrine cross-talk11,12. For example, tanycytes of themedian eminence have critical functions in energy balance that,when disrupted, result in obesity13–16. However, the organizingprinciples and developmental patterning that establish thisependymal heterogeneity are unknown.
Ependymal cells are derived from radial glia17, the embryonicneural stem cells18. Recently, these stem cells were shown to haveremarkable heterogeneity19, with regionally restricted potentialto produce various neuronal subtypes. As descendants ofradial glia, ependymal cells may inherit this regional identity,which then determines their heterogeneity. Although ependymalheterogeneity, including two types of tanycytes (a and b), hasbeen documented in many species20–24, the embryonic origin ofthis heterogeneity has not been studied.
Here we identified a distinct epithelium of biciliated (E2)ependymal cells that extended along the ventral third ventricle(3 V), cerebral aqueduct (CAq) and fourth ventricle (4 V).Ultrastructural and molecular marker characterization identifiedE2 cells in the 3 V as a-tanycytes. In the floor of the 3 V, we founda third apical profile with a (9þ 0) primary cilium characterizinganother ependymal cell type (E3), which corresponded tob-tanycytes. These observations link functional subtypes oftanycytes to defining apical characteristics of E2 and E3 cells.Furthermore, we show that E2 cells extend as a continuousepithelium along the floor of the CAq and 4 V. We providemolecular markers that distinguish these different epithelia andlineage-traced E2 and E3 cells to embryonic progenitorsexpressing sonic hedgehog (Shh), suggesting they are floor-platederivatives. The work demonstrates that apical profile hetero-geneity among ependymal cells may be traced to an essentialtissue-organizing centre in the embryo and shifts our perspectiveof the ependyma from a simple ventricular lining to an organizedvestige of development with implications for its diverse functions.
ResultsApical profiles define ependymal territories. E2 cells comprisedo5% of cells contacting the LV6. We investigated whether E2cells were more common in other ventricles by mapping theirlocation in the walls of the third ventricle (3 V; Fig. 1a) and thefloor of the fourth ventricle (4 V) (Fig. 1h). Whole mounts fromthese walls were immunostained with g-tubulin and b-cateninantibodies, the ependymal surface was imaged sequentially tocover the entire surface and the location of E cell types weremapped.
In contrast to sparse E2 cells found in the LVs, a strikingE2 distribution was observed in the 3 and 4 V (Fig. 1a,h).
Dorsolaterally, E1 cells with sparsely intermixed E2 cells coveredthese walls, but there was a sharp margin approaching the ventralmidline where the epithelium changed abruptly (Fig. 1b,i).Beyond this margin in both the 3 and 4 V, the epithelium wascomposed almost uniformly of E2 cells, with little interminglingof E1 cells. This E2 epithelium was distinguished not only byunique basal bodies, but by highly interdigitating apicalmembranes marked by b-catenin (Fig. 1c,i). To examine E2 cilia,we stained wholemounts for g-tubulin, to identify basal bodies,and acetylated tubulin, to label cilia. E2 cells in the 3 and 4 Vdiffered in their cilia complement (Fig. 1e,f,j,k): in the 3 V, 37%were biciliated, 47% were uniciliated and 16% had no cilia(104 cells from 3 mice); in the 4 V, 80% were biciliated, 18% wereuniciliated and only 2% had no cilia (207 cells from 3 mice).Cilia length among E2 cells in the 3 V versus 4 V was similar(mean±s.d.): 3 V (12.3±1.8 mm) versus 4 V (12.0±1.9 mm;P¼ 0.6, two-tailed unpaired t-test). Apical surface size, however,differed (mean±s.d.): 3 V (74±26 mm2) versus 4 V (84±21 mm2;P¼ 0.01, two-tailed unpaired t-test).
Based on apical organization, a third epithelial cell type wasobserved, which we called E3 cells. E3 cells had a simple basalbody, a smaller apical surface area than E2 cells (25±6 mm2) andmore intense b-catenin expression at their intercellular junctions(Fig. 1d). These cells almost always (95% of 521 E3 cells from3 mice) extended a single, short cilium (5.0±1.0 mm) from theirapical surface (Fig. 1e,g). The relationship among E1, E2 and E3epithelia in the 3 V is shown in Fig. 1a: moving ventrally along the3 V wall, the transition from E1 to E2 cells was followed byanother transition, from E2 to E3 cells (Fig. 1d). Occasionally inthe E3 territory, E2 cells and, more rarely, E1 cells were observed.Two regions in the ventral 3 V contained E3 cells: along thepreoptic recess (Fig. 1a, preoptic area (POA)) and along theinfundibular recess, near the ventromedial hypothalamus andmedian eminence (Fig. 1a). Caudally, the E2 epithelium coveringthe ventromedial hypothalamus continued uninterrupted alongthe ventral midline, up the posterior limb of the 3 V through theCAq and into the 4 V floor. Performing whole mounts of theCAq was difficult due to its small diameter. We confirmed thecontinuity of the E2 epithelium from 3 to 4 V in g-tubulin-stainedserial coronal sections (Supplementary Fig. 1). In addition, the4 V E2 epithelium was continuous with the E2 epitheliumencircling the spinal cord central canal25. Identifying this distinctepithelium from 3 to 4 V facilitated ultrastructural and molecularmarker characterization of these cell types.
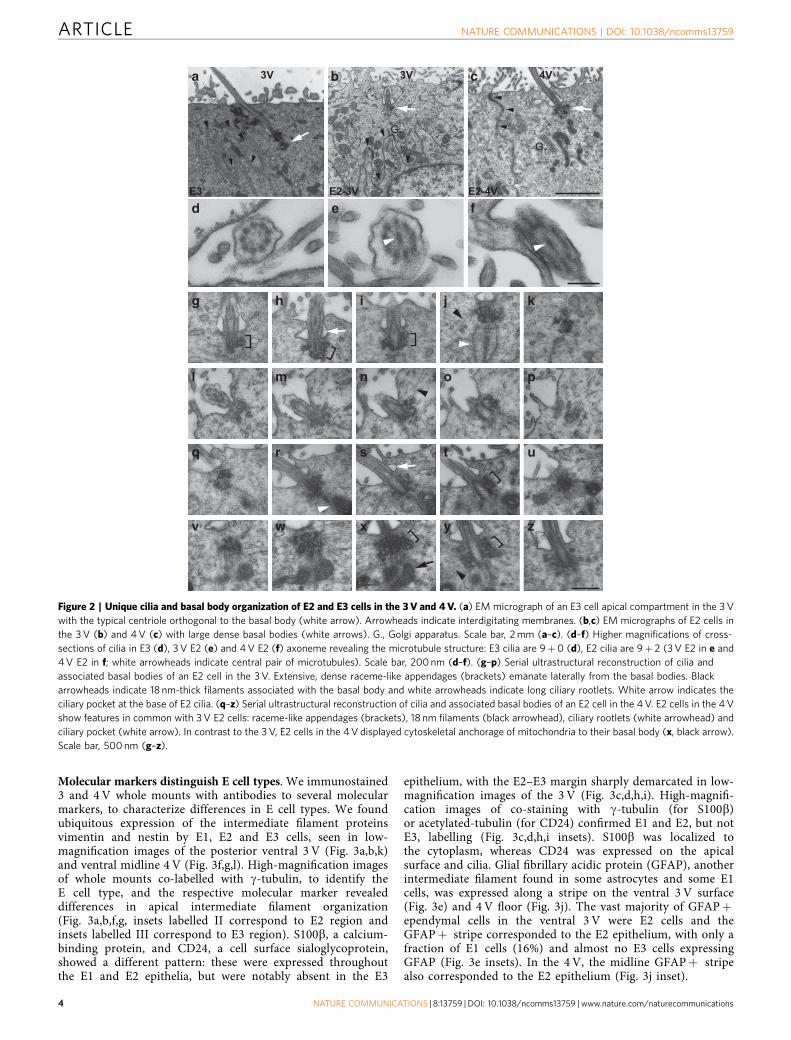
E2 and E3 cells have distinct basal bodies and cilia. By trans-mission electron microscopy, E3 cilia corresponded to primarycilia with (9þ 0) microtubule structure (Fig. 2a,d). The cilium wasnucleated by a basal body that had an associated, orthogonallyoriented centriole. E2 cilia in the 3 V (Fig. 2b,e) and 4 V (Fig. 2c,f)had a (9þ 2) microtubule structure, corresponding to motile cilia,as in E2 cells of the LVs and E1 cells6. However, unlike E1 basalbodies, which were small and had simpler organization, E2 basalbodies in the 3 V (Fig. 2g–p) and 4 V (Fig. 2q–z) elaborated race-me-like networks of dense particles from their sidewall. Associatedwith E2 basal bodies were 18 nm cytoskeletal filaments (Fig. 2j,n,y,black arrowhead) and striated ciliary rootlets (Fig. 2j,r, whitearrowhead). E2 cells had extensive apical membrane interdigita-tions with cell–cell junction complexes, including adherens and gapjunctions. E2 cells in the 4 V displayed cytoskeletal anchorage ofmany mitochondria to the proximal end of their basal bodies(Fig. 2x, black arrow), also found in E1 cells. This analysis showedthat E2 and E3 cells differed in their apical ciliary machinery, butE2 cells’ apical organization was largely similar throughout theventricular system.
ARTICLE NATURE COMMUNICATIONS | DOI: 10.1038/ncomms13759
2 NATURE COMMUNICATIONS | 8:13759 | DOI: 10.1038/ncomms13759 | www.nature.com/naturecommunications

D
A
3rd ventricle wall
E2
E2
E1
E3
γ tubβcat
γ tubαtub
b
c
d
e
f
g
E2
E3
a
b
c,f
d,g
Interthalamic adhesion(massa intermedia)
CAq
POA
ME
LV(r)
LV(l)
γtubβcat
γ tubαtub
h
A
P
4th ventricle floor
i
j
LL M
i
j
kE1 E2
E2-2
E2-1
E2-0
E3-1
E3-0
0
25
50
75
100
% C
ells
with
X c
ilia
m1m2m3
E2-2E2-
1E2-
00
25
50
75
100
% C
ells
with
X c
ilia
m1m2m3
*
Figure 1 | Territories of E2 and E3 cells in the third and fourth ventricles. (a,h) Whole mount maps of the 3 V wall (a) and 4 V floor (h) were derived from
tiled confocal images that reconstructed the ependymal surface, stained with g-tubulin and b-catenin antibodies, from a single mouse. Blue dots indicate E2
cells and red dots indicate E3 cells. (a) Dashed arrows through the foramen of Munro point towards right (r) and left (l) lateral ventricles (LV), and a third
dashed arrow points to the CAq; compass shows anterior (A) and dorsal (D) directions; letters indicate position of corresponding panels. ME, median
eminence; POA, preoptic area. Scale bar, 1 mm. (b–d) Confocal images of the 3 V surface stained with g-tubulin (red) and b-catenin (green) antibodies
showing the border between E1 and E2 cells (b), the E2 epithelium (c) and the E3 epithelium (d). Scale bar, 10mm (b–d,f,g). (e) Percentage of E2 cells with
2, 1 or 0 cilia and E3 cells with 1 or 0 cilia in the 3 V wall. One hundred and four E2 cells and 521 E3 cells analysed from N¼ 3 mice (m1–m3). (f,g) Confocal
images of the 3 V surface stained with g-tubulin (red) and acetylated a-tubulin (green) antibodies showing long cilia of biciliated or uniciliated E2 cells
(f, arrowheads) and short primary cilia on E3 cells (g, arrow). (h) One side of the 4 V floor was mapped completely (left) and the contralateral side (right)
to B1 mm beyond the midline (indicated by dashed line). Compass shows anterior (A), posterior (P), midline (M) and lateral (L) directions; letters indicate
position of corresponding panels; asterisk marks a position in the floor posterior to which the E2 distribution changed from a thick concentrated midline
band to thinner strips of E2 cells not limited to the midline. Scale bar, 1 mm. (i) Confocal image of the 4 V floor surface stained with antibodies to g-tubulin
(red) and b-catenin (green) showing the border between E1 and E2 cells just lateral to the midline. Dashed line indicates the midline. Scale bar, 10mm (i,j).
(j) Confocal image centred on the 4 V floor midline stained with antibodies to g-tubulin (red) and acetylated a-tubulin (green), revealing the midline
corridor of mostly biciliated E2 cells surrounded by multiciliated E1 cells. (k) Percentage of E2 cells with 2, 1 or 0 cilia in the 4 V floor. 207 E2 cells analysed
from N¼ 3 mice (m1–m3).
NATURE COMMUNICATIONS | DOI: 10.1038/ncomms13759 ARTICLE
NATURE COMMUNICATIONS | 8:13759 | DOI: 10.1038/ncomms13759 | www.nature.com/naturecommunications 3
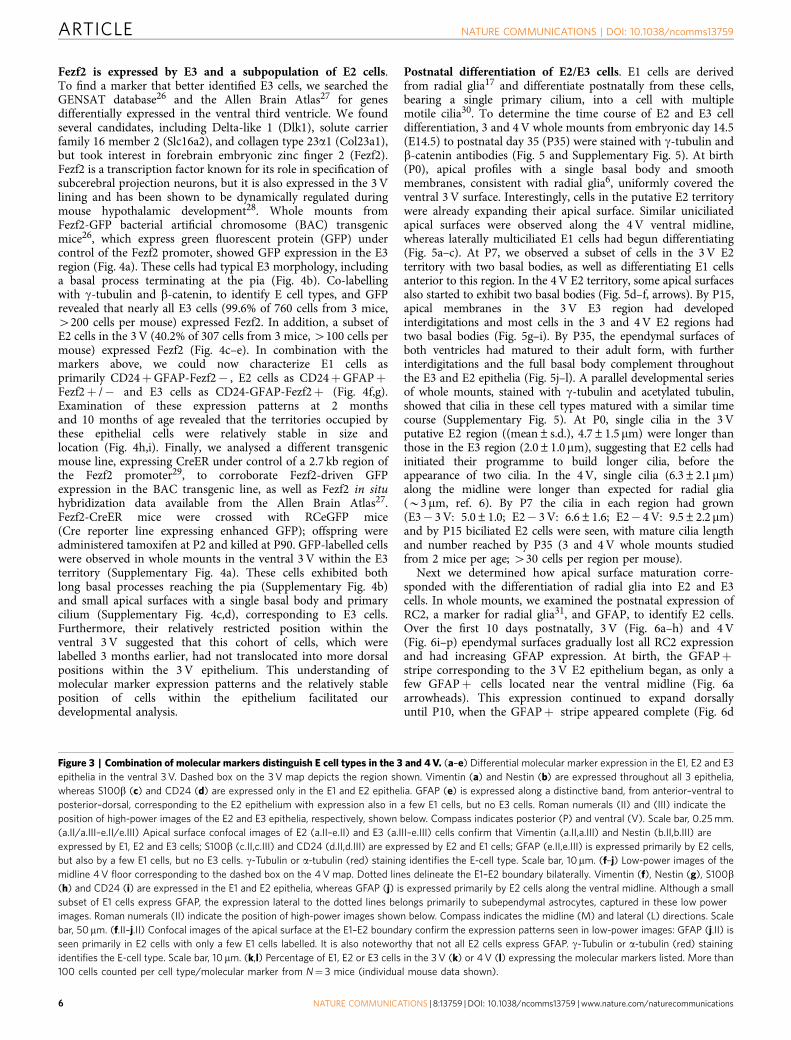
Molecular markers distinguish E cell types. We immunostained3 and 4 V whole mounts with antibodies to several molecularmarkers, to characterize differences in E cell types. We foundubiquitous expression of the intermediate filament proteinsvimentin and nestin by E1, E2 and E3 cells, seen in low-magnification images of the posterior ventral 3 V (Fig. 3a,b,k)and ventral midline 4 V (Fig. 3f,g,l). High-magnification imagesof whole mounts co-labelled with g-tubulin, to identify theE cell type, and the respective molecular marker revealeddifferences in apical intermediate filament organization(Fig. 3a,b,f,g, insets labelled II correspond to E2 region andinsets labelled III correspond to E3 region). S100b, a calcium-binding protein, and CD24, a cell surface sialoglycoprotein,showed a different pattern: these were expressed throughoutthe E1 and E2 epithelia, but were notably absent in the E3
epithelium, with the E2–E3 margin sharply demarcated in low-magnification images of the 3 V (Fig. 3c,d,h,i). High-magnifi-cation images of co-staining with g-tubulin (for S100b)or acetylated-tubulin (for CD24) confirmed E1 and E2, but notE3, labelling (Fig. 3c,d,h,i insets). S100b was localized tothe cytoplasm, whereas CD24 was expressed on the apicalsurface and cilia. Glial fibrillary acidic protein (GFAP), anotherintermediate filament found in some astrocytes and some E1cells, was expressed along a stripe on the ventral 3 V surface(Fig. 3e) and 4 V floor (Fig. 3j). The vast majority of GFAPþependymal cells in the ventral 3 V were E2 cells and theGFAPþ stripe corresponded to the E2 epithelium, with only afraction of E1 cells (16%) and almost no E3 cells expressingGFAP (Fig. 3e insets). In the 4 V, the midline GFAPþ stripealso corresponded to the E2 epithelium (Fig. 3j inset).
a b c
fed
g h i j k
l m n o p
utsrq
v w x y z
3V
E3 E2-3V E2-4V
3V 4V
G.G.
Figure 2 | Unique cilia and basal body organization of E2 and E3 cells in the 3 V and 4 V. (a) EM micrograph of an E3 cell apical compartment in the 3 V
with the typical centriole orthogonal to the basal body (white arrow). Arrowheads indicate interdigitating membranes. (b,c) EM micrographs of E2 cells in
the 3 V (b) and 4 V (c) with large dense basal bodies (white arrows). G., Golgi apparatus. Scale bar, 2 mm (a–c). (d–f) Higher magnifications of cross-
sections of cilia in E3 (d), 3 V E2 (e) and 4 V E2 (f) axoneme revealing the microtubule structure: E3 cilia are 9þ0 (d), E2 cilia are 9þ 2 (3 V E2 in e and
4 V E2 in f; white arrowheads indicate central pair of microtubules). Scale bar, 200 nm (d–f). (g–p) Serial ultrastructural reconstruction of cilia and
associated basal bodies of an E2 cell in the 3 V. Extensive, dense raceme-like appendages (brackets) emanate laterally from the basal bodies. Black
arrowheads indicate 18 nm-thick filaments associated with the basal body and white arrowheads indicate long ciliary rootlets. White arrow indicates the
ciliary pocket at the base of E2 cilia. (q–z) Serial ultrastructural reconstruction of cilia and associated basal bodies of an E2 cell in the 4 V. E2 cells in the 4 V
show features in common with 3 V E2 cells: raceme-like appendages (brackets), 18 nm filaments (black arrowhead), ciliary rootlets (white arrowhead) and
ciliary pocket (white arrow). In contrast to the 3 V, E2 cells in the 4 V displayed cytoskeletal anchorage of mitochondria to their basal body (x, black arrow).
Scale bar, 500 nm (g–z).
ARTICLE NATURE COMMUNICATIONS | DOI: 10.1038/ncomms13759
4 NATURE COMMUNICATIONS | 8:13759 | DOI: 10.1038/ncomms13759 | www.nature.com/naturecommunications

Whole mount expression patterns were matched to corre-sponding regions in immunostained serial coronal sections(Supplementary Figs 2 and 3), to characterize the basalmorphology of ependymal cell types. E2 and E3 cells hadlong basal processes, labelled by vimentin, Nestin and GFAP(E2 only). E3 processes primarily penetrated the medianeminence and arcuate nucleus, with many terminating atthe pia. E2 processes penetrated diencephalic and brainstemregions based on their location: rostrally, they extended into the
dorsal arcuate and ventromedial nuclei; caudally within the 3 V,they penetrated the caudal dorsomedial nucleus; along theposterior limb of the 3 V and CAq, they extended into theperiaqueductal gray and posterior hypothalamic nucleus; and atthe level of the 4 V, these processes were found in caudal dorsalraphe nuclei and penetrating the gigantocellular reticularnucleus. In sections and whole mounts, these cells could bedistinguished by GFAP/CD24/S100b expression in E2 cells andabsence in E3 cells.
II IIIII
III
Nestinγ tub
Nestinγ tub
Nestinγ tub
Nestin
Nestin
II
LL M
P
V
Vimentin
IIII II
II
II III II III IIIII
GFAPS100β CD24
Vimentinγ tub
Vimentinγ tub
Vimentinγ tub
Vimentin GFAP
GFAPγ tub
GFAPγ tub
GFAPγ tub
s100β
s100βγ tub
s100βγ tub
s100βγ tub
αtubCD24
αtubCD24
αtubCD24
CD24
a b c d e
a.II b.II c.II d.II e.II
a.III b.III c.III d.III e.III
f g h i j
f.II g.II h.II i.II j.II
3rd ventricle
4th ventricle
3VE1
E2
E3
100
80
60
% C
ells
40
20
0
VIM
EN
TIN
NE
ST
IN
S100B
CD
24
GF
AP
4V
E1
E2
100
80
60
% C
ells
40
20
0
VIM
EN
TIN
NE
ST
IN
S100B
CD
24
GF
AP
lk
NATURE COMMUNICATIONS | DOI: 10.1038/ncomms13759 ARTICLE
NATURE COMMUNICATIONS | 8:13759 | DOI: 10.1038/ncomms13759 | www.nature.com/naturecommunications 5
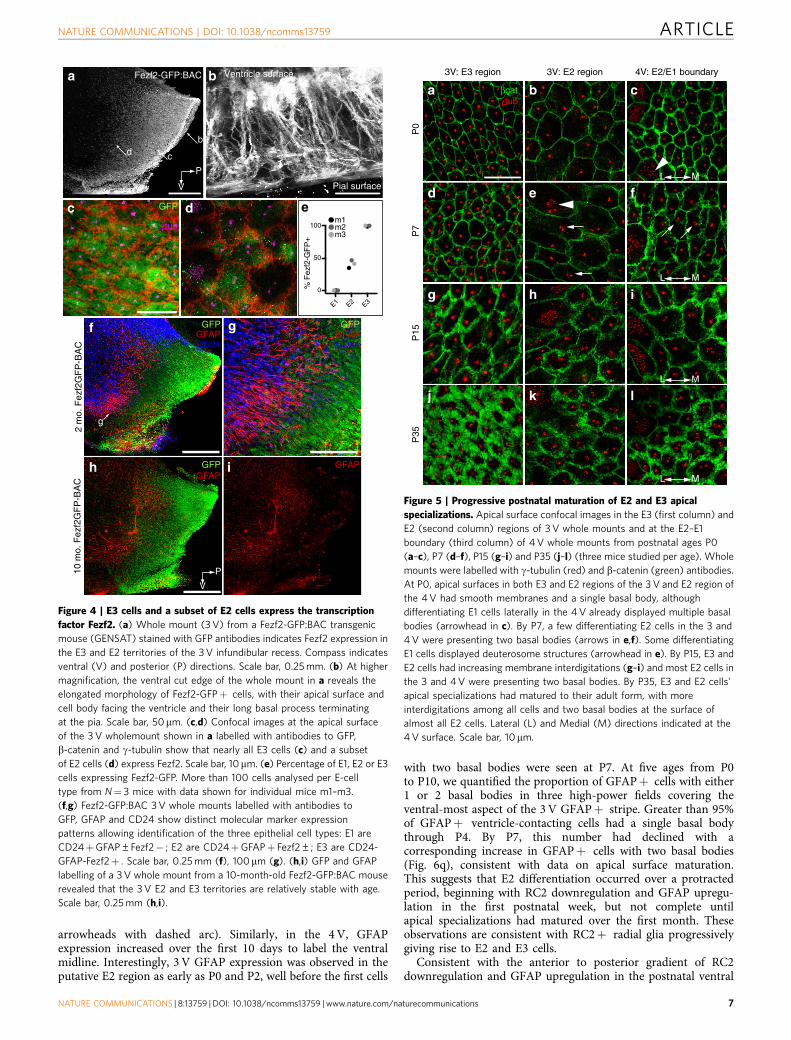
Fezf2 is expressed by E3 and a subpopulation of E2 cells.To find a marker that better identified E3 cells, we searched theGENSAT database26 and the Allen Brain Atlas27 for genesdifferentially expressed in the ventral third ventricle. We foundseveral candidates, including Delta-like 1 (Dlk1), solute carrierfamily 16 member 2 (Slc16a2), and collagen type 23a1 (Col23a1),but took interest in forebrain embryonic zinc finger 2 (Fezf2).Fezf2 is a transcription factor known for its role in specification ofsubcerebral projection neurons, but it is also expressed in the 3 Vlining and has been shown to be dynamically regulated duringmouse hypothalamic development28. Whole mounts fromFezf2-GFP bacterial artificial chromosome (BAC) transgenicmice26, which express green fluorescent protein (GFP) undercontrol of the Fezf2 promoter, showed GFP expression in the E3region (Fig. 4a). These cells had typical E3 morphology, includinga basal process terminating at the pia (Fig. 4b). Co-labellingwith g-tubulin and b-catenin, to identify E cell types, and GFPrevealed that nearly all E3 cells (99.6% of 760 cells from 3 mice,4200 cells per mouse) expressed Fezf2. In addition, a subset ofE2 cells in the 3 V (40.2% of 307 cells from 3 mice, 4100 cells permouse) expressed Fezf2 (Fig. 4c–e). In combination with themarkers above, we could now characterize E1 cells asprimarily CD24þGFAP-Fezf2� , E2 cells as CD24þGFAPþFezf2þ /� and E3 cells as CD24-GFAP-Fezf2þ (Fig. 4f,g).Examination of these expression patterns at 2 monthsand 10 months of age revealed that the territories occupied bythese epithelial cells were relatively stable in size andlocation (Fig. 4h,i). Finally, we analysed a different transgenicmouse line, expressing CreER under control of a 2.7 kb region ofthe Fezf2 promoter29, to corroborate Fezf2-driven GFPexpression in the BAC transgenic line, as well as Fezf2 in situhybridization data available from the Allen Brain Atlas27.Fezf2-CreER mice were crossed with RCeGFP mice(Cre reporter line expressing enhanced GFP); offspring wereadministered tamoxifen at P2 and killed at P90. GFP-labelled cellswere observed in whole mounts in the ventral 3 V within the E3territory (Supplementary Fig. 4a). These cells exhibited bothlong basal processes reaching the pia (Supplementary Fig. 4b)and small apical surfaces with a single basal body and primarycilium (Supplementary Fig. 4c,d), corresponding to E3 cells.Furthermore, their relatively restricted position within theventral 3 V suggested that this cohort of cells, which werelabelled 3 months earlier, had not translocated into more dorsalpositions within the 3 V epithelium. This understanding ofmolecular marker expression patterns and the relatively stableposition of cells within the epithelium facilitated ourdevelopmental analysis.
Postnatal differentiation of E2/E3 cells. E1 cells are derivedfrom radial glia17 and differentiate postnatally from these cells,bearing a single primary cilium, into a cell with multiplemotile cilia30. To determine the time course of E2 and E3 celldifferentiation, 3 and 4 V whole mounts from embryonic day 14.5(E14.5) to postnatal day 35 (P35) were stained with g-tubulin andb-catenin antibodies (Fig. 5 and Supplementary Fig. 5). At birth(P0), apical profiles with a single basal body and smoothmembranes, consistent with radial glia6, uniformly covered theventral 3 V surface. Interestingly, cells in the putative E2 territorywere already expanding their apical surface. Similar uniciliatedapical surfaces were observed along the 4 V ventral midline,whereas laterally multiciliated E1 cells had begun differentiating(Fig. 5a–c). At P7, we observed a subset of cells in the 3 V E2territory with two basal bodies, as well as differentiating E1 cellsanterior to this region. In the 4 V E2 territory, some apical surfacesalso started to exhibit two basal bodies (Fig. 5d–f, arrows). By P15,apical membranes in the 3 V E3 region had developedinterdigitations and most cells in the 3 and 4 V E2 regions hadtwo basal bodies (Fig. 5g–i). By P35, the ependymal surfaces ofboth ventricles had matured to their adult form, with furtherinterdigitations and the full basal body complement throughoutthe E3 and E2 epithelia (Fig. 5j–l). A parallel developmental seriesof whole mounts, stained with g-tubulin and acetylated tubulin,showed that cilia in these cell types matured with a similar timecourse (Supplementary Fig. 5). At P0, single cilia in the 3 Vputative E2 region ((mean±s.d.), 4.7±1.5mm) were longer thanthose in the E3 region (2.0±1.0mm), suggesting that E2 cells hadinitiated their programme to build longer cilia, before theappearance of two cilia. In the 4 V, single cilia (6.3±2.1mm)along the midline were longer than expected for radial glia(B3mm, ref. 6). By P7 the cilia in each region had grown(E3� 3 V: 5.0±1.0; E2� 3 V: 6.6±1.6; E2� 4 V: 9.5±2.2mm)and by P15 biciliated E2 cells were seen, with mature cilia lengthand number reached by P35 (3 and 4 V whole mounts studiedfrom 2 mice per age; 430 cells per region per mouse).
Next we determined how apical surface maturation corre-sponded with the differentiation of radial glia into E2 and E3cells. In whole mounts, we examined the postnatal expression ofRC2, a marker for radial glia31, and GFAP, to identify E2 cells.Over the first 10 days postnatally, 3 V (Fig. 6a–h) and 4 V(Fig. 6i–p) ependymal surfaces gradually lost all RC2 expressionand had increasing GFAP expression. At birth, the GFAPþstripe corresponding to the 3 V E2 epithelium began, as only afew GFAPþ cells located near the ventral midline (Fig. 6aarrowheads). This expression continued to expand dorsallyuntil P10, when the GFAPþ stripe appeared complete (Fig. 6d
Figure 3 | Combination of molecular markers distinguish E cell types in the 3 and 4 V. (a–e) Differential molecular marker expression in the E1, E2 and E3
epithelia in the ventral 3 V. Dashed box on the 3 V map depicts the region shown. Vimentin (a) and Nestin (b) are expressed throughout all 3 epithelia,
whereas S100b (c) and CD24 (d) are expressed only in the E1 and E2 epithelia. GFAP (e) is expressed along a distinctive band, from anterior–ventral to
posterior–dorsal, corresponding to the E2 epithelium with expression also in a few E1 cells, but no E3 cells. Roman numerals (II) and (III) indicate the
position of high-power images of the E2 and E3 epithelia, respectively, shown below. Compass indicates posterior (P) and ventral (V). Scale bar, 0.25 mm.
(a.II/a.III–e.II/e.III) Apical surface confocal images of E2 (a.II–e.II) and E3 (a.III–e.III) cells confirm that Vimentin (a.II,a.III) and Nestin (b.II,b.III) are
expressed by E1, E2 and E3 cells; S100b (c.II,c.III) and CD24 (d.II,d.III) are expressed by E2 and E1 cells; GFAP (e.II,e.III) is expressed primarily by E2 cells,
but also by a few E1 cells, but no E3 cells. g-Tubulin or a-tubulin (red) staining identifies the E-cell type. Scale bar, 10mm. (f–j) Low-power images of the
midline 4 V floor corresponding to the dashed box on the 4 V map. Dotted lines delineate the E1–E2 boundary bilaterally. Vimentin (f), Nestin (g), S100b(h) and CD24 (i) are expressed in the E1 and E2 epithelia, whereas GFAP (j) is expressed primarily by E2 cells along the ventral midline. Although a small
subset of E1 cells express GFAP, the expression lateral to the dotted lines belongs primarily to subependymal astrocytes, captured in these low power
images. Roman numerals (II) indicate the position of high-power images shown below. Compass indicates the midline (M) and lateral (L) directions. Scale
bar, 50mm. (f.II–j.II) Confocal images of the apical surface at the E1–E2 boundary confirm the expression patterns seen in low-power images: GFAP (j.II) is
seen primarily in E2 cells with only a few E1 cells labelled. It is also noteworthy that not all E2 cells express GFAP. g-Tubulin or a-tubulin (red) staining
identifies the E-cell type. Scale bar, 10 mm. (k,l) Percentage of E1, E2 or E3 cells in the 3 V (k) or 4 V (l) expressing the molecular markers listed. More than
100 cells counted per cell type/molecular marker from N¼ 3 mice (individual mouse data shown).
ARTICLE NATURE COMMUNICATIONS | DOI: 10.1038/ncomms13759
6 NATURE COMMUNICATIONS | 8:13759 | DOI: 10.1038/ncomms13759 | www.nature.com/naturecommunications
arrowheads with dashed arc). Similarly, in the 4 V, GFAPexpression increased over the first 10 days to label the ventralmidline. Interestingly, 3 V GFAP expression was observed in theputative E2 region as early as P0 and P2, well before the first cells
with two basal bodies were seen at P7. At five ages from P0to P10, we quantified the proportion of GFAPþ cells with either1 or 2 basal bodies in three high-power fields covering theventral-most aspect of the 3 V GFAPþ stripe. Greater than 95%of GFAPþ ventricle-contacting cells had a single basal bodythrough P4. By P7, this number had declined with acorresponding increase in GFAPþ cells with two basal bodies(Fig. 6q), consistent with data on apical surface maturation.This suggests that E2 differentiation occurred over a protractedperiod, beginning with RC2 downregulation and GFAP upregu-lation in the first postnatal week, but not complete untilapical specializations had matured over the first month. Theseobservations are consistent with RC2þ radial glia progressivelygiving rise to E2 and E3 cells.
Consistent with the anterior to posterior gradient of RC2downregulation and GFAP upregulation in the postnatal ventral
P15
P0
P7
P35
γ tubβcata
d
g
j
3V: E3 region
c
f
l
i
L M
L M
L M
L M
4V: E2/E1 boundary
b
e
h
k
3V: E2 region
Figure 5 | Progressive postnatal maturation of E2 and E3 apical
specializations. Apical surface confocal images in the E3 (first column) and
E2 (second column) regions of 3 V whole mounts and at the E2–E1
boundary (third column) of 4 V whole mounts from postnatal ages P0
(a–c), P7 (d–f), P15 (g–i) and P35 (j–l) (three mice studied per age). Whole
mounts were labelled with g-tubulin (red) and b-catenin (green) antibodies.
At P0, apical surfaces in both E3 and E2 regions of the 3 V and E2 region of
the 4 V had smooth membranes and a single basal body, although
differentiating E1 cells laterally in the 4 V already displayed multiple basal
bodies (arrowhead in c). By P7, a few differentiating E2 cells in the 3 and
4 V were presenting two basal bodies (arrows in e,f). Some differentiating
E1 cells displayed deuterosome structures (arrowhead in e). By P15, E3 and
E2 cells had increasing membrane interdigitations (g–i) and most E2 cells in
the 3 and 4 V were presenting two basal bodies. By P35, E3 and E2 cells’
apical specializations had matured to their adult form, with more
interdigitations among all cells and two basal bodies at the surface of
almost all E2 cells. Lateral (L) and Medial (M) directions indicated at the
4 V surface. Scale bar, 10mm.
Fezf2-GFP:BAC
Pial surface
Ventricle surfacea b
c d eGFP
γ tubβcat
f g
h i
GFPGFAPCD24
GFPGFAPCD24
g
b
cd
P
V
E1 E2 E3
0
50
100
% F
ezf2
-GF
P+
m1m2m3
10 m
o. F
ezf2
GF
P-B
AC
GFAPGFPGFAP
P
V
2 m
o. F
ezf2
GF
P-B
AC
Figure 4 | E3 cells and a subset of E2 cells express the transcription
factor Fezf2. (a) Whole mount (3 V) from a Fezf2-GFP:BAC transgenic
mouse (GENSAT) stained with GFP antibodies indicates Fezf2 expression in
the E3 and E2 territories of the 3 V infundibular recess. Compass indicates
ventral (V) and posterior (P) directions. Scale bar, 0.25 mm. (b) At higher
magnification, the ventral cut edge of the whole mount in a reveals the
elongated morphology of Fezf2-GFPþ cells, with their apical surface and
cell body facing the ventricle and their long basal process terminating
at the pia. Scale bar, 50mm. (c,d) Confocal images at the apical surface
of the 3 V wholemount shown in a labelled with antibodies to GFP,
b-catenin and g-tubulin show that nearly all E3 cells (c) and a subset
of E2 cells (d) express Fezf2. Scale bar, 10 mm. (e) Percentage of E1, E2 or E3
cells expressing Fezf2-GFP. More than 100 cells analysed per E-cell
type from N¼ 3 mice with data shown for individual mice m1–m3.
(f,g) Fezf2-GFP:BAC 3 V whole mounts labelled with antibodies to
GFP, GFAP and CD24 show distinct molecular marker expression
patterns allowing identification of the three epithelial cell types: E1 are
CD24þGFAP±Fezf2� ; E2 are CD24þGFAPþ Fezf2±; E3 are CD24-
GFAP-Fezf2þ . Scale bar, 0.25 mm (f), 100 mm (g). (h,i) GFP and GFAP
labelling of a 3 V whole mount from a 10-month-old Fezf2-GFP:BAC mouse
revealed that the 3 V E2 and E3 territories are relatively stable with age.
Scale bar, 0.25 mm (h,i).
NATURE COMMUNICATIONS | DOI: 10.1038/ncomms13759 ARTICLE
NATURE COMMUNICATIONS | 8:13759 | DOI: 10.1038/ncomms13759 | www.nature.com/naturecommunications 7

3 V, we also observed a decline in proliferation (SupplementaryFig. 6). Previous studies have indicated that proliferating cellspersist postnatally in the walls of the 3 V (refs 15,32–34). It hasbeen suggested that some of these ventricular epithelial cellsretain neural stem cell properties and can generate new neuronspostnatally15,34. However, we found very little proliferation in theventral 3 V in adult whole mounts. We used antibodies to Ki67, amarker of cycling cells, to determine whether ependymal cells inthe different 3 V territories continued to divide in the postnatalmouse brain (Supplementary Fig. 6a). At P0, a time when veryfew cells had acquired their specialized apical features, wefound B2,000 proliferating cells (bilaterally) in the ventral 3 Vwalls (Supplementary Fig. 6b). The majority of these cells were in
the caudal ventral infundibular region in a territory that will, inadults, be populated by E3 cells. Both brightly labelled (mitotic)and more lightly labelled (interphase) Ki67þ cells were found incontact with the ventricle in this region (Supplementary Fig. 6c).However, the number of proliferating cells decreased rapidly andby P28, very few Ki67þ cells were present. The few labelled cellsat P28 appeared to be subependymal and in the ventralinfundibular recess within the E3 territory.
E2/E3 cells in the 3 and 4 V are floor-plate derivatives. Findinga distinct, continuous epithelium of E3 and E2 cells along theventral midline, extending caudally from the diencephalon,
3V3V
sur
face
4V s
urfa
ce4V
P0 P2 P7 P10
GFAPRC2
GFAPRC2
γ tubGFAP
RC2
γ tubGFAP
RC2
a b c d
e f g h
i j k l
m n o p
q
P
V
P0
P2
P4
P7
P10
0
20
40
60
% 3
V G
FAP
+ ce
lls w
ith 2
bas
al b
odie
s
Figure 6 | Progressive postnatal transformation of radial glia into E2 and E3 cells. (a–d) Low-magnification wholemount views of the 3 V infundibular
recess showing RC2 (green) and GFAP (red) expression at P0 (a), P2 (b), P7 (c) and P10 (d). Over this period, RC2 is downregulated in the E1, E2 and E3
epithelia, whereas GFAP is upregulated from ventral to dorsal within the E2 epithelium (arrowheads with dashed arc show expanding domain). (e–h) High-
magnification images at the ependymal surface in the ventral E2 band, corresponding to wholemounts in a–d, respectively, showing g-tubulin (white)
expression. Arrow in e shows a cell with a single basal body expressing both RC2 and GFAP, likely to be in transition. GFAP expression is seen in multiple
cells at P2 (f) and P7 (g) that have single basal bodies, with a few GFAPþ cells at P7 showing two basal bodies (arrowhead). By P10, an increasing number
of GFAPþ cells display two basal bodies (arrowheads). This suggests that during E2 maturation, GFAP expression precedes apical display of the two basal
bodies. Scale bars, 0.25 mm (a–d) and 10mm (e–h). (i–l) Low-magnification whole-mount views of the midline 4 V floor showing similar postnatal time
course of RC2 downregulation and GFAP upregulation in the 4 V. Dashed lines indicate the midline. At P10 (l), GFAP expression along the midline appears
less robust than more laterally. However, most GFAPþ cells located laterally in these images were subependymal astrocytes (incorporated into the low
power z-stack projection), whereas the midline GFAPþ cells corresponded to E2 cells. This was confirmed in high-power images at the apical surface
showing g-tubulin (white, m–p). As in the 3 V, GFAPþ E2 cells at P7 usually had a single basal body whereas by P10, many had two basal bodies
(arrowheads in p). Sale bars, 0.25 mm (i–l) and 10mm (m–p). (q) Percentage of GFAPþ cells displaying two basal bodies in the 3 V E2 epithelium during
early postnatal development. Greater than 100 GFAPþ cells analysed from N¼ 3 mice per age with data shown for individual mice. GFAPþ E2 cells have a
single basal body until around 1–2 weeks postnatally when their apical surfaces become progressively more specialized and display two basal bodies.
ARTICLE NATURE COMMUNICATIONS | DOI: 10.1038/ncomms13759
8 NATURE COMMUNICATIONS | 8:13759 | DOI: 10.1038/ncomms13759 | www.nature.com/naturecommunications

suggested a unique developmental origin for this epithelium. Thefloor plate, comprised specialized radial glia located at the ventralmidline of the neural tube, is a key organizing centre thatprofoundly influences development of the vertebrate nervoussystem35. Floor-plate cells secrete Shh and thereby govern glialand neuronal cell-fate specification of adjacent, dorsally locatedcells. We hypothesized that the floor plate could give rise to E3and E2 epithelia.
We crossed mice expressing Cre from the Shh locus36 toCre-reporter mice expressing tdTomato37 to lineage-trace floor-plate cells. Whole mounts and coronal sections were preparedfrom all adult ventricles and stained with g-tubulin, b-cateninand dsRed antibodies. In whole mounts (Fig. 7a,d) and in sections(Fig. 7g–i), a ventral midline stripe of tdTomatoþ cells was
observed beginning in the POA and extending caudallythrough the 3 V, CAq and 4 V. TdTomato labelling in the POAcorresponded to E2 and E3 cells identified in this region on our3 V map. Just caudal to this area, above the optic chiasm, therewas discontinuity in the tdTomatoþ stripe. Absence of labellingin this area corresponded to absence of E2/E3 cells in this regionon our 3 V map. Caudally, high-power imaging of apical surfacesin both whole mounts and sections revealed that the tdTomatoþstripe contained E2 and E3 cells in the 3 V (Fig. 7b,c,j), and E2cells in the CAq (Fig. 7k) and 4 V (Fig. 7e,f,l). In addition, thedomain of Shh-expressing cells extended laterally, just beyond theE2–E1 boundary, such that the most medially located E1 cellswere also tdTomatoþ . Finally, tdTomatoþ E2 and E3 cells insections had long basal processes penetrating the parenchyma
ShhCre;Ai14
ShhCre;Ai14
ShhCre;Ai14
ShhCre;Ai14a b
E1
E2
E3
E1 E1E2
E1 E1E2
E1E3 E1
E2
E1 E2
b
POA
c
c
γ tub
γ tub
βcat
3rd
V w
all
4th
V fl
oor
3rd V
3rd V
C. Aq.
C. Aq.
4th V
4th V
d e f
g h i
j k l
jk
l
e
f
CAq
da
LL M
Figure 7 | E2 and E3 territories in the ventral midline are derived from the Shh-expressing floor plate. In low- (a) and high-magnification (b,c) 3 V
whole-mount views, E2 (b) and E3 (c) cells are labelled in ShhCre;Ai14 mice, which express tdTomato (red) in cells expressing Cre under the Shh promoter,
active in the embryonic floor plate. g-Tubulin (white) and b-catenin (green) show basal bodies and membrane interdigitations used to identify E-cell types.
A small subset of E1 cells (b) at the E1–E2 boundary are also tdTomato. Anteriorly located E2 and E3 cells near the POA are labelled, corresponding to the
anterior-most extent of the floor plate, as well as the E2 epithelium back into the CAq. The labelled E2 epithelium continues into the 4 V floor in low- (d)
and high-magnification (e,f) views, along with the subset of labeled E1 cells at the E1–E2 boundary. Coronal sections (g–l) show tdTomatoþ E2 and E3 cells
with long basal processes (solid arrows in g–i). At higher magnification (j–l), co-staining with g-tubulin shows the basal bodies in this ventral epithelium
derived from ShhCre-expressing progenitors. Five mice studied in whole-mount preparations and three mice in sections. Scale bars, 0.25 mm (a,d), 10mm
(b,c,e,j–l), 50mm (f,g–i).
NATURE COMMUNICATIONS | DOI: 10.1038/ncomms13759 ARTICLE
NATURE COMMUNICATIONS | 8:13759 | DOI: 10.1038/ncomms13759 | www.nature.com/naturecommunications 9

(Fig. 7g–i arrows), consistent with our previous morphologicalanalysis. This data suggested that ventral midline E2 and E3epithelia represented the final fate of the Shh-expressing floorplate in the brain.
Multiple E cell types in the human brain infundibular recess.To determine whether these cell types were present in humans,we stained 3 V whole mounts, derived from autopsied humanbrains (n¼ 3), with antibodies for pericentrin (multiple g-tubulinantibodies did not stain human tissue) to label basal bodies andwith acetylated-tubulin to label cilia (Fig. 8). In the dorsal 3 V,multiciliated (E1) cells covered the ventricular surface. However,ventrally in the walls of the infundibular recess, we observed threecell types: multiciliated (Fig. 8a), biciliated (Fig. 8b arrowheads)and uniciliated cells (Fig. 8c arrows) that probably correspondedto E1, E2 and E3 cells, respectively. Owing to the size of thehuman 3 V and difficulty obtaining contiguous segments ofhigh-quality tissue, it was difficult to characterize the epithelialpattern of E cell types, as in mice. The cell types in humansappeared less segregated than in mice. This observation suggests,however, that distinct ependymal cell types in the ventral midline,as defined by their apical specializations, are conserved betweenhuman and mouse.
DiscussionUsing high-resolution confocal microscopy of ependymal cells’apical compartment, we describe an extensive territory along theventral 3 V, CAq and 4 V floor containing only E2 cells. In the3 V, this E2 territory is juxtaposed to another territory of E cells(E3) displaying only a single primary cilium. We provide markerexpression patterns that define these territories of specialized Ecells. The work indicates that these cells express the transcriptionfactor FezF2 and are derived from uniciliated RC2þ radial gliawithin Shh-expressing domains that map to the anterior floorplate. The precise organization of these unique cell types in theventral midline suggests that early neuroepithelial patterning isreflected in the adult ependyma and probably plays a key role inthe diverse and coordinated functions of the mature epithelium.More broadly, this work demonstrates a method for catalogingepithelial cell types based on their apical specializations.
The distribution of E2 and E3 apical specializations in the 3 Vsuggests these cells correspond to subtypes of tanycytes21,23,24. E2and E3 cells have extensive membrane interdigitations20 andlong radially directed processes that penetrate the underlyingneuropil1(Supplementary Fig. 7). However, ultrastructural studieshave not reported the unusual basal body found in E2 cells andscanning electron microscope studies typically report no cilia on
tanycytes20,38. We found that almost all E3 cells have a primarycilium and most E2 cells have one or two long cilia. No region inthe 3 V was uniformly non-ciliated. The difference between ourresults and previous findings may be due to the detection method.Using scanning electron microscope, tanycyte cilia may bedifficult to distinguish amidst apical cytoplasmic protrusionsand abundant microvilli. Tanycytes are classified into foursubtypes (a1, a2, b1 and b2), based on location along the 3 Vdorsoventral axis and basal process projection into thehypothalamus12. They are also distinguished by molecularmarkers, including GFAP, reported in a2 tanycytes39. Our datasuggest 3 V E2 cells correspond to a-tanycytes, while E3 cellscorrespond to b-tanycytes (Supplementary Fig. 7). However, thispairing introduces inconsistencies in traditional tanycyteclassification. First, the strictly dorsal-ventral distinction ofa- and b-subtypes in coronal sections implies that bothsubtypes are present throughout the anterior–posterior extentof the 3 V. The E3 epithelium (b-tanycyte), however, occupies aprogressively more dorsal position towards the caudal 3 Vinfundibular recess, where there is diminution of the E2(a-tanycyte) domain. Second, GFAP is reported as an a2tanycyte marker39 with a1 cells dorsal to the GFAPþ domain,but we find only multiciliated (E1) cells dorsal to this domain. Thecharacteristics we describe for E2 and E3 cells robustly identifythese subpopulations, which will be key to understanding theirdistinct functions. This is demonstrated by recent work on theelusive identity of hypothalamic neural progenitor cells, whichdifferent groups suggest correspond to either the a- (ref. 39) orb-(ref. 15) tanycyte subtype. The key apical features thatdistinguish E2 and E3 cells we describe here may help resolvethis dilemma. We see that proliferation in the ventral 3 V decreasesdrastically within the first month of life and this decrease seems tobe regionally linked to the conversion of radial glia into differenttypes of E cells. Notably, the areas where we observed highernumber of Ki67þ cells are in territories associated with E3 cells.These cells retain a simpler apical organization, with primary ciliasimilar to that present in radial glia and V-SVZ B1 cells. It istherefore tempting to speculate that E3 cells (b-tanycytes) couldretain a proliferative potential, despite the observed postnataldecline in proliferation. It is noteworthy that most studies of neuralprogenitor proliferation in the hypothalamus show dividing cells inresponse to an exogenous stimulus, including FGF2 (ref. 39),CNTF32, IGF1 (ref. 40) or high-fat diet15. We cannot exclude,therefore, that exogenous stimulation with growth factors mayinduce some of these cells to proliferate; it is possible these cellshave latent neural progenitor capacity.
We provide evidence for the origin of E2 and E3 cells. The floorplate is a well-known organizing centre in neural development35,but the fate of floor-plate cells themselves is unknown. UsingShh-Cre lineage tracing, we showed that floor-plate cellstransform into a unique ventral midline epithelium in the adultbrain ventricles. Medially, this epithelium contained E2 and E3cells in the 3 V and E2 cells in the CAq and 4 V; laterally, therewas a subset of labelled E1 cells. During development, there is adistinction between medial and lateral floor plate: medialcells express Shh, axon guidance molecule netrin-1 and thetranscription factor forkhead box A2, and lateral cells express asubset of these factors and other markers35. This medial–lateralfloor-plate distinction may be reflected in different adult E celltypes (E2/E3 (medial) versus E1 (lateral)). However, a priorstudy showed that neural tube Shh expression might extendventrolaterally beyond the floor plate41. We therefore cannotexclude the possibility that laterally located, labelled E cells arederived from Shh-expressing cells outside the floor-plateboundary. Heterogeneity also exists in the anterior–posteriordimension of the floor plate: anterior floor-plate cells (POA to
Pericentrin
dapiαtub
Human 3V wall Human infundibular recess
a b c
Figure 8 | E2 and E3 cells are present in the ventral 3 V in the human
brain. Whole mounts from the 3 V walls and infundibular recess of three
autopsied brains were stained with pericentrin (red), to label basal bodies,
and acetylated a-tubulin (green), to label cilia. Dorsally, the 3 V wall
(a) is covered by multiciliated ependymal cells, whereas in the infundibular
recess (b,c), apical surfaces display either two long cilia (arrowheads, b)
or single, short cilia (arrows, c). Scale bar, 10mm.
ARTICLE NATURE COMMUNICATIONS | DOI: 10.1038/ncomms13759
10 NATURE COMMUNICATIONS | 8:13759 | DOI: 10.1038/ncomms13759 | www.nature.com/naturecommunications

rostral hindbrain) are distinct from posterior floor-plate cells(caudal hindbrain through spinal cord)35. This anterior–posteriorvariation may be reflected in the adult ependyma: the ventralmidline stripe of E2 cells extends from the 3 V to the rostral 4 V,but caudally (Fig. 1h, caudal to asterisk), E2 cells are not limitedto the ventral midline. The spinal cord E2 epithelium encircles theentire circumference of the central canal25, consistent with aventral origin for this epithelium42. E3 cells, found only in thehypothalamic region, may correspond with unique diencephalicfloor-plate cells expressing bone morphogenetic protein 7(ref. 43). In sum, medial–lateral and anterior–posteriorheterogeneity in the floor plate may be inherited by the adultbrain E2/E3 epithelia.
E2 cells have (9þ 2) cilia that are presumably motile25.However, with at most two cilia and a segregated distributionalong the ventral midline, E2 cells are unlikely to contributesignificantly to CSF flow. E2 cells have large basal bodies withextensive appendages and their cilia are engulfed in an apicalmembrane invagination. A similar invagination, called the ciliarypocket, is present at the base of primary cilia44. Primary cilia arecellular antennae, essential to the transduction of diverseextracellular signals, such as light, and intercellular signals, suchas Shh45. The basal body and transition zone of cilia are criticalfor signal transmission to and from the cell body46–49. Both E3cells, which have primary cilia, and E2 cells, which have one totwo motile cilia with features of primary cilia, probably havesensory functions. The elaborate E2 basal body may be involvedin transmitting information between the cilium and intracellularcompartments. The long process of both cell types may helptransmit these signals to underlying neural circuits. The E2territory, spanning from the 3 V through the CAq to the 4 V,provides a continuous conduit for information transfer from theventricle to the underlying brain between E2 cells’ cilia and theirbasal processes.
E2 and E3 cell functions may be regionally specified. In the 3 V,the correspondence of these cells with tanycytes suggests theymay function as postnatal neural progenitor cells15,16,34 forhypothalamic neurons controlling energy balance. Tanycyteshave been described as gatekeepers of the mediobasal hypo-thalamus13,14, regulating access of metabolic signals to this area.E2 and E3 cilia may participate in both functions: regulatingprogenitor activity and sensing CSF metabolites. Identifying theseapical specializations in the human brain suggests that furtherexploration of their function could yield insights into centralcontrol of human metabolism. In the 4 V, E2 cells overly theraphe nuclei, where they may provide feedback to serotonergicneurons that project intraventricular axons controllingneurogenesis in the V-SVZ50. Interestingly, we found that E2and E3 cell maturation occurs over a protracted postnatal period,suggesting these functions may be linked to postnatal maturation.The identification of an extensive epithelium of these cellsamenable to transgenic manipulations provides a tractable systemwhere these hypotheses may be tested.
MethodsMice. CD1 mice (Charles River) 2–4 months old (adult studies) or E14.5–P35(developmental studies) were used to study the ventricular surface; 2- to 4-month-old Fezf2-GFP-BAC mice26 were used to study Fezf2þ cells; Shh-Cre/GFP mice36
were crossed with a tdTomato Cre reporter line37 and progeny were used at 2months old, to lineage trace floor-plate cells (both sexes used for all studies; miceon 12 h:12 h light–dark cycle in five per cage group housing). The InstitutionalAnimal Care and Use Committee approved all animal procedures.
Human specimens. Three brains (ages 62, 64 and 71 years with post morteminterval 16, 9 and 12 h, respectively) were collected at autopsy. Multiple wholemount blocks were dissected from the third ventricle ependymal wall fromeach brain, their positions along the wall were documented and the tissue was
immersion-fixed in 4% paraformaldehyde at 4 �C for 24 h. All specimens werecollected with informed consent and in accordance with the St Joseph’s Hospitaland Medical Center Committee on Human Research (IRB number 10BN159).
Whole mount dissection. After cervical dislocation, the mouse brain was removedfrom the skull and 3 V whole mounts were freshly dissected using priniciplessimilar to those described for LV whole mounts51. Briefly, 3 V whole mounts weredissected by performing a ventriculotomy of the 3 V from ventral to dorsal androstral to caudal; 4 V whole mounts were dissected by removing the cerebellum,caudal to rostral, to expose the 4 V floor. The exposed ventricle walls wereimmersion-fixed in 4% paraformaldehyde at 4 �C overnight.
Immunostaining and microscopy. Primary and secondary antibodies wereincubated in PBS with 0.5% Triton-X100 (surface antigens) or 2% Triton-X100(deep antigens) and 10% normal goat serum for 24 h (surface antigens) or 48 h(deep antigens) at 4 �C. Primary antibodies were as follows: mouse anti-acetylatedtubulin (1:1,000, Sigma T6793), rabbit anti-g-tubulin (1:1,000, Sigma T5192),mouse anti-g-tubulin (1:500, Abcam ab11316), mouse anti-b-catenin (1:500, BDTransduction Laboratories 610153), rabbit anti-b-catenin (1:1,000, Sigma C2206),rat anti-CD24 (1:500, BD Pharmingen 557436), rabbit anti-S100b (1:500,Dako Z0311), chicken anti-vimentin (1:500, EMD Millipore AB5733), chickenanti-Nestin (1:200, Lifespan Biosciences, LS-B5224), mouse anti-GFAP (1:500,EMD Millipore MAB3402), rabbit anti-dsRed (1:1,000, Clontech 632496), rabbitanti-pericentrin (1:500, Abcam ab4448), mouse anti-RC2 (1:100, DevelopmentalStudies Hybridoma Bank, 0.1 ml concentrate) and chicken anti-GFP (1:500, AvesLabs GFP-1020). Secondary antibodies were as follows: conjugated to Alexa Fluordyes (goat or donkey polyclonal, 1:400, Invitrogen). Confocal images were taken ona Leica SP5 or SPE. Transmission electron microscopy analysis was performed asdescribed previously52. For reconstruction of the apical surface and basal bodies ofE cells, we cut B600 serial ultrathin (0.05 mm) sections that were placed onFormvar-coated single-slot grids, stained with lead citrate and examined under aJeol 100CX EM.
Ependymal surface maps. Tiled high-resolution confocal images(116.4� 116.4 mm2) were taken using a � 63 oil objective (numerical aperture1.47), to reconstruct the entire ependymal surface from 13 V wall (935 tiled images)and 14 V floor (793 tiled images). These reconstructions were then importedinto Illustrator CS5 (Adobe), where the wall was outlined and the location of E2and E3 cells plotted.
Quantification of basal bodies in postnatal 3 V GFAPþ cells. In three high-power fields (116.4� 116.4 mm2) from the ventral-most aspect of the E2 GFAPþband in the 3 V, we counted the number of basal bodies per GFAPþ apicalsurface. We chose to quantify this ventral-most region, because that is where GFAPexpression initiated at P0. These counts were performed in three mice at P0, P2, P4,P7 and P10.
Quantification of apical surface specializations. Cilia complement and length,apical surface area and marker expression were each studied in three images(116.4� 116.4 mm2) evenly distributed along the dorsoventral axis of the E2 or E3epithelium in the 3 V or anterior–posterior axis of the E2 epithelium in the4 V. Cilia length and apical surface area were quantified using Metamorph(Molecular Devices).
Statistical analysis. Use of validated antibodies allowed reduction in sample sizeas listed for each experiment. Descriptive statistics and t-tests were computed in R.
Data availability. Source data for 3 and 4 V ependymal surface maps, as well as allother data for figures contained in this paper, are available from the authors.
References1. Bruni, J. E. Ependymal development, proliferation, and functions: a review.
Microsc. Res. Tech. 41, 2–13 (1998).2. Del Bigio, M. R. Ependymal cells: biology and pathology. Acta Neuropathol.
119, 55–73 (2010).3. Guirao, B. et al. Coupling between hydrodynamic forces and planar cell polarity
orients mammalian motile cilia. Nat. Cell Biol. 12, 341–350 (2010).4. Mirzadeh, Z., Han, Y. G., Soriano-Navarro, M., Garcia-Verdugo, J. M. &
Alvarez-Buylla, A. Cilia organize ependymal planar polarity. J. Neurosci. 30,2600–2610 (2010).
5. Ohata, S. et al. Mechanosensory genes Pkd1 and Pkd2 contribute to the planarpolarization of brain ventricular epithelium. J. Neurosci. 35, 11153–11168 (2015).
6. Mirzadeh, Z., Merkle, F. T., Soriano-Navarro, M., Garcia-Verdugo, J. M. &Alvarez-Buylla, A. Neural stem cells confer unique pinwheel architecture to theventricular surface in neurogenic regions of the adult brain. Cell Stem Cell 3,265–278 (2008).
NATURE COMMUNICATIONS | DOI: 10.1038/ncomms13759 ARTICLE
NATURE COMMUNICATIONS | 8:13759 | DOI: 10.1038/ncomms13759 | www.nature.com/naturecommunications 11

7. Worthington, W. C. Jr & Cathcart, 3rd R. S. Ependymal cilia: distribution andactivity in the adult human brain. Science 139, 221–222 (1963).
8. Sawamoto, K. et al. New neurons follow the flow of cerebrospinal fluid in theadult brain. Science 311, 629–632 (2006).
9. Lim, D. A. et al. Noggin antagonizes BMP signaling to create a niche for adultneurogenesis. Neuron 28, 713–726 (2000).
10. Langlet, F., Mullier, A., Bouret, S. G., Prevot, V. & Dehouck, B. Tanycyte-likecells form a blood-cerebrospinal fluid barrier in the circumventricular organs ofthe mouse brain. J. Comp. Neurol. 521, 3389–3405 (2013).
11. Gross, P. M. & Weindl, A. Peering through the windows of the brain. J. Cereb.Blood Flow Metab. 7, 663–672 (1987).
12. Rodriguez, E. M. et al. Hypothalamic tanycytes: a key component of brain-endocrine interaction. Int. Rev. Cytol. 247, 89–164 (2005).
13. Balland, E. et al. Hypothalamic tanycytes are an ERK-gated conduit for leptininto the brain. Cell Metab. 19, 293–301 (2014).
14. Langlet, F. et al. Tanycytic VEGF-A boosts blood-hypothalamus barrierplasticity and access of metabolic signals to the arcuate nucleus in response tofasting. Cell Metab. 17, 607–617 (2013).
15. Lee, D. A. et al. Tanycytes of the hypothalamic median eminence forma diet-responsive neurogenic niche. Nat. Neurosci. 15, 700–702 (2012).
16. Li, J., Tang, Y. & Cai, D. IKKbeta/NF-kappaB disrupts adult hypothalamicneural stem cells to mediate a neurodegenerative mechanism of dietary obesityand pre-diabetes. Nat. Cell Biol. 14, 999–1012 (2012).
17. Spassky, N. et al. Adult ependymal cells are postmitotic and are derived fromradial glial cells during embryogenesis. J. Neurosci. 25, 10–18 (2005).
18. Kriegstein, A. & Alvarez-Buylla, A. The glial nature of embryonic and adultneural stem cells. Annu. Rev. Neurosci. 32, 149–184 (2009).
19. Fuentealba, L. C. et al. Embryonic origin of postnatal neural stem cells. Cell161, 1644–1655 (2015).
20. Del Brio, M. A., Riera, P., Garcı́a, J. M. & Alvarez-Urı́a, M. Cell types of thethird ventricle wall of the rabbit (Oryctolagus cuniculus). J. Submicrosc. Cytol.Pathol. 23, 147–157 (1991).
21. Horstmann, E. Die Faserglia des Selachiergehirns. Z. Zellforsch. 39, 588–617(1954).
22. Akmayev, I. G., Fidelina, O. V., Kabolova, Z. A., Popov, A. P. & Schitkova, T. A.Morphological aspects of the hypothalamic-hypophyseal system. IV. Medialbasal hypothalamus. An experimental morphological study. Z. Zellforsch.Mikrosk. Anat. 137, 493–512 (1973).
23. Rodriguez, E. M., Gonzalez, C. B. & Delannoy, L. Cellular organization of thelateral and postinfundibular regions of the median eminence in the rat. CellTissue Res. 201, 377–408 (1979).
24. Millhouse, O. E. A Golgi study of third ventricle tanycytes in the adult rodentbrain. Z. Zellforsch. Mikrosk. Anat. 121, 1–13 (1971).
25. Alfaro-Cervello, C., Soriano-Navarro, M., Mirzadeh, Z., Alvarez-Buylla, A. &Garcia-Verdugo, J. M. Biciliated ependymal cell proliferation contributes tospinal cord growth. J. Comp. Neurol. 520, 3528–3552 (2012).
26. GENSAT. The Gene Expression Nervous System Atlas (GENSAT) Project(NINDS Contracts N01NS02331 & HHSN271200723701C) (The RockefellerUniversity, New York, NY, 2003).
27. Lein, E. S. et al. Genome-wide atlas of gene expression in the adult mouse brain.Nature 445, 168–176 (2007).
28. Shimogori, T. et al. A genomic atlas of mouse hypothalamic development.Nat. Neurosci. 13, 767–775 (2010).
29. Guo, C. et al. Fezf2 expression identifies a multipotent progenitor forneocortical projection neurons, astrocytes, and oligodendrocytes. Neuron 80,1167–1174 (2013).
30. Al Jord, A. et al. Centriole amplification by mother and daughter centriolesdiffers in multiciliated cells. Nature 516, 104–107 (2014).
31. Park, D. et al. The radial glia antibody RC2 recognizes a protein encoded byNestin. Biochem. Biophys. Res. Commun. 382, 588–592 (2009).
32. Kokoeva, M. V., Yin, H. & Flier, J. S. Neurogenesis in the hypothalamus of adultmice: potential role in energy balance. Science 310, 679–683 (2005).
33. Xu, Y. et al. Neurogenesis in the ependymal layer of the adult rat 3rd ventricle.Exp. Neurol. 192, 251–264 (2005).
34. Haan, N. et al. Fgf10-expressing tanycytes add new neurons to the appetite/energy-balance regulating centers of the postnatal and adult hypothalamus.J. Neurosci. 33, 6170–6180 (2013).
35. Placzek, M. & Briscoe, J. The floor plate: multiple cells, multiple signals.Nat. Rev. Neurosci. 6, 230–240 (2005).
36. Harfe, B. D. et al. Evidence for an expansion-based temporal Shh gradient inspecifying vertebrate digit identities. Cell 118, 517–528 (2004).
37. Madisen, L. et al. A robust and high-throughput Cre reporting and characterizationsystem for the whole mouse brain. Nat. Neurosci. 13, 133–140 (2010).
38. Leonhardt, H. Neuroglia. I. Handbuch der mikroskopischen Anatomie desMenschen (Springer Verlag, 1980).
39. Robins, S. C. et al. alpha-Tanycytes of the adult hypothalamic thirdventricle include distinct populations of FGF-responsive neural progenitors.Nat. Commun. 4, 2049 (2013).
40. Perez-Martin, M. et al. IGF-I stimulates neurogenesis in the hypothalamus ofadult rats. Eur. J. Neurosci. 31, 1533–1548 (2010).
41. Marti, E., Takada, R., Bumcrot, D. A., Sasaki, H. & McMahon, A. P.Distribution of Sonic hedgehog peptides in the developing chick and mouseembryo. Development 121, 2537–2547 (1995).
42. Kondrychyn, I., Teh, C., Sin, M. & Korzh, V. Stretching morphogenesisof the roof plate and formation of the central canal. PLoS ONE 8, e56219(2013).
43. Dale, K. et al. Differential patterning of ventral midline cells by axial mesodermis regulated by BMP7 and chordin. Development 126, 397–408 (1999).
44. Sorokin, S. P. Reconstructions of centriole formation and ciliogenesis inmammalian lungs. J. Cell Sci. 3, 207–230 (1968).
45. Singla, V. & Reiter, J. F. The primary cilium as the cell’s antenna: signaling at asensory organelle. Science 313, 629–633 (2006).
46. Chih, B. et al. A ciliopathy complex at the transition zone protects the cilia as aprivileged membrane domain. Nat. Cell Biol. 14, 61–72 (2012).
47. Garcia-Gonzalo, F. R. et al. A transition zone complex regulates mammalianciliogenesis and ciliary membrane composition. Nat. Genet. 43, 776–784(2011).
48. Gerdes, J. M. et al. Disruption of the basal body compromises proteasomalfunction and perturbs intracellular Wnt response. Nat. Genet. 39, 1350–1360(2007).
49. Hu, Q. et al. A septin diffusion barrier at the base of the primary ciliummaintains ciliary membrane protein distribution. Science 329, 436–439 (2010).
50. Tong, C. K. et al. Axonal control of the adult neural stem cell niche. Cell StemCell 14, 500–511 (2014).
51. Mirzadeh, Z., Doetsch, F., Sawamoto, K., Wichterle, H. & Alvarez-Buylla, A.The subventricular zone en-face: wholemount staining and ependymal flow.J. Vis. Exp. doi: 10.3791/1938 (2010).
52. Doetsch, F., Garcia-Verdugo, J. M. & Alvarez-Buylla, A. Cellular compositionand three-dimensional organization of the subventricular germinal zone in theadult mammalian brain. J.Neurosci. 17, 5046–5061 (1997).
AcknowledgementsZ.M. supported by NIH grant F32 DK108596 and the Barrow Neurological Foundationgrant number 559035022. Additional support from NIH grants R01 NS082745 (to N.S.)and R37 HD032116 (to A.A.-B.), and a generous gift from the John G. Bowes ResearchFund. A.A.-B. is the Heather and Melanie Muss Endowed Chair of Neurological Surgeryat UCSF. We thank R. Fiorelli and S. Borwege for help with human specimen collection.
Author contributionsZ.M., B.C., J.M.G.-V., N.S. and A.A.-B. designed, funded and supervised the research.Z.M., Y.K., M.D.-M., E.C., S.G.-P. and C.O. performed the research. Z.M., Y.K., M.D.-M.and S.G.-P. analysed the data. Z.M. and A.A.-B. wrote the manuscript.
Additional informationSupplementary Information accompanies this paper at http://www.nature.com/naturecommunications
Competing financial interests: The authors declare no competing financial interests.
Reprints and permission information is available online at http://npg.nature.com/reprintsandpermissions/
How to cite this article: Mirzadeh, Z. et al. Bi- and uniciliated ependymal cellsdefine continuous floor-plate-derived tanycytic territories. Nat. Commun. 8, 13759doi: 10.1038/ncomms13759 (2017).
Publisher’s note: Springer Nature remains neutral with regard to jurisdictional claims inpublished maps and institutional affiliations.
This work is licensed under a Creative Commons Attribution 4.0International License. The images or other third party material in this
article are included in the article’s Creative Commons license, unless indicated otherwisein the credit line; if the material is not included under the Creative Commons license,users will need to obtain permission from the license holder to reproduce the material.To view a copy of this license, visit http://creativecommons.org/licenses/by/4.0/
r The Author(s) 2017
ARTICLE NATURE COMMUNICATIONS | DOI: 10.1038/ncomms13759
12 NATURE COMMUNICATIONS | 8:13759 | DOI: 10.1038/ncomms13759 | www.nature.com/naturecommunications