bhp billiton plc registration number 3196209 isin ...€¦bhp billiton plc . registration number...
TRANSCRIPT

BHP Billiton Plc Registration number 3196209
Registered in England and Wales Share code: BIL
ISIN: GB0000566504
NEWS RELEASE Release Time IMMEDIATE Date 23 July 2014 Number 11/14
BHP BILLITON OPERATIONAL REVIEW FOR THE YEAR ENDED 30 JUNE 2014
• Strong operating performance delivered a 9% increase in Group production with annual records achieved across 12 operations and four commodities.
• Western Australia Iron Ore achieved a fourteenth consecutive annual production record as volumes increased to 225 Mt (100% basis), significantly exceeding initial full-year guidance. We now expect production of 245 Mt (100% basis) from the Pilbara in the 2015 financial year.
• Metallurgical coal production of 45 Mt exceeded full-year guidance as Queensland Coal achieved record production and sales volumes.
• Copper production increased to 1.7 Mt as an improvement in mill throughput and concentrator utilisation offset grade decline at a number of operations.
• Petroleum production increased by 4% to a record 246 MMboe with an 18% increase in liquids volumes underpinned by significant growth at Onshore US and Atlantis.
• Six major projects were completed and another two projects achieved first production, including the Caval Ridge coal mine which was completed ahead of schedule and under budget in the June 2014 quarter.
BHP Billiton Chief Executive Officer, Andrew Mackenzie, said: “Our focus on productivity has resulted in a significant improvement in operating performance at each of our major businesses this year, with a nine per cent(1) increase in Group production and record output at 12 operations. Western Australia Iron Ore and Queensland Coal annual production exceeded guidance, with both rising by more than 20 per cent as we delivered more tonnes from existing infrastructure and growth projects ahead of schedule. At Escondida, an increase in mill throughput and concentrator utilisation offset copper grade decline, while our Onshore US business delivered a 73 per cent increase in petroleum liquids production. “We expect to maintain strong momentum and remain on track to generate Group production growth of 16 per cent(1) over the two years to the end of the 2015 financial year. In Petroleum, we are investing in our highest-return acreage while a broader improvement in productivity is expected to underpin stronger iron ore, copper and metallurgical coal volumes. We will remain focused on value over volume as we prioritise our brownfield development options and consider the next phase of portfolio simplification.” Note: Unless specified otherwise: variance analysis relates to the relative performance of BHP Billiton and/or its operations during the 2014 financial year compared with the 2013 financial year or the June 2014 quarter compared with the March 2014 quarter; production volumes, sales volumes and capital and exploration expenditure from subsidiaries (which include Escondida, Jimblebar, BHP Billiton Mitsui Coal and our manganese operations) are reported on a 100 per cent basis; production volumes, sales volumes and capital and exploration expenditure from equity accounted investments (which include Antamina, Samarco and Cerrejón) and other operations are reported on a proportionate consolidation basis. Abbreviations referenced in this report are explained on page 14.

Summary
Operational performance
Production summary
JUN 2014 YTD
JUN 2014 QTR
JUN YTD14 vs
JUN YTD13
JUN Q14 vs
JUN Q13
JUN Q14 vs
MAR Q14
Total petroleum production (MMboe) 246.0 64.7 4% 9% 6%
Copper (kt) 1,727.1 470.0 2% 2% 14%
Iron ore (kt) 203,564 56,643 20% 19% 15%
Metallurgical coal (kt) 45,078 11,886 20% 9% 4%
Energy coal (kt) 73,492 18,363 1% (1%) 4%
Alumina (kt) 5,178 1,325 6% 5% 6%
Aluminium (kt) 1,174 276 (0%) (11%) (3%)
Manganese ores (kt) 8,302 2,255 (3%) 0% 25%
Manganese alloys (kt) 646 181 6% (1%) 12%
Nickel (kt) 143.2 30.9 (7%) (23%) (9%) Strong operating performance in the 2014 financial year delivered a nine per cent(1) increase in Group production as records were achieved across 12 operations and four commodities. Group production growth of 16 per cent(1) is expected over the two years to the end of the 2015 financial year. Western Australia Iron Ore (WAIO) significantly exceeded initial full-year production guidance as the early commissioning of Jimblebar and our productivity agenda raised the capacity of our integrated supply chain. The ramp-up of Jimblebar to 35 Mtpa (100 per cent basis) is now expected before the end of the 2014 calendar year and will support a further 20 Mt increase in WAIO production to approximately 245 Mt (100 per cent basis) in the 2015 financial year. A low-cost option to expand Jimblebar to 55 Mtpa (100 per cent basis) and broader debottlenecking of the supply chain are expected to underpin further growth in capacity towards 270 Mtpa (100 per cent basis). Metallurgical coal production exceeded full-year guidance as Queensland Coal achieved record production and sales volumes. This included first production from Caval Ridge, the successful ramp-up of Daunia and record production at Peak Downs, Saraji, South Walker Creek and Poitrel. Metallurgical coal production is forecast to increase by four per cent in the 2015 financial year to 47 Mt as the ramp-up of Caval Ridge is completed. Escondida copper production increased by two per cent as an improvement in mill throughput and concentrator utilisation offset declining ore grades. With further improvements in productivity anticipated, Escondida is on track to produce approximately 1.27 Mt of copper in the 2015 financial year, while Group copper production is forecast to increase by five per cent(2) to 1.8 Mt. Energy coal volumes were broadly unchanged in the 2014 financial year as a fifth consecutive production record at New South Wales Energy Coal and record volumes at Cerrejón were offset by lower production at South Africa Energy Coal and Navajo Coal. Energy coal production for the 2015 financial year is expected to remain broadly unchanged at 73 Mt. Petroleum production of 246 MMboe marginally exceeded revised full-year guidance as liquids volumes in our Onshore US business increased by 23 per cent in the June 2014 quarter. Petroleum production is forecast to increase by five per cent(2) in the 2015 financial year to 255 MMboe with high-margin liquids volumes expected to increase by 16 MMboe. We remain confident that Onshore US will be strongly EBIT positive in the 2015 financial year as the liquids contribution is forecast to rise to approximately 40 per cent of total shale production.

Production guidance for the 2015 financial year is summarised in the table below. Production guidance FY14(2) FY15e % change Petroleum (MMboe) 243 255 5%
Copper (Mt) 1.7 1.8 5%
Iron ore (Mt) 204 225 11%
Metallurgical coal (Mt) 45 47 4%
Energy coal (Mt) 73 73 - Major development projects At the end of the 2014 financial year, BHP Billiton had eight low-risk, largely brownfield major projects under development with a combined budget of US$14.1 billion. During the 2014 financial year we successfully completed six projects, namely: Macedon; North West Shelf North Rankin B Gas Compression; WAIO Jimblebar Mine Expansion; WAIO Port Blending and Rail Yard Facilities; Samarco Fourth Pellet Plant; and Caval Ridge. Caval Ridge was completed in the June 2014 quarter, ahead of schedule and under budget, and will not be reported in future Operational Reviews. Another two projects, Newcastle Third Port Stage 3 and Cerrejón P40, delivered first coal during the year. A US$212 million increase in the budget of the Escondida Oxide Leach Area project to US$933 million has been approved. The project is now expected to be completed in the second half of the 2014 calendar year with no associated impact to production. Corporate update BHP Billiton expects Underlying EBIT in the June 2014 half year to include additional charges in a range of approximately US$0.9 billion to US$1.3 billion related to: (1) impairments and mine site rehabilitation; and (2) redundancies and the closure of operations associated with our productivity agenda. Items include impairments (related to the Port of Vancouver and small Gulf of Mexico petroleum assets) and mine site rehabilitation costs in Petroleum and Potash, and the impairment of assets at South Africa Energy Coal. Redundancy costs will be recognised in our Coal, Iron Ore and Aluminium, Manganese and Nickel Businesses, while additional costs will be recognised following the closure of aluminium smelting activities at Bayside. This guidance will be updated should material information or events arise as the Company finalises its financial statements. Additional charges to be recognised in the June 2014 half year (US$ million) EBITDA EBIT Impairments and mine site rehabilitation 200 to 400 700 to 900
Redundancy and closure 200 to 400 200 to 400
Total charges 400 to 800 900 to 1,300 We continued to simplify our portfolio during the 2014 financial year with the successful completion of numerous transactions, including Jimblebar and Pinto Valley. In the last two years alone, the Group has completed transactions exceeding US$6.7 billion in Australia, the United States, Canada, South Africa and the United Kingdom, including petroleum, copper, iron ore, coal, mineral sands, uranium and diamonds assets. We continue to actively study the next phase of simplification, including structural options, but we will only pursue options that maximise value for BHP Billiton shareholders.

Marketing update The average realised prices achieved for our major commodities are summarised in the table below. Iron ore shipments, on average, were linked to the index price for the month of shipment, with price differentials reflecting product quality. The majority of metallurgical coal and energy coal exports were linked to the index price for the month of shipment or sold on the spot market, with price differentials reflecting product quality.
Average realised prices(3) H1 FY14 H2 FY14 FY14 FY13
FY14 vs
FY13
H2 FY14 vs
H2 FY13
H2 FY14 vs
H1 FY14 Oil (crude and condensate) (US$/bbl) 103 102 102 106 (4%) (4%) (1%)
Natural gas (US$/Mscf) 3.81 4.89 4.35 3.76 16% 26% 28%
US natural gas (US$/Mscf) 3.44 4.75 4.10 3.29 25% 35% 38%
LNG (US$/Mscf) 14.63 14.71 14.67 14.82 (1%) 0% 1%
Copper (US$/lb)(4) 3.36 3.09 3.22 3.40 (5%) (4%) (8%)
Iron ore (US$/wmt FOB) 112 96 103 110 (6%) (18%) (14%)
Hard coking coal (US$/t) 142 121 131 163 (20%) (22%) (15%)
Weak coking coal (US$/t) 116 104 111 129 (14%) (19%) (10%)
Thermal coal (US$/t)(5) 74 67 70 81 (14%) (15%) (9%)
Alumina (US$/t)(6) 291 320 307 302 2% 2% 10%
Aluminium (US$/t) 1,996 2,049 2,022 2,160 (6%) (4%) 3%
Manganese ore (US$/dmtu)(6) 4.90 4.41 4.64 4.83 (4%) (14%) (10%)
Manganese alloy (US$/t) 952 1,001 980 1,042 (6%) 0% 5%
Nickel metal (US$/t) 13,615 16,391 14,925 16,037 (7%) 4% 20% At 30 June 2014, the Group had 350 kt of outstanding copper sales that were revalued at a weighted average price of US$3.19 per pound. The final price of these sales will be determined in the 2015 financial year. In addition, 386 kt of copper sales from the 2013 financial year were subject to a finalisation adjustment in 2014. The provisional pricing and finalisation adjustments will increase earnings before interest and tax by US$73 million in the 2014 financial year (2013 financial year: US$303 million decrease; December 2013 half year: US$196 million increase). Petroleum and Potash Production
JUN 2014 YTD
JUN 2014 QTR
JUN YTD14 vs
JUN YTD13
JUN Q14 vs
JUN Q13
JUN Q14 vs
MAR Q14
Crude oil, condensate and natural gas liquids (MMboe) 106.1 28.9 18% 23% 6%
Natural gas (bcf) 839.3 215.0 (4%) 0% 6%
Total petroleum product (MMboe) 246.0 64.7 4% 9% 6% Total petroleum production – Petroleum production increased by four per cent in the 2014 financial year to 246 MMboe and included strong performance from Onshore US which delivered a 73 per cent increase in liquids volumes. Petroleum production is forecast to increase by five per cent(2) in the 2015 financial year to 255 MMboe as continued growth at Onshore US contributes to a 16 MMboe increase in total liquids production. Conventional volumes for the 2015 financial year are forecast to remain broadly unchanged, consistent with prior guidance.

Total petroleum production (MMboe) Total 2014 financial year 246
Less: divested assets (3)
Adjusted 2014 financial year 243
Forecast change in liquids volumes 16
Forecast change in gas volumes (4)
2015 financial year 255 Crude oil, condensate and natural gas liquids – Crude oil, condensate and natural gas liquids production increased by 18 per cent in the 2014 financial year to 106 MMboe. Onshore US, liquids production increased by 23 per cent in the June 2014 quarter and we expect to carry strong momentum into the 2015 financial year as shale liquids volumes are forecast to increase by over 17 MMboe in the period. We remain confident that Onshore US will be strongly EBIT positive in the 2015 financial year as the liquids contribution is forecast to rise to approximately 40 per cent of total shale production. In our conventional business, a near doubling of production at Atlantis was achieved ahead of prior guidance as the early completion of two production wells brought forward volumes into the 2014 financial year. While production at Pyrenees declined by 12 per cent as a result of major maintenance, volumes recovered strongly in the second half of the financial year following the completion of five new production wells. Natural gas – Natural gas production declined by four per cent in the 2014 financial year to 839 bcf. The delivery of first gas from Macedon partially offset lower demand at Bass Strait and natural field decline at Haynesville. Projects and Onshore US capital expenditure
Project and ownership
Capital expenditure
(US$m)
Initial production target date Capacity Progress
North West Shelf Greater Western Flank-A (Australia) 16.67% (non-operator)
400 CY16 To maintain LNG plant throughput from the North West Shelf operations.
On schedule and budget. The overall project is 80% complete.
Bass Strait Longford Gas Conditioning Plant (Australia) 50% (non-operator)
520 CY16 Designed to process approximately 400 MMcf/d of high-CO2 gas.
On schedule and budget. The overall project is 33% complete.
In the 2014 financial year, approximately 75 per cent of Onshore US drilling and development expenditure of US$4.2 billion was invested in the Eagle Ford, with the majority focused on our Black Hawk acreage.
Onshore US 2014 financial year (2013 financial year)
Liquids focused areas
(Eagle Ford and Permian)
Gas focused areas (Haynesville
and Fayetteville) Total Capital expenditure US$ billion 3.6 (3.9) 0.6 (0.9) 4.2 (4.8)
Production MMboe 51.9 (33.4) 56.2 (65.8) 108.1 (99.2)
Production mix Natural gas Natural gas liquids Crude and condensate
36% (42%) 22% (23%) 42% (35%)
100% (100%) - (-) - (-)
69% (80%) 11% (8%)
20% (12%)

Petroleum exploration There were no exploration or appraisal wells drilled during the June 2014 quarter. Petroleum exploration expenditure for the 2014 financial year was US$600 million, of which US$369 million was expensed. Activity for the period was largely focused on the Gulf of Mexico and Western Australia. Potash Project and ownership
Investment (US$m) Scope Progress
Jansen Potash (Canada) 100%
2,600 Investment to finish the excavation and lining of the production and service shafts, and to continue the installation of essential surface infrastructure and utilities.
The overall project is 30% complete and on budget.
During the June 2014 quarter, BHP Billiton allowed the exclusivity agreement for Terminal 5 at the Port of Vancouver (US) to lapse. Our development schedule at Jansen provides us with the flexibility to consider a broad range of port and rail options. Copper Production
JUN 2014 YTD
JUN 2014 QTR
FY14 vs
FY13
JUN Q14 vs
JUN Q13
JUN Q14 vs
MAR Q14
Copper (kt) 1,727.1 470.0 2% 2% 14%
Lead (t) 188,026 46,165 (12%) (31%) (3%)
Zinc (t) 109,935 29,116 (14%) (37%) 50%
Silver (koz) 34,804 8,509 (11%) (27%) (3%)
Uranium oxide concentrate (t) 3,988 1,044 (2%) (6%) 8% Copper – Total copper production increased by two per cent in the 2014 financial year to 1.7 Mt as planned. Total copper production is forecast to increase by five per cent(2) in the 2015 financial year to 1.8 Mt. Escondida copper production increased by two per cent in the 2014 financial year to 1.2 Mt as an improvement in mill throughput and concentrator utilisation offset declining ore grades. With further improvements in productivity anticipated, Escondida is on track to produce approximately 1.27 Mt of copper in the 2015 financial year. A power outage throughout Northern Chile in July 2014 and a six-day maintenance shutdown at the Laguna Seca concentrator will impact production in the September 2014 quarter. Commissioning of Organic Growth Project 1 is scheduled for the June 2015 quarter. Pampa Norte copper production of 233 kt for the 2014 financial year was unchanged from the prior period. Production is forecast to remain at a similar level in the 2015 financial year as higher grades and recoveries at Spence offset declining grades and recoveries at Cerro Colorado. A 12-day maintenance shutdown at Cerro Colorado and tertiary crusher maintenance at Spence is expected to impact production in the September 2014 quarter. Record mining rates at Olympic Dam underpinned an 11 per cent increase in copper production in the 2014 financial year to 184 kt. While an annualised production rate of 219 kt in the June 2014 quarter indicates the degree of improvement achieved in the existing underground operation, volumes in the 2015 financial year are expected to remain broadly unchanged as a result of the current smelter maintenance program which is expected to be completed early in the September 2014 quarter. A major smelter maintenance campaign is scheduled to commence in the June 2015 quarter. Antamina achieved records for mill throughput and copper production in the 2014 financial year. Average copper grades at Antamina in the 2015 financial year are expected to remain at a similar level to the June 2014 quarter, leading to lower copper production, consistent with the mine plan.
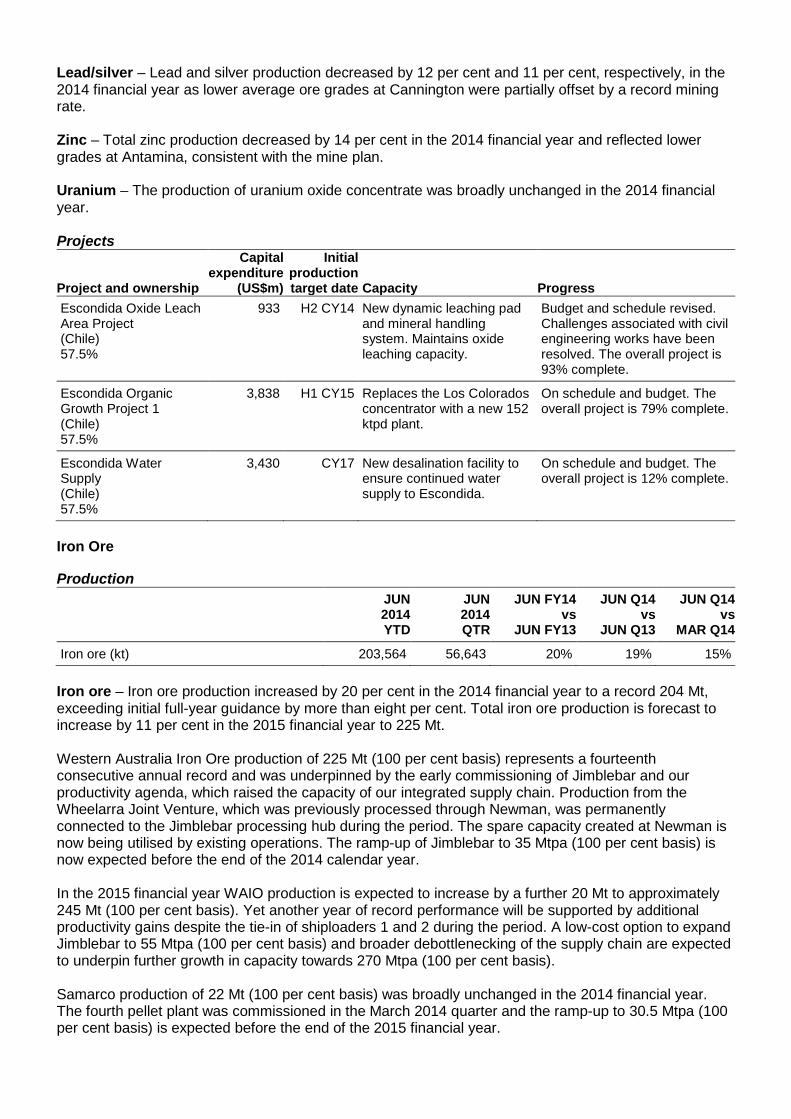
Lead/silver – Lead and silver production decreased by 12 per cent and 11 per cent, respectively, in the 2014 financial year as lower average ore grades at Cannington were partially offset by a record mining rate. Zinc – Total zinc production decreased by 14 per cent in the 2014 financial year and reflected lower grades at Antamina, consistent with the mine plan. Uranium – The production of uranium oxide concentrate was broadly unchanged in the 2014 financial year. Projects
Project and ownership
Capital expenditure
(US$m)
Initial production target date Capacity Progress
Escondida Oxide Leach Area Project (Chile) 57.5%
933 H2 CY14 New dynamic leaching pad and mineral handling system. Maintains oxide leaching capacity.
Budget and schedule revised. Challenges associated with civil engineering works have been resolved. The overall project is 93% complete.
Escondida Organic Growth Project 1 (Chile) 57.5%
3,838 H1 CY15 Replaces the Los Colorados concentrator with a new 152 ktpd plant.
On schedule and budget. The overall project is 79% complete.
Escondida Water Supply (Chile) 57.5%
3,430 CY17 New desalination facility to ensure continued water supply to Escondida.
On schedule and budget. The overall project is 12% complete.
Iron Ore Production
JUN 2014 YTD
JUN 2014 QTR
JUN FY14 vs
JUN FY13
JUN Q14 vs
JUN Q13
JUN Q14 vs
MAR Q14
Iron ore (kt) 203,564 56,643 20% 19% 15% Iron ore – Iron ore production increased by 20 per cent in the 2014 financial year to a record 204 Mt, exceeding initial full-year guidance by more than eight per cent. Total iron ore production is forecast to increase by 11 per cent in the 2015 financial year to 225 Mt. Western Australia Iron Ore production of 225 Mt (100 per cent basis) represents a fourteenth consecutive annual record and was underpinned by the early commissioning of Jimblebar and our productivity agenda, which raised the capacity of our integrated supply chain. Production from the Wheelarra Joint Venture, which was previously processed through Newman, was permanently connected to the Jimblebar processing hub during the period. The spare capacity created at Newman is now being utilised by existing operations. The ramp-up of Jimblebar to 35 Mtpa (100 per cent basis) is now expected before the end of the 2014 calendar year. In the 2015 financial year WAIO production is expected to increase by a further 20 Mt to approximately 245 Mt (100 per cent basis). Yet another year of record performance will be supported by additional productivity gains despite the tie-in of shiploaders 1 and 2 during the period. A low-cost option to expand Jimblebar to 55 Mtpa (100 per cent basis) and broader debottlenecking of the supply chain are expected to underpin further growth in capacity towards 270 Mtpa (100 per cent basis). Samarco production of 22 Mt (100 per cent basis) was broadly unchanged in the 2014 financial year. The fourth pellet plant was commissioned in the March 2014 quarter and the ramp-up to 30.5 Mtpa (100 per cent basis) is expected before the end of the 2015 financial year.

Major increase in Mineral Resource at Western Australia Iron Ore BHP Billiton also confirms a 13 per cent increase in the Mineral Resource at WAIO compared to the previous 30 June 2013 estimate (Table 2). The increase reflects the inclusion of 500 km of infill drilling and revised resource estimates that have continued to delineate orebodies primarily with Brockman (67 per cent of the increase) and Marra Mamba (33 per cent of the increase) ore types, with changes after consideration of mining depletion in the 2014 financial year. BHP Billiton ownership averages 88 per cent but varies between 85 per cent and 100 per cent. Information pertaining to the orebodies that contribute to the increase in Mineral Resource is contained in Appendix 1. WAIO is located within the Pilbara region of Western Australia. The geology of the region, comprising the Hamersley and North East Pilbara Provinces, has been extensively studied and is well documented based on extensive mapping, exploratory drilling and mining. The Hamersley Group forms the central part of the Mt Bruce Supergroup and contains two iron bearing stratigraphic sequences, with major bedded ores hosted by the Brockman Iron Formation and Marra Mamba Iron Formation. The Nimingarra Iron Formation in the North East Pilbara, hosts the Yarrie-Nimingarra iron ore deposits. Another important iron bearing sequence is the Marillana Formation which is a detrital derived Channel Iron Deposit currently mined at Yandi. WAIO Mineral Resources contain the ore types: BKM – Brockman, CID – Channel Iron Deposits, MM – Marra Mamba and NIM – Nimingarra. Mineral Resource estimates are largely based upon three metre samples obtained from 140 millimetre Reverse Circulation (RC) drill holes and to a lesser extent 0.3 metre to three metre samples obtained from HQ3 and PQ3 type Diamond Drill holes and three metre samples obtained from 140 millimetre open Percussion holes. RC and Percussion samples are either riffle or static cone split whereas diamond core is typically sampled as a whole. Samples are crushed to 90 per cent minus 2.8 millimetres and then pulverised to 95 per cent minus 0.16 millimetres. Pulp (200 grams) is then used for chemical analysis by X-Ray Fluorescence (XRF) for Fe, SiO2, Al2O3, P, MnO, CaO, K2O, MgO, S and TiO2 and Robotic Thermo-Gravimetric Analysis (ROBTGA) for Loss on Ignition (LOI). Resource estimation is typically performed by Ordinary Kriging (OK) interpolation which uses search criteria consistent with geostatistical models separately developed for both Fe and associated deleterious elements such as SiO2, Al2O3 and P according to the appropriate geological controls. To a lesser extent some deposits contributing Inferred Resources have been estimated using Inverse Distance Weighted (IDW) interpolation or Cross Sectional Area of Influence techniques reflecting data density. Mineral resources have been classified considering data density, data quality, geological continuity and/or complexity, estimation quality, weathering zones and proximity to the water table (Table 1).
Table 1. Nominal drill grid spacing for WAIO Mineral Resource category Classification BKM CID MM NIM Measured (average) 50x50 metres 50x50 metres 50x50 metres 30x30 metres
Indicated (average) 150x50 metres 150x50 metres 150x50 metres 120x60 metres
Inferred (maximum) 1200x100 metres 1200x100 metres 1200x100 metres 1200x120 metres Typically a 54 per cent Fe cut-off is used for resource reporting of Marra Mamba and Brockman Iron Formations, a 52 per cent Fe cut-off is used for Channel Iron Deposits and a 50 per cent Fe cut-off for operational areas within the Nimingarra Formation. These cut-offs employed for the Pilbara Mineral Resources estimates are based on break-even economic analysis and assumed open pit extraction and processing by crushing and screening. It is reasonable to consider that all material above the Mineral Resource cut-off grade would be eligible for sale, either now or in the future as indicated by WAIO strategic mine planning.

Table 2. Mineral Resources (inclusive of Ore Reserves) (100%)(7)
As at 30 June 2014
Measured Resources Indicated Resources Commodity Deposit
Ore type Mt
% Fe
% P
% SiO2
% Al2O3
% LOI Mt
% Fe
% P
% SiO2
% Al2O3
% LOI
Iron Ore
WAIO BKM 1,300 62.2 0.12 3.9 2.4 4.1 4,200 59.9 0.14 4.9 2.5 6.2
CID 960 56.1 0.05 6.4 2.0 10.9 430 56.7 0.06 6.1 2.1 10.3
MM 360 61.9 0.07 3.2 1.8 6.0 870 60.7 0.07 3.8 2.1 6.7
NIM 10 59.0 0.08 10.1 1.2 3.8 120 61.6 0.06 8.0 1.1 1.7
As at 30 June 2014 (continued)
Inferred Resources Total Resources Commodity Deposit
Ore type Mt
% Fe
% P
% SiO2
% Al2O3
% LOI Mt
% Fe
% P
% SiO2
% Al2O3
% LOI
Iron Ore
WAIO BKM 9,200 59.0 0.14 5.4 2.8 6.6 15,000 59.5 0.14 5.1 2.7 6.3
CID 790 54.9 0.06 6.6 3.0 11.0 2,200 55.8 0.05 6.4 2.3 10.8
MM 5,100 59.6 0.07 4.5 2.3 7.2 6,400 59.9 0.07 4.3 2.2 7.0
NIM 70 60.5 0.05 9.9 1.2 1.7 200 61.1 0.06 8.8 1.2 1.8
As at 30 June 2013
Total Resources
BHP Billiton
interest % Commodity Deposit
Ore type Mt
% Fe
% P
% SiO2
% Al2O3
% LOI
Iron Ore
WAIO BKM 13,000 59.6 0.14 5.2 2.7 6.1 88
CID 2,400 55.7 0.05 6.4 2.4 10.9
MM 5,400 59.9 0.07 4.4 2.2 6.9
NIM 190 61.0 0.06 8.9 1.2 1.9
Additional information is contained in Appendix 1. Coal Production
JUN 2014 YTD
JUN 2014 QTR
JUN FY14 vs
JUN FY13
JUN Q14 vs
JUN Q13
JUN Q14 vs
MAR Q14
Metallurgical coal (kt) 45,078 11,886 20% 9% 4%
Energy coal (kt) 73,492 18,363 1% (1%) 4% Metallurgical coal – Metallurgical coal production increased by 20 per cent in the 2014 financial year to a record 45 Mt, exceeding full-year guidance. Metallurgical coal production is forecast to increase by four per cent in the 2015 financial year to 47 Mt as the ramp-up of Caval Ridge is completed.

Queensland Coal achieved record production and sales volumes in the 2014 financial year, supported by strong performance across all operations. This included first production from Caval Ridge, the successful ramp-up of Daunia and record production at Peak Downs, Saraji, South Walker Creek and Poitrel. A sustainable increase in truck and wash-plant utilisation rates underpinned a further improvement in productivity across the business. Illawarra Coal production declined by five per cent in the 2014 financial year to 7.5 Mt. An extended outage at the Dendrobium mine impacted performance, primarily in the September 2013 quarter. As a result of continued weakness in coal prices, persistent strength of the Australian dollar and the recognition of redundancy and restructuring charges, Queensland Coal was marginally EBIT positive during the second half of the 2014 financial year. Energy coal – Energy coal production of 73 Mt in the 2014 financial year was broadly unchanged from the prior period as planned. Another year of robust performance was underpinned by a fifth consecutive annual production record at New South Wales Energy Coal and record volumes at Cerrejón. Extended outages at both a local utility and the Richards Bay Coal Terminal led to lower production at South Africa Energy Coal, while Navajo Coal production declined following the permanent closure of three of the five power units at the Four Corners Power Plant. Energy coal production for the 2015 financial year is expected to remain broadly unchanged at 73 Mt. A drought in the La Guajira region of Colombia is expected to constrain Cerrejón production for the remainder of the 2014 calendar year, given the requirement to manage dust emissions. The port expansion associated with the Cerrejón P40 project is currently being commissioned, although operational issues are expected to constrain capacity at approximately 35 Mtpa (100 per cent basis) in the medium term. Projects
Project and ownership
Capital expenditure
(US$m)
Initial production target date Capacity Progress
Caval Ridge (Australia) 50%
1,870(8) CY14 Greenfield mine development to produce an initial 5.5 Mtpa of export metallurgical coal.
First coal achieved in Q2 CY14, ahead of schedule and under budget. The overall project is 100% complete.
Hay Point Stage Three Expansion (Australia) 50%
1,505(8) CY15 Increases port capacity from 44 Mtpa to 55 Mtpa and reduces storm vulnerability.
On revised schedule and budget. The overall project is 87% complete.
Appin Area 9 (Australia) 100%
845 CY16 Maintains Illawarra Coal’s production capacity with a replacement mining domain and capacity to produce 3.5 Mtpa of metallurgical coal.
On schedule and budget. The overall project is 67% complete.
Aluminium, Manganese and Nickel Production
JUN 2014 YTD
JUN 2014 QTR
JUN YTD14 vs
JUN YTD13
JUN Q14 vs
JUN Q13
JUN Q14 vs
MAR Q14
Alumina (kt) 5,178 1,325 6% 5% 6%
Aluminium (kt) 1,174 276 0% (11%) (3%)
Manganese ores (kt) 8,302 2,255 (3%) 0% 25%
Manganese alloys (kt) 646 181 6% (1%) 12%
Nickel (kt) 143.2 30.9 (7%) (23%) (9%)

Alumina – Alumina production increased by six per cent in the 2014 financial year to a record 5.2 Mt. The Efficiency and Growth project at Worsley reached nameplate capacity during the year and annual production records were achieved at both the Worsley and Alumar refineries. Aluminium – Aluminium production in the 2014 financial year was unchanged at 1.2Mt. Production records at both Hillside and Mozal were offset by lower volumes at Alumar following the phased suspension of 103 kt (BHP Billiton share) of annualised capacity during the 2014 financial year. The final potline at Bayside was closed in June 2014, although the cast house will be supplied by our Hillside smelter as we continue to assess its future. Manganese ores – Despite achieving record production in the June 2014 quarter, manganese ore volumes declined by three per cent in the 2014 financial year as GEMCO was affected by higher than usual rainfall during the wet season. Manganese alloys – Manganese alloy production increased by six per cent from the 2013 financial year which was affected by the temporary suspension of operations at TEMCO. Nickel – Nickel production declined by seven per cent in the 2014 financial year to 143 kt as production at Cerro Matoso was affected by kiln and furnace outages, and lower nickel grades. Nickel West production declined by four per cent following the closure of the Perseverance underground mine in November 2013. Saleable nickel production at Nickle West is expected to decline by four per cent in the 2015 financial year to 95 kt. Ferro-nickel production at Cerro Matoso is expected to decline by three per cent to 43 kt as a result of lower grades and recoveries. On 14 May 2014, BHP Billiton announced a review of the Nickel West business, comprising the Mt Keith, Cliffs and Leinster mines, its concentrators, the Kalgoorlie smelter and the Kwinana refinery. The review is considering all options for the long-term future of Nickel West, including the potential sale of all or part of the business. Minerals exploration Minerals exploration expenditure in the 2014 financial year was US$410 million, of which US$347 million was expensed. Greenfield minerals exploration is predominantly focused on advancing copper targets within Chile and Peru.
1 Refers to copper equivalent production based on average realised prices for the 2013 financial year. 2 Excludes operations which were sold during the year (Liverpool Bay and Pinto Valley). 3 Based on provisional, unaudited estimates. Prices excludes third party product, and represent the weighted average of various sales terms (for example, FOB, CIF and CFR), unless otherwise noted. 4 Includes third party product. 5 Export sales only, excludes Cerrejón. Includes thermal coal sales from metallurgical coal mines. 6 Excludes internal sales. 7 Competent Persons – P. Whitehouse (MAusIMM), M. Lowry (MAusIMM), M. Smith (MAusIMM), D. Stephens (MAIG). The statement of Mineral Resources is presented on a 100 per cent basis, represents an estimate as at 30 June 2014, and is based on information compiled by the above named Competent Persons. Mr. Whitehouse, Mr. Lowry, Mr. Smith and Mr. Stephens are full time employees of BHP Billiton Iron Ore Ltd, are members of either The Australasian Institute of Mining and Metallurgy or The Australian Institute of

Geoscientists, and have sufficient experience relevant to the style of mineralisation and type of deposit under consideration and to the activity they are undertaking to qualify as Competent Persons as defined in the 2012 Edition of the 'Australasian Code for Reporting of Exploration Results, Mineral Resources and Ore Reserves'. Mr. Whitehouse, Mr. Lowry, Mr. Smith and Mr. Stephens consent to the inclusion in the report of the matters based on their information in the form and context in which it appears. 8 Excludes announced pre-commitment funding. The following abbreviations have been used throughout this report: barrels (bbl) billion cubic feet (bcf); cost and freight (CFR); cost, insurance and freight (CIF), dry metric tonne unit (dmtu); free on board (FOB); grams per tonne (g/t); kilograms per tonne (kg/t); kilometre (km); metre (m); million barrels of oil equivalent (MMboe); million cubic feet per day (MMcf/d); million tonnes (Mt); million tonnes per annum (Mtpa); ounces (oz); pounds (lb) thousand barrels of oil equivalent (Mboe); thousand ounces (koz); thousand standard cubic feet (Mscf); thousand tonnes (kt); thousand tonnes per annum (ktpa); thousand tonnes per day (ktpd); tonnes (t); and wet metric tonnes (wmt). Sponsor: Merrill Lynch South Africa Proprietary Limited Further information on BHP Billiton can be found at: www.bhpbilliton.com

Media Relations Australia Emily Perry Tel: +61 3 9609 2800 Mobile: +61 477 325 803 email: [email protected] Paul Hitchens Tel: +61 3 9609 2592 Mobile: +61 419 315 001 email: [email protected] Eleanor Nichols Tel: +61 3 9609 2360 Mobile: +61 407 064 748 email: [email protected] United Kingdom Ruban Yogarajah Tel: +44 20 7802 4033 Mobile: +44 7827 082 022 email: [email protected] Jennifer White Tel: +44 20 7802 7462 Mobile: +44 7827 253 764 email: [email protected] Americas Ruban Yogarajah Tel: +44 20 7802 4033 Mobile: +44 7827 082 022 email: [email protected]
Investor Relations Australia Tara Dines Tel: +61 3 9609 2222 Mobile: +61 499 249 005 Email: [email protected] Jodie Phillips Tel: +61 3 9609 2069 Mobile: +61 418 710 516 email: [email protected] United Kingdom and South Africa Jonathan Price Tel: +44 20 7802 4131 Mobile: +44 7990 527 726 Email: [email protected] Dean Simon Tel: +44 20 7802 7461 Mobile: +44 7717 511 193 email: [email protected] Americas James Agar Tel: +1 212 310 1421 Mobile: +1 347 882 3011 email: [email protected] Joseph Suarez Tel: +1 212 310 1422 Mobile: +1 646 400 3803 email: [email protected]
BHP Billiton Limited ABN 49 004 028 077 Registered in Australia Registered Office: Level 16, 171 Collins Street Melbourne Victoria 3000 Australia Tel +61 1300 55 4757 Fax +61 3 9609 3015
BHP Billiton Plc Registration number 3196209 Registered in England and Wales Registered Office: Neathouse Place London SW1V 1LH United Kingdom Tel +44 20 7802 4000 Fax +44 20 7802 4111
Members of the BHP Billiton Group which is headquartered in Australia

BHP BILLITON PRODUCTION SUMMARY QUARTER ENDED YEAR TO DATE % CHANGE JUN
YTD14 JUN Q14
JUN Q14
JUN MAR JUN JUN JUN vs vs vs
2013 2014 2014 2014 2013 JUN
YTD13 JUN Q13
MAR Q14
Petroleum Crude oil, condensate and NGL (Mboe) 23,441 27,244 28,877 106,147 90,051 18% 23% 6% Natural gas (bcf) 214.5 202.0 215.0 839.3 874.3 (4%) 0% 6% Total petroleum production (MMboe) 59.2 60.9 64.7 246.0 235.8 4% 9% 6% Copper
Copper (kt) 461.7 413.9 470.0 1,727.1 1,689.4 2% 2% 14% Lead (t) 67,034 47,577 46,165 188,026 214,432 (12%) (31%) (3%) Zinc (t) 45,881 19,409 29,116 109,935 128,205 (14%) (37%) 50% Gold (oz) 56,070 43,883 59,705 194,288 184,769 5% 6% 36% Silver (koz) 11,602 8,757 8,509 34,804 38,913 (11%) (27%) (3%) Uranium (t) 1,105 966 1,044 3,988 4,066 (2%) (6%) 8% Molybdenum (t) 376 281 83 1,201 1,561 (23%) (78%) (70%) Iron ore
Iron Ore (kt) 47,689 49,280 56,643 203,564 169,856 20% 19% 15% Coal
Metallurgical coal (kt) 10,858 11,467 11,886 45,078 37,650 20% 9% 4% Energy coal (kt) 18,561 17,723 18,363 73,492 72,445 1% (1%) 4% Aluminium, Manganese and Nickel
Alumina (kt) 1,265 1,250 1,325 5,178 4,880 6% 5% 6% Aluminium (kt) 310 286 276 1,174 1,179 (0%) (11%) (3%) Manganese ores (kt) 2,246 1,801 2,255 8,302 8,517 (3%) 0% 25% Manganese alloys (kt) 182 162 181 646 608 6% (1%) 12% Nickel (kt) 40.3 34.1 30.9 143.2 154.1 (7%) (23%) (9%)
Throughout this report figures in italics indicate that this figure has been adjusted since it was previously reported. BHP BILLITON PRODUCTION
QUARTER ENDED YEAR TO DATE BHP Billiton JUN SEP DEC MAR JUN JUN JUN interest 2013 2013 2013 2014 2014 2014 2013
Petroleum Production
Crude oil, condensate and NGL (Mboe) (1) 23,441 26,053 23,973 27,244 28,877 106,147 90,051
Natural gas (bcf) 214.5 219.7 202.6 202.0 215.0 839.3 874.3
Total petroleum products (MMboe) 59.2 62.7 57.7 60.9 64.7 246.0 235.8
Copper (2) Copper Payable metal in concentrate (kt) Escondida (3) 57.5% 223.0 205.1 208.0 190.6 241.0 844.7 831.5 Antamina 33.8% 34.7 41.9 42.4 33.0 26.2 143.5 139.7 Pinto Valley 100% 10.8 10.9 1.6 - - 12.5 16.6 Total 268.5 257.9 252.0 223.6 267.2 1,000.7 987.8 Cathode (kt) Escondida (3) 57.5% 79.3 73.2 77.5 75.8 81.5 308.0 297.9 Pampa Norte (4) 100% 64.7 43.5 59.4 63.4 66.8 233.1 232.6 Pinto Valley 100% 1.3 0.8 0.1 - - 0.9 4.9 Olympic Dam 100% 47.9 27.9 50.9 51.1 54.5 184.4 166.2 Total 193.2 145.4 187.9 190.3 202.8 726.4 701.6 Total Copper 461.7 403.3 439.9 413.9 470.0 1,727.1 1,689.4 Lead Payable metal in concentrate (t) Cannington 100% 66,666 46,287 47,259 47,214 45,768 186,528 213,425 Antamina 33.8% 368 158 580 363 397 1,498 1,007 Total 67,034 46,445 47,839 47,577 46,165 188,026 214,432

Zinc Payable metal in concentrate (t) Cannington 100% 20,206 16,033 16,123 10,074 15,666 57,896 56,281 Antamina 33.8% 25,675 12,522 16,732 9,335 13,450 52,039 71,924 Total 45,881 28,555 32,855 19,409 29,116 109,935 128,205 Gold Payable metal in concentrate (oz) Escondida (3) 57.5% 17,593 17,347 19,384 15,253 20,920 72,904 71,529 Olympic Dam (refined gold) 100% 38,477 27,649 26,271 28,630 38,785 21,335 113,240 Pinto Valley 100% - 49 - - - 49 - Total 56,070 45,045 45,655 43,883 59,705 194,288 184,769 Silver Payable metal in concentrate (koz) Escondida (3) 57.5% 890 891 982 1,078 1,320 4,271 2,960 Antamina 33.8% 1,297 1,205 1,350 961 843 4,359 3,952 Cannington 100% 9,101 6,361 6,306 6,465 6,029 25,161 31,062 Olympic Dam (refined silver) 100% 266 190 212 253 317 972 880 Pinto Valley 100% 48 41 - - - 41 59 Total 11,602 8,688 8,850 8,757 8,509 34,804 38,913 Uranium Payable metal in concentrate (t) Olympic Dam 100% 1,105 970 1,008 966 1,044 3,988 4,066 Total 1,105 970 1,008 966 1,044 3,988 4,066 Molybdenum Payable metal in concentrate (t) Antamina 33.8% 376 458 379 281 83 1,201 1,561 Total 376 458 379 281 83 1,201 1,561 Iron Ore Production (kt) (5) Newman 85% 14,391 12,196 12,483 15,470 16,766 56,915 44,620 Yarrie 85% - 202 428 206 - 836 1,106 Area C Joint Venture 85% 12,552 11,814 11,383 11,282 12,481 46,960 44,717 Yandi Joint Venture 85% 17,027 18,146 17,135 15,622 17,615 68,518 60,054 Jimblebar (6) 85% - 700 1,702 2,721 3,740 8,863 - Wheelarra (7) 85% 1,017 3,166 2,716 1,698 2,973 10,553 8,377 Samarco 50% 2,702 2,729 2,841 2,281 3,068 10,919 10,982 Total 47,689 48,953 48,688 49,280 56,643 203,564 169,856 Coal Metallurgical coal Production (kt) (8) BMA 50% 6,696 6,705 7,494 7,461 7,596 29,256 22,645 BHP Mitsui Coal (9) 80% 1,846 2,057 2,114 1,995 2,143 8,309 7,063 Illawarra 100% 2,316 1,423 1,932 2,011 2,147 7,513 7,942 Total 10,858 10,185 11,540 11,467 11,886 45,078 37,650 Energy Coal Production (kt) South Africa (10) 90% 7,902 7,937 7,036 7,398 8,013 30,384 31,627 USA 100% 2,752 3,145 2,896 2,359 2,412 10,812 12,791 Australia 100% 4,893 5,372 4,544 5,018 5,030 19,964 18,010 Colombia 33.3% 3,014 3,185 3,291 2,948 2,908 12,332 10,017 Total 18,561 19,639 17,767 17,723 18,363 73,492 72,445 Aluminium, Manganese and Nickel Aluminia Saleable production (kt) Worsley 86% 961 946 1,024 936 1,010 3,916 3,675 Alumar 36% 304 305 328 314 315 1,262 1,205 Total 1,265 1,251 1,352 1,250 1,325 5,178 4,880 Aluminium Production (kt) Hillside 100% 181 184 183 172 176 715 665

Bayside (11) 100% 24 24 24 23 18 89 96 Alumar 40% 39 35 28 26 15 104 154 Mozal 47.1% 66 67 67 65 67 266 264 Total 310 310 302 286 276 1,174 1,179 Manganese ores Saleable production (kt) South Africa (12) 44.4% 939 864 944 782 936 3,526 3,490 Australia (12) 60% 1,307 1,182 1,256 1,019 1,319 4,776 5,027 Total 2,246 2,046 2,200 1,801 2,255 8,302 8,517 Manganese alloys Saleable production (kt) South Africa (12) (13) 60% 104 86 94 91 106 377 374 Australia (12) 60% 78 51 72 71 75 269 234 Total 182 137 166 162 181 646 608 Nickel Saleable production (kt) Cerro Matoso 99.9% 12.8 12.0 12.3 9.8 10.2 44.3 50.8 Nickel West 100% 27.5 28.4 25.5 24.3 20.7 98.9 103.3 Total 40.3 40.4 37.8 34.1 30.9 143.2 154.1
BHP BILLITON PRODUCTION
(1) LPG and ethane are reported as Natural Gas Liquid (NGL). Product-specific conversions are made and NGL is reported in barrels of oil equivalent (boe). Total boe conversions are based on 6,000 scf of natural gas equals 1 boe. (2) Metal production is reported on the basis of payable metal. (3) Shown on 100% basis following the application of the new IFRS 10 which came into effect from 1 July 2013. BHP Billiton interest in saleable production is 57.5%. (4) Includes Cerro Colorado and Spence. (5) Iron ore production is reported on a wet tonnes basis. (6) Shown on 100% basis. BHP Billiton interest in saleable production is 85%. (7) All production from Wheelarra is now processed via the Jimblebar processing hub. (8) Metallurgical coal production is reported on the basis of saleable product. Production figures include some thermal coal. (9) Shown on 100% basis. BHP Billiton interest in saleable production is 80%. (10) Shown on 100% basis. BHP Billiton interest in saleable production is 90%. (11) Aluminium smelting at Bayside ceased with the closure of the final potline in June 2014. (12) Shown on 100% basis. BHP Billiton interest in saleable production is 60%, except Hotazel Manganese Mines which is 44.4%. (13) Production includes Medium Carbon Ferro Manganese.

PRODUCTION AND SALES REPORT QUARTER ENDED YEAR TO DATE JUN SEP DEC MAR JUN JUN JUN 2013 2013 2013 2014 2014 2014 2013 Petroleum Crude oil, condensate and NGL (Mboe) Crude oil and condensate Bass Strait 2,229 2,247 1,958 2,095 2,355 8,655 8,813 North West Shelf 1,646 1,865 1,497 1,504 1,408 6,274 6,868 Stybarrow 401 348 317 282 255 1,202 1,722 Pyrenees 1,817 1,707 1,295 2,386 2,075 7,463 8,460 Other Australia (1) 12 14 12 11 14 51 59 Atlantis (2) 2,594 2,953 3,988 3,734 4,114 14,789 7,995 Mad Dog (2) 649 732 496 704 187 2,119 2,715 Shenzi (2) 3,378 3,467 3,201 3,467 3,530 13,665 14,749 Onshore US (3) 3,614 5,044 4,238 5,589 7,069 21,940 11,701 Trinidad/Tobago 259 320 314 279 248 1,161 1,328 Other Americas (2) (4) 403 378 373 329 371 1,451 1,564 UK (5) 282 142 305 254 27 728 1,223 Algeria 1,210 1,142 1,156 1,069 996 4,363 5,042 Pakistan 65 62 52 49 37 200 273 Total 18,559 20,421 19,202 21,752 22,686 84,061 72,512 NGL Bass Strait 1,753 2,001 1,603 1,621 2,026 7,251 6,553 North West Shelf 312 399 234 276 288 1,197 1,374 Atlantis (2) 200 255 348 288 111 1,002 559 Mad Dog (2) - 38 24 36 39 137 143 Shenzi (2) 224 266 252 280 252 1,050 1,187 Onshore US (3) 2,375 2,656 2,295 2,986 3,471 11,408 7,631 Other Americas (2) (4) 9 11 10 2 - 23 55 UK (5) 9 6 5 3 4 18 37 Total 4,882 5,632 4,771 5,492 6,191 22,086 17,539
Total crude oil, condensate and NGL 23,441 26,053 23,973 27,244 28,877 106,147 90,051
Natual gas (bcf) Bass Strait 33.6 34.2 22.7 21.2 30.5 108.6 123.7 North West Shelf 30.3 34.2 30.3 31.4 31.8 127.7 131.0 Other Australia (1) 4.5 9.3 15.1 13.2 13.6 51.2 21.4 Atlantis (2) 0.8 1.3 1.8 1.8 1.9 6.8 2.9 Mad Dog (2) 0.1 0.1 0.1 0.1 0.1 0.4 0.4 Shenzi (2) 0.8 0.8 0.8 0.8 0.8 3.2 4.6 Onshore US (3) 118.1 114.9 105.3 109.7 118.9 448.8 479.4 Trinidad/Tobago 9.1 9.9 9.7 9.3 9.1 38.0 36.3 Other Americas (2) (4) 0.3 0.3 0.3 0.2 0.2 1.0 1.7 UK (5) 4.1 3.5 6.2 5.4 0.8 15.9 19.1 Pakistan 12.8 11.2 10.3 8.9 7.3 37.7 53.8 Total 214.5 219.7 202.6 202.0 215.0 839.3 874.3 Total petroleum production (MMboe) (6) 59.2 62.7 57.7 60.9 64.7 246.0 235.8
(1) Other Australia includes Minerva and Macedon. Macedon achieved first production in August 2013. (2) Gulf of Mexico volumes are net of royalties. (3) Onshore US volumes are net of mineral holder royalties. (4) Other Americas includes Neptune, Genesis and Overriding Royalty Interest. (5) UK includes Bruce/Keith and Liverpool Bay. BHP Billiton completed the sale of its 46.1% operated interest in Liverpool Bay on 31 March 2014. (6) Total boe conversions are based on 6,000 scf of natural gas equals 1 boe.

PRODUCTION AND SALES REPORT QUARTER ENDED YEAR TO DATE JUN SEP DEC MAR JUN JUN JUN 2013 2013 2013 2014 2014 2014 2013 Copper Metals production is payable metal unless otherwise stated. Escondida, Chile (1) Material mined (kt) 98,665 93,744 93,814 96,420 94,673 378,651 392,669 Sulphide ore milled (kt) 19,295 18,276 19,584 21,051 21,438 80,349 73,905 Average copper grade (%) 1.42% 1.37% 1.30% 1.12% 1.33% 1.28% 1.40% Production ex mill (kt) 231.9 210.6 214.4 195.5 235.6 856.1 863.0
Production
Payable copper (2) (kt) 223.0 205.1 208.0 190.6 241.0 844.7 831.5 Payable gold concentrate (fine oz) 17,593 17,347 19,384 15,253 20,920 72,904 71,529 Copper cathode (EW) (kt) 79.3 73.2 77.5 75.8 81.5 308.0 297.9 Payable silver concentrate (koz) 890 891 982 1,078 1,320 4,271 2,960
Sales
Payable copper (kt) 228.2 192.3 228.1 173.2 239.1 832.7 836.2 Payable gold concentrate (fine oz) 15,831 12,490 18,602 20,889 20,920 72,901 69,041 Copper cathode (EW) (kt) 95.0 63.0 86.7 76.4 83.3 309.4 303.0 Payable silver concentrate (koz) 908 836 1,076 1,046 1,320 4,278 2,963
(1) Shown on 100% basis following the application of the new IFRS 10 which came into effect from 1 July 2013. BHP Billiton interest in saleable production is 57.5%. (2) June 2014 quarter includes 4.3 kt of copper contained in ore sold to third parties.
Pampa Norte, Chile Cerro Colorado
Material mined (kt)
16,303
15,771
17,487
15,939
17,087
66,284
63,056 Ore milled (kt) 4,351 4,161 4,501 4,508 4,016 17,186 17,412 Average copper grade (%) 0.82% 0.78% 0.76% 0.75% 0.76% 0.76% 0.67%
Production
Copper cathode (EW) (kt) 21.2 17.6 19.4 22.0 21.3 80.3 71.5
Sales
Copper cathode (EW) (kt) 21.7 17.3 17.6 12.4 28.7 76.0 70.3
Spence
Material mined (kt) 28,646 24,331 27,911 25,037 25,962 103,241 111,047 Ore milled (kt) 4,146 4,860 4,788 4,735 3,775 18,158 16,100 Average copper grade (%) 1.16% 1.11% 1.25% 1.23% 1.30% 1.22% 1.25%
Production
Copper cathode (EW) (kt) 43.5 25.9 40.0 41.4 45.5 152.8 161.1
Sales
Copper cathode (EW) (kt) 57.9 25.9 35.9 40.0 49.6 151.4 161.4 Antamina, Peru Material mined (100%) (kt) 56,254 56,428 50,872 45,837 49,797 202,934 208,014 Sulphide ore milled (100%) (kt) 12,424 11,765 12,521 11,729 12,756 48,771 46,780 Average head grades - Copper (%) 1.03% 1.21% 1.15% 1.00% 0.77% 1.03% 1.06% - Zinc (%) 1.02% 0.56% 0.72% 0.54% 0.58% 0.60% 0.81%
Production
Payable copper (kt) 34.7 41.9 42.4 33.0 26.2 143.5 139.7 Payable zinc (t) 25,675 12,522 16,732 9,335 13,450 52,039 71,924 Payable silver (koz) 1,297 1,205 1,350 961 843 4,359 3,952 Payable lead (t) 368 158 580 363 397 1,498 1,007 Payable molybdenum (t) 376 458 379 281 83 1,201 1,561
Sales
Payable copper (kt) 31.9 41.3 44.5 30.2 26.5 142.5 138.4 Payable zinc (t) 22,560 16,123 18,397 10,158 14,527 59,205 72,015

Payable silver (koz) 1,165 1,503 1,367 910 893 4,673 3,887 Payable lead (t) 262 297 368 405 521 1,591 983 Payable molybdenum (t) 283 411 442 347 142 1,342 1,571 Cannington, Australia Material mined (kt) 802 893 974 773 806 3,446 3,146 Ore milled (kt) 866 750 852 779 821 3,202 3,145 Average head grades - Silver (g/t) 401 315 274 311 286 296 360 - Lead (%) 9.1% 7.4% 6.7% 7.3% 6.9% 7.1% 7.9% - Zinc (%) 3.8% 3.3% 3.1% 2.4% 3.1% 3.0% 3.0%
Production
Payable silver (koz) 9,101 6,361 6,306 6,465 6,029 25,161 31,062 Payable lead (t) 66,666 46,287 47,259 47,214 45,768 186,528 213,425 Payable zinc (t) 20,206 16,033 16,123 10,074 15,666 57,896 56,281
Sales
Payable silver (koz) 7,793 7,844 6,548 6,127 5,641 26,160 30,258 Payable lead (t) 64,633 56,500 47,185 43,649 41,607 188,941 218,655 Payable zinc (t) 21,056 17,286 18,241 11,020 15,708 62,255 57,195 Olympic Dam, Australia Material mined (1) (kt) 2,750 2,897 2,717 2,495 2,405 10,514 9,547 Ore milled (kt) 2,641 2,404 2,641 2,421 2,654 10,120 9,900 Average copper grade (%) 1.86% 1.85% 1.86% 1.90% 1.91% 1.88% 1.80% Average uranium grade (kg/t) 0.56 0.53 0.52 0.54 0.51 0.52 0.53
Production
Copper cathode (ER) (kt) 45.1 25.9 47.6 48.4 51.3 173.2 154.2 Copper cathode (EW) (kt) 2.8 2.0 3.3 2.7 3.2 11.2 12.0 Uranium oxide concentrate (t) 1,105 970 1,008 966 1,044 3,988 4,066 Refined gold (fine oz) 38,477 27,649 26,271 28,630 38,785 121,335 113,240 Refined silver (koz) 266 190 212 253 317 972 880
Sales
Copper cathode (ER) (kt) 46.4 26.8 43.3 47.5 54.2 171.8 154.8 Copper cathode (EW) (kt) 3.5 2.1 2.8 2.5 3.0 10.4 12.7 Uranium oxide concentrate (t) 1,374 930 1,037 732 1,426 4,125 4,148 Refined gold (fine oz) 38,394 21,675 32,226 31,129 38,500 123,530 109,248 Refined silver (koz) 275 176 177 262 367 982 920
(1) Material mined refers to run of mine ore mined and hoisted.
Pinto Valley, US (1) Production Payable copper (kt) 10.8 10.9 1.6 - - 12.5 16.6 Copper cathode (EW) (kt) 1.3 0.8 0.1 - - 0.9 4.9 Payable silver (koz) 48 41 - - - 41 59 Payable gold (oz) - 49 - - - 49 -
Sales
Payable copper (kt) 9.9 10.0 - - - 10.0 12.5 Copper cathode (EW) (kt) 1.4 1.1 0.2 - - 1.3 4.9 Payable silver (koz) 48 41 - - - 41 59 Payable gold (oz) - 49 - - - 49 -
(1) On 11 October 2013 BHP Billiton completed the sale of its Pinto Valley operations.

PRODUCTION AND SALES REPORT QUARTER ENDED YEAR TO DATE JUN SEP DEC MAR JUN JUN JUN 2013 2013 2013 2014 2014 2014 2013 Iron Ore (kt) Iron ore Pilbara, Australia Production (1) Newman 14,391 12,196 12,483 15,470 16,766 56,915 44,620 Yarrie (2) - 202 428 206 - 836 1,106 Area C Joint Venture 12,552 11,814 11,383 11,282 12,481 46,960 44,717 Yandi Joint Venture 17,027 18,146 17,135 15,622 17,615 68,518 60,054 Jimblebar (3) - 700 1,702 2,721 3,740 8,863 - Wheelarra (4) 1,017 3,166 2,716 1,698 2,973 10,553 8,377 Total 44,987 46,224 45,847 46,999 53,575 192,645 158,874 Total production (100%) 52,926 54,258 53,638 54,812 62,369 225,077 186,911
Sales
Lump 11,284 10,292 9,996 11,230 11,572 43,090 38,767 Fines 34,621 35,283 35,756 35,880 40,834 147,753 122,188 Total 45,905 45,575 45,752 47,110 52,406 190,843 160,955 Total sales (100%) 54,006 53,561 53,808 55,018 61,015 223,402 189,357
(1) Iron ore production and sales are reported on a wet tonnes basis. (2) Yarrie ceased production on 25 February 2014. (3) Shown on a 100% basis. BHP Billiton interest in saleable production is 85%. (4) All production from Wheelarra is now processed via the Jimblebar processing hub.
Samarco, Brazil Production (1) 2,702 2,729 2,841 2,281 3,068 10,919 10,982
Sales 2,651 2,676 3,025 2,036 3,077 10,814 11,015
(1) Iron ore production and sales are reported on a wet tonnes basis.
PRODUCTION AND SALES REPORT QUARTER ENDED YEAR TO DATE JUN SEP DEC MAR JUN JUN JUN 2013 2013 2013 2014 2014 2014 2013 Coal (kt) Metallurgical coal Queensland Coal Production (1) BMA Blackwater 1,539 1,691 1,655 1,759 1,625 6,730 5,432 Goonyella 1,816 1,737 1,999 2,041 1,553 7,330 6,221 Peak Downs 1,140 1,112 1,201 1,314 1,282 4,909 4,545 Saraji 971 1,197 1,195 1,108 1,058 4,558 3,449 Gregory Joint Venture 854 464 850 654 997 2,965 2,523 Daunia 376 504 594 585 518 2,201 475 Caval Ridge (2) - - - - 563 563 - Total BMA 6,696 6,705 7,494 7,461 7,596 29,256 22,645
BHP Mitsui Coal (3)
South Walker Creek 1,215 1,298 1,313 1,312 1,323 5,246 4,351 Poitrel 631 759 801 683 820 3,063 2,712 Total BHP Mitsui Coal 1,846 2,057 2,114 1,995 2,143 8,309 7,063 Total Queensland Coal 8,542 8,762 9,608 9,456 9,739 37,565 29,708
Sales
Coking coal 6,316 6,123 6,517 7,030 7,250 26,920 20,868 Weak coking coal 2,417 2,397 2,505 2,594 2,358 9,854 7,811 Thermal coal 30 160 271 122 134 687 581 Total 8,763 8,680 9,293 9,746 9,742 37,461 29,260

(1) Metallurgical coal production is reported on the basis of saleable product. Production figures include some thermal coal. (2) Caval Ridge achieved first production in the June 2014 quarter. (3) Shown on 100% basis. BHP Billiton interest in saleable production is 80%.
Illawarra, Australia Production (1) 2,316 1,423 1,932 2,011 2,147 7,513 7,942
Sales
Coking coal 1,877 1,084 1,495 1,581 1,761 5,921 7,032 Thermal coal 436 359 318 460 486 1,623 1,410 Total 2,313 1,443 1,813 2,041 2,247 7,544 8,442
(1) Metallurgical coal production is reported on the basis of saleable product. Production figures include some thermal coal.
Energy coal
South Africa (1) Production 7,902 7,937 7,036 7,398 8,013 30,384 31,627
Sales
Export 3,363 2,504 4,087 3,179 3,528 13,298 13,935 Local utility 4,353 4,543 3,811 3,478 4,498 16,330 18,008 Inland 24 - - - - - 122 Total 7,740 7,047 7,898 6,657 8,026 29,628 32,065
(1) Shown on 100% basis. BHP Billiton interest in saleable product is 90%. New Mexico, USA
Production Navajo Coal (1) 1,569 1,670 1,400 975 1,082 5,127 7,468 San Juan Coal 1,183 1,475 1,496 1,384 1,330 5,685 5,323 Total 2,752 3,145 2,896 2,359 2,412 10,812 12,791
Sales - local utility
2,815 3,129 2,950 2,360 2,382 10,821 12,775
(1) BHP Billiton completed the sale of Navajo Mine on 30 December 2013. As BHP Billiton will retain control of the mine until full consideration is received, production will continue to be reported by the Group.
NSW Energy Coal, Australia
Production 4,893 5,372 4,544 5,018 5,030 19,964 18,010
Sales
Export 4,289 4,037 4,887 4,346 4,548 17,818 17,469 Inland 478 446 332 270 333 1,381 1,167 Total 4,767 4,483 5,219 4,616 4,881 19,199 18,636 Cerrejon, Colombia
Production 3,014 3,185 3,291 2,948 2,908 12,332 10,017
Sales - export
3,157 3,155 3,067 2,647 2,858 11,727 10,263 PRODUCTION AND SALES REPORT QUARTER ENDED YEAR TO DATE JUN SEP DEC MAR JUN JUN JUN 2013 2013 2013 2014 2014 2014 2013 Aluminium, Manganese and Nickel (kt) Alumina Saleable production Worsley, Australia 961 946 1,024 936 1,010 3,916 3,675 Alumar, Brazil 304 305 328 314 315 1,262 1,205 Total 1,265 1,251 1,352 1,250 1,325 5,178 4,880
Sales
Worsley, Australia 1,031 897 961 986 1,020 3,864 3,677 Alumar, Brazil 329 278 320 262 388 1,248 1,275 Total 1,360 1,175 1,281 1,248 1,408 5,112 4,952

Aluminium Production Hillside, South Africa 181 184 183 172 176 715 665 Bayside, South Africa (1) 24 24 24 23 18 89 96 Alumar, Brazil 39 35 28 26 15 104 154 Mozal, Mozambique 66 67 67 65 67 266 264 Total 310 310 302 286 276 1,174 1,179
Sales
Hillside, South Africa 191 180 173 187 168 708 667 Bayside, South Africa (1) 26 24 24 24 24 96 105 Alumar, Brazil 38 34 28 25 17 104 164 Mozal, Mozambique 65 68 74 72 62 276 264 Total 320 306 299 308 271 1,184 1,200 (1) Aluminium smelting at Bayside ceased with the closure of the final potline in June 2014. Manganese ores Saleable production South Africa (1) 939 864 944 782 936 3,526 3,490 Australia (1) 1,307 1,182 1,256 1,019 1,319 4,776 5,027 Total 2,246 2,046 2,200 1,801 2,255 8,302 8,517
Sales
South Africa (1) 970 920 714 915 931 3,480 3,491 Australia (1) 1,102 1,078 1,445 1,252 1,288 5,063 4,578 Total 2,072 1,998 2,159 2,167 2,219 8,543 8,069 Manganese alloys Saleable production South Africa (1) (2) 104 86 94 91 106 377 374 Australia (1) 78 51 72 71 75 269 234 Total 182 137 166 162 181 646 608
Sales
South Africa (1) (2) 110 88 87 113 112 400 385 Australia (1) 61 54 63 85 74 276 227 Total 171 142 150 198 186 676 612
(1) Shown on 100% basis. BHP Billiton interest in saleable production is 60%, except Hotazel Manganese Mines which is 44.4%. (2) Production includes Medium Carbon Ferro Manganese.
Nickel Cerro Matoso, Colombia Production 12.8 12.0 12.3 9.8 10.2 44.3 50.8
Sales 13.1 12.6 12.3 10.0 10.2 45.1 52.1
Nickel West, Australia Saleable production Nickel contained in concentrate 3.0 3.4 2.4 2.5 1.6 9.9 11.5 Nickel contained in finished matte 8.6 8.8 6.1 6.1 4.4 25.4 31.7 Nickel metal 15.9 16.2 17.0 15.7 14.7 63.6 60.1 Nickel production 27.5 28.4 25.5 24.3 20.7 98.9 103.3
Sales
Nickel contained in concentrate 3.0 2.7 2.8 2.3 1.6 9.4 10.6 Nickel contained in finished matte 9.7 7.8 7.4 5.3 6.2 26.7 32.4 Nickel metal 17.7 15.3 17.2 16.7 14.4 63.6 64.2 Nickel sales 30.4 25.8 27.4 24.3 22.2 99.7 107.2