bharath chandrashekhar hui li rodrigo serna presented march 11, 2014
TRANSCRIPT
Air Lease Corporation (AL)Bharath ChandrashekharHui LiRodrigo SernaPresented March 11, 2014

2
Agenda
Current Holdings – Current Holdings of AL
Relevant Macroeconomic Trends Industry Structure Analysis Company Overview Financial Analysis Projections/Assumptions Valuation Recommendation

3
Current Portfolio Holdings
ABBV; 11.87%
ABT; 9.13%
AEO; 12.44%
AL; 8.48%
COF; 4.33%JKHY; 6.63%
LF; 8.80%
PETM; 3.96%
SNA; 6.59%
UNP; 10.82%
WAG; 11.63% ZIXI; 5.32%

4
Stock performance
400 shares of AL purchased on 12/18/12@ 22.32
Closed @ 37.09 on 3/10/14

5
Relevant Macroeconomic Trends
+ Global Airline Market+ Global GDP Growth
+ European & Asian Markets+ Budget Airlines+ Increase in % of Global Fleet Leased- Emerging Markets+/- Consolidation of Industry
Source: CIT Aerospace Aircraft Leasing Industry Overview (p26, p29) Caption: Percentage of Fleets Leased in Geographic Areas
6
Industry Structure Analysis
Industry Landscape
/Competition
MEDIUM
Bargaining Power of Suppliers
HIGH
Threat of Substitutes
LOW
Threat of New Entrants
LOW
Bargaining Power of Buyers
MEDIUM
7
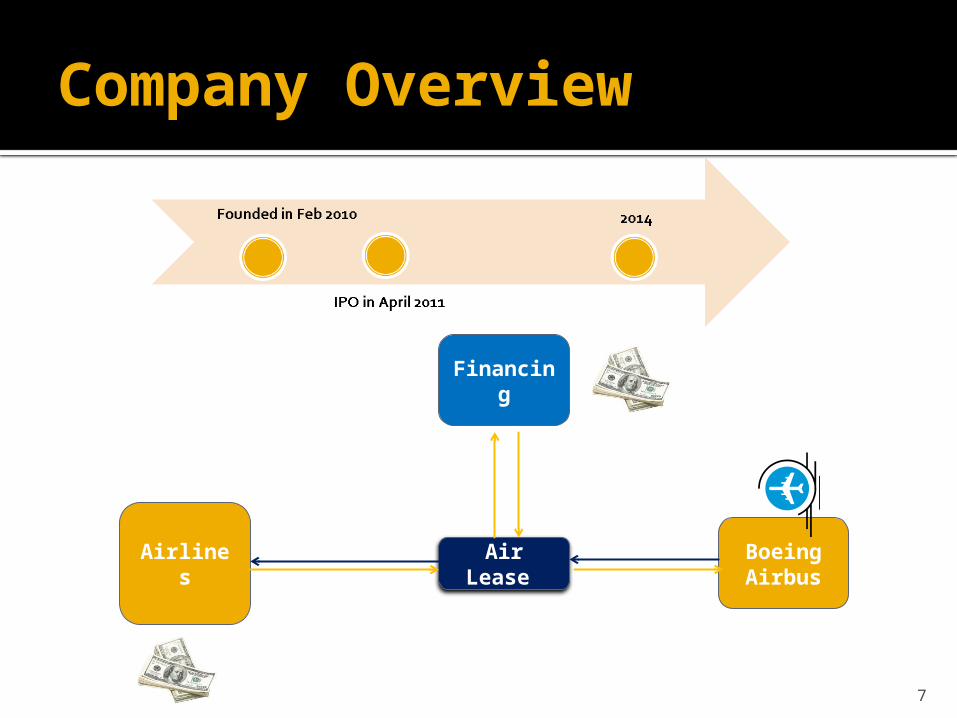
Company Overview
Air Lease
BoeingAirbus
Airlines
Financing

8
Debt
Unsecured Debt (70% of Total Debt): Flexibility BBB- from S&P, Aug 2013
Source: AL 2013 10K P45

9
Products
Source: AL 2013 10K P46
12/31/2011 12/31/2012 12/31/2013Fleet Size 102 155 193Weighted average age 3.6 3.5 3.7Weighted average remaining lease term 6.6 6.8 7.1
10
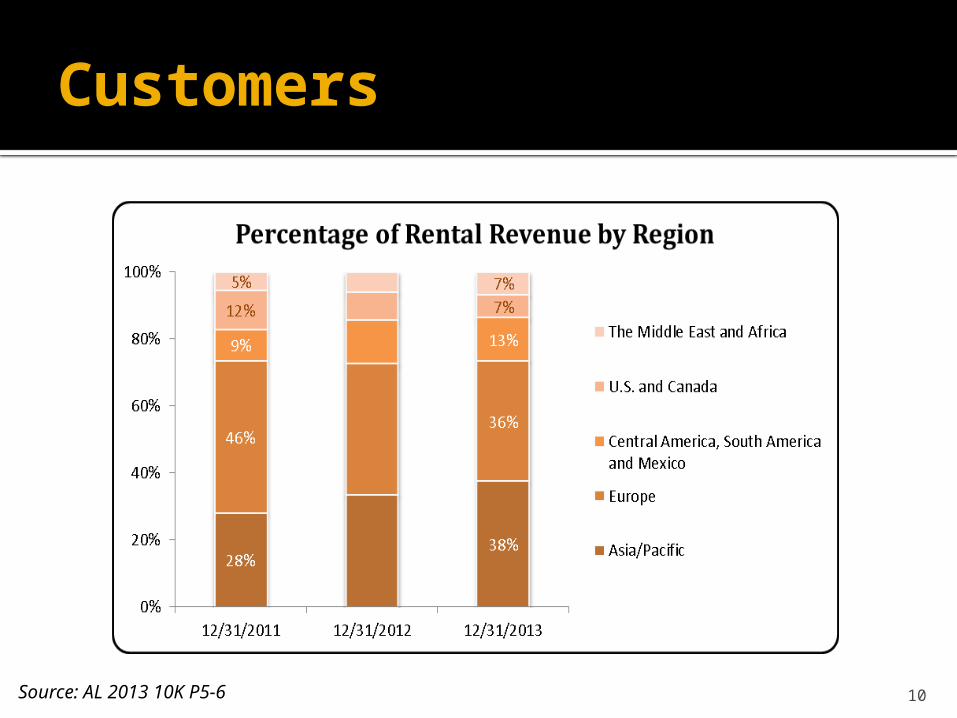
Customers
Source: AL 2013 10K P5-6

11
SWOT Analysis
Strengths Weaknesses Management Team Low Composite Interest Rate Young Fleet Portfolio
Fixed Rental Income vs. FloatedInterest Payment
High supplier concentration for commercial aircraft
Opportunities Threats
Economic Recovery Companies in emerging markets
are in need of leased aircraft
Lawsuit: The “AIG/ILFC Complaint” to Cross Complaint
Emerging Markets Rising Interest Rate
12
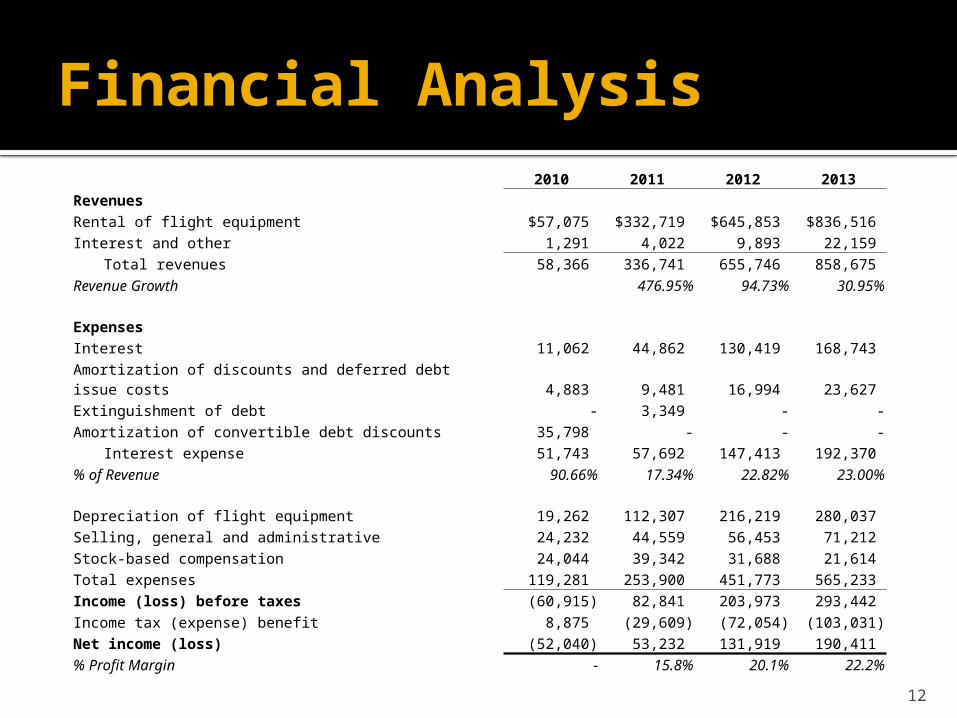
Financial Analysis2010 2011 2012 2013
RevenuesRental of flight equipment $57,075 $332,719 $645,853 $836,516 Interest and other 1,291 4,022 9,893 22,159
Total revenues 58,366 336,741 655,746 858,675 Revenue Growth 476.95% 94.73% 30.95%
ExpensesInterest 11,062 44,862 130,419 168,743 Amortization of discounts and deferred debt issue costs 4,883 9,481 16,994 23,627 Extinguishment of debt - 3,349 - -Amortization of convertible debt discounts 35,798 - - -
Interest expense 51,743 57,692 147,413 192,370 % of Revenue 90.66% 17.34% 22.82% 23.00%
Depreciation of flight equipment 19,262 112,307 216,219 280,037 Selling, general and administrative 24,232 44,559 56,453 71,212 Stock-based compensation 24,044 39,342 31,688 21,614 Total expenses 119,281 253,900 451,773 565,233 Income (loss) before taxes (60,915) 82,841 203,973 293,442 Income tax (expense) benefit 8,875 (29,609) (72,054) (103,031)
Net income (loss) (52,040) 53,232 131,919 190,411
% Profit Margin - 15.8% 20.1% 22.2%

13
Projections/Assumptions2014 2015 2016 2017 2018
Fleet Size 228 263 283 307 338% Growth 28.3% 15.4% 7.6% 8.5% 10.1%
Income StatementRevenue from rental of flight equipment $1,094,459 $1,287,718 $1,413,356 $1,563,881 $1,756,233 Revenue from interest and other 31,266 39,672 46,958 56,034 64,776 Interest Expense 249,221 290,353 315,557 345,742 384,460 Depreciation of flight equipment 359,563 415,174 447,192 485,602 535,171 Selling, general and administrative 90,058 106,191 116,825 129,593 145,681Stock-based compensation 16,886 19,911 21,905 24,299 27,315Net Income $266,499 $322,245 $363,242 $412,542 $473,448
% Growth 40.0% 20.9% 12.7% 13.6% 14.8%
$ of Revenue from rental of flight equipment / Plane $4,800 $4,896 $4,994 $5,094 $5,196 % Growth 2.0% 2.0% 2.0% 2.0% 2.0%
$ of Revenue from interest and other / Plane 137 151 166 183 192% Growth 10% 10% 10% 10% 5%
$ of Interest Expense / Plane 1,093 1,104 1,115 1,126 1,137 % Growth 1.0% 1.0% 1.0% 1.0% 1.0%
$ Depreciation of flight equipment / Plane $1,577 $1,579 $1,580 $1,582 $1,583 % Growth 0.1% 0.1% 0.1% 0.1% 0.1%
$ Selling, general and administrative / Total revenue 8.0% 8.0% 8.0% 8.0% 8.0%$ Stock-based compensation / Plane 1.5% 1.5% 1.5% 1.5% 1.5%
Balance SheetTotal shareholders' equity 2,730,356 2,954,245 3,196,493 3,458,605 3,742,211
% Growth 8.2% 8.2% 8.2% 8.2% 8.2%

14
Financial Ratios
General Return on Investment LTM Leverage Ratios
Implied Debt / Debt / Net Debt /
ROIC ROE ROA Div. Yield Tot. Cap. EBITDA EBITDA
Company Ticker FYE (%) (%) (%) (%) (%) (x) (x)
Air Lease Corp AL Dec-31 3.62% 7.55% 2.04% 1.32% 69.88% 10.2x 9.7x
AerCap Holdings AER Dec-31 3.80% 12.04% 3.10% 1.13% 72.27% 9.6x 9.2x
FLY Leasing Limited FLY Dec-31 2.02% 8.48% 1.52% 3.05% 79.41% 11.4x 10.5x
Aircastle LTD AYR Dec-31 0.82% 1.81% 0.48% 16.24% 69.43% 11.5x 9.5x
Mean 2.21% 7.44% 1.70% 6.81% 73.70% 10.83 9.73
Median 2.02% 8.48% 1.52% 3.05% 72.27% 11.40 9.50
High 3.80% 12.04% 3.10% 16.24% 79.41% 11.5x 10.5x
Low 0.82% 1.81% 0.48% 1.13% 69.43% 9.6x 9.2x

15
Valuation
2014 2015 2016 2017 2018Net Income 266,499 322,245 363,242 412,542 473,448 Minus Increase in Shareholders' Equity (206,422) (223,308) (241,575) (261,336) (282,714)Ending Shareholders' Equity 2,729,856 2,953,163 3,194,738 3,456,074 3,738,788
Terminal Value 4,649,523 Equity Cash Flow 60,077 98,937 121,667 151,206 8,579,046
Present Value of Total Equity 4,977,471 Shares Outstanding 108,963,550
Implied Share Price 45.68
Terminal Growth Rate 2.5%Discount Rate 12.9%Growth Rate of Shareholders' Equity 8.2%
Terminal Growth Rate$45.68 1.5% 2.0% 2.5% 3.0% 3.5%
Discount Rate
10.9% 52.44 54.16 56.08 58.24 60.70 11.9% 47.62 48.97 50.46 52.12 53.97 12.9% 43.44 44.51 45.68 46.97 48.39 13.9% 40.13 41.00 41.96 42.99 44.13 14.9% 37.14 37.86 38.64 39.49 40.41
Growth of Shareholders' Equity45.68 6.2% 7.2% 8.2% 9.2% 10.2%
Discount Rate
10.9% 56.46 56.27 56.08 55.88 55.67 11.9% 50.86 50.66 50.46 50.25 50.04 12.9% 46.10 45.89 45.68 45.46 45.24 13.9% 42.39 42.17 41.96 41.73 41.49 14.9% 39.09 38.87 38.64 38.40 38.16

16
Comparable Companies

17
Recommendation
400 Shares
HOLD