bgp in 2011 geoff huston apnic. conventional (historical) bgp wisdom iab workshop on inter-domain...
TRANSCRIPT

BGP in 2011
Geoff HustonAPNIC

Conventional (Historical) BGP Wisdom
IAB Workshop on Inter-Domain routing in October 2006 – RFC 4984:
“routing scalability is the most important problem facing the Internet today and must be solved”

Conventional Wisdom
So lets examine this conventional wisdom relating to the scaling properties of BGP by looking at BGP in 2011...
Conventional wisdom (CW) is a term used to describe ideas or explanations that are generally accepted as true by the public or by experts in a field. Such ideas or explanations, though widely held, are unexamined.*
* Ironically, I’ll cite that renown source of conventional wisdom, Wikipedia (http://en.wikipedia.org/wiki/Conventional_wisdom)

IPv4 BGP Prefix Count 2010 - 2011
Jan2010
Jan2011
320,000
350,000
380,000
Jul2010
Jul2011

Jan2010
Jan2011
320,000
350,000
380,000
Jul2010
Jul2011
IPv4 BGP Prefix Count
Route Aggregation events
APNIC IPv4 runout day

IPv4 Routed Address Span
2010 2011Jan
2010Jan
2011Jul
2010Jul
2011
130/8s
140/8s
150/8s

IPv4 Routed Address Span
/8 advertisements (by RIRs)
2010 2011Jan
2010Jan
2011Jul
2010Jul
2011
130/8s
140/8s
150/8s

IPv4 Routed AS Count
33,000
36,000
39,000
2010 2011Jan
2010Jan
2011Jul
2010Jul
2011

IPv4 2010 BGP Vital Statistics
Jan-11 Oct-11
Prefix Count 341,000 379,000+14%
Roots 168,000185,000 +13% More Specifics 173,000 192,000
+15%Address Span 140/8s 148/8s
+ 7%AS Count 36,40039,000 +10% Transit 5,000 5,400 + 9% Stub 31,40033,600 + 10%

IPv4 in 2011
• Overall Internet growth in terms of BGP is at a rate of some ~12% p.a.– This is much the same as 2009 and 2010.
• Table growth has slowed since 20 April 2011, following APINC’s IPv4 address run out
• Address span growing more slowly than the table size (address consumption pressures evident?)

IPv6 BGP Prefix Count
2,000
4,000
6,000
Jan2010
Jan2011
Jul2010
Jul2011

IPv6 Routed Address Span
Jan2010
Jan2011
Jul2010
Jul2011
2,000,000/32
10,000,000/32
16,000,000/32

IPv6 Routed Address SpanAdvertising a /8!
Advertising 2400::/12
2,000,000/32
10,000,000/32
16,000,000/32
Jan2010
Jan2011
Jul2010
Jul2011

IPv6 Routed AS Count
Jan2010
Jan2011
Jul2010
Jul2011
2,000
3,000
4,000

IPv6 Routed AS Count
World IPv6 Day
Jan2010
Jan2011
Jul2010
Jul2011
2,000
3,000
4,000

IPv6 2011 BGP Vital Statistics
Jan-10 Jan-11 Jul-11 p.a. rate
Prefix Count 2,458 4,100 6,889+ 117%
Roots 1,965 3,1785,090 + 103%
More Specifics 494 922 1,799+ 163%
Address Span (/32s) 48,559 53,415 56,561 + 10%AS Count 1,839 2,966
4,424 + 84% Transit 348 556
808 + 78% Stub 1,437 2,343
3,549 + 88%

IPv6 in 2010 - 2011
• Overall IPv6 Internet growth in terms of BGP is 80% - 120 % p.a.– 2009 growth rate was ~ 50%.
(Looking at the AS count, if these relative growth rates persist then the IPv6 network would span the same network domain as IPv4 in 5 years time -- mid/late 2016)

BGP Size Projections
• Generate a projection of the IPv4 routing table using a quadratic (O(2) polynomial) over the historic data– For IPv4 this is a time of extreme uncertainty• Registry IPv4 address run out• Uncertainty over the impacts of any after-market in
IPv4 on the routing table
which makes this projection even more speculative than normal!

IPv4 Table Size
2004 2008100,000
300,000
400,000
2006 2010 2012
200,000

Daily Growth Rates
2004 20082006 2010 2012-50
100
200
0 GFC Mk1
IANA Exhaustion

Table Growth Model
875 year2 - 3484972 year + 3466642049
2004 2008100,000
300,000
400,000
2006 2010 2012
200,000

IPv4 Table Projection
2004100,000
500,000
2008 2012 2016
300,000

Up and to the Right
• Most Internet curves (except the adoption of IPv6) are “up and to the right”
• But what makes this curve painful?
Moore’s Law!


Moore’s Law
BGP Table Size Prediction
IPv4 BGP Table size and Moore’s Law

IPv4 BGP Table Size predictions
Jan 2011 347,000 entries 2012* 385,000 entries 2013* 426,000 entries 2014* 468,000 entries 2015* 512,000 entries 2016* 557,000 entries
* These numbers are dubious due to uncertainties introduced by IPv4 address exhaustion pressures.

IPv6 Table Size
2007
2,000
6,000
2008 2009 2011
4,000
2010

Daily Growth Rates
2007
0
6,000
2008 2009 2011
4,000
20102007
0
8
2008 2009 2011
4
2010
12
14

Table Growth Model
1701 year2 - 6840215 year + 6874237091
2007
2,000
6,000
2008 2009 2011
4,000
2010

IPv6 Table Projection
2007
20,000
60,000
2009 2011 2015
40,000
2013

IPv6 BGP Table Size predictions
Jan 2011 4,000 entries 2012 10,000 entries 2013 18,000 entries 2014 30,000 entries 2015 46,000 entries 2016 65,000 entries

IPv6 Projections and Moore’s Law
Moore’s Law
BGP Table Size Predictions

BGP Table Size Predictions
Jan 2011 347,0004 + 4,0006 entries 2012 385,0004 + 10,0006 entries 2013* 426,0004 + 18,0006 entries 2014* 468,0004 + 30,0006 entries 2015* 512,0004 + 46,0006 entries
2016* 557,0004 + 65,0006 entries
* These numbers are dubious due to IPv4 address exhaustion pressures. It is possible that the number will be larger than the values predicted by this model.

Is This a Problem?

Is This a Problem?
• What is the anticipated end of service life of your core routers?
• What’s the price/performance curve for forwarding engine ASICS?
• What’s a sustainable growth factor in FIB size that will allow for continued improvement in unit costs of routing?
• What is a reasonable margin of uncertainty in these projections?

Does Size REALLY matter?
Is it the size of the RIB or the level of dynamic update and routing stability that is the concern here?
So lets look at update trends in BGP…

Daily Announce and Withdrawal Rates

Updates – Extended Data Set
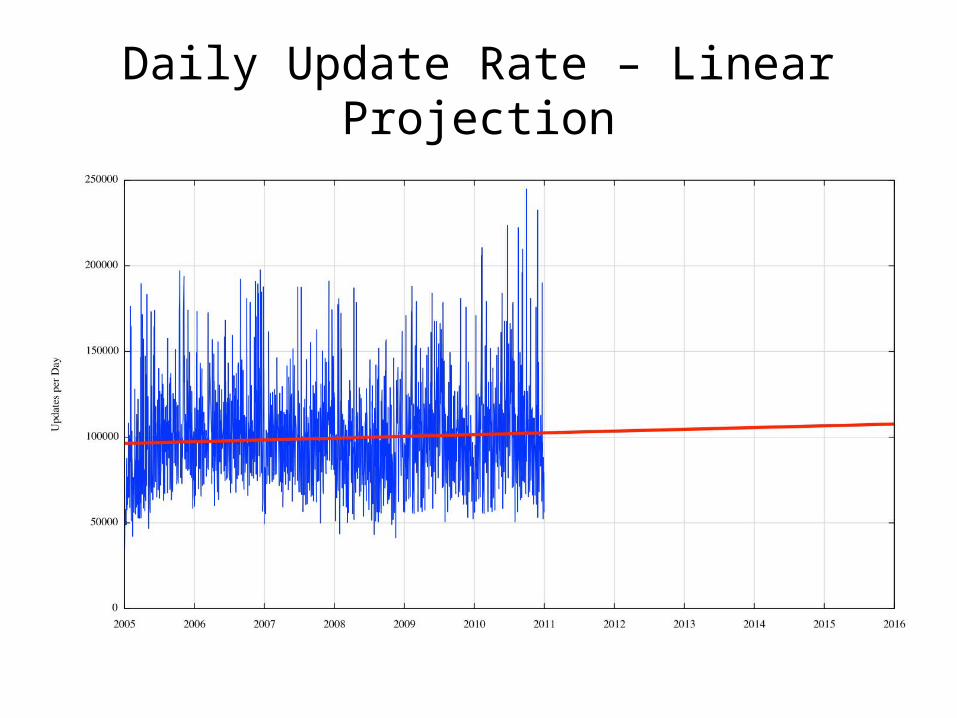
Daily Update Rate – Linear Projection

Withdrawals – Extended Data Set

Daily Withdrawal Rate – Linear Projection

Is this just me? Or is this visible everywhere?
• So I looked at all the peers of RIS and Route Views

Daily Update rate for RIS peers – 2004 to 2011

Daily Update rate for Route Views peers – 2004 to 2011

Is this just me? Or is this visible everywhere?
• It’s not me• It’s everywhere– The long term growth rate of the dynamic activity
of eBGP is far lower than the growth rate of the default-free routing table.

Why is the world so flat?
• An intuitive model of BGP updated would see instability as being related to the number of entries and the density of interconnectivity– This is obviously not the model we see here– So why is this particular part of the Internet’s BGP
behaviour so anomalous?

BGP Updates
• There are two components to BGP update activity:1. Convergence updates as BGP searches for a new
stable “solution” 2. The update relating to the “primary” event
• In an ever expanding network both BGP update components should be rising– But the total number of updates is not rising
• So what is going on?

Convergence
• BGP is a distance vector protocol• This implies that BGP may send a number of
updates in a tight “cluster” before converging to the “best” path
• This is clearly evident in withdrawals and convergence to (longer) secondary paths

For ExampleWithdrawal at source at 08:00:00 03-Apr of 84.205.77.0/24 at MSK-IX, as observed at AS 2.0
Announced AS Path: <4777 2497 9002 12654>
Received update sequence:
08:02:22 03-Apr + <4777 2516 3549 3327 12976 20483 31323 12654>08:02:51 03-Apr + <4777 2497 3549 3327 12976 20483 39792 8359 12654>08:03:52 03-Apr + <4777 2516 3549 3327 12976 20483 39792 6939 16150 8359 12654>08:04:28 03-Apr + <4777 2516 1239 3549 3327 12976 20483 39792 6939 16150 8359 12654>08:04:52 03-Apr - <4777 2516 1239 3549 3327 12976 20483 39792 6939 16150 8359 12654>
1 withdrawal at source generated a convergence sequence of 5 events, spanning 150 seconds

Convergence – Updates per Event

Convergence – Time per Event

Average Convergence Time for RIS peers – 2004 to 2011

Average Convergence Time for Route Views peers – 2004 to 2011
Convergence Behaviour
• BGP convergence times and average convergence update counts have been constant for the past 7 years
• This implies that a critical aspect of the network’s topology has also been held constant over the same period

AS Path is Constant
• The AS Path Length has been constant for many years, implying that the convergence effort has also remained constant
Per-peer averageAS Path Length asMeasured by Route-ViewsPeers, 1998 - 2011

BGP Updates
• There are two components to BGP update activity:1. Convergence updates as BGP searches for a new stable
“solution” • AS Path lengths have been steady as the Internet grows by
increasing the density of interconnection, not by increasing average AS Path length
2. The update relating to the “primary” event
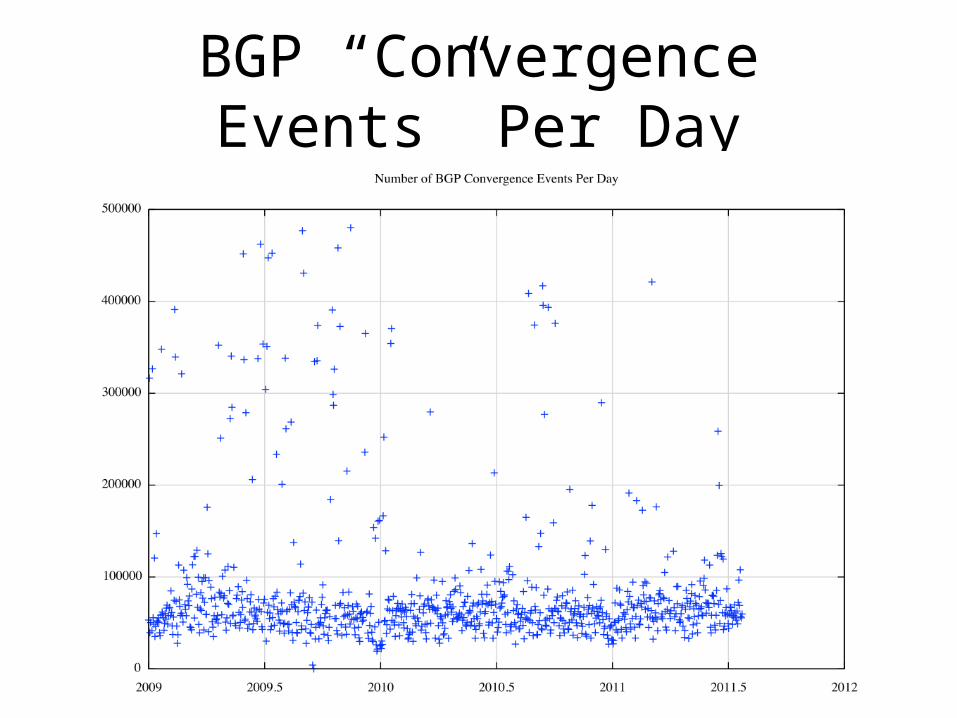
BGP “Convergence Events” Per Day

Daily Convergence Event Count for RIS peers – 2004 to 2011

Daily Convergence Event Count for Route Views peers – 2004 to 2011

Unstable Prefixes
• Are we seeing the same prefixes exhibiting instability multiple times per day, or different prefixes?
• What’s the profile of instability from the perspective of individual prefixes?

Unstable Prefixes
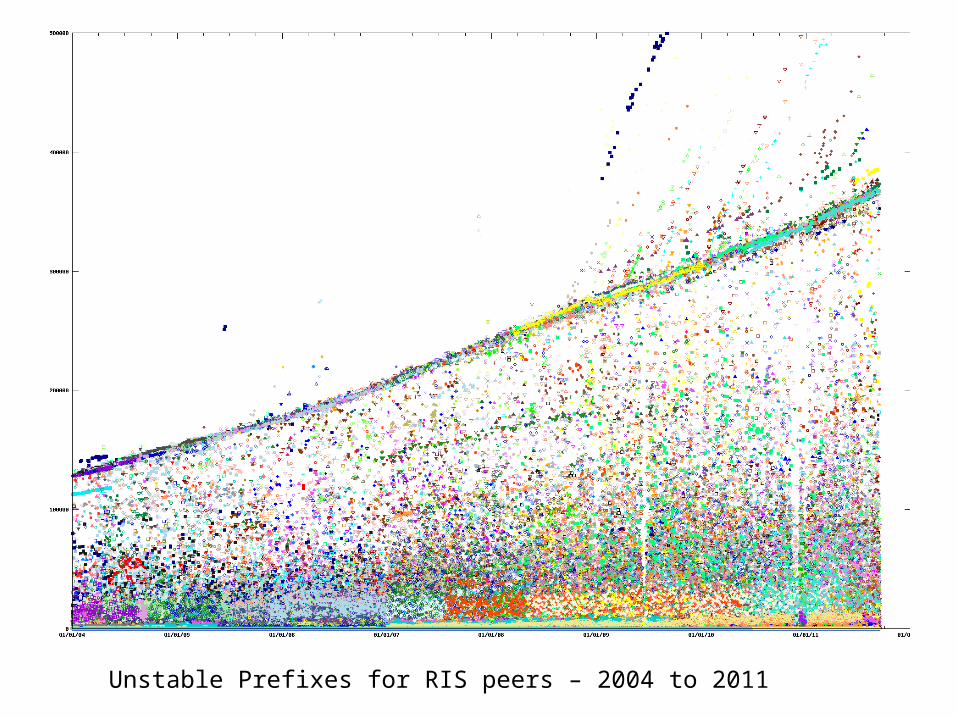
Unstable Prefixes for RIS peers – 2004 to 2011
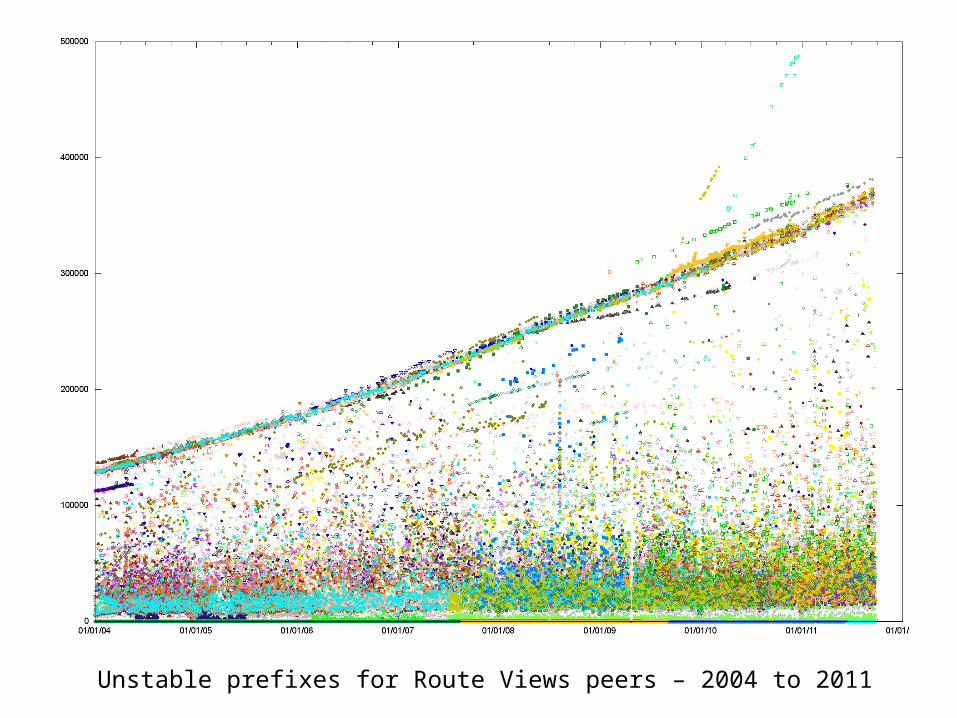
Unstable prefixes for Route Views peers – 2004 to 2011

Unstable Prefixes
• Over the past 4 years the number of unstable prefixes lies between 20,000 – 50,000 prefixes per day
• How “stable” is this set of unstable prefixes?– Are they the same prefixes?– Are they equally noisy?– What are the characteristics of this “noise”?

Prefix Instability Duration

Prefix Instability
• Prefix Instability is generally short lived– 90% of all prefixes are unstable for 2 days or less – 6 prefixes are persistently unstable – these are
beacon prefixes.• The distribution of the duration of prefix
instability at a coarse level (per day) appears to be a power law distribution (see Zipfs’Law)

Flat Worlds
• The average number of convergence events appears to be basically flat for the past couple of years– The growth rate appears to be far lower than the
growth rate of the routing table itself• The number of unstable prefixes per day is
also relatively long term constant– but the individual prefixes themselves are
unstable for 1 – 2 days on average

Why is BGP Flat?
• The convergence amplification factor is governed by the bounded diameter of the Internet
• But why hasn’t the number of unstable prefixes grown in line with the growth in the table size? What is limiting this behaviour of the routing system? Why 20-50K unstable prefixes per day? Why not 100K? Or 5K? What is bounding this observed behaviour?

[this slide intentionally left blank]

Thank You
Questions?