beyond value-based management, strategic alignment and
TRANSCRIPT

Beyond Value-Based Management, Strategic Alignment and Competitive Advantage
Knowing and understanding the effect of
strategic decisions on
forecasts and enterprise value - in real time -
is
the only way to stay ahead of your competition
Industry attractiveness : Why is the Telecom industry not the investment it once was?

Lessons learned from the Telecom Industry
What happens when reliance is placed on traditional managementconcepts that no longer seem to work?
The Telecom Industry: Is this a case study of decreasing performance,strategic uncertainty and diminishing shareholder value?

Telecom IndustryLagging global GDP growth, generating negative capital movements
1.42%Global GDP Compound
Annual Growth Rate2011-21
1.48% 1.07% -1.14% 1.24% -1.03%
Industry CAGR 2011-21
Revenue EBITDA EBIT Free CashFlow
Share Price
The Challenges:-❖ High CAPEX intensity❖ The “commoditisation trap”❖ Intense price rivalry❖ OTT disruption of traditional revenues
Key Insights:-❑ Positive CAGR in revenue, EBITDA and cash flow, albeit lagging global GDP ❑ Negative CAGR in both operating income and share price ❑ Perpetual capex investments without considering the impact on EBIT and ROCE❑ Wrong focus? - EBITDA or EBIT/(and PBT), market share or shareholder value?❑ Strategic uncertainty (in a red ocean industry): differentiation, cost leadership or focus?

Telecom IndustryHigh CAPEX intensity, stable EBITDA%, but declining operating andpre-tax profit margins
0%
10%
20%
30%
40%
50%
2011 2012 2013 2014 2015 2016 2017 2018 2019 2020
Stable EBITDA margins BUT declining operating and pre-tax margins
EBITDA% EBIT% PBT% Linear (EBITDA%) Linear (EBIT%) Linear (PBT%)
5%
15%
25%
35%
45%
2011 2012 2013 2014 2015 2016 2017 2018 2019 2020
Consistently high CAPEX intensity ratio, producing low to no revenue growth due to decreasing efficiencies in asset utilisation
CAPEX% ATR% Linear (CAPEX%) Linear (ATR%)

Telecom IndustryThe ever-increasing debt trap, with diminishing returns on capital employed
0%
20%
40%
60%
80%
100%
120%
140%
160%
2011 2012 2013 2014 2015 2016 2017 2018 2019 2020
Continuously increasing debt to fund capex, weakening the debt to equity ratio. Growing depreciation/amortisation and financing costs are the main causes of decreasing pre-tax profit margins.
7%
9%
11%
13%
15%
17%
2011 2012 2013 2014 2015 2016 2017 2018 2019 2020
Declining operating margins with a perpetually growing debt base results inevitably in diminishing returns on capital employed.

Telecom IndustryMarket related causes of the declining trends
Commoditisation trap
• 93% of telecom markets are already commoditised/or on the edge of it.
• Little to no product differentiability is available anymore.
• Attempts to differentiate are only adding to costs.
• Pricing has become the dominant competitive tool.
Intense price rivalry
• Fierce price wars are forcing down prices.
• Due to low elasticity of demand, tariff discounting may increase traffic volumes, but not revenue - thus the volume effect is greater than the price effect.
• Lower prices, existing cost structures & investment levels, are driving down margins and returns on capital employed.
Over the top (OTT) applications
• OTT services are cannibalising traditional revenue streams, in particular voice services.
• According to a 2017 McKinsey Report, voice over IP calls may eventually replace voice revenue.
• Revenue from international incoming interconnection services, has been mostly wiped out.
.
Sources:(1) PwC (2018) Strategy& (pwc.commmoditization in wireless telecoms(2) Economist Intelligence Unit (2017) Throttled: Telecoms in 2018 (eiu.com)(3) McKinsey (2017) Overwhelming OTT: Telcos’ growth strategy in a digital world | McKinsey(4) Highly commoditised (inferior) products in a highly competitive market, will have a low to unit price elasticity of demand
Read up on microeconomic price theory or see Price Elasticity of Demand and Total Revenue - Course Hero

Strategy CAPEX Investment Finance
▪ Strategic uncertainty in extremely competitive markets:
Differentiation, cost leadership or focus?
▪ Flawed pricing models focusing on competition, sales &
market share, with little (or no) consideration to full cost
and investment recovery.
▪ Uncertainty on how to deal with the market share and/or
profitability (shareholder value) dichotomy.
▪ Porter’s Five Forces: A strategy designed to focus on the
strongest force only, is fatally flawed.
▪ Does current strategy and business model consider the
impact of ESG on enterprise risk and therefore value?
▪ Judging by the finance & CAPEX investment issues,
finance appears not to be a strategic business partner.
▪ Strategic alignment, value-based management &
competitive advantage: reality or perception?
▪ Perpetual CAPEX investments without understanding the
full impact on:-
➢ Operating margin:
o Strategic asset management;
o Sweating assets;
o Asset capacity redeployment;
o Estimate management and
o Asset life cycle costing.
➢ Value creation,
➢ Returns on investment,
➢ Impact on capital structure,
➢ Borrowing cost, and particularly
➢ Enterprise value.
▪ Continuously increasing CAPEX does not necessarily result
in a sustainable competitive advantage.
▪ Silo-ed planning, analysis & performance management.
▪ Still focussing on the wrong metrics, i.e., EBITDA%.
▪ Can current capital structures be considered sustainable,
particularly in a highly competitive low/no growth
telecom industry?
▪ IFRS/statutory compliance-oriented planning, analytics &
reporting.
▪ Traditional spreadsheet-based FP&A still widely used.
▪ Current business planning cycles are not keeping up with
rapid change & volatility – resulting in slow time to
market and delays in taking corrective actions.
▪ Single dimension P&L formats for a multi-dimensional
reality - consisting of revenue streams, product units,
value segments, S&D channels, do NOT support optimal
decision-making.
▪ Impact of business decisions on enterprise value not
being considered: just an oversight, or a fatal flaw?
Telecom IndustryWhen business (or management) as usual no longer seems to be able to successfully address the following challenges: -
Reactive - Why not proactive ?
Telecom IndustryA new mindset is needed
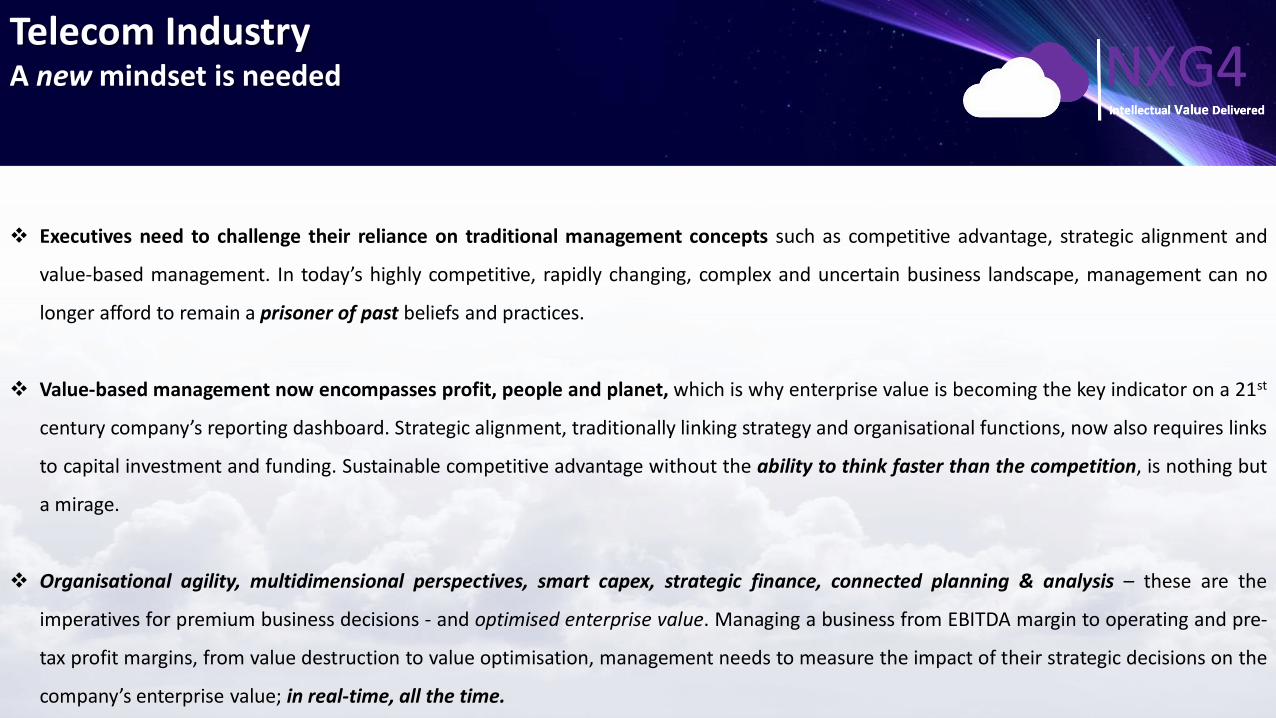
❖ Executives need to challenge their reliance on traditional management concepts such as competitive advantage, strategic alignment and
value-based management. In today’s highly competitive, rapidly changing, complex and uncertain business landscape, management can no
longer afford to remain a prisoner of past beliefs and practices.
❖ Value-based management now encompasses profit, people and planet, which is why enterprise value is becoming the key indicator on a 21st
century company’s reporting dashboard. Strategic alignment, traditionally linking strategy and organisational functions, now also requires links
to capital investment and funding. Sustainable competitive advantage without the ability to think faster than the competition, is nothing but
a mirage.
❖ Organisational agility, multidimensional perspectives, smart capex, strategic finance, connected planning & analysis – these are the
imperatives for premium business decisions - and optimised enterprise value. Managing a business from EBITDA margin to operating and pre-
tax profit margins, from value destruction to value optimisation, management needs to measure the impact of their strategic decisions on the
company’s enterprise value; in real-time, all the time.

The new mindset in action:
From managing EBITDA to
Operating and Pre-tax Profit Margins
Use your IFRS compliant Fixed Asset Register (FAR) to manage your CAPEX, fixed assets and finance costs to optimise operating
and pre-tax profit margins.
Is FAR compliance with IFRS for the auditors only?
Few realise the common sense and practical wisdom embedded in IFRS to provide invaluable information for optimised decision-making.
Why not utilise your IFRS compliant FAR to optimise your operating and pre-tax profit margins?

The Telecom case study shows that capital intensive businesses generally do not manage CAPEX and debt well
By measuring CAPEX costing accurately, you significantly improve the following:
• Asset componentisation, useful life and residual value adjustments will result in more accurate depreciation costs.
• Accurate asset impairment will reflect the costs in the period of occurrence rather than when the asset is disposed of.
• Future CAPEX should be funded from profits and not by debt funding only, as this is not sustainable long term.
7,00%
9,00%
11,00%
13,00%
15,00%
17,00%
2011 2012 2013 2014 2015 2016 2017 2018 2019 2020
Declining operating margins with a perpetually growing debt base results inevitably in diminishing returns on capital employed.

Detailed and accurate CAPEX investment costing, inclusive of finance costs, should be used in CAPEX planning to determine the effect on budgets and forecasts - and eventually enterprise value.
How to resolve this problem ?
Understand the effect of CAPEX investment on :
• Product and finance costing on pricing models;
• Gross profit and gross profit margins based on the pricing models broken down to a single product / service and
• Strategic asset management (e.g., asset capacity management)
This enables an understanding of the cost of capex investments and the full impact on:-
• Borrowing levels;
• Operating margin;
• Returns on CAPEX and fixed assets;
• Return on capital employed, and ultimately
• Enterprise value.

Top-down & bottom-up management &
alignment
Strategic Finance(tactical to strategic)
Top-down target setting for
revenue, costs and profit
Bottom-up revenue, costs and
profit
Planned financial and operational
outcomes
Enterprise value
Sales & Marketing
Marketing management
Sales management
Channels, segments, revenue and operational management
Assets
Asset investment management
Unit Cost of Consumption Management
EBIT asset management
Adopting a multidimensional, dynamic approach - by connecting revenue, OPEX, CAPEX, financing and enterprise value
BetterFaster
Smarter

The traditional approach to corporate business and financial planning does not empower critical questions
Revenue 10 000
Variable costs 3 000
Gross income 7 000
OPEX 4 110
EBITDA 2 890
Depreciation 1 198
Operating income 1 692
Financing cost 839
Profit before tax 853
In a fast-changing, highly competitive and complex business landscape increased detail is mission critical to a multidimensional approach
Total A B C
Revenue 10 000 5 000 4 000 1 000
Variable costs 3 000 1 200 1 000 800
Gross income 7 000 3 800 3 000 200
OPEX 4 110 1 600 2 500 10
EBITDA 2 890 2 200 500 190
Depreciation 1 198
Operating income 1 692
Financing cost 839
Profit before tax 853
or

Increased detail is mission critical1 matrix, 4 perspectives, 16 permutations - multiple insights
by Revenue Streams
Total Voice Data ICX Total High Medium Low Total EBU CSP Resellers Total 2G 3G 4G
Revenue 10,000 5,000 4,000 1,000 10,000 7,500 1,500 1,000 10,000 6,500 1,500 2,000 10,000 3,000 3,500 3,500
Variable costs 3,000 1,200 1,000 800 3,000 1,900 500 600 3,000 1,700 500 800 3,000 900 1,050 1,050
Gross Profit 7,000 3,800 3,000 200 7,000 5,600 1,000 400 7,000 4,800 1,000 1,200 7,000 2,100 2,450 2,450
OPEX 4,110 1,600 2,500 10 4,110 2,800 800 510 4,110 1,200 510 2,400 4,110 1,100 1,200 1,810
EBITDA 2,890 2,200 500 190 2,890 2,800 200 -110 2,890 3,600 490 -1,200 2,890 1,000 1,250 640
Depreciation 1,198 600 560 38 1,198 500 398 300 1,198 523 275 400 1,198 300 400 498
Operating income 1,692 1,600 -60 152 1,692 2,300 -198 -410 1,692 3,077 215 -1,600 1,692 700 850 142
Financing cost 839 420 392 27 839 350 279 210 839 366 193 280 839 210 280 349
Profit before tax 853 1,180 -452 125 853 1,950 -477 -620 853 2,711 23 -1,880 853 490 570 -207
CAPEX investment 11,980 6,000 5,600 380 11,980 5,000 3,980 3,000 11,980 5,230 2,750 4,000 11,980 3,000 4,000 4,980
Debt funding 11,980 6,000 5,600 380 11,980 5,000 3,980 3,000 11,980 5,230 2,750 4,000 11,980 3,000 4,000 4,980
Ratios% Contribution by Segment 100% 50% 40% 10% 100% 75% 15% 10% 100% 65% 15% 20% 100% 30% 35% 35%
GP% 70% 76% 75% 20% 70% 75% 67% 40% 70% 74% 67% 60% 70% 70% 70% 70%
EBITDA% 29% 44% 13% 19% 29% 37% 13% -11% 29% 55% 33% -60% 29% 33% 36% 18%
Operating margin 17% 32% -2% 15% 17% 31% -13% -41% 17% 47% 14% -80% 17% 23% 24% 4%
CAPEX allocation 100% 50% 47% 3% 100% 42% 33% 25% 100% 44% 23% 33% 100% 25% 33% 42%
Return on CAPEX investment 14% 27% -1% 40% 14% 46% -5% -14% 14% 59% 8% -40% 14% 23% 21% 3%
Notes:
1) Numbers for i l lustrative purposes only 2)Costs,CAPEX,debt allocation based on various industry related drivers and metrics. 3) Calculations will be based on data avaliable from ERP,OSS/BSS and BI platforms. 4)CAPEX investment annual depreciation rates assumed.
5) Infrastructure economic l ifespan and loan terms assumed the same. 6) CAPEX assumed to be funded by external debt. See slide #5 in this regard.
by Customer Value Segment
Profitability & return on CAPEX investment by S&D Channel by Technology Employed
* Purely illustrative for this discussion
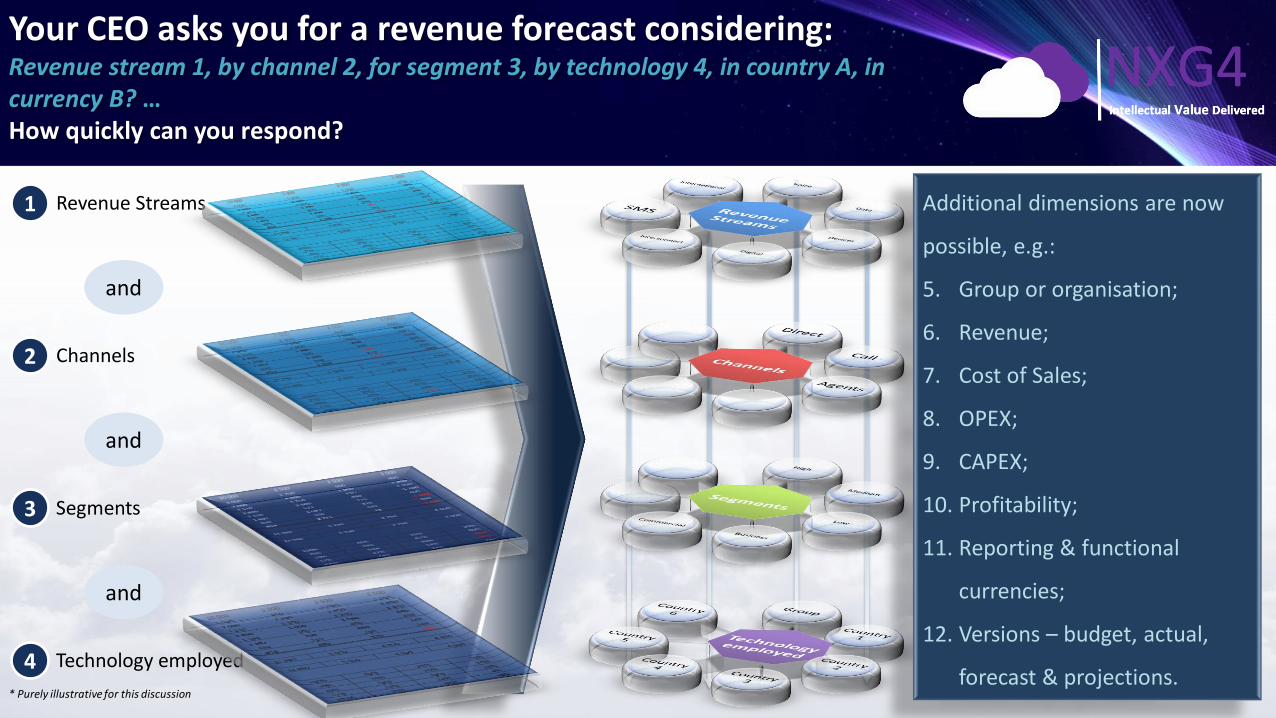
Your CEO asks you for a revenue forecast considering:Revenue stream 1, by channel 2, for segment 3, by technology 4, in country A, in currency B? …How quickly can you respond?
Revenue Streams1
Channels2
Segments3
Technology employed 4
Additional dimensions are now
possible, e.g.:
5. Group or organisation;
6. Revenue;
7. Cost of Sales;
8. OPEX;
9. CAPEX;
10. Profitability;
11. Reporting & functional
currencies;
12. Versions – budget, actual,
forecast & projections.
and
and
and

Imagine…Combining multiple perspectives, and new insights, to manage your business better, faster and smarter
Then, it is possible to:
• Determine the effect at the planning stage from EBITDA to operating and pre-tax profit margins, focussing on the
following:
o Borrowing levels;
o Returns on CAPEX and fixed assets;
o Return on capital employed and
o Enterprise value.
• Base investment decisions on multiple insights.
• Manage assets strategically.
• Invest in areas with greatest return.
• Calculate total CAPEX and financing cost before making investment decisions.
• Scale down or close areas/technologies/ customer segments with poor or negative return.
• Etc…
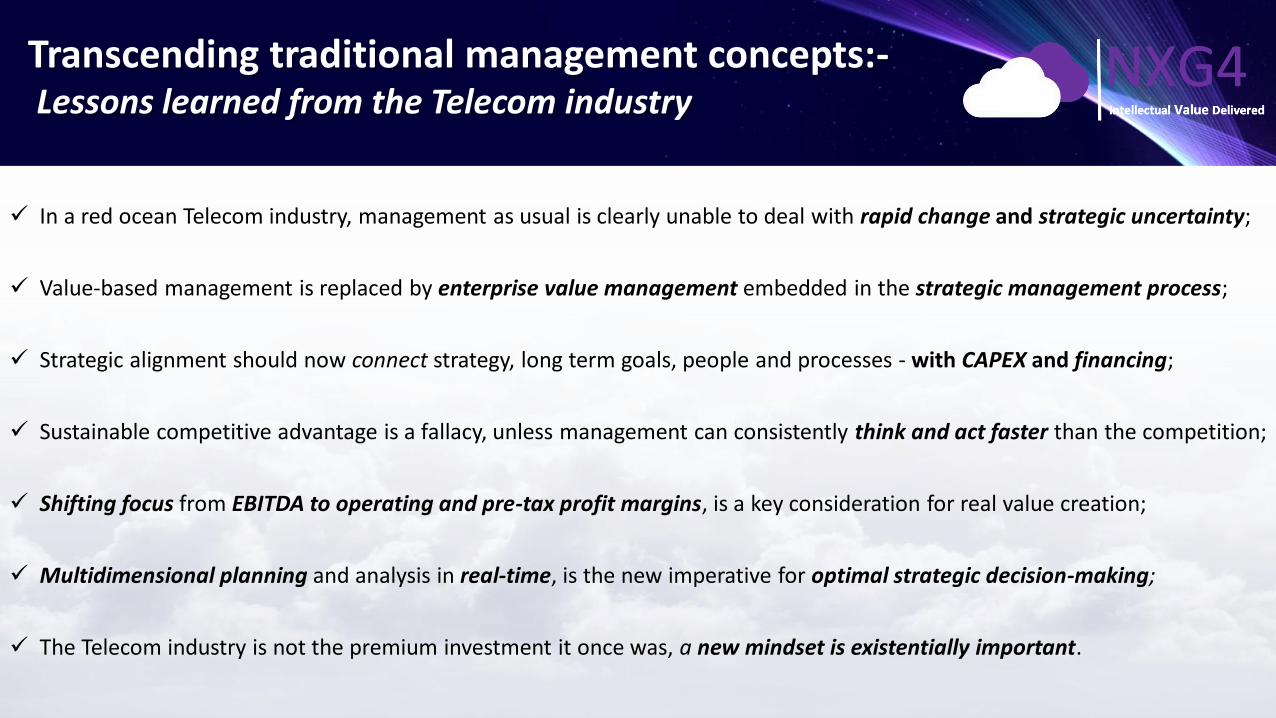
Transcending traditional management concepts:-Lessons learned from the Telecom industry
✓ In a red ocean Telecom industry, management as usual is clearly unable to deal with rapid change and strategic uncertainty;
✓ Value-based management is replaced by enterprise value management embedded in the strategic management process;
✓ Strategic alignment should now connect strategy, long term goals, people and processes - with CAPEX and financing;
✓ Sustainable competitive advantage is a fallacy, unless management can consistently think and act faster than the competition;
✓ Shifting focus from EBITDA to operating and pre-tax profit margins, is a key consideration for real value creation;
✓ Multidimensional planning and analysis in real-time, is the new imperative for optimal strategic decision-making;
✓ The Telecom industry is not the premium investment it once was, a new mindset is existentially important.

Thank you!
Questions & Answers
Presenters’ contact details :
Claude Jarrard Marius van Wyk [email protected] [email protected]: 082 550 7029 Mobile: 083 212 7586