beyond fossil fuels - indiaenvironmentportal · game-changing initiatives to accelerate the energy...
TRANSCRIPT
© 2019 International Institute for Sustainable Development | IISD.org/gsi
Ivetta GerasimchukKjell KühneJoachim RothAnna GeddesYuliia OharenkoRichard BridleVibhuti Garg
November 2019
Beyond Fossil Fuels:Fiscal transition in BRICS
REPORT

IISD.org/gsi ii
Beyond Fossil Fuels: Fiscal transition in BRICS
Head Office
111 Lombard Avenue, Suite 325 Winnipeg, Manitoba Canada R3B 0T4 Tel: +1 (204) 958-7700 Website: www.iisd.orgTwitter: @IISD_news
© 2019 The International Institute for Sustainable Development
Published by the International Institute for Sustainable Development.
International Institute for Sustainable Development
The International Institute for Sustainable Development (IISD) is an independent think tank championing sustainable solutions to 21st–century problems. Our mission is to promote human development and environmental sustainability. We do this through research, analysis and knowledge products that support sound policy-making. Our big-picture view allows us to address the root causes of some of the greatest challenges facing our planet today: ecological destruction, social exclusion, unfair laws and economic rules, a changing climate. IISD’s staff of over 120 people, plus over 50 associates and 100 consultants, come from across the globe and from many disciplines. Our work affects lives in nearly 100 countries. Part scientist, part strategist—IISD delivers the knowledge to act.
IISD is registered as a charitable organization in Canada and has 501(c)(3) status in the United States. IISD receives core operating support from the Province of Manitoba. The Institute receives project funding from numerous governments inside and outside Canada, United Nations agencies, foundations, the private sector and individuals.
About GSI
The IISD Global Subsidies Initiative (GSI) supports international processes, national governments and civil society organizations to align subsidies with sustainable development. GSI does this by promoting transparency on the nature and size of subsidies; evaluating the economic, social and environmental impacts of subsidies; and, where necessary, advising on how inefficient and wasteful subsidies can best be reformed. GSI is headquartered in Geneva, Switzerland, and works with partners located around the world. Its principal funders have included the governments of Denmark, Finland, New Zealand, Norway, Sweden, Switzerland and the United Kingdom, as well as the KR Foundation.
Leave it in the Ground Initiative (LINGO)
LINGO works towards a world with 100% clean energy, focusing on game-changing initiatives to accelerate the energy transition. It also supports those who fight for oil, gas and coal to remain underground.
Beyond Fossil Fuels: Fiscal transition in BRICS
November 2019
Written by Ivetta Gerasimchuk, Kjell Kühne, Joachim Roth, Anna Geddes, Yuliia Oharenko, Richard Bridle and Vibhuti Garg
Global Subsidies Initiative
International Environment House 2, 9 chemin de Balexert 1219 Châtelaine Geneva, Switzerland Canada R3B 0T4 Tel: +1 (204) 958-7700 Website: www.iisd.org/gsiTwitter: @globalsubsidies
Leave it in the Ground Initiative
Augustusweg 59 01445 Radebeul, Germany Tel: +49-351-8628615 Website: leave-it-in-the-ground.org
IISD.org/gsi iii
Beyond Fossil Fuels: Fiscal transition in BRICS
Acknowledgements
Authors: Ivetta Gerasimchuk, Kjell Kühne, Joachim Roth, Anna Geddes, Yuliia Oharenko, Richard Bridle, Vibhuti Garg.
Reviewers: The authors would like to thank the following reviewers whose comments have immensely helped to improve earlier versions of individual country briefs and the BRICS cross-country analysis: Christopher Beaton (IISD), Tim Buckley (Institute for Energy Economics and Financial Analysis), Han Chen (Natural Resources Defense Council), Assia Elgouacem (Organisation for Economic Co-operation and Development), David Fridley (Lawrence Berkeley National Laboratory), Ipek Gencsu (Overseas Development Institute), Michael Lazarus (Stockholm Environment Institute), Alvin Lin (Natural Resources Defense Council), Hongyou Lu (Lawrence Berkeley National Laboratory), Igor Makarov (Higher School of Economics), Cyril Prinsloo (The South African Institute of International Affairs), Roshelle Ramfol (University of South Africa), Marcel Salikhov (Institute for Energy and Finance), Alexandre Salem Szklo (Energy Planning Program, COPPE, Federal University of Rio de Janeiro), Roberto Schaeffer (Energy Planning Program, COPPE, Federal University of Rio de Janeiro), Louise Scholtz (WWF South Africa), Konstantin Simonov (National Energy Security Fund), Bronwen Tucker (Overseas Development Institute), Cleo Verkuijl (Stockholm Environment Institute), Lisa Viscidi (The Inter-American Dialogue), Balasubramanian Viswanathan (IISD), Xu Wen (China Fiscal Science Academy), Peter Wooders (IISD), Michael Yulkin (Environmental Investment Center).
Disclaimer: The views expressed within this policy brief lie with the authors. Any mistakes are our own.
Support: This work has been funded through support to the Global Subsidies Initiative of IISD via grants from Norway and Sweden.
Contact: For further comment, please contact Ivetta Gerasimchuk, Lead, Sustainable Energy Supplies, IISD ([email protected]).
IISD.org/gsi iv
Beyond Fossil Fuels: Fiscal transition in BRICS
Executive Summary
The group of countries known as BRICS—Brazil, Russia, India, China and South Africa—is both influencing and being influenced by global energy markets and the clean energy transition. For BRICS, like all other countries, the clean energy transition is being driven by both external and domestic factors: international climate commitments, plummeting costs of renewables and domestic needs to improve energy efficiency as well as to reduce local air pollution. Large energy importers such as China and India also benefit from domestic generation from renewable sources as a way of decreasing their dependence on imports and improving energy security and trade balance. China and India already invest more in solar and wind than in fossil fuel-based power (International Energy Agency [IEA], 2019a).
This report focuses, for the first time, on a specific aspect of the clean energy transition for BRICS: its consequences for government budgets. Based on the BRICS governments’ own reporting, we estimate that, in 2017, taxes and other revenues from both fossil fuel production and consumption amounted to the following shares of general government revenue:1 23.6 per cent (8 per cent of GDP) in Russia, 17.8 per cent (3.7 per cent of GDP) in India, 6.8 per cent (2 per cent of GDP) in Brazil, 6.8 per cent (1.9 per cent of GDP) in South Africa and 4.2 per cent (1.2 per cent of GDP) in China (see Figures 6 and 7 in Section 3 and individual country briefs for more detail).
Some of these revenues fluctuate with fossil fuel prices on the world markets. Therefore, the clean energy transition and the ensuing decrease in demand for fossil fuels over the longer term can affect the revenue base for the BRICS governments in two ways: through a drop in fossil fuel prices and through the shrinkage of absolute amounts of fossil fuel production and consumption.
Meanwhile, the revenue base is already being eroded by subsidies to both fossil fuel production and consumption. According to the estimates of the Organisation for Economic Co-operation and Development (OECD), these subsidies amounted to the following shares of general government revenue: 2.4 per cent (0.7 per cent of GDP) in South Africa, 2 per cent (0.4 per cent of GDP) in India, 1.5 per cent (0.5 per cent of GDP) in Russia, 1.1 per cent (0.3 per cent of GDP) in Brazil, and 0.5 per cent (0.1 per cent of GDP) in China (OECD, 2019). In addition, the IEA identifies even larger subsidies to fossil fuel consumption in BRICS (IEA, 2019c) (see Figures 6 and 7 in Section 3). Coal, oil and gas producers may pressure governments for subsidies even more as they seek to remain competitive in light of the clean energy transition.
Economic models suggest that the clean energy transition has an overall neutral or beneficial effect on the global economy, but it also leads to losses for fossil fuel-producing segments of the economy (UN Environment 2011; Mercure et al., 2018). These risks are especially noteworthy for fuel exporters among the BRICS countries: Russia for all fossil fuels, India for refined oil products, Brazil for crude oil and South Africa for coal. China and India also have pockets of dependence on fossil fuel production in coal-extracting regions.
There are several areas that governments need to focus on with respect to adapting their fiscal and socioeconomic policies to the clean energy transition. The first one is economic and fiscal diversification.
1 General government budget is a combined budget of all levels of government: central; subnational (regional) for the federations of Brazil, India and Russia; local; and off-budget social security and other government funds.
IISD.org/gsi v
Beyond Fossil Fuels: Fiscal transition in BRICS
A more diversified economy also has a more diversified fiscal base where different sectors and entities can become significant taxpayers (OECD & International Transport Forum, 2019). Even large reductions in fossil fuel revenues can be sustained by more diversified economies, as illustrated by Indonesia’s experience over the past two decades (Braithwaite & Gerasimchuk, 2019).
The second area of focus is the use of revenues from fossil fuels at present. In the short-to-medium term, the likely pathway for the energy transition is for governments to start removing fossil fuel subsidies and increasing taxes on fossil fuels and carbon, in order to price fossil fuels in line with their harmful impacts. All countries, including BRICS, are recommended to ensure that such revenues are not seen as a long-term strategy for broadening the tax base. Rather, revenues from fossil fuels, including from emerging carbon pricing, should be used as a temporary bridge to help fund the costs of transition. This corresponds to the concept of a fossil fuel to clean energy subsidy swap (i.e., redirecting government support from fossil fuels to clean energy) (Bridle, Sharma, Mostafa, & Geddes, 2019). For example, India implemented a coal cess that, until 2017, was intended to support renewable energy research and development.
Another aspect deserving special attention is the cost of transition, including the cost of protecting vulnerable groups from its negative impacts. All BRICS countries have significant income inequality and, despite their economic growth, still have large swaths of populations that are vulnerable to energy price increases. For vulnerable consumers, as well as for communities and workers dependent on fossil fuels, it is necessary to implement targeted support programs (cash transfers, social safety nets, reskilling). For instance, China’s 13th Five-Year Plan (2016–2020) includes the CNY 100 billion (USD 14.5 billion) Industrial Special Fund for employment restructuring in coal areas (Bridle, Kitson, Duan, Sanchez, & Merrill, 2017).
Finally, BRICS governments need to concentrate on reducing their very significant exposure to fossil fuels through public finance and state-owned enterprises (SOEs). The clean energy transition can lead to the stranding of fossil fuel assets, including those owned or financed by governments (Mercure et al., 2018). Governments can harness public finance institutions and SOEs as vehicles of diversification for the clean energy transition. There are some signs of such diversification already emerging through the BRICS’s New Development Bank, Coal India Limited and the merger of the Shenhua and Guodian SOEs in China (see individual country briefs for details).
The earlier and better the fiscal and broader social and economic aspects of the clean energy transition are anticipated, the less disruptive and more constructive the change will be for government budgets as well as for economies in general.

IISD.org/gsi vi
Beyond Fossil Fuels: Fiscal transition in BRICS
Table of Contents
1.0 Introduction ................................................................................................................................................................................... 1
2.0 Clean Energy Transition Versus Fossil Fuel Path Dependence ...........................................................................4
2.1 Drivers of a Clean Energy Transition ..........................................................................................................................................4
2.1.1 Climate Action Commitments ..........................................................................................................................................4
2.1.2 The Increased Competitiveness of Clean Energy ............................................................................................4
2.1.3 Energy Efficiency Benefits ...................................................................................................................................................4
2.1.4 Health and Clean Air Benefits ......................................................................................................................................... 5
2.1.5 Additional Benefits for Fossil Fuel Importers ...................................................................................................... 5
2.2 The Prominence of Fossil Fuels in BRICS Countries’ Economies ..........................................................................6
2.2.1 Fossil Fuel Endowment, Production and Use ........................................................................................................6
2.2.2 The Role of the Fossil Fuel Sector in the Economy ............................................................................................ 7
2.3 Impacts on the Economy and Fossil Fuel Asset Stranding ........................................................................................8
2.3.1 The Difference Between Fossil Fuel Exporters and Importers ................................................................9
2.3.2 Fossil Fuel Asset Stranding ................................................................................................................................................9
3.0 Fossil Fuels and Government Budgets in BRICS ......................................................................................................11
3.1 Key Findings: Prominence of fossil fuel revenues in BRICS country budgets ..........................................11
3.2 Fossil Fuel Production Revenues ....................................................................................................................................................13
3.3 Fossil Fuel Consumption Revenues ............................................................................................................................................13
3.4 Subsidies to Fossil Fuel Production and Consumption ............................................................................................. 14
4.0 Aligning BRICS Policies With the Clean Energy Transition .............................................................................. 16
4.1 Economic and Fiscal Diversification ......................................................................................................................................... 16
4.2 The Use of Revenues From Fossil Fuels .................................................................................................................................. 16
4.3 Just Transitions ........................................................................................................................................................................................... 17
4.4 The Role of Public Finance ................................................................................................................................................................ 17
4.5 The Role of SOEs ....................................................................................................................................................................................... 18
5.0 Conclusions and Recommendations ..............................................................................................................................19
References ...........................................................................................................................................................................................21
Annex A. Fossil Fuel Prominence in BRICS .........................................................................................................................25
Annex B. Methodology and Scope ............................................................................................................................................ 27

IISD.org/gsi vii
Beyond Fossil Fuels: Fiscal transition in BRICS
Acronyms and Abbreviations
CNY Chinese yuan
GDP Gross Domestic Product
GHG greenhouse gas
GSI Global Subsidies Initiative
GST goods and services tax
IEA International Energy Agency
IISD International Institute for Sustainable Development
IMF International Monetary Fund
OECD Organisation for Economic Co-operation and Development
PPP purchasing power parity
SDG Sustainable Development Goal
SOE state-owned enterprises
TPES total primary energy supply
UNFCCC United National Framework Convention on Climate Change
VAT value-added tax
USD United States dollar

IISD.org/gsi 1
Beyond Fossil Fuels: Fiscal transition in BRICS
1.0 Introduction
A clean energy transition2 is an increasingly important element of sustainable economic development, competitiveness, improving standards of living and preventing the dangerous effects of climate change (UN Environment, 2011; World Economic Forum, 2019). This transition affects all countries, including through changes in costs of different energy technologies, changes in demand and supply on global markets, and domestic policies (see Section 2).
Thematically, this report unpacks one—largely unexplored—aspect of the clean energy transition: its consequences for government budgets. At present, fossil fuel-exporting countries often cover a substantial portion of their budgets with taxes, royalties and other fees on oil, gas and coal production. Both energy exporting and importing countries also receive revenues from value-added tax (VAT) or goods and services tax (GST), excise and other fees on fossil fuel consumption. The “heavily vested interest in continuing these flows of income” from fossil fuels is known as “carbon entanglement” (Gurría, 2013). However, as the Paris Agreement on climate change sets a goal of keeping global warming “well below 2°C” while striving to limit it to 1.5°C, the world needs to switch from fossil fuels to clean energy and achieve deep emission reductions in all sectors of the economy (Intergovernmental Panel on Climate Change, 2018). The clean energy transition is being accelerated as the costs of clean energy technologies plummet and many countries seek to boost domestic energy production from locally available renewables, reduce imports and decrease air pollution. This trend means that, over the medium-to-long term, fossil fuels’ role as a tax base will shrink accordingly and countries will need to replace revenues from them in their budgets (Organisation for Economic Co-operation and Development [OECD] & International Transport Forum, 2019).
Geographically, the report focuses on Brazil, Russia, India, China and South Africa (BRICS)3 as a group of countries that increasingly influence the future of the global clean energy transition due to their growing role in the economy and energy markets (see Box 1).
For the first time, this report brings together official data on the BRICS governments’ revenues and subsidies associated with fossil fuels and offers initial recommendations on aligning BRICS fiscal policies with a clean energy transition. The analysis builds on over a decade of work by the Global Subsidies Initiative (GSI) of the International Institute for Sustainable Development (IISD). Working alongside other expert organizations4 on fossil fuel subsidy inventories and reforms, the GSI has seen improvements in transparency over government support to fossil fuel production and consumption. But there is much less transparency on the other side of the same fiscal coin, namely government revenues from fossil fuel production and consumption—a gap that the report seeks to address.
2 In this report, the term “clean energy” includes renewable energy and energy-efficiency measures but excludes nuclear; palm oil; carbon capture, utilization and storage; and any fossil fuels such as gas, “clean coal” or “ethical oil.” The term “clean energy transition” describes the process of switching energy systems from high-carbon fossil fuels to clean energy.3 This report continues the Beyond Fossil Fuels series on fiscal transition in large emerging economies that GSI started in 2019 with these two reports: Beyond Fossil Fuels: Indonesia’s Fiscal Transition (in English and Bahasa Indonesia) and Beyond Fossil Fuels: Mexico’s Fiscal Transition (in Spanish, co-published with LINGO).4 For example, the OECD, International Energy Agency (IEA), World Bank, International Monetary Fund (IMF), UN Environment, Overseas Development Institute and Oil Change International.

IISD.org/gsi 2
Beyond Fossil Fuels: Fiscal transition in BRICS
In this report, the cross-country analysis consists of three sections. Section 2 briefly discusses external and domestic drivers of the clean energy transition and what they mean for BRICS as exporters and importers of different fuels. Section 3 gives an overview of the five countries’ revenues and subsidies associated with fossil fuels. Section 4 discusses the avenues of BRICS’s fiscal transition beyond fossil fuels. The conclusion presents policy recommendations. The cross-country analysis also includes Annex A with data tables and Annex B with a brief methodology and scope description.
In addition to the cross-country analysis, the report includes country briefs on Brazil, Russia, India, China and South Africa that highlight the role of fossil fuels in respective economies. These briefs present, for the first time, the aggregated data on both revenues and subsidies related to fossil fuels in each country. The country briefs are separate documents that can be found on the report’s homepage.
Box 1. BRICS as a group
BRICS is an informal group of five large emerging economies: Brazil, Russia, India, China and South Africa. Beginning in 2009, the heads of Brazil, Russia, India and China started meeting at annual summits, and in 2011 South Africa joined the group. In 2014, the BRICS countries established a new multilateral financial institution, the New Development Bank.
The BRICS countries are quite different from each other, but what unites them is the goal to have a more equitable and “greater voice and representation in international financial institutions” and in global economic governance (BRIC, 2009). This goal reflects the growing share of BRICS in the global economy, as the combined BRICS economies are forecasted to become bigger than those of the G7 countries by around 2035 (O’Neill, 2017).
From 2013 to 2018, among BRICS, South Africa had the highest average population growth rate (1.5 per cent), followed by India (1.1 per cent), Brazil (0.8 per cent), China (0.5 per cent) and Russia (-0.2 per cent). Over the same period, India exhibited the highest average real GDP growth rate among BRICS (7.3 per cent), followed by China (6.9 per cent), South Africa (1.1 per cent), Russia (0.1 per cent) and Brazil (-1.3 per cent) (United Nations Conference on Trade and Development, n.d.).
In proportion to their economic and population growth, the BRICS share of carbon dioxide emissions from fossil fuel combustion in the global total increased from 27 per cent in 1990 to 42 per cent in 2018 (BP, 2019a). For comparison, over the same period, the share of G7 countries (Canada, France, Germany, Italy, Japan, the United States and the United Kingdom) in global carbon dioxide emissions from fossil fuel combustion shrank from 42 per cent to 25 per cent. Figure 1 illustrates these trends.

IISD.org/gsi 3
Beyond Fossil Fuels: Fiscal transition in BRICS
Figure 1. Carbon dioxide emissions from fossil fuel combustion in BRICS from 1990 to 2018 (GtCO2)
Source: Authors’ presentation based on BP, 2019b.
0
2
4
6
8
10
12
14
16
199
0
199
1
1992
199
3
1994
1995
1996
199
7
1998
199
9
200
0
200
1
200
2
200
3
200
4
200
5
200
6
200
7
200
8
200
9
2010
2011
2012
2013
2014
2015
2016
2017
2018
Car
bon
diox
ide
(in
gig
aton
nes)
BRICS total
G7 total
China
India
Russia
Brazil
South Africa

IISD.org/gsi 4
Beyond Fossil Fuels: Fiscal transition in BRICS
2.0 Clean Energy Transition Versus Fossil Fuel Path Dependence
This section briefly reviews drivers of the clean energy transition, discusses the prominence of fossil fuels in BRICS economies and outlines the possible impacts of the clean energy transition on development in BRICS countries, including asset stranding.
2.1 Drivers of a Clean Energy Transition
There are several groups of factors driving the clean energy transition. All BRICS countries are integrated into global markets of energy technologies and fuels. As a result, within each group of clean energy transition drivers, there are both external and internal factors affecting BRICS.
2.1.1 Climate Action Commitments
There is a global agreement on the need for urgent climate action and reducing greenhouse gas (GHG) emissions under the United National Framework Convention on Climate Change (UNFCCC). The most recent Paris Agreement within the UNFCCC process sets a goal of keeping global warming “well below 2°C” while striving to limit it to 1.5°C (United Nations Treaty Collection, 2019). To deliver on these commitments, the world requires a rapid and significant transformation of all parts of the global economy, including deep emissions reductions in the energy sector (Intergovernmental Panel on Climate Change, 2018). All BRICS countries are parties to the UNFCCC and the Paris Agreement, and their GHG emission targets are set in their Nationally Determined Contributions (see individual country briefs for details). To achieve their GHG targets, developed and emerging countries implement different regulations that often directly seek to disincentivize high-carbon energy and promote clean alternatives.
2.1.2 The Increased Competitiveness of Clean Energy
The costs of clean energy technologies have dropped dramatically in recent years and are now below those for fossil fuels in many countries (Lazard, 2017). Some emerging markets have been epicentres of this cost decrease. In fact, the world’s lowest costs in solar energy are in China and India (International Renewable Energy Agency, 2019).
The drop in clean energy costs is swaying investments in new infrastructure, thus determining future demand for fossil fuels and other energy resources. In 2018, China was the world’s largest investor in the new solar and wind power capacity (at over USD 60 billion domestically), with investment in these and other clean energy technologies by far outweighing its domestic investment in fossil fuel and nuclear generation. In India, total clean power investment also topped that in fossil fuel-based power (International Energy Agency [IEA], 2019a). In other sectors, including transport and cooking, clean energy options are similarly becoming increasingly competitive. In particular, electric car sales continue to soar, with nearly 70 per cent sales growth from 2017 to 2018, with China being the largest market (IEA, 2019a).
IISD.org/gsi 5
Beyond Fossil Fuels: Fiscal transition in BRICS
2.1.3 Energy Efficiency Benefits
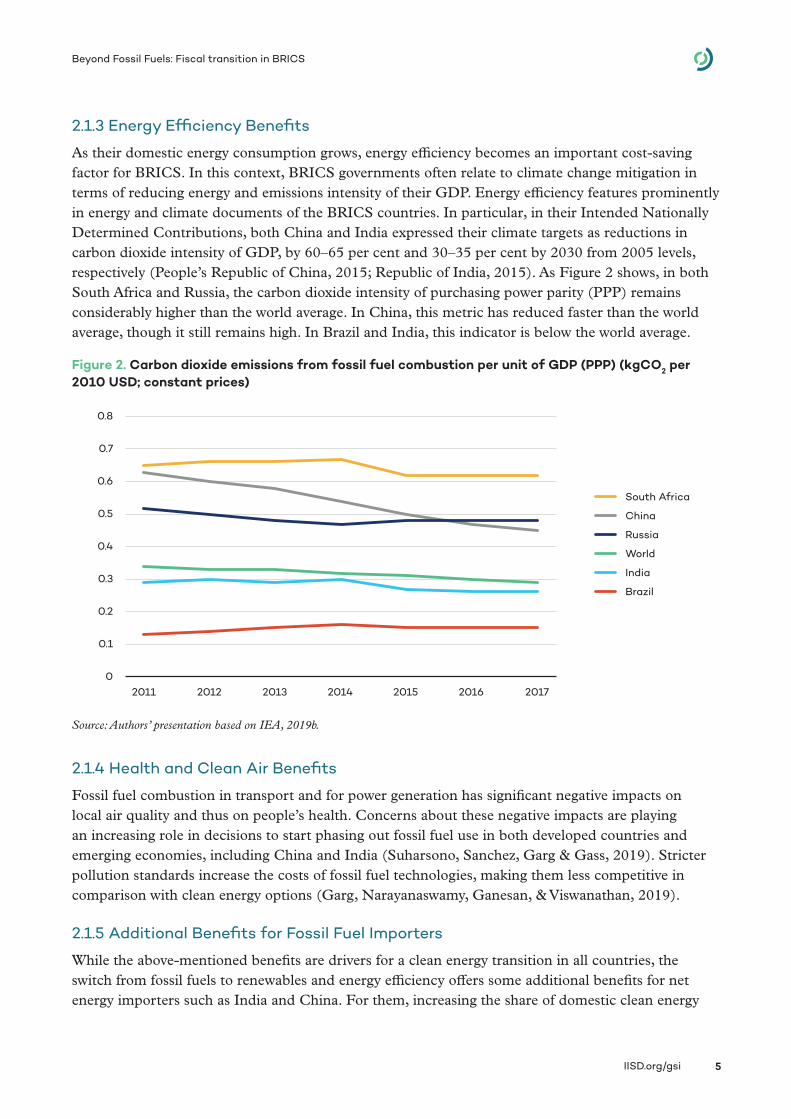
As their domestic energy consumption grows, energy efficiency becomes an important cost-saving factor for BRICS. In this context, BRICS governments often relate to climate change mitigation in terms of reducing energy and emissions intensity of their GDP. Energy efficiency features prominently in energy and climate documents of the BRICS countries. In particular, in their Intended Nationally Determined Contributions, both China and India expressed their climate targets as reductions in carbon dioxide intensity of GDP, by 60–65 per cent and 30–35 per cent by 2030 from 2005 levels, respectively (People’s Republic of China, 2015; Republic of India, 2015). As Figure 2 shows, in both South Africa and Russia, the carbon dioxide intensity of purchasing power parity (PPP) remains considerably higher than the world average. In China, this metric has reduced faster than the world average, though it still remains high. In Brazil and India, this indicator is below the world average.
Figure 2. Carbon dioxide emissions from fossil fuel combustion per unit of GDP (PPP) (kgCO2 per 2010 USD; constant prices)
Source: Authors’ presentation based on IEA, 2019b.
2.1.4 Health and Clean Air Benefits
Fossil fuel combustion in transport and for power generation has significant negative impacts on local air quality and thus on people’s health. Concerns about these negative impacts are playing an increasing role in decisions to start phasing out fossil fuel use in both developed countries and emerging economies, including China and India (Suharsono, Sanchez, Garg & Gass, 2019). Stricter pollution standards increase the costs of fossil fuel technologies, making them less competitive in comparison with clean energy options (Garg, Narayanaswamy, Ganesan, & Viswanathan, 2019).
2.1.5 Additional Benefits for Fossil Fuel Importers
While the above-mentioned benefits are drivers for a clean energy transition in all countries, the switch from fossil fuels to renewables and energy efficiency offers some additional benefits for net energy importers such as India and China. For them, increasing the share of domestic clean energy
0
0.1
0.2
0.3
0.4
0.5
0.6
0.7
0.8
2011 2012 2013 2014 2015 2016 2017
South Africa
China
Russia
World
India
Brazil
IISD.org/gsi 6
Beyond Fossil Fuels: Fiscal transition in BRICS
production in the energy mix reduces their reliance on imports and thus improves energy security and trade balances. Reducing dependence on fossil fuel imports also decreases vulnerability to fluctuations in fossil fuel prices on the world market.
2.2 The Prominence of Fossil Fuels in BRICS Countries’ Economies
While the clean energy transition is already affecting BRICS, fossil fuels remain the dominant energy source in all five countries. As incumbent energy technologies, fossil fuel production and consumption determine what is known as “path dependence,” or “the tendency for past decisions and events to self-reinforce, thereby diminishing and possibly excluding the prospects for alternatives to emerge” (Intergovernmental Panel on Climate Change, 2014; Seto et al., 2016).
2.2.1 Fossil Fuel Endowment, Production and Use
In light of path dependence, a clean energy transition may be particularly difficult for countries with large existing fossil fuel production and consumption. BRICS countries vary significantly in their fossil fuel reserve endowment (see Figure 3 and Table A1 in Annex A), which to a large extent determines the levels of domestic production (see Table A2 in Annex A for details). With the exception of Russia, all BRICS countries have growing populations whose demand for energy increases as millions strive to lift themselves out of poverty and achieve better standards of living.
The interplay of domestic production and consumption of fossil fuels makes some BRICS net exporters or importers of different fossil fuels (see Table A3 in Annex A). China is the world’s top producer of coal and a significant producer of oil and gas, but to cover its domestic consumption needs, it also scores as the world’s largest importer of fossil fuels. Russia is one of the world’s leading producers and exporters of all types of fossil fuels. India produces coal and some oil and gas domestically, but it is also a net importer of coal, oil and gas. However, India processes oil in excess of its domestic needs and re-exports it in the form of refined products. South Africa is an importer of oil and gas and exporter of coal, while Brazil is an importer of coal and gas and exporter of oil (see individual country briefs for further details).
Fossil fuels dominate total primary energy supply (TPES)5 in the BRICS countries, though Brazil uses a significant share of biofuels in transport and India uses a large share of biomass in household use. Thus the share of fossil fuels in TPES varies from 55 per cent in Brazil to 75 per cent in India and roughly 90 per cent in China, Russia and South Africa, whereas the world’s average is around 80 per cent (see Table A2 in Annex A for details).
5 TPES is the total amount of primary energy that a country has at its disposal. It includes domestic energy production from natural resources and imports and excludes energy exports as well as international aviation and marine bunkers.

IISD.org/gsi 7
Beyond Fossil Fuels: Fiscal transition in BRICS
Figure 3. Proved reserves of fossil fuels by country, (GtCO2e, 2018)
Source: Authors’ calculation based on BP, 2019a, 2019b.
2.2.2 The Role of the Fossil Fuel Sector in the Economy
A common internationally recognized metric of fossil fuels’ contribution to the economy6 is the estimate of resource rents as a percentage of GDP. This indicator is calculated as a difference between the value of oil, gas and coal production at world prices and total costs of production (see Figure 4). According to this estimate, in 2017, fossil fuel rents as a percentage of GDP were the highest in Russia (9.4 per cent), followed by South Africa (2.1 per cent), Brazil and India (1.3 per cent in each) and China (0.9 percent).
However, in BRICS countries, fossil fuels consumed domestically are often sold at below-international-market rates and the full rents from them can only be reaped from exports. In practice, the share of fossil fuel rents in GDP: a) is proportional to the size of coal and, in particular, oil and gas exports and b) fluctuates with fossil fuel prices on the world market.
The direct contribution of fossil fuels to GDP goes beyond resource rents from extraction. It also includes value added through refining and processing, combustion for electricity and heat generation. National statistics do not provide a consistent picture of these broader economic activities directly related to fossil fuels, but they can be modelled and assumed to be as much as double fossil fuel rents.7 Furthermore, fossil fuels also have indirect contributions to GDP through demand generated by their extraction and processing for equipment, materials, transport and other services.
6 BRICS countries report information about the fossil fuel sector’s role in the economy using different methodologies and scope. For example, often data are aggregated for all extractive industries or all utilities. See individual country briefs for details.7 For example, as the BRICS country with the highest contribution of fossil fuels to GDP, Russia’s draft national Energy Strategy to 2035 reports its share of the fuel and energy complex at 25–26 per cent of the GDP (Ministry of Energy of the Russian Federation, 2017). However, this number has also been contested—see more in the Russia country brief.
0
50
100
150
200
250
300
350
400
450
Russia China India SouthAfrica
Brazil
World’s annual CO2 emissions from energy sources in 2018
Coal
Gas
Oil

IISD.org/gsi 8
Beyond Fossil Fuels: Fiscal transition in BRICS
Figure 4. Fossil fuel rents as a percentage of GDP in BRICS in 2017
Source: Authors’ presentation based on World Bank, 2019.
Statistics on jobs in the fossil fuel sector also follow different reporting standards across the BRICS countries. Available data shows that coal extraction is more labour-intensive than oil and gas production (see country briefs for more detail). Expansion of fossil fuel extraction can compete with agriculture, fisheries and tourism for land and expose them to the risk of pollution, thus undermining employment opportunities in these sectors. Like in many other sectors, the number of jobs in fossil fuel extraction is also under threat from automation (Cosbey et al., 2016).
The higher the share of the fossil fuel sector in the economy, the more it is exposed to the so-called “resource curse,” a paradoxical situation in which countries and regions with an abundance of natural resources tend to have less economic growth and worse development outcomes than comparable jurisdictions with fewer natural resources (Lange, Wodon, & Carey, 2018). The resource curse occurs as a country or region begins to focus all of its production means on a single industry, such oil, gas and coal extraction and processing, and neglects investment in other major sectors. Among the BRICS economies, at the national level, the resource curse is believed to be afflicting only Russia due to the high contribution of fossil fuel extraction to its GDP (Inozemtsev, 2016). At the subnational level, the resource curse is sometimes also diagnosed in fossil fuel-extracting regions of the other BRICS countries, for example, the coal-mining Inner Mongolia, Shanxi and Shaanxi provinces in Western China and the oil-producing State of Rio de Janeiro in Brazil.
2.3 Impacts on the Economy and Fossil Fuel Asset Stranding
Economic modelling suggests that a clean energy transition has an overall neutral or beneficial effect on the global economy, but it creates winners and losers in certain sectors, both within the same countries and among them (Mercure et al., 2018; UN Environment, 2011). Estimates of these redistribution effects vary depending on the methodology and assumptions, but all point in the same direction. Figure 5 illustrates this idea using the results of a recent modelling exercise that indicates
Coal rents
Gas rents
Oil rents
0.0%
1.0%
2.0%
3.0%
4.0%
5.0%
6.0%
7.0%
8.0%
9.0%
10.0%
Russia SouthAfrica
World India Brazil China
Res
ourc
e re
nts
as %
of
GD
P, 2
017
IISD.org/gsi 9
Beyond Fossil Fuels: Fiscal transition in BRICS
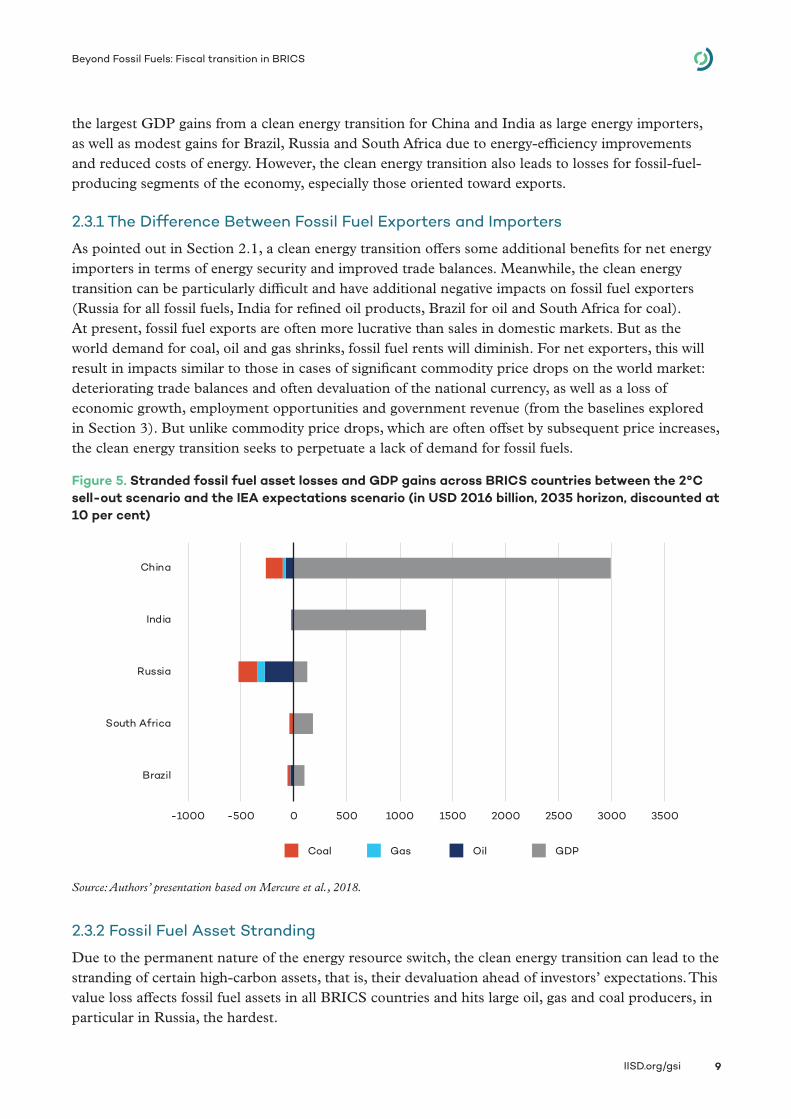
the largest GDP gains from a clean energy transition for China and India as large energy importers, as well as modest gains for Brazil, Russia and South Africa due to energy-efficiency improvements and reduced costs of energy. However, the clean energy transition also leads to losses for fossil-fuel-producing segments of the economy, especially those oriented toward exports.
2.3.1 The Difference Between Fossil Fuel Exporters and Importers
As pointed out in Section 2.1, a clean energy transition offers some additional benefits for net energy importers in terms of energy security and improved trade balances. Meanwhile, the clean energy transition can be particularly difficult and have additional negative impacts on fossil fuel exporters (Russia for all fossil fuels, India for refined oil products, Brazil for oil and South Africa for coal). At present, fossil fuel exports are often more lucrative than sales in domestic markets. But as the world demand for coal, oil and gas shrinks, fossil fuel rents will diminish. For net exporters, this will result in impacts similar to those in cases of significant commodity price drops on the world market: deteriorating trade balances and often devaluation of the national currency, as well as a loss of economic growth, employment opportunities and government revenue (from the baselines explored in Section 3). But unlike commodity price drops, which are often offset by subsequent price increases, the clean energy transition seeks to perpetuate a lack of demand for fossil fuels.
Figure 5. Stranded fossil fuel asset losses and GDP gains across BRICS countries between the 2°C sell-out scenario and the IEA expectations scenario (in USD 2016 billion, 2035 horizon, discounted at 10 per cent)
Source: Authors’ presentation based on Mercure et al., 2018.
2.3.2 Fossil Fuel Asset Stranding
Due to the permanent nature of the energy resource switch, the clean energy transition can lead to the stranding of certain high-carbon assets, that is, their devaluation ahead of investors’ expectations. This value loss affects fossil fuel assets in all BRICS countries and hits large oil, gas and coal producers, in particular in Russia, the hardest.
-1000 -500 0 500 1000 1500 2000 2500 3000 3500
Brazil
South Africa
Russia
India
China
Coal Gas Oil GDP

IISD.org/gsi 10
Beyond Fossil Fuels: Fiscal transition in BRICS
The asset stranding discussion often focuses on losses for private investors—but for BRICS, the majority value at risk is concentrated in the hands of governments as owners of state-owned fossil fuel companies and participants in fossil fuel production-sharing agreements and joint ventures. This brings up concerns of government-owned asset stranding in light of the clean energy transition. As the risk of fossil fuel asset stranding becomes more material, governments may find themselves pressed for more subsidies to bail out the affected companies, translating to fiscal stress and often broader financial system stress (Bridle, Kitson, Duan, Sanchez, & Merrill, 2017).
Key drivers of fossil fuel asset stranding include the improved cost competitiveness of renewables, pollution, climate and environmental regulations as well as the need to phase out government support to fossil fuels, without which they often cannot compete (Worrall, Whitley, Garg, Krishnaswamy, & Beaton, 2018). The risk of stranding can vary depending on assumptions made about global climate ambition and future world prices of fossil fuels, and have ripple effects on the financial and other sectors of the economy (Worrall et al., 2018).
Asset stranding is not just a hypothetical concern. In India, around 40 GW of coal-fired power plant capacity has been identified as “non-performing”8—this is about 21 per cent of India’s total installed capacity at the end of 2018 (Standing Committee on Energy, 2018). Of this 40 GW, 12 per cent is either wholly or partly government owned (Worrall et al., 2018).
8 The key drivers of “non-performance” of these coal power assets in India include the increased competitiveness of renewables, financial distress of distribution companies, new air pollution regulations increasing the costs of coal generation, water scarcity and coal supply bottlenecks (Worrall, Whitley, Garg, Krishnaswamy, & Beaton, 2018).
IISD.org/gsi 11
Beyond Fossil Fuels: Fiscal transition in BRICS
3.0 Fossil Fuels and Government Budgets in BRICS
BRICS governments receive revenue from fossil fuel production and consumption, but they also subsidize them. This section and the separate country briefs endeavour, for the first time, to collect and present the information on fossil-fuel-related revenues and subsidies of the BRICS governments based primarily on their own sources. Due to remaining data gaps, the estimates below should be treated as conservative, as explained in the methodology and scope in Annex B. Country briefs provide more details on the estimates, including a time series for the years 2012–2017 for each country.
3.1 Key Findings: Prominence of fossil fuel revenues in BRICS country budgets
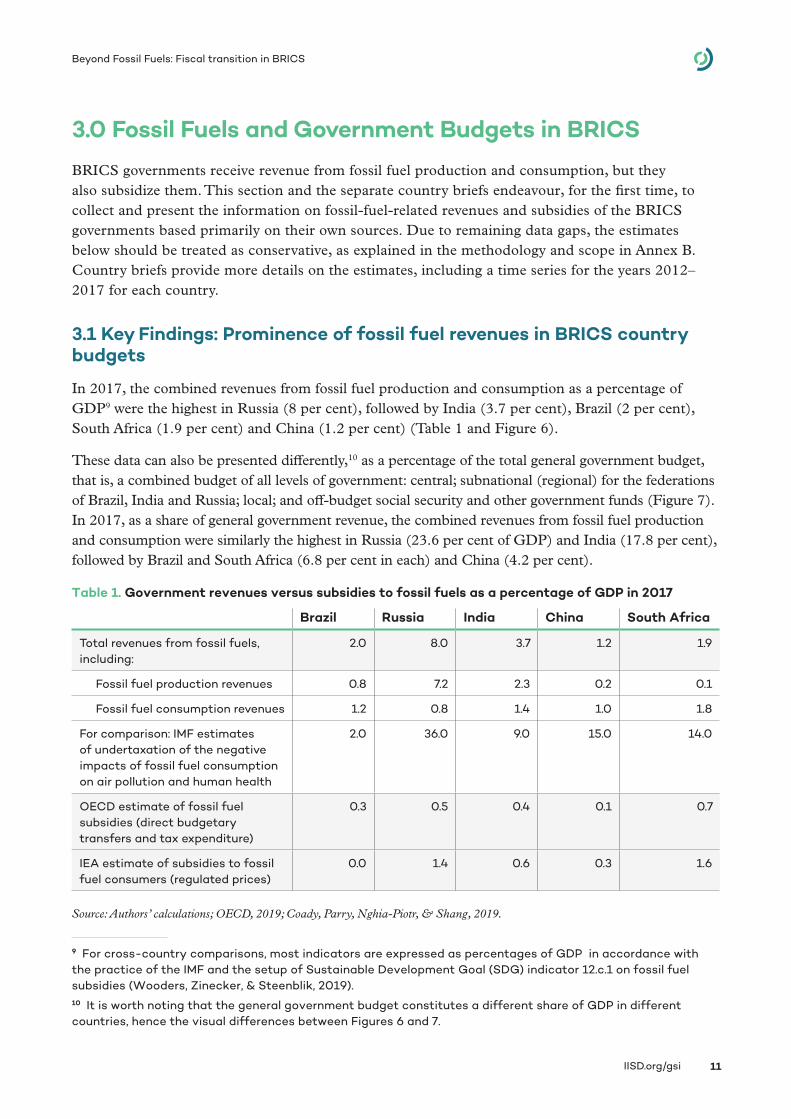
In 2017, the combined revenues from fossil fuel production and consumption as a percentage of GDP9 were the highest in Russia (8 per cent), followed by India (3.7 per cent), Brazil (2 per cent), South Africa (1.9 per cent) and China (1.2 per cent) (Table 1 and Figure 6).
These data can also be presented differently,10 as a percentage of the total general government budget, that is, a combined budget of all levels of government: central; subnational (regional) for the federations of Brazil, India and Russia; local; and off-budget social security and other government funds (Figure 7). In 2017, as a share of general government revenue, the combined revenues from fossil fuel production and consumption were similarly the highest in Russia (23.6 per cent of GDP) and India (17.8 per cent), followed by Brazil and South Africa (6.8 per cent in each) and China (4.2 per cent).
Table 1. Government revenues versus subsidies to fossil fuels as a percentage of GDP in 2017
Brazil Russia India China South Africa
Total revenues from fossil fuels, including:
2.0 8.0 3.7 1.2 1.9
Fossil fuel production revenues 0.8 7.2 2.3 0.2 0.1
Fossil fuel consumption revenues 1.2 0.8 1.4 1.0 1.8
For comparison: IMF estimates of undertaxation of the negative impacts of fossil fuel consumption on air pollution and human health
2.0 36.0 9.0 15.0 14.0
OECD estimate of fossil fuel subsidies (direct budgetary transfers and tax expenditure)
0.3 0.5 0.4 0.1 0.7
IEA estimate of subsidies to fossil fuel consumers (regulated prices)
0.0 1.4 0.6 0.3 1.6
Source: Authors’ calculations; OECD, 2019; Coady, Parry, Nghia-Piotr, & Shang, 2019.
9 For cross-country comparisons, most indicators are expressed as percentages of GDP in accordance with the practice of the IMF and the setup of Sustainable Development Goal (SDG) indicator 12.c.1 on fossil fuel subsidies (Wooders, Zinecker, & Steenblik, 2019).10 It is worth noting that the general government budget constitutes a different share of GDP in different countries, hence the visual differences between Figures 6 and 7.

IISD.org/gsi 12
Beyond Fossil Fuels: Fiscal transition in BRICS
Figure 6. Government revenues versus subsidies to fossil fuels as a percentage of GDP in 2017.
Source: Authors’ calculations; IEA, 2019c; OECD, 2019.
Figure 7. Government revenues versus subsidies to fossil fuels as a percentage of general government budgets in 2017.
Source: Authors’ calculations; IEA, 2019c; OECD, 2019.
0
1
2
3
4
5
6
7
8
Russia India Brazil South Africa China
Fossil fuel production revenues
OECD estimate of fossil fuel subsidies (production & consumption, fiscal)
Fossil fuel consumption revenues
IEA estimate of fossil fuel subsidies (consumption only, non-fiscal)
Fossil fuel production revenues
OECD estimate of fossil fuel subsidies (production & consumption, fiscal)
Fossil fuel consumption revenues
IEA estimate of fossil fuel subsidies (consumption only, non-fiscal)
0
5
10
15
20
25
Russia India Brazil South Africa China

IISD.org/gsi 13
Beyond Fossil Fuels: Fiscal transition in BRICS
3.2 Fossil Fuel Production Revenues
Fossil fuel production revenue comes to governments in the form of special taxes on extraction (royalties11), corporate income tax, personal income tax of fossil fuel sector employees, social security fund contributions, land and property taxes, government entitlements from production-sharing contracts, licensee fees and bonuses, dividends from government ownership in fossil fuel state-owned enterprises (SOEs), pollution and some other fees.
As the BRICS country with the most prominent fossil fuel role in its economy, Russia received 7.2 per cent of GDP or 23.6 of its general government revenue from fossil fuel production in 2017, largely from oil and gas.
In India, government revenues from fossil fuel production were 2.3 per cent of the GDP or just over 11.3 per cent of the general government revenue. The relatively high value of this indicator for India is explained by the fact that most of the production revenue comes from the oil and gas sector, which also re-exports some of its refined products.
In Brazil, China and South Africa, government revenues from fossil fuel production were much less prominent: under 1 per cent of the GDP and 3 per cent of the general government revenue.
These revenues fluctuate with prices for oil, gas and coal on the world market. Therefore, after the fall of fossil fuel commodity prices at the end of 2014, all BRICS governments, with the exception of India, saw a decrease in their revenues from fossil fuel production. The Indian phenomenon is explained by the fact that India increased the rates of certain taxes on fossil fuel production, including India’s carbon tax in the form of a coal cess (a type of charge).
3.3 Fossil Fuel Consumption Revenues
Fossil fuel consumption revenues to governments include VAT or GST, excise taxes or energy and fuel taxes, and taxes on pollution. In 2017, the contribution of these taxes was most prominent in South Africa and India. In South Africa, they amounted to almost 1.8 per cent of GDP or 6.4 per cent of general government revenue. In India, these taxes contributed to about 1.4 per cent of GDP or just over 6.5 per cent of general government revenue. In other BRICS economies, their contribution oscillates around 1 per cent of GDP. As VAT and GST are set as a proportion of the price of fossil fuels, revenues from them also fluctuate with commodity prices. In contrast, excise taxes are often set as fixed values and thus are less susceptible to price fluctuations.
Among BRICS countries, only China and South Africa implement carbon pricing linked to fossil fuel consumption (in India, the coal cess acts as a carbon price, but it is applied at the point of production; see the India country brief). It is thus far an insignificant generator of funds for the government. If applied at a higher level, carbon pricing can become a significant source of revenue for governments (Marten & van Dender, 2019). In this vein, the IMF estimates that fossil fuel consumption is
11 In the strict sense, royalties are not taxes, as they are fees for the use of government-owned resources. However, in practice, this line is often blurred and these charges are called “taxes” in official government documents. For example, in Russia, the term “royalties” is only used in production-sharing agreements, whereas the absolute majority of fossil extraction is subject to royalties in the form of the Mineral Resource Tax and Export Duty.
IISD.org/gsi 14
Beyond Fossil Fuels: Fiscal transition in BRICS
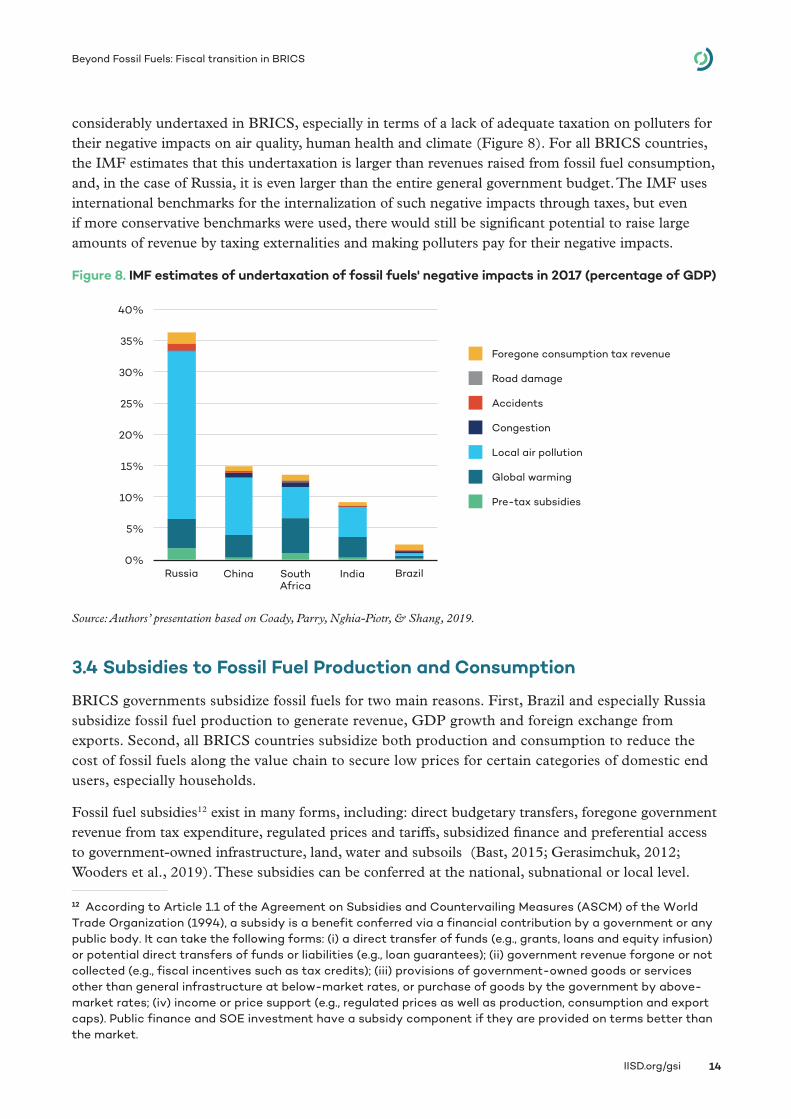
considerably undertaxed in BRICS, especially in terms of a lack of adequate taxation on polluters for their negative impacts on air quality, human health and climate (Figure 8). For all BRICS countries, the IMF estimates that this undertaxation is larger than revenues raised from fossil fuel consumption, and, in the case of Russia, it is even larger than the entire general government budget. The IMF uses international benchmarks for the internalization of such negative impacts through taxes, but even if more conservative benchmarks were used, there would still be significant potential to raise large amounts of revenue by taxing externalities and making polluters pay for their negative impacts.
Figure 8. IMF estimates of undertaxation of fossil fuels' negative impacts in 2017 (percentage of GDP)
Source: Authors’ presentation based on Coady, Parry, Nghia-Piotr, & Shang, 2019.
3.4 Subsidies to Fossil Fuel Production and Consumption
BRICS governments subsidize fossil fuels for two main reasons. First, Brazil and especially Russia subsidize fossil fuel production to generate revenue, GDP growth and foreign exchange from exports. Second, all BRICS countries subsidize both production and consumption to reduce the cost of fossil fuels along the value chain to secure low prices for certain categories of domestic end users, especially households.
Fossil fuel subsidies12 exist in many forms, including: direct budgetary transfers, foregone government revenue from tax expenditure, regulated prices and tariffs, subsidized finance and preferential access to government-owned infrastructure, land, water and subsoils (Bast, 2015; Gerasimchuk, 2012; Wooders et al., 2019). These subsidies can be conferred at the national, subnational or local level.
12 According to Article 1.1 of the Agreement on Subsidies and Countervailing Measures (ASCM) of the World Trade Organization (1994), a subsidy is a benefit conferred via a financial contribution by a government or any public body. It can take the following forms: (i) a direct transfer of funds (e.g., grants, loans and equity infusion) or potential direct transfers of funds or liabilities (e.g., loan guarantees); (ii) government revenue forgone or not collected (e.g., fiscal incentives such as tax credits); (iii) provisions of government-owned goods or services other than general infrastructure at below-market rates, or purchase of goods by the government by above-market rates; (iv) income or price support (e.g., regulated prices as well as production, consumption and export caps). Public finance and SOE investment have a subsidy component if they are provided on terms better than the market.
0%
5%
10%
15%
20%
25%
30%
35%
40%
Russia China SouthAfrica
India Brazil
Foregone consumption tax revenue
Road damage
Accidents
Congestion
Local air pollution
Global warming
Pre-tax subsidies

IISD.org/gsi 15
Beyond Fossil Fuels: Fiscal transition in BRICS
Meanwhile, only direct transfers of funds and tax revenue foregone affect government budgets directly. Therefore, for comparison of government revenues versus subsidies to fossil fuels in BRICS, it is useful to limit the scope to direct budgetary transfers and tax expenditures. The data for this analysis are drawn from the OECD (2019) and based on the BRICS governments’ own reporting. The OECD estimates can be viewed as a low-end estimate of budgetary transfers and tax expenditure to both producers and consumers of fossil fuels, since independent estimates identify even more subsidies in BRICS (Bast, 2015; Denjean et al., 2016; Gerasimchuk, 2012; Soman et al., 2018; Xue, Wang, Bridle, Attwood, & Gerasimchuk, 2015).
Among BRICS economies, the OECD combined estimate of budgetary transfers and tax expenditure was the highest for South Africa (under 0.7 per cent of GDP and 2.4 per cent of the general government budget) and the lowest for China (less than half a per cent of the general government budget).
Meanwhile, other types of subsidies, especially regulated prices for fossil fuel consumers, are also significant in BRICS. Even though their relationship with government finances is more complex and indirect, analysis of fossil fuel revenues and subsidies would be incomplete without these so-called “induced transfers” that involve regulations mandating fossil fuel companies to sell their products to certain categories of consumers at below-market prices (Wooders et al., 2019). The estimates on such “induced transfers” are provided by the IEA using the price-gap approach (IEA, 2019c). In 2017, the induced transfers to fossil fuel consumers were most considerable in South Africa, at 1.5 per cent of the GDP or 5.3 per cent of general government revenue (IEA, 2019c). Brazil was the only country where the IEA did not identify such transfers at all.
Even though fossil fuel subsidies are smaller than fossil fuel revenues, they considerably distort energy markets and skew the playing field in favour of fossil fuels, thereby impeding the clean energy transition. Fossil fuel consumption subsidies are also often untargeted and benefit rich consumers more than poor households, thus leading to more inequality (Gass & Echeverria, 2017; Zinecker et al., 2018).
Official government reporting on fossil fuel subsidies in BRICS countries remains highly insufficient. Improving the transparency of fossil fuel subsidies can help their reform and therefore creates value if undertaken by countries on their own. However, politically, it may be easier for some countries to review and reform fossil fuel subsidies as part of an international process. In particular, all BRICS countries, as members of the G20, committed to “phase out, over the medium term, inefficient fossil fuel subsidies that encourage wasteful consumption” back in 2009 (G20, 2009). In the followup on this commitment, China has undertaken a voluntary review of fossil fuel subsidies (jointly with the United States), while India volunteered for a peer review in 2019 (jointly with France) (Ministry of External Affairs, Government of India, 2019). BRICS, like other countries, can also report on fossil fuel subsidies under the World Trade Organization’s subsidy notifications and SDG indicator 12.c.1 (Wooders et al., 2019).

IISD.org/gsi 16
Beyond Fossil Fuels: Fiscal transition in BRICS
4.0 Aligning BRICS Policies With the Clean Energy Transition
This section discusses the policy areas where the BRICS governments will need to focus to address the implications of the clean energy transition (as outlined in Section 2) for their budgets (as explored in Section 3).
4.1 Economic and Fiscal Diversification
A more diversified economy also has a more diversified fiscal base, where different sectors and entities can become significant taxpayers (OECD & International Transport Forum, 2019). Even large reductions in fossil fuel revenues can be sustained by more diversified economies. For example, due to oil reserve depletion and a drop in oil prices, in just 15 years Indonesia’s government revenues from upstream oil and gas plummeted from 35 per cent of the total revenues in 2001 (7 per cent of GDP) to just 6 per cent in 2016 (less than 1 per cent of GDP). Meanwhile, Indonesia’s rate of GDP growth (at 3–4 per cent per year) and budget deficit (at 2–3 per cent) remained largely unchanged because other economic sectors were rapidly developing (Braithwaite & Gerasimchuk, 2019).
Economic and fiscal diversification is most important for the parts of BRICS countries’ economies that are most heavily dependent on fossil fuels as an energy and a revenue source, including Russia at the national level, and, at the regional level, Brazil’s oil-producing Rio de Janeiro and coal-mining regions in China, India and South Africa. Strategies for economic and fiscal diversification beyond fossil fuels include, first, the phase-out of subsidies to both fossil fuel production and consumption, and second, the reinvestment of fossil fuel revenues and savings from subsidy reform into productive sectors of the economy (see Section 4.2).
4.2 The Use of Revenues From Fossil Fuels
As estimated in Section 3, the BRICS governments receive varying but overall significant shares of revenue from fossil fuel production and consumption. In the absolute majority of cases, these revenues are recycled in general government budgets to cover different government expenditure items, from debt servicing to defence and social safety nets.
For resource-rich economies, there is a big body of literature recommending the use of fossil fuel revenues to foster better institutions; support productive sectors of the economy, including sustainable infrastructure, healthcare and education; and encourage economic diversification beyond fossil fuels (Hendrix, 2017; Lange et al., 2018; Manley, Cust, & Cecchinato, 2017; Schlösser, Schultze, Ivleva, Wolters, & Scholl, 2017).
Some BRICS governments use earmarked funds that collect fossil fuel revenues to finance specific socioeconomic projects. In Brazil, until recently, oil and gas royalties were used to finance healthcare and education. In South Africa, a levy on fuel consumption is used to finance a Road Accident Fund, while in Russia, the National Welfare Fund captures profits when oil prices are high to finance future pension liabilities. China also earmarks part of its coal revenues to support workers affected by job cuts in the coal and steel industries, while India has developed a coal cess that, until 2017, was intended to support renewable energy research and development.

IISD.org/gsi 17
Beyond Fossil Fuels: Fiscal transition in BRICS
Overall, fossil fuel revenues can be used much more to support a clean energy transition in line with the concept of a fossil fuel to clean energy subsidy swap—the idea of redirecting government support from fossil fuels to clean energy (Bridle, Sharma, Mostafa, & Geddes, 2019). Earmarking fossil fuel revenues can also be important for garnering political support for new or increased taxes on fossil fuels, engaging the public in deciding which causes the revenues will be spent on.
However, earmarking also creates an extra layer of administration, and often governments have difficulties picking which projects will be supported with earmarked funds. Further, in the longer term and to avoid dangerous climate change, the fossil fuel sector will have to sunset. Therefore, the use of fossil fuel revenues to support the clean energy transition should not make clean energy projects the hostage of oil, gas and coal sector performance. Rather, while fossil fuels still generate revenues on the production side and can generate much more revenue if fossil fuel consumption becomes subject to higher tax rates and more ample carbon pricing, it is important to invest these flows of income in a way that can support economies in a world beyond fossil fuels. Therefore, it is also necessary to design earmarked funds in a way that uses fossil fuel revenue to bolster the transition to clean energy and ultimately make it competitive without government support.
4.3 Just Transitions
Clean energy transitions need to allow for the adaptation of consumers, communities and workers who currently depend on fossil fuels and bear the greatest personal costs from such change—providing them with viable and fair alternatives as part of a “just transition” (Gass & Echeverria, 2017; Zinecker et al., 2018). This is particularly important for BRICS countries, which have significant income inequality and, despite their economic growth, still have large swaths of populations vulnerable to energy price increases.
There is no “one-size-fits-all” approach to the socioeconomic aspects of clean energy transitions. Each path depends on local circumstances and the outcomes of social dialogue involving all affected stakeholders: workers, community representatives, business, government. In practice, transitions also depend on government capacity and available economic diversification and retraining options. For example, fossil fuel subsidy reforms include cash transfers and other support measures for vulnerable groups of consumers (Gass & Echeverria, 2017). China’s 13th Five-Year Plan (2016–2020) includes the CNY 100 billion (USD 14.5 billion) Industrial Special Fund for employment restructuring in coal areas (Bridle, et al., 2017).
The earlier and better the needs of economic diversification and a just transition are anticipated, the less disruptive and more constructive the change will be.
4.4 The Role of Public Finance
Public finance can support economic and energy sector diversification. In the energy sector, public finance plays a crucial role in shaping the industry as it tends to “crowd in” private sector finance and establish wider finance policy norms (Brown & Jacobs, 2011). Examples of domestic finance for clean energy projects exist in all BRICS countries but are dwarfed by continued fossil fuel financing (Figure 9). Currently, BRICS countries’ publicly owned banks provide financing to fossil fuel projects domestically and abroad, in contrast with the World Bank Group practice, along with some other multilateral and national financial institutions, which places restrictions on fossil fuel financing. China

IISD.org/gsi 18
Beyond Fossil Fuels: Fiscal transition in BRICS
is one of the biggest financiers of fossil fuel infrastructure in the world, including through the Belt and Road Initiative (Doukas, DeAngelis, & Ghio, 2017). By financing fossil fuel, BRICS governments and their financial institutions bear the higher risk of decreasing the performance of borrowers in the fossil fuel industry.
Meanwhile, BRICS countries can also finance energy efficiency and renewables domestically through their own development banks (e.g., Brazil’s National Development Bank or India’s Renewable Energy Development Agency), by providing, for example, longer-term, low-cost debt financing. In 2015, BRICS joined forces to create their own multilateral financial institution, known as the New Development Bank. One of its key mandates is to provide sustainable infrastructure financing for its member countries. As of March 2019, the bank has lent USD 8 billion to 30 projects, but this amount could increase to USD 40 billion by 2021 (Silk Road Briefing, 2019). Past projects include renewable energy financing, water treatment projects and loans to South Africa’s electricity company (Eskom) for investment in transmission lines to support additional renewable capacity (Silk Road Briefing, 2019). The New Development Bank can further benefit from emerging best practices of the World Bank Group and some other multilateral development banks in explicitly restricting financing for fossil fuels and other financing incompatible with the principles of sustainable development.
Figure 9. Annual average of total public energy finance by the BRICS countries, 2013–2015
Source: Authors’ presentation based on Doukas et al., 2017.
4.5 The Role of SOEs
The main way to protect SOEs and BRICS country economies from the risk of fossil fuel asset stranding is diversification. The more investment portfolios are balanced, the greater the capacity for institutions to withstand shocks to one part of their business. There are signs of this beginning to take place already today. India’s main coal mining company (Coal India Limited) commissioned the Coal Vision 2030 report to understand how the energy transition might reduce future coal demand (Coal India Limited, 2018). It has also engaged in diversification programs to reduce its exposure to the risk of stranding, including plans to increase its solar capacity by 20,000 MW in the next 10 years (Bhaskar, 2018). Similarly, China’s largest coal company, Shenhua, merged in 2017 with another SOE, Guodian, to form the China Energy Investment Corporation, bringing together coal and wind power in what is now the world’s biggest power company, with a generation capacity estimated at 23 per cent renewables (Asia Times, 2017; Buckley & Nicholas, 2017).
0
2,000
4,000
6,000
8,000
10,000
12,000
14,000
16,000
China Brazil Russia South Africa India
Other
Clean
Fossil fuels

IISD.org/gsi 19
Beyond Fossil Fuels: Fiscal transition in BRICS
5.0 Conclusions and Recommendations
The BRICS governments receive revenues from the production and consumption of fossil fuels via taxes, royalties and other charges. The clean energy transition will create challenges: as fossil fuel production and consumption decline, governments will need to rethink how they raise revenue from fossil fuels and diversify their revenue base to replace them.
Addressing this challenge is not, however, insurmountable. Governments can implement the following policies to secure their financial position during the clean energy transition.
Recommendations:
1. Evaluate and report on the flows of government revenues and subsidies related to fossil fuels. Governments should improve transparency by reporting on the scale and type of revenues received from, and subsidies provided to, fossil fuel production and consumption. Subsidy reporting can involve voluntary peer reviews at the national level, under the G20 and reporting on SDG indicator 12.c.1. This will help offer insights to governments in undergoing a fiscal transition away from fossil fuels.
2. Support economic diversification away from fossil fuel dependency. Diversification can shield governments from the risk of falling fossil fuel revenues. All BRICS governments should support economic diversification and the diversification of their energy sectors to mitigate energy transition impacts. In particular, Russia’s national economy is heavily dependent on fossil fuels and would benefit from diversification, as would the subnational coal-producing regions in China, India and South Africa, and oil-producing Rio de Janeiro State in Brazil. Support for economic diversification and diversification of the energy mix necessitates:
a) Phasing out fossil fuel subsidies and public finance for fossil fuels.
b) Ensuring polluters pay for negative impacts, such as on health and climate, which will create a clear price signal to promote the transition to clean energy. Fossil fuel and carbon taxes play a key role in this respect.
c) Reinvesting revenues from fossil fuel production and consumption and savings from subsidy reform into productive uses, such as sustainable infrastructure, education and health.
d) Harnessing SOEs and public finance institutions, such as the New Development Bank, as vehicles of diversification for the clean energy transition.
e) Targeting support for low-income households (cash transfers, improved social safety nets, etc.) to counteract negative impacts from subsidy removal.
f) Ensuring support for a just transition for workers and communities depending on fossil fuels.
7. Ensure fiscal revenue diversification. In the short-to-medium term, the likely pathway for energy transition is for governments to start removing fossil fuel subsidies and increasing taxes on fossil fuels and carbon, in order to price fossil fuels more rationally. All countries, including BRICS, are recommended to ensure that such revenues are well managed but are not seen as a long-term strategy for broadening the tax base. Rather, revenues from fossil fuels, including from emerging carbon pricing, should be used as a temporary bridge to help fund the costs

IISD.org/gsi 20
Beyond Fossil Fuels: Fiscal transition in BRICS
of transition, including mitigating their negative impacts on vulnerable energy consumers and developing programs for a just transition for communities and workers.
A fiscal transition and diversifying government revenues away from fossil fuels will help ensure greater coherence on sustainable economies, energy efficiency and security, clean air and climate action in BRICS countries.

IISD.org/gsi 21
Beyond Fossil Fuels: Fiscal transition in BRICS
References
Asia Times. (2017, November 21). Two leading SOEs merge into China Energy Investment Corp. Retrieved from https://www.asiatimes.com/2017/11/article/two-leading-soes-merge-china-energy-investment-corp/
Bhaskar, U. (2018). Coal India to set up 20,000 MW of solar power projects in 10 years. Retrieved from https://www.livemint.com/Industry/vNIicVhgfv7UzOrKkj67dP/Coal-India-to-set-up20000MW-of-solar-power-projects-in-nex.html
BRIC. (2019). Joint statement of the BRIC countries’ leaders. Retrieved from http://en.kremlin.ru/supplement/209
BRICS. (2009). Joint statement for the 5th BRICS Ministers of Environment Meeting. Retrieved from http://brics2019.itamaraty.gov.br/images/documentos/PDFBRICS2019_Draft_FINAL_STATEMENT_5th_BRICS_Environment_Ministerial_Meeting_Rev1.pdf
Bridle, R., Kitson, L., Duan, H., Sanchez, L. & T. Merrill. (2017). At the crossroads: Balancing the financial and social costs of coal transition in China [in English and Chinese]. IISD. Retrieved from https://www.iisd.org/library/crossroads-balancing-financial-and-social-costs-coal-transition-china
Bridle, R., Sharma, S., Mostafa, M. & Geddes, A. (2019). Fossil fuel to clean energy subsidy swaps: How to pay for an energy revolution. Retrieved from https://www.iisd.org/library/fossil-fuel-clean-energy-subsidy-swap
Brown, J. & Jacobs, M. (2011, April). Leveraging private investment: The role of public sector climate finance. Overseas Development Institute. Retrieved from https://www.odi.org/publications/5701-leveraging-private-investment-role-public-sector-climate-finance
Buckley, T., & Nicholas, S. (2017, October). Global electricity utilities in transition: Leaders and laggards: 11 case studies. Institute for Energy Economics and Financial Analysis. Retrieved from http://ieefa.org/wp-content/uploads/2017/10/IEEFA-Global-Utilities-in-Transition11-Case-Studies-October-2017.pdf
Coady, D., Parry, I., Nghia-Piotr, L., & Shang, B. (2019). Global fossil fuel subsidies remain large: An update based on country-level estimates (IMF Working Paper No. 19/89). Retrieved from https://www.imf.org/en/Publications/WP/Issues/2019/05/02/Global-Fossil-Fuel-Subsidies-Remain-Large-An-Update-Based-on-Country-Level-Estimates-46509
Coal India Limited. (2018). Coal Vision 2030: Stakeholders consultation. Retrieved from https://www.coalindia.in/DesktopModules/DocumentList/documents/Coal_Vision_2030_document_for_Coal_Sector_Stakeholders_Consultation_27012018.pdf
Cosbey, A., Mann, H., Maennling, N., Toledano, P., Geipel, J., & Brauch, M. D. (2016). Mining a mirage? Reassessing the shared-value paradigm in light of the technological advances in the mining sector. Retrieved from https://www.iisd.org/sites/default/files/publications/mining-a-mirage.pdf
Denjean, B., Su, T., Attwood, C., Bridle, R., Duan, H., & Gerasimchuk, I. (2016). Subsidies to coal power generation in China. Retrieved from https://www.iisd.org/sites/default/files/publications/subsidies-coal-power-generation-china.pdf
IISD.org/gsi 22
Beyond Fossil Fuels: Fiscal transition in BRICS
Doukas, A., DeAngelis, K., & Ghio, N. (2017). Talk is cheap: How G20 governments are financing climate disaster. Oil Change International. Retrieved from http://priceofoil.org/2017/07/05/g20-financing-climate-disaster/
Eggleston, H., Buendia, L., Miwa, K., Ngara, T. & Tanabe, K. (Eds.). (2006). IPCC guidelines for national greenhouse gas inventories. Retrieved from https://www.ipcc-nggip.iges.or.jp/public/2006gl/pdf/2_Volume2/V2_1_Ch1_Introduction.pdf
G20. (2009). Leaders’ statement: The Pittsburgh Summit. September 24–25, 2009. Retrieved from https://www.treasury.gov/resource-center/international/g7-g20/Documents/pittsburgh_summit_leaders_statement_250909.pdf
Garg, V., Narayanaswamy, D., Ganesan, K., & B. Viswanathan. (2019). India’s energy transition: The cost of meeting air pollution standards in the coal-fired electricity sector. Retrieved from https://www.iisd.org/sites/default/files/publications/india-energy-transition-air-pollution-standards.pdf
Gass, P., & Echeverria, D. (2017). Fossil fuel subsidy reform and the just transition. Winnipeg: IISD. Retrieved from https://www.iisd.org/sites/default/files/publications/fossil-fuel-subsidy-reform-just-transition.pdf
Gerasimchuk, I. (2012). Fossil fuels – At what cost? Government support for upstream oil and gas activities in Russia [in English and Russian]. Retrieved from https://www.iisd.org/library/fossil-fuels-what-cost-government-support-upstream-oil-and-gas-activities-russia
Gurría, A. (2013). The climate challenge: Achieving zero emissions – OECD (Lecture). Retrieved from https://www.oecd.org/env/the-climate-challenge-achieving-zero-emissions.htm
Heede, R. (2014). Carbon majors: Accounting for carbon and methane emissions 1854–2010. Methods & results report. Retrieved from http://climateaccountability.org/pdf/MRR%209.1%20Apr14R.pdf
Hendrix, C. S. (2017, February 3). Kicking a crude habit: Diversifying away from oil and gas in the 21st century (Working paper 17-2). Peterson Institute for International Economics. Retrieved from https://www.piie.com/publications/working-papers/kicking-crude-habit-diversifying-away-oil-and-gas-21st-century
Inozemtsev, V. (2016). A bad habit: Is it possible to get rid of the oil curse? [in Russian] Retrieved from https://www.rbc.ru/opinions/economics/20/02/2016/56c7f9ad9a794720f77b5fe6
Intergovernmental Panel on Climate Change. (2014). Climate change 2014: Mitigation of climate change. Working Group III Contribution to the Fifth Assessment Report of the Intergovernmental Panel on Climate Change. Cambridge: Cambridge University Press. doi:10.1017/CBO9781107415416.
Intergovernmental Panel on Climate Change. (2018). Global warming of 1.5°C. Retrieved from https://www.ipcc.ch/sr15/
International Energy Agency (IEA). (2005). Energy statistics manual. Retrieved from https://webstore.iea.org/energy-statistics-manual
International Energy Agency. (2019a). World energy investment 2019. Retrieved from https://www.iea.org/wei2019/
International Energy Agency. (2019b). Statistics. Retrieved from https://www.iea.org/statistics
International Energy Agency. (2019c). Fossil-fuel subsidies. Retrieved from https://www.iea.org/weo/energysubsidies/

IISD.org/gsi 23
Beyond Fossil Fuels: Fiscal transition in BRICS
International Renewable Energy Agency. (2019). Renewable power generation costs in 2018. Retrieved from https://www.irena.org/publications/2019/May/Renewable-power-generation-costs-in-2018
Lange, G.-M., Wodon, Q., & Carey, K. (Eds.). (2018a). The changing wealth of nations 2018: Building a sustainable future. doi:https://doi.org/10.1596/978-1-4648-1046-6
Lazard. (2017). Lazard’s 2017 levelized cost of energy analysis. Retrieved from https://www.lazard.com/media/450436/rehcd3.jpg
Manley, D., Cust, J. F., & Cecchinato, G. (2017). Stranded nations? The climate policy implications for fossil fuel-rich developing countries (Oxcarre Policy paper 34). Retrieved from https://papers.ssrn.com/sol3/Delivery.cfm/SSRN_ID3264765_code3171410.pdf?abstractid=3264765&mirid=1
Marten, M. & van Dender, K. (2019). The use of revenues from carbon pricing (OECD Taxation Working Paper No. 43). Paris: OECD Publishing. doi:https://doi.org/10.1787/3cb265e4-en.
Mercure, J. F., Pollitt, H., Viñuales, J. E., Edwards, N. R., … Knobloch, F. (2018). Macroeconomic impact of stranded fossil fuel assets. Nature Climate Change, 8(7), 588.
Ministry of Energy of the Russian Federation. (2017). Draft Energy Strategy of the Russian Federation to 2035, edition of 1 February 2017 [in Russian]. Retrieved from https://minenergo.gov.ru/node/1920
Ministry of External Affairs, Government of India (2019). India-France Joint Statement on Visit of Prime Minister to France. Retrieved from https://www.mea.gov.in/bilateral-documents.htm?dtl%2F31755%2FIndiaFrance+Joint+Statement+on+Visit+of+Prime+Minister+to+France+2223+August+2019#.XZHOUvP34ps.twitter
O’Neill, J. (2017). If China stays on track, the BRICS countries will overtake the G7 by 2035. HuffPost. Retrieved from https://www.huffpost.com/entry/china-brics-summit-g7_b_59a6bb57e4b063ae34da39ff
Organisation for Economic Co-operation and Development (OECD). (2019). OECD analysis of budgetary support and tax expenditures. Retrieved from https://www.oecd.org/fossil-fuels/data/
Organisation for Economic Co-operation and Development & International Transport Forum. (2019). Tax revenue implications of decarbonising road transport: Scenarios for Slovenia. Paris: OECD Publishing.
People’s Republic of China. (2015). Enhanced actions on climate change: China’s Intended Nationally Determined Contribution. Retrieved from https://www4.unfccc.int/sites/submissions/INDC/Published%20Documents/China/1/China's%20INDC%20-%20on%2030%20June%202015.pdf
Republic of India. (2015). India’s Intended Nationally Determined Contribution: Working towards climate justice. Retrieved from https://www4.unfccc.int/sites/submissions/INDC/Published%20Documents/India/1/INDIA%20INDC%20TO%20UNFCCC.pdf
Schlösser, T., Schultze K. R., Ivleva, D., Wolters, S., & Scholl, C. (2017). From riches to rags? Stranded assets and the governance implications for the fossil fuel sector. Retrieved from http://www.bmz.de/rue/includes/downloads/GIZ_2017_From_Riches_to_Rags__Stranded_Assets_and_the_Governance_Implications_for_the_Fossil_Fuel_Sector.pdf
Seto, K. C., Davis, S. J., Mitchell, R. B., Stokes, E. C., Unruh, G. & Ürge-Vorsatz, D. (2016). Carbon lock-in: Types, causes, and policy implications. Annual Review of Environment and Resources, 41 (1), 425–52. doi:10.1146/annurev-environ-110615-085934

IISD.org/gsi 24
Beyond Fossil Fuels: Fiscal transition in BRICS
Silk Road Briefing. (2019). BRICS New Development Bank on course to lend US$40 billion in green infrastructure projects. Retrieved from https://www.silkroadbriefing.com/news/2019/03/08/brics-new-development-bank-course-lend-40-billion-green-infrastructure-projects/
Soman, A., Gerasimchuk, I., Beaton, C., Kaur, H., Garg, V., & Ganesan, K. (2018). India’s energy transition: Subsidies for fossil fuels and renewable energy, 2018 update. Retrieved from https://www.iisd.org/sites/default/files/publications/india-energy-transition-2018update.pdf
Standing Committee on Energy. (2018). Stressed/non-performing assets in electricity sector. Retrieved from http://164.100.47.193/lsscommittee/Energy/16_Energy_37.pdf
Suharsono, A., Sanchez, L., Garg, V. & P. Gass. (2019). Tackling coal-driven air pollution in China and India: Lessons learned for Indonesia. Retrieved from https://www.iisd.org/sites/default/files/publications/coal-pollution-lessons-indonesia.pdf
UN Environment (2011). Towards a green economy: Pathways to sustainable development and poverty eradication: A synthesis for policy-makers. Retrieved from https://sustainabledevelopment.un.org/index.php?page=view&type=400&nr=126&menu=35
United Nations Conference on Trade and Development. (n.d.) UNCTAD Stat. Retrieved from https://unctadstat.unctad.org/wds/ReportFolders/reportFolders.aspx?sCS_ChosenLang=en
Wooders, P., Zinecker, A., & Steenblik, R. (2019, May 23). Measuring fossil fuel subsidies in the context of the sustainable development goals. Retrieved from https://wedocs.unep.org/bitstream/handle/20.500.11822/28111/FossilFuel.pdf
World Economic Forum. (2019). The global competitiveness report 2019. Retrieved from http://www3.weforum.org/docs/WEF_TheGlobalCompetitivenessReport2019.pdf
World Bank. (2019). World Bank Open Data. Retrieved from https://data.worldbank.org/
World Trade Organization. (1994). Agreement on Subsidies and Countervailing Measures. Retrieved from https://www.wto.org/English/docs_e/legal_e/24-scm.pdf
Worrall, L., Whitley, S., Garg, V., Krishnaswamy, S., & Beaton, C. (2018). India’s stranded assets: How government interventions are propping up coal power. Overseas Development Agency. Retrieved from https://www.odi.org/publications/11185-india-s-stranded-assets-how-government-interventions-are-propping-coal-power
Xue, H., Wang, H., Bridle, R., Attwood, C., & Gerasimchuk, I. (2015). Subsidies to coal production in China [in English and Chinese]. Retrieved from https://www.iisd.org/library/subsidies-coal-production-china
Zinecker, A., Gass, P., Gerasimchuk, I., Jain, P., ... & Beaton, C. (2018). Real people, real change. Strategies for just energy transitions. International Institute for Sustainable Development. Retrieved from https://www.iisd.org/library/real-people-real-change-strategies-just-energy-transitions
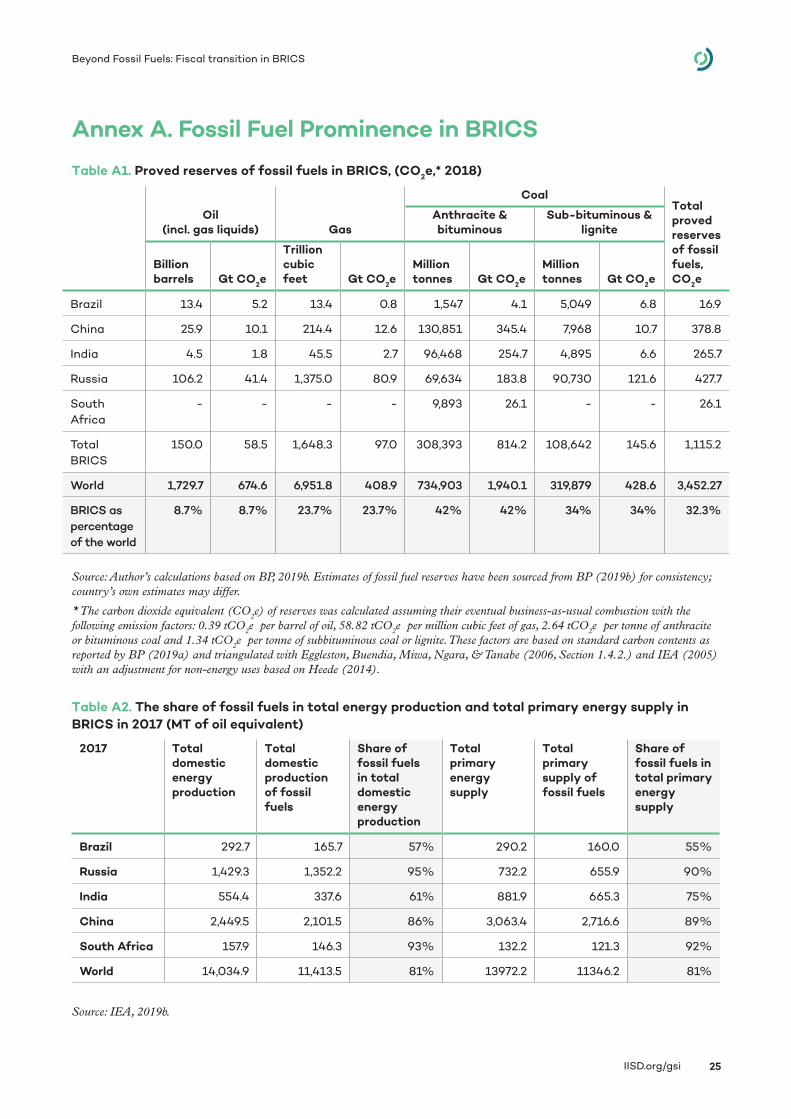
IISD.org/gsi 25
Beyond Fossil Fuels: Fiscal transition in BRICS
Annex A. Fossil Fuel Prominence in BRICS
Table A1. Proved reserves of fossil fuels in BRICS, (CO2e,* 2018)
Oil (incl. gas liquids) Gas
CoalTotal proved reserves of fossil fuels, CO2e
Anthracite & bituminous
Sub-bituminous & lignite
Billion barrels Gt CO2e
Trillion cubic feet Gt CO2e
Million tonnes Gt CO2e
Million tonnes Gt CO2e
Brazil 13.4 5.2 13.4 0.8 1,547 4.1 5,049 6.8 16.9
China 25.9 10.1 214.4 12.6 130,851 345.4 7,968 10.7 378.8
India 4.5 1.8 45.5 2.7 96,468 254.7 4,895 6.6 265.7
Russia 106.2 41.4 1,375.0 80.9 69,634 183.8 90,730 121.6 427.7
South Africa
- - - - 9,893 26.1 - - 26.1
Total BRICS
150.0 58.5 1,648.3 97.0 308,393 814.2 108,642 145.6 1,115.2
World 1,729.7 674.6 6,951.8 408.9 734,903 1,940.1 319,879 428.6 3,452.27
BRICS as percentage of the world
8.7% 8.7% 23.7% 23.7% 42% 42% 34% 34% 32.3%
Source: Author’s calculations based on BP, 2019b. Estimates of fossil fuel reserves have been sourced from BP (2019b) for consistency; country’s own estimates may differ.
* The carbon dioxide equivalent (CO2e) of reserves was calculated assuming their eventual business-as-usual combustion with the following emission factors: 0.39 tCO2e per barrel of oil, 58.82 tCO2e per million cubic feet of gas, 2.64 tCO2e per tonne of anthracite or bituminous coal and 1.34 tCO2e per tonne of subbituminous coal or lignite. These factors are based on standard carbon contents as reported by BP (2019a) and triangulated with Eggleston, Buendia, Miwa, Ngara, & Tanabe (2006, Section 1.4.2.) and IEA (2005) with an adjustment for non-energy uses based on Heede (2014).
Table A2. The share of fossil fuels in total energy production and total primary energy supply in BRICS in 2017 (MT of oil equivalent)
2017 Total domestic energy production
Total domestic production of fossil fuels
Share of fossil fuels in total domestic energy production
Total primary energy supply
Total primary supply of fossil fuels
Share of fossil fuels in total primary energy supply
Brazil 292.7 165.7 57% 290.2 160.0 55%
Russia 1,429.3 1,352.2 95% 732.2 655.9 90%
India 554.4 337.6 61% 881.9 665.3 75%
China 2,449.5 2,101.5 86% 3,063.4 2,716.6 89%
South Africa 157.9 146.3 93% 132.2 121.3 92%
World 14,034.9 11,413.5 81% 13972.2 11346.2 81%
Source: IEA, 2019b.

IISD.org/gsi 26
Beyond Fossil Fuels: Fiscal transition in BRICS
Table A3. Net imports (positive values, unshaded) and exports (negative values, shaded) of energy resources in BRICS in 2017 (MT of oil equivalent)
Coal Crude oil Oil products
Gas Biofuels and waste
Electricity Total
Brazil 15.1 -46.4 22.4 9.2 0.2 3.1 3.6
Russia -103.4 -253.4 -126.0 -180.3 0 -0.9 -664.1
India 118.1 225. 3 -37.6 24.4 0 -0.1 330.1
China 141.5 414.6 5.6 71.3 0 -1.1 631.9
South Africa
-47.2 16.7 5.7 3.5 -0.2 -0.6 -22.0
Source: Authors’ calculations based on IEA, 2019b.

IISD.org/gsi 27
Beyond Fossil Fuels: Fiscal transition in BRICS
Annex B. Methodology and Scope
The estimates of government revenues and subsidies related to fossil fuels, as presented in Section 3 of the report, should be treated as conservative due to the likely incomplete coverage of all relevant national and subnational financial flows.
The information on various elements of these financial flows is reported by different government agencies, often inconsistently or aggregated with revenues related to other sectors. The authors sought to cover all sizeable elements, but some data gaps remained and are signposted in individual country briefs. To the extent possible, the calculations include financial flows for the extraction of oil, gas (including gas liquids), anthracite, bituminous and subbituminous coal and lignite, oil refining and generation of fossil fuel-based electricity, as well as transportation and consumption of fossil fuels. Due to data and capacity limitations, it was not always possible to track these financial flows along the entire value chains, so estimates should be treated as conservative.
For government revenues, the calculations rely mainly on government reporting of different streams of taxes and other charges related to fossil fuel production and consumption. In certain cases, when such reporting was not available or not sufficiently disaggregated,13 assumptions have been made to produce an estimate. For example, the value of value-added tax and good and services tax on coal in China and India respectively was calculated using the applicable rates of these taxes, sales volume and domestic prices. Tables presented in individual country briefs provide more details on the composition of estimates for each of the BRICS countries.
For fossil fuel subsidies, the data was sourced from the Organisation for Economic Co-operation and Development, which, in turn relies on governments’ own reporting. These estimates were complemented with the International Energy Agency estimates of fossil fuel subsidies as described in more detail in Section 3.4 on subsidies.
For the cross-country analysis, 2017 is as the most recent year for which both revenue and subsidy data were available. In figures presented in country briefs, time series are available for 2012–2017 in current prices, based on the national currency conversion to USD.
13 For example, data is sometimes merged for fossil fuel extraction and extraction of other minerals as well as for fossil fuel power and other utilities. Social security fund revenues are often reported jointly for all industries.

© 2019 The International Institute for Sustainable Development Published by the International Institute for Sustainable Development.
IISD Head Office
111 Lombard Avenue, Suite 325 Winnipeg, Manitoba Canada R3B 0T4 Tel: +1 (204) 958-7700 Website: www.iisd.orgTwitter: @IISD_news
Global Subsidies Initiative
International Environment House 2 9 chemin de Balexert, 1219 Châtelaine Geneva, Switzerland Tel: +41 22 917-8683 Website: www.iisd.org/gsiTwitter: @globalsubsidies