beyond conjoint analysis: advances in preference measurement
TRANSCRIPT
Beyond conjoint analysis: Advancesin preference measurement
Oded Netzer & Olivier Toubia & Eric T. Bradlow &
Ely Dahan & Theodoros Evgeniou &
Fred M. Feinberg & Eleanor M. Feit & Sam K. Hui &Joseph Johnson & John C. Liechty & James B. Orlin &
Vithala R. Rao
Published online: 30 July 2008# Springer Science + Business Media, LLC 2008
Abstract We identify gaps and propose several directions for future research inpreference measurement. We structure our argument around a framework that viewspreference measurement as comprising three interrelated components: (1) theproblem that the study is ultimately intended to address; (2) the design of thepreference measurement task and the data collection approach; (3) the specificationand estimation of a preference model, and the conversion into action. Conjoint
Market Lett (2008) 19:337–354DOI 10.1007/s11002-008-9046-1
O. Netzer (*) :O. ToubiaColumbia Business School, Columbia University, 3022 Broadway, New York, NY 10027, USAe-mail: [email protected]
O. Toubiae-mail: [email protected]
E. T. BradlowUniversity of Pennsylvania, 700 Jon M. Huntsman Hall, 3730 Walnut Street, Philadelphia,PA 19104-6340, USAe-mail: [email protected]
E. DahanUCLA Anderson School, University of California, Los Angeles, 110 Westwood Plaza, B-514,Los Angeles, CA 90095-1481, USAe-mail: [email protected]
T. EvgeniouINSEAD, Boulevard de Constance, 77305 Fontainebleau, Francee-mail: [email protected]
F. M. Feinberg : E. M. FeitStephen M. Ross School of Business, University of Michigan, 701 Tappan St., Ann Arbor,MI 48109-1234, USA
E. M. Feite-mail: [email protected]
e-mail: [email protected]
analysis is only one special case within this framework. We summarize cutting edgeresearch and identify fruitful directions for future investigations pertaining to theframework’s three components and to their integration.
Keywords Preference measurement . Conjoint analysis . Marketing research
1 Introduction: beyond conjoint analysis
Researchers and practitioners often equate preference measurement with conjointanalysis. Indeed, since its introduction (Green and Rao 1971), conjoint analysis (andits variants) has become the method of choice for quantitative preferencemeasurement, and is considered among the major contributions of marketing scienceto marketing practice. However, conjoint analysis is only a special case of thebroader field of preference measurement (Gustafsson et al. 2007). While academicresearch in conjoint analysis may be viewed by some as mature, the field ofpreference measurement remains very active, important, and growing.
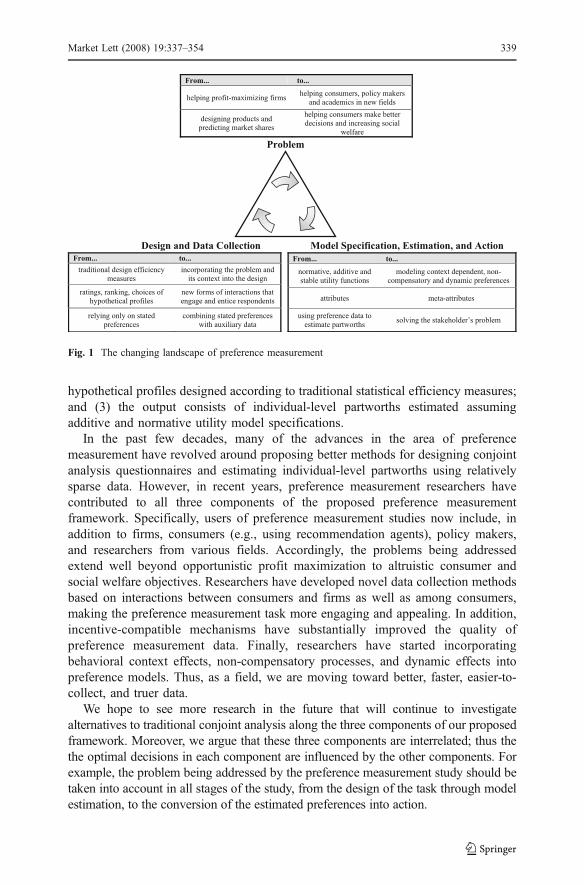
In this paper, we review recent developments in preference measurement that gobeyond the “traditional” set of tools that are familiar to many practitioners andacademics, and offer directions for future research. We propose viewing preferencemeasurement as comprising three main components (see Fig. 1): (1) the problem thatthe study is ultimately intended to address; (2) the design of the preferencemeasurement task and the data collection approach; (3) the specification andestimation of a preference model, and the conversion into action. In the context ofconjoint analysis, these three components typically take the following form: (1) theproblem is to help (profit-maximizing) firms design products and/or predict marketshares; (2) data collection involves consumers rating, ranking, or choosing among
S. K. HuiStern School of Business, New York University, 40 West 4th Street, New York, NY 10012, USAe-mail: [email protected]
J. JohnsonSchool of Business Administration, University of Miami, 5250 University Drive, Coral Gables,FL 33146-6554, USAe-mail: [email protected]
J. C. LiechtySmeal College of Business, The Pennsylvania State University, Business Building,University Park, State College, PA 16802, USAe-mail: [email protected]
J. B. OrlinSloan School of Management, Massachusetts Institute of Technology,77 Massachusetts Avenue, Cambridge, MA 02139-4307, USAe-mail: [email protected]
V. R. RaoJohnson Graduate School of Management, Cornell University, 351 Sage Hall, Ithaca,NY 14853, USAe-mail: [email protected]
338 Market Lett (2008) 19:337–354
hypothetical profiles designed according to traditional statistical efficiency measures;and (3) the output consists of individual-level partworths estimated assumingadditive and normative utility model specifications.
In the past few decades, many of the advances in the area of preferencemeasurement have revolved around proposing better methods for designing conjointanalysis questionnaires and estimating individual-level partworths using relativelysparse data. However, in recent years, preference measurement researchers havecontributed to all three components of the proposed preference measurementframework. Specifically, users of preference measurement studies now include, inaddition to firms, consumers (e.g., using recommendation agents), policy makers,and researchers from various fields. Accordingly, the problems being addressedextend well beyond opportunistic profit maximization to altruistic consumer andsocial welfare objectives. Researchers have developed novel data collection methodsbased on interactions between consumers and firms as well as among consumers,making the preference measurement task more engaging and appealing. In addition,incentive-compatible mechanisms have substantially improved the quality ofpreference measurement data. Finally, researchers have started incorporatingbehavioral context effects, non-compensatory processes, and dynamic effects intopreference models. Thus, as a field, we are moving toward better, faster, easier-to-collect, and truer data.
We hope to see more research in the future that will continue to investigatealternatives to traditional conjoint analysis along the three components of our proposedframework. Moreover, we argue that these three components are interrelated; thus thethe optimal decisions in each component are influenced by the other components. Forexample, the problem being addressed by the preference measurement study should betaken into account in all stages of the study, from the design of the task through modelestimation, to the conversion of the estimated preferences into action.
From... to...
normative, additive and
stable utility functions
modeling context dependent, non-
compensatory and dynamic preferences
attributes meta-attributes
using preference data to
estimate partworths solving the stakeholder’s problem
From... to...
traditional design efficiency
measures
incorporating the problem and
its context into the design
ratings, ranking, choices of
hypothetical profiles
new forms of interactions that
engage and entice respondents
relying only on stated
preferences
combining stated preferences
with auxiliary data
From... to...
helping profit-maximizing firms helping consumers, policy makers
and academics in new fields
designing products and
predicting market shares
helping consumers make better
decisions and increasing social
welfare
Problem
Model Specification, Estimation, and Action Design and Data Collection
Fig. 1 The changing landscape of preference measurement
Market Lett (2008) 19:337–354 339
2 Problem
The types of problems being addressed by preference measurement studies areevolving. Companies have started using preference measurement in new ways thatgo beyond partworth estimation, and users increasingly include consumers, policymakers, and health care professionals, as well as academic researchers from fieldswhere preference measurement is less ubiquitous.
2.1 Helping companies
Conjoint analysis has helped a large number of companies make decisions in areassuch as new product development, pricing, segmentation, positioning, andadvertising (Cattin and Wittink 1982; Wittink and Cattin 1989). Such decisionshave relied primarily on the estimation of partworths. Given the growing diversityand complexity of the shopping environment, companies are increasingly interestedin modeling and understanding the actual process through which consumers chooseproducts, in addition to consumers’ partworths. For example, Erdem et al. (2005)estimated a choice model that captures the role of active information search andlearning in consumer decision making in the context of high-involvement consumerdurables. Iyengar et al. (2008) built a structural model of consumer preferences fornon-linear contracts (e.g., two- or three-part tariff cell phone plans). Gilbride andAllenby (2004) and Jedidi and Kohli (2005) went beyond partworth estimation andutilized preference measurement techniques to study the formation of considerationsets. Preference measurement could also be used more extensively by companies toguide project selection and investment decisions.
2.2 Helping consumers
The last few years have seen a great increase in the number of preferencemeasurement methods designed to help consumers make better choices. The mostprevalent example is that of recommendation agents. Recommenders have been andcontinue to be a popular research topic in various fields, such as informationsystems, computer science and machine learning (Adomavicius and Tuzhilin 2005;Srebro et al. 2005), psychology (Häubl and Murray 2003) and marketing (Ansariet al. 2000; Arora et al. 2008; Häubl and Trifts 2000; Liechty et al. 2001; Ying et al.2006). A good example of the revived interest in this topic is the “Netflix Prize”(www.netflixprize.com). The use of preference measurement methods in recom-mendation systems requires researchers to modify current methodologies in waysthat substantially shorten the preference measurement task, and, in some cases, allowpractitioners to estimate and utilize partworths in real time (De Bruyn et al. 2008).
2.3 Helping policy makers and health care professionals
Policy makers and health care professionals (e.g., doctors, pharmaceutical companies,hospitals) have become increasingly interested in preference measurement techniques.Their objective may be opportunistic (e.g., maximize profit, maximize chances ofwinning an election) or altruistic. For example, in medical decision analysis,
340 Market Lett (2008) 19:337–354
Bleichrodt and Pinto (2000) developed a non-parametric method to elicit theprobability weighting function in the context of choices between medical treatments.Saigal et al. (2007) used conjoint analysis to optimize treatment for prostate cancerbased on each patient’s unique tradeoffs between various outcomes and side effects.Parker and Srinivasan (1976) used preference measurement techniques to incorpo-rate patients’ preferences in planning a rural primary health care delivery system.
2.4 Helping academic researchers
Preference measurement is inherently an interdisciplinary field. For example, someof its origins may be traced back to mathematical psychology and transportation.While most of the active work on the topic is currently linked to marketing, weexpect the preference measurement community to expand to new fields in thecoming years. For example, behavioral economists are increasingly interested inindividual-level estimates of the parameters of the value function and the probabilityweighting function (Kahneman and Tversky 1979; Prelec 1998; Gonzalez and Wu1999) in the context of cumulative prospect theory (Tversky and Kahneman 1992).Such estimates allow studying the relationship among parameters that represent lossaversion or risk aversion and individual characteristics such as age, income, oreducation (Tanaka et al. 2007), or between such parameters and behavior (Fehr andGoette 2007; Jarnebrant et al. 2008). We believe that advances in preferencemeasurement, such as adaptive questionnaire design and Bayesian estimation, maybenefit this community of researchers. In like manner, researchers in preferencemeasurement may greatly benefit from collaborating with colleagues in fields suchas computer science (Evgeniou et al. 2005), education (Bradlow 2005), engineering(Michalek et al. 2005), and psychology (Otter et al. 2008).
3 Design and data collection
3.1 Optimal experimental design: beyond A-efficiency and D-efficiency
The design of conjoint experiments has traditionally focused on maximizing designefficiency measures such as D-efficiency or A-efficiency (Addelman 1962; Kuhfeldet al. 1994). These measures of efficiency are based on matrix norms defined on thecovariance matrix of the estimates of the partworths. In other words, in the contextof an individual-level regression, D-efficient or A-efficient designs (such as the well-known orthogonal designs) produce partworth estimates that have minimal varianceand intercorrelation.
However, those traditional efficiency measures overlook the managerial objectiveof the preference measurement study. In particular, while traditional measures ofefficiency focus on the covariance matrix of the partworths, managers typically takeactions that are based on some functions of these partworths (e.g., willingness to payfor a specific feature), and put more weight on some decisions than others. Toubiaand Hauser (2007) proposed M-efficiency measures that account for such managerialconsiderations. Future research may incorporate other aspects of the environment,such as engineering constraints (Michalek et al. 2005) or prior knowledge of
Market Lett (2008) 19:337–354 341
consumers’ preferences, into the design stage of preference measurement studies.For example, Gensler et al. (2007) consider acceptable ranges of willingness to payin the design of an adaptive choice-based conjoint analysis. Along similar lines, theexistence of unacceptable product features or combinations of features may have animpact on the criteria used to evaluate possible designs. Note, however, that oneshould be cautious in asking consumers directly which attribute levels areunacceptable (Green et al. 1988).
More generally, we believe that experimental design may be greatly enhanced bybeing systematically approached using Bayesian Decision Theory (Chaloner andVerdinelli 1995). Bayesian experimental designs minimize an expected loss functionover the posterior distribution of the parameter estimates. For example, Sandor andWedel (2001) proposed a method for eliciting managers’ prior beliefs about attributepreferences and used this prior information to design Bayesian D-efficient choiceexperiments. Sandor and Wedel (2005) showed how taking prior information aboutheterogeneity across consumer preferences into account affects design optimality. Inparticular, they show how the use of a small set of different conjoint designs improvesefficiency over a single design administered to all participants. However, A-efficiencyand D-efficiency are just special cases corresponding to two particular loss functions.The specific context of the study may give rise to alternative loss functions and/or priordistributions on the parameters that more accurately reflect the objectives and beliefs ofthe user. In summary, when designing a preference measurement task, we encourageresearchers to incorporate aspects such as managerial objectives, prior beliefs,constraints and characteristics of the task into the criteria used to evaluate the design.
3.2 New forms of interactions
Preference measurement data have been traditionally collected using pencil andpaper questionnaires or one-on-one or mail–telephone–mail interviews involvingsorting or rating tasks. Since the early 1990s, many respondent interactions havebeen relegated to computer and web interfaces. The use of web-based questionnairestriggered the development of adaptive methods that allow collecting moreinformation per question. Adaptive methods include the commercially availableadaptive conjoint analysis (ACA, Johnson 1987), the Fast Polyhedral approach(Toubia et al. 2003, 2007b, 2004; Vadali et al. 2007), the Adaptive Self-Explicatedapproach (Netzer and Srinivasan 2008).
However, the technological advances and easier accessibility to respondentsafforded by the web come at the cost of decreased respondent patience andattentiveness. Thus, it is becoming more important than ever to keep respondentsengaged with the task. Dahan and Hauser (2002) surveyed several virtual interactiveweb-based interfaces that have been proposed in the past few years to address thatissue. For example, the user design approach collects preference data by allowingrespondents to design their ideal virtual product (von Hippel and Katz 2002). TheInformation Pump (Prelec 2001) and the Securities Trading of Concepts (STOC;Dahan et al. 2007a, b) collect preference data by allowing respondents to interactwith one another in game-like mechanisms, making the task more engaging and fun.Note that, when designing data collection methods that are based on interactionsamong consumers, one needs to be aware of biases that such interactions may induce
342 Market Lett (2008) 19:337–354
(Johnson et al. 2005). Keeping respondents engaged may also be achieved byshowing them physical prototypes to increase the realism of the task (Luo et al.2008; Srinivasan et al. 1997). Dahan and Srinivasan (2000) took this approach evenfurther and reduced its cost by developing a web interface to measure preferencesusing static or dynamic virtual prototypes.
Another method to increase consumer involvement is to replace the commonlyused hypothetical data collection exercises with incentive-aligned tasks, in whichrespondents have to “live with” their decisions (Ding 2007; Ding et al. 2005; Parket al. 2008; Prelec 2001). A recent study by Ding (2007) suggested that incentive-aligned mechanisms may be used even when not all the product profiles exist in themarket. Incentive-aligned mechanisms were empirically found to increase not onlyrespondents’ engagement but also out-of-sample predictive validity. For example,the incentive-aligned mechanism proposed by Ding et al. (2005) increased hit rates(correct prediction of the first choice out of 21 options) by almost a factor of two(from 26% to 48%). Incentive-aligned mechanisms have been shown to be veryeffective also in economic experiments for market design such as matching andpublic goods problems (Amaldoss et al. 2008).
In summary, when building a data collection mechanism, it is important to keep inmind the experience of the consumer completing the task. To be specific, since theultimate goal is usually to predict actual behavior, engaging and incentive-compatible mechanisms should be favored over hypothetical tasks.
3.3 Dealing with a large number of attributes and products
As products become more complex, consumer preferences need to be measured overa larger number of product attributes and levels. Applications of conjoint analysishave been conducted on products involving as many as 50 product attributes (Windet al. 1989). Several methods have been proposed to handle the demand for complexproblems. The traditional self-explicated approach (Srinivasan 1988) can deal with alarge number of attributes and levels. However, this approach carries severallimitations (Green and Srinivasan 1990), which have been partially overcome byhybrid estimation methods that combine self-explicated data with preference data fromfull or partial profile tasks (Green et al. 1981; Johnson 1987; Marshall and Bradlow2002; Ter Hofstede et al. 2002). Utilizing the concept of complexity control frommachine learning, Cui and Curry (2005) and Evgeniou et al. (2005) used a supportvector machine approach to handle complex preference measurement problems.
Researchers recently proposed to address the problem of large productdimensionality by developing innovative data collection mechanisms. For example,the Conjoint Adaptive Ranking Database System (CARDS) method proposed byDahan (2007) simplifies the conjoint analysis task by asking respondents to chooseonly among the very limited number of sets that are perfectly mapped to specificutility functions proposed in advance by the researcher. Park et al. (2008) proposedan auction-based approach in which respondents can auction a large number ofproduct feature upgrades. Taking a different approach, Netzer and Srinivasan (2008)developed an adaptive self-explicated approach to solve the self-explicated constantsum question problem when the number of product attributes becomes large,demonstrating significant improvement in predictive validity. We expect that many
Market Lett (2008) 19:337–354 343
of the advances in our ability to study complex problems will come from thedevelopment of such innovative data collection techniques and from the use ofauxiliary information.
3.4 Combining multiple sources of data
Traditionally, preference measurement studies have relied on data provided explicitlyand consciously by consumers during the preference measurement task. Marketersrecently started identifying new sources of data and supplementing stated preferencedata with auxiliary revealed preference data to: (1) improve predictive ability; (2) askfewer questions; (3) correct biases related to the preference measurement task.1 Suchauxiliary data may be either internal or external to the preference measurement task.
3.4.1 Internal sources of data
Examples of data that are internal to the task include response latencies, eyemovement, and mouse movement. Haaijer et al. (2000) demonstrated that responsetime is related to preference by means of choice uncertainty, whereby shorterresponse times represent more certain choices. Otter et al. (2008) proposed a Poissonrace model to capture response time in conjoint analysis. Netzer et al. (2008)modeled and exploited the relation between response time and choice conflict.Liechty et al. (2003) utilized eye movement data to identify the attention state ofrespondents when evaluating stimuli. In the future, we expect that more decisionprocess data such as mouse movement, click-stream data and brain images will beutilized in preference measurement.
3.4.2 External sources of data
Examples of auxiliary data that are external to the task include, but are not limited to,sales and market share data. Feit et al. (2007) developed a method for meldingexperimental choice data and data on market purchases to leverage the bestproperties of both. Along the same lines, Horsky et al. (2006) demonstrated thebenefits of combining scanner-based data with survey-based preference data.Gilbride et al. (2006) proposed a loss function approach to incorporate market shareinformation as constraints in the estimation of choice-based conjoint analysispartworths. De Bruyn et al. (2008) combined preference measurement data withintended product use and customer characteristics data, in the context ofrecommendation agents. Some less traditional sources of auxiliary data have alsobeen investigated recently. For example, Hui et al. (2008a) and Hui et al. (2008b)measured consumer preferences by combining shopping path data (collected usingRFID technology) with transaction data. Another promising external source of dataincludes readily available data posted on the internet, such as product reviews (Leeand Bradlow 2008).
1 We refer the reader to the previous Choice Symposium papers by Ben-Akiva et al. (1994) and Louviereet al. (1999) for a summary of the benefits and difficulties of combining stated and revealed preferencedata.
344 Market Lett (2008) 19:337–354
With the advantages offered by combining multiple sources of information comesthe difficulty and complexity of combining data sets that are often not fully alignedwith one another. Several approaches have been suggested including data fusion(Gilula et al. 2006), common individual characteristics (Feit et al. 2007) andcommon latent constructs underlying the multiple data sets (Hui et al. 2008a).
We encourage researchers to identify unique sources of data that could improveour ability to measure consumers’ preferences and to develop methods to overcomethe difficulties involved in combining multiple sources of data.
4 Model specification, estimation, and action
4.1 Taking social interactions into account
Preference measurement models have almost exclusively assumed that consumersmake choices independently of one another. Some noteworthy exceptions includeRao and Steckel (1991) who studied the polarizing effects of group decision making,Arora and Allenby (1999) who modeled decisions made jointly by husbands andwives, and Ding and Eliashberg (2007) who proposed formal models of multi-partydecision-making and applied them to choices of pharmaceutical prescriptions bydoctors and patients. Recent research in marketing has continued to highlight andillustrate the importance of social interactions in consumption and choices (e.g.,Godes and Mayzlin 2004; Goldenberg et al. 2002). We believe that capturing suchinteractions more systematically in preference measurement is an important area forfuture research.
4.2 Meta-attributes
Preferences are often modeled and estimated in the space defined by productattributes and levels. Working in this space makes the translation of consumerpreferences into engineering terms easier. However, consumers often think in termsof “meta-attributes” such as needs, motivations, and goals, which may correspond tobundles of physical product attributes. There are several advantages to working inmeta-attribute spaces. First, if consumers indeed evaluate products according tometa-attributes, the preference measurement task may become more natural. Second,using dimensions like goals and needs, which are the true drivers of decisionmaking, is likely to lead to better preference measurement. Finally, needs,motivation, and goals are likely to be more stable over time than preferences forspecific product attributes (e.g., consumers may have stable preference for fastercomputers, but their preference for a specific processor may change over time astechnology evolves). While working with meta-attributes may be beneficial,identifying and constructing meta-attributes can prove to be difficult. Methods suchas factor analysis may provide some insights but lack the fundamental ability tocreate maps between physical attributes and meta-attributes. The challenge offinding these maps is confounded with issues of language that could be used todescribe meta-attributes. Text mining of consumer-written product reviews (Lee andBradlow 2008) is a potentially valuable tool for automating the process of
Market Lett (2008) 19:337–354 345
identifying the language consumers use to describe products. Furthermore, thetranslation between meta-attributes defined in consumer language and engineeringspecifications used in product design may not be straightforward.
A few successful attempts to integrate meta-attributes in preference measurementinclude Luo et al. (2008) who incorporated meta-attributes such as “comfort” and“power” along with more objective characteristics. In the context of recommendationagents, De Bruyn et al. (2008) used tree-based methods combined with higher level“ask-once” questions to group consumers, suggesting that meta-attributes may berelated to and identified with “ask-once” questions in online or offline recommen-dations. Ghose and Rao (2007) tackled directly the topic of how one could constructand utilize meta-attributes in the context of conjoint analysis. We hope to see morework along these lines in the future.
4.3 More flexible utility functions
Preference measurement has typically assumed linear and additive utility functions.An increasing number of papers have explored utility functions that deviate fromthese assumptions. For example, Kim et al. (2007) modeled preferences usingBayesian splines with endogenous knot configurations, finding hold-out choiceprediction improvement in the 10–20% range. Ben-Akiva et al. (2002) proposed ahybrid choice model that integrates many types of discrete choice modelingmethods, draws on different types of data, and allows the explicit modeling oflatent psychological explanatory variables. Other researchers have explored non-compensatory utility functions. Yee et al. (2008) and Kohli and Jedidi (2007)proposed dynamic programming methods to estimate lexicographic preferencestructures. Non-compensatory processes seem particularly relevant in the context ofconsideration sets. Gilbride and Allenby (2004) modeled a two stage process inwhich the first stage consists of a (potentially) non-compensatory screening ofalternatives and the second stage of a compensatory choice among the remainingalternatives. They estimated their model using hierarchical Bayes methods,augmenting the latent consideration sets within their MCMC approach. Jedidi andKohli (2005) introduced subset-conjunctive screening rules, which generalizedisjunctive and conjunctive rules. Non-compensatory decision process may beviewed as the result of simplifying heuristics used by boundedly rational consumersduring the preference measurement task. For example, Kim (2004) used a Bayesianhidden Markov model to describe changes in individual consumers’ latent choiceheuristics over time.
We hope that future work in this area will enhance the ecological rationality ofpreference measurement models, i.e., will improve the fit between the structuralproperties of the model and the structure of the environment to which it is applied.
4.4 Incorporating behavioral effects
The process of data collection in preference measurement often involves a sequenceof choices, ranking, ratings, or tradeoffs between attributes and/or products. Much ofthe research in Behavioral Decision Theory has been focused on studying contextand other behavioral effects that may be prevalent when consumers are making such
346 Market Lett (2008) 19:337–354
decisions. Therefore, it is surprising that only a handful of studies have attempted totest and apply the battery of robust and significant behavioral effects documented inthe consumer behavior literature to preference measurement.
Some of the early work on incorporating behavioral effects into preferencemeasurement explored the effect of the number of attribute levels on the perceivedattribute importances (Wittink et al. 1989). The authors suggested that researchersshould try to keep the number of attribute levels similar across attributes to avoidbiases. Bradlow et al. (2004) investigated and modeled the behavioral effects causedby omitting product attributes in partial profile designs. A few studies have alsoattempted to model context effects in preference measurement. Kivetz et al. (2004a)proposed several choice models that could capture the well-known compromiseeffects given a set of partworths collected using alternative preference measurementtasks. In a follow-up paper, the authors suggested that their models could captureadditional context effects such as asymmetric dominance, attraction, and detraction(Kivetz et al. 2004b). Haaijer et al. (1998) proposed a flexible covariance matrix thatcould potentially capture context effects in choice-based conjoint analysis. The paperby Adamowicz et al. (2008), appearing in the current issue of the journal, provides adetailed overview of behavioral effects in choice modeling.
One of the difficulties involved with studying behavioral effects in preferencemeasurement is that one cannot claim that a model describes behavior better thananother model based on superior fit or predictive ability only. In particular, morecomplex models naturally tend to fit better and can often predict worse (due topotential overfitting). Therefore, many factors may influence fit and predictiveability, beyond the accuracy of the behavioral assumptions made by the model.Claiming that a model is isomorphic to the true underlying decision process (i.e., itactually captures the underlying behavior) seems to require exogenous manipu-lations and/or a set of process measures. Otherwise, a model may only be shown tobe paramorphic to the true underlying decision process (i.e., it gives rise to similaroutcomes).
Nevertheless, we believe that with the increase in the number of contact pointsbetween firms and consumers, and therefore in the number of ways in whichpractitioners may influence the choice process, consumer psychology is morerelevant than ever to preference measurement from a managerial perspective. Froman academic perspective, we hope to see a two-way exchange between thepreference measurement and consumer psychology community. Psychologists cansuggest behavioral effects that may improve the accuracy of preference measurementwhile preference measurement researchers in turn can develop new methods formeasuring and testing alternative behavioral effects.
4.5 Modeling learning, dynamics and preference formation
Most preference measurement models assume that consumers have well-defined andstable preferences. The above discussion suggests that preferences may not be wellformed and may be influenced by the task itself and by its context. Furthermore, ifpreferences are not well formed we are likely to observe dynamics throughout thepreference measurement task as a result of preference formation, learning or fatigue.DeSarbo et al. (2005) and Liechty et al. (2005) proposed models that allow the
Market Lett (2008) 19:337–354 347

partworth estimates to vary throughout the preference measurement task using adynamic random effects model. Su and Rao (2007) studied the evolution ofwillingness to pay for different types of attributes and how such changes affect newproduct adoption. Many of the flexible models developed to capture dynamics inrepeated choice (e.g., Kim et al. 2005; Lachaab et al. 2006) could be applied topreference measurement. Bradlow et al. (2004) take a first step in understanding theantecedents of dynamics by studying consumer learning about preferences formissing attribute levels in a partial profile design. We join Bradlow (2005) in the callfor more work attempting to disentangle the different sources of dynamic effects inpreference measurement.
4.6 Recent tools for estimation
The standard estimation method for conjoint analysis has become hierarchical Bayes(Lenk et al. 1996; Rossi and Allenby 2003). Although this estimation method hasbeen researched extensively, it continues to be an exciting research area. Forexample, Sonnier et al. (2007) showed that specifying a normal heterogeneitydistribution on the parameters of the multinomial logit model implies a distributionon willingness-to-pay that has substantial mass in the tail, leading to extremebehavior for some individuals. This suggests that prior or heterogeneity distributionsshould be specified on meaningful quantities (e.g., willingness-to-pay) instead of onlatent constructs, like partworths.
An alternative approach to conjoint estimation is based on optimization. Thisapproach has a long history, starting with the Linmap method of Srinivasan andShocker (1973a, b). More recently, Toubia et al. (2003) and Toubia et al. (2004)proposed polyhedral methods for conjoint estimation and questionnaire designs.These methods are based on interpreting the answer to each conjoint question as aconstraint on the respondent’s partworths. Toubia et al. (2007b) and Vadali et al.(2007) generalized the polyhedral methods to capture response error and informativepriors on the parameters. Evgeniou et al. (2005), Cui and Curry (2005) and Evgeniouet al. (2007) proposed conjoint estimation methods based on machine learning andstatistical learning theory. The method of Evgeniou et al. (2007) has been shown tooutperform, in some cases, hierarchical Bayes in estimation accuracy and predictiveability. The two methods are comparable conceptually, with the fundamentaldifference that all parameters are endogenous in the machine learning method ofEvgeniou et al. (2007) while some parameters are typically set exogenously inhierarchical Bayes (e.g., the hyperparameters). Finally, Toubia et al. (2007a) showedthat many optimization methods for conjoint estimation may be integrated within theframework of statistical learning theory.
One of the current limitations of optimization-based methods is that they producepoint estimates, whereas likelihood-based methods such as hierarchical Bayesprovide full distributions on the parameter estimates. While Evgeniou et al. (2007)illustrated a bootstrapping approach to obtaining confidence intervals for theirmethod, we believe that future research may explore alternative approaches to allowstatistical inference and hypothesis testing for optimization-based methods. Moregenerally, a fundamental challenge that we hope will be addressed in future researchis linking optimization-based methods with likelihood-based methods. For example,
348 Market Lett (2008) 19:337–354
Toubia et al. (2007b) and Vadali et al. (2007) gave a likelihood interpretation ofpolyhedral methods. Bridging the likelihood-based and optimization-basedapproaches may benefit both approaches. For example, Evgeniou et al. (2007)showed an example of how principles from statistical learning theory may be used tosignificantly improve the estimation accuracy and predictive ability of hierarchicalBayes estimation.
4.7 From model to action
Parameter estimation is often thought of as the final stage of a preferencemeasurement study. However, at the conclusion of a study, it is imperative to comeback to the original problem that motivated the study and ensure that a solution isprovided to that problem. Some of the key decisions in marketing are those ofoptimal product design and product line optimization (Dobson and Kalish 1993;Green and Krieger 1985; Kohli and Sukumar 1990; McBride and Zufryden 1988).Recently, Luo et al. (2005) proposed an approach that takes into account variationsin the conditions under which the product will be used, and introduced the conceptof “robust product design,” which offers excellent performance under worst-casevariations and low sensitivity to variations. Recent models in the area of product lineoptimization have also emerged from engineering, using detailed physical models todetermine which products can be produced (Michalek et al. 2005; Wassenaar et al.2005). These models combine innovative ways to define feasibility constraints withtailored optimization algorithms. For example, Michalek et al. (2007) used analyticaltarget cascading (ATC) to formally coordinate models from marketing andengineering, and design “optimal” marketing-based products and product lines thatare technically feasible.
Beyond product line optimization, we believe that the managerial relevance andimpact of preference measurement studies may be enhanced by systematicallymodeling the Bayesian-decision theoretic loss function of the stakeholder (company,consumers, policy makers, etc.), and providing decision support tools for identifyingthe action that will minimize this loss function over the entire posterior distributionof the parameters being estimated. Currently, most preference measurement studiesare used to produce point estimates of some parameters such as partworths.However, basing decisions on point estimates is suboptimal, as decisions should bebased on the expected loss across the entire posterior distribution of the estimates(Chaloner and Verdinelli 1995). For example, Blattberg and George (1992) showedthat incorporating the manufacturer’s profit-maximizing goal into the Bayesian lossfunction leads to smaller price-sensitivity estimates and higher optimal prices. Notethat in some of the new domains of application identified earlier in this paper, theloss function may take very different forms from that of a profit-maximizing firm.For example, the appropriate loss function for a recommendation agent may includeboth the utility derived by the consumer from the recommended product and theeffort spent by the consumer throughout his or her interactions with the agent. Giventhe fact that Bayesian Decision Theory involves integrating over posteriordistributions, we believe that there is an opportunity to construct decision supporttools that will simplify the choice of actions, based on the output of the preferencemeasurement study and all other relevant information.
Market Lett (2008) 19:337–354 349
5 In conclusion...“every generation needs a new revolution”2
Preference measurement is a very exciting and active field that goes well beyondconjoint analysis. We proposed a framework consisting of three interrelatedcomponents for approaching this field. We have summarized some cutting edgeresearch and identified fruitful directions for future research pertaining to theframework’s three components, and to their mutual integration. The past twodecades have seen great advances in conjoint analysis through the use ofcomputerized adaptive questionnaires and the development of new estimationmethods that account for consumer heterogeneity. Moving forward, we encourageresearchers to go beyond conjoint analysis and explore new problems andapplications of preference measurement, develop new forms of data collection thatengage and entice respondents, take advantage of the availability of new sources ofdata, model new phenomena such as behavioral effects and dynamics, and combinestatistical and optimization methods to improve estimation. Moreover, we encourageresearchers to take into account the objectives and context of the preferencemeasurement study throughout each step of the process.
Acknowledgments The authors would like to thank the SEI Center for Advanced Studies inManagement at Wharton for partially supporting this research and for supporting the 7th TriennialChoice Conference held at the Wharton School. The first two authors (session co-chairs) and the third tothe 12th authors are listed alphabetically.
References
Adamowicz, W., Bunch, D., Cameron, T.-A., Dellaert, B. G. C., Hanneman, M., Keane, M., et al. (2008).Behavioral frontiers in choice modeling.Marketing Letters, DOI 10.1007/s11002-008-9038-1.
Addelman, S. (1962). Symmetrical and asymmetrical fractional factorial plans. Technometrics, 4, 47–58(February).
Adomavicius, G., & Tuzhilin, A. (2005). Toward the next generation of recommender systems: a survey ofthe state-of-the-art and possible extensions. IEEE Transactions on Knowledge and Data Engineering,15(6), 734–749.
Amaldoss, W., Ho, T.-H., Krishna, A., Chen, K.-Y., Desai, P., Iyer, G., et al. (2008). Experiments onstrategic choices and markets. Marketing Letters, DOI 10.1007/s11002-008-9040-7.
Ansari, A., Essegaier, S., & Kohli, R. (2000). Internet recommendation systems. Journal of MarketingResearch, 37, 363–375 (August).
Arora, N., & Allenby, G. (1999). Measuring the influence of individual preference structures in groupdecision making. Journal of Marketing Research, 36(4), 476–487.
Arora, N., Ghose, A., Hess, J. D., Iyengar, R., Jing, B., Joshi, Y., et al. (2008). Putting one-to-onemarketing to work: Personalization, customization and choice. Marketing Letters, in press.
Ben-Akiva, M., Bradley, M., Morikawa, T., Benjamin, J., Novak, T. P., Thomas, P., et al. (1994).Combining revealed and stated preference data. Marketing Letters, 5(4), 335–350.
Ben-Akiva, M., McFadden, D., Train, K., Walker, J., Bhat, C., Bierlaire, M., et al. (2002). Hybrid choicemodels, progress and challenges. Marketing Letters, 13(3), 163–175.
Blattberg, R. C., & George, E. I. (1992). Estimation under profit-driven loss functions. Journal of Businessand Economic Statistics, 10, 437–444.
Bleichrodt, H., & Pinto, J. L. (2000). A parameter-free elicitation of the probability weighting function inmedical decision analysis. Management Science, 46(11), 1485–1496.
2 Thomas Jefferson.
350 Market Lett (2008) 19:337–354
Bradlow, E. T. (2005). Current issues and a wish-list for conjoint analysis. Applied Stochastic Models inBusiness and Industry, 4–5, 319–323.
Bradlow, E. T., Hu, Y., & Ho, T.-H. (2004). A learning-based model for imputing missing levels in partialconjoint profiles. Journal of Marketing Research, 41(4), 369–381.
Cattin, P., & Wittink, D. R. (1982). Commercial use of conjoint analysis: a survey. Journal of Marketing,46(3), 44–53.
Chaloner, K., & Verdinelli, I. (1995). Bayesian experimental design: a review. Statistical Science, 10(3),273–304.
Cui, D., & Curry, D. (2005). Prediction in marketing using the support vector machine. MarketingScience, 24(4), 595–615.
Dahan, E. (2007). Conjoint adaptive ranking database system. Working paper, University of California atLos Angeles.
Dahan, E., & Hauser, J. R. (2002). The virtual customer. Journal of Product Innovation Management, 19,332–353.
Dahan, E., Lo, A., Poggio, T., Chan, N., & Kim, A. (2007a). Securities trading of concepts (STOC).Working paper, University of California at Los Angeles.
Dahan, E., Soukhoroukova, A., & Spann, M. (2007b). Preference markets: Organizing securities marketsfor opinion surveys with infinite scalability. Working paper, University of California at Los Angeles.
Dahan, E., & Srinivasan, V. (2000). The predictive power of internet-based product concept testing usingvisual depiction and animation. Journal of Product Innovation Management, 17, 99–109 March.
De Bruyn, A., Liechty, J. C., Huizingh, E. K. R. E., & Lilien, G. L. (2008). Offering onlinerecommendations with minimum customer input through conjoint-based decision aids. MarketingScience, in press.
DeSarbo, W., Fong, D. K. H., Liechty, J. C., & Coupland, J. C. (2005). Evolutionary preferences/utilityfunctions: a dynamic perspective. Psychometrika, 70(1), 179.
Ding, M. (2007). An incentive-aligned mechanism for conjoint analysis. Journal of Marketing Research,44, 214–223 (May).
Ding, M., & Eliashberg, J. (2007). A dynamic competitive forecasting model incorporating dyadicdecision-making. Management Science, 54, 820–834.
Ding, M., Grewal, R., & Liechty, J. (2005). Incentive-aligned conjoint analysis. Journal of MarketingResearch, 42, 67–82 (February).
Dobson, G., & Kalish, S. (1993). Heuristics for pricing and positioning a product-line using conjoint andcost data. Management Science, 7(2), 107–125.
Erdem, T., Keane, M., Öncü, S., & Strebel, J. (2005). Learning about computers: an analysis ofinformation search and technology choice. Quantitative Marketing and Economics, 3(3), 207–247.
Evgeniou, T., Boussios, C., & Zacharia, G. (2005). Generalized robust conjoint estimation. MarketingScience, 24(3), 415–429.
Evgeniou, T., Pontil, M., & Toubia, O. (2007). A convex optimization approach to modeling consumerheterogeneity in conjoint estimation. Marketing Science, 26(6), 805–818.
Fehr, E., & Goette, L. (2007). Do workers work more if the wages are higher: evidence from a randomizedfield experiment. The American Economic Review, 97(1), 298–317.
Feit, E. M., Beltramo, M. A., & Feinberg, F. M. (2007). Combining survey and market data to enhanceconsumer preference models. Working paper, University of Michigan.
Gensler, S., Theysohn, S., Hinz, O., & Skiera, B. (2007). Individually adjusted choice-based conjointanalysis. Working paper, Frankfurt University, Germany.
Gilbride, T. J., & Allenby, G. M. (2004). A choice model with conjunctive, disjunctive, and compensatoryscreening rules. Marketing Science, 23(3), 391–406.
Gilbride, T. J., Lenk, P. J., & Brazell, J. D. (2006). Market share constraints and the loss function in choicebased conjoint analysis. Working paper, University of Notre Dame.
Gilula, Z., McCulloch, R. E., & Rossi, P. E. (2006). A direct approach to data fusion. Journal ofMarketing Research, 43(1), 73–83.
Ghose, S., & Rao, V. R. (2007). A choice model of bundles features and meta-attributes: An application toproduct design. Working paper, Cornell University.
Godes, D., & Mayzlin, D. (2004). Using online conversations to study word-of-mouth communication.Marketing Science, 23(4), 545–560.
Goldenberg, J., Libai, B., & Muller, E. (2002). Riding the saddle: How cross-market communications cancreate a major slump in sales. Journal of Marketing, 66(2), 1–16.
Gonzalez, R., & Wu, G. (1999). On the shape of the probability weighting function. Cognitive Psychology,38, 129–166.
Market Lett (2008) 19:337–354 351
Green, P. E., Goldberg, S. M., & Montemayor, M. (1981). A hybrid utility estimation model for conjointanalysis. Journal of Marketing, 45, 33–41 (Winter).
Green, P. E., & Krieger, A. M. (1985). Models and heuristics for product line selection. MarketingScience, 4(1), 1–19.
Green, P. E., Krieger, A. M., & Bansal, P. (1988). Completely unacceptable levels in conjoint analysis: acautionary note. Journal of Marketing Research, 25, 293–300 (August).
Green, P. E., & Rao, V. R. (1971). Conjoint measurement for quantifying judgmental data. Journal ofMarketing Research, 8, 355–363.
Green, P. E., & Srinivasan, V. (1990). Conjoint analysis in marketing: New developments withimplications for research and practice. Journal of Marketing Research, 54, 3–19 (October).
Gustafsson, A., Herrmann, A., & Huber, F. (2007). Conjoint measurement: Methods and applications (4thed.). Berlin: Springer Verlag.
Haaijer, M. E., Kamakura, W. A., & Wedel, M. (2000). Response latencies in the analysis of conjointchoice experiments. Journal of Marketing Research, 37(3), 376–382.
Haaijer, R., Wedel, M., Vriens, M., & Wansbeek, T. (1998). Utility covariances and context effects inconjoint MNP models. Marketing Science, 17(3), 236–252.
Häubl, G., & Murray, K. B. (2003). Preference construction and preference in digital marketplaces: Therole of electronic recommendation agents. Journal of Consumer Psychology, 13, 75–91.
Häubl, G., & Trifts, V. (2000). Interactive decision aids. Marketing Science, 19(1), 4–21.Horsky, D., Misra, S., & Nelson, P. (2006). Observed and unobserved preference heterogeneity in brand-
choice models. Marketing Science, 25(4), 322–335.Hui, S. K., Bradlow, E. T., & Fader, P. S. (2008a). An integrated model of grocery store shopping path and
purchase behavior. Working paper, The Wharton School, University of Pennsylvania.Hui, S. K., Fader, P. S., & Bradlow, E. T. (2008b). Path data in marketing: An integrative framework and
prospectus for model-building. Marketing Science, in press.Iyengar, R., Jedidi, K., & Kohli, R. (2008). A conjoint approach to multi-part pricing. Journal of
Marketing Research, 45(2), 195–210.Jarnebrant, P., Toubia, O., & Johnson, E. J. (2008). The silver lining effect: Formal analysis and
experiments. Working paper, Columbia Business School.Jedidi, K., & Kohli, R. (2005). Probabilistic subset-conjunctive models for heterogeneous consumers.
Journal of Marketing Research, 42(4), 483–494.Johnson, R. M. (1987). Adaptive conjoint analysis. In: Sawtooth Software Conference Proceedings,
Ketchum, ID: Sawtooth Software, July, 253–265.Johnson, J., Tellis, G. J., & MacInnis, D. J. (2005). Losers, winners and biased trades. Journal of
Consumer Research, 32(2), 324–329.Kahneman, D., & Tversky, A. (1979). Prospect theory: An analysis of decision under risk. Econometrica,
47(2), 263–292.Kim, J. G. (2004). Dynamic heterogeneous choice heuristics: A Bayesian hidden Markov mixture model
approach. Working Paper, MIT Sloan School of Management.Kim, J. G., Menzefricke, U., & Feinberg, F. M. (2005). Modeling parametric evolution in a random utility
framework. Journal of Business and Economic Statistics, 23(5), 282–294.Kim, J. G., Menzefricke, U., & Feinberg, F. M. (2007). Capturing flexible heterogeneous utility curves:
Bayesian spline approach. Management Science, 53(2), 340–354.Kivetz, R., Netzer, O., & Srinivasan, V. (2004a). Alternative models for capturing the compromise effect.
Journal of Marketing Research, 41(3), 237–257.Kivetz, R., Netzer, O., & Srinivasan, V. (2004b). Extending compromise effect models to complex buying
situations and other context effects. Journal of Marketing Research, 41(3), 262–268.Kohli, R., & Jedidi, K. (2007). Representation and inference of lexicographic preference models and their
variants. Marketing Science, 26(3), 380–399.Kohli, R., & Sukumar, R. (1990). Heuristics for product-line design using conjoint analysis. Management
Science, 36(12), 1464–1478.Kuhfeld, W. F., Tobias, R. D., & Garratt, M. (1994). Efficient experimental design with marketing
applications. Journal of Marketing Research, 31(4), 545–557.Lachaab, M., Ansari, A., Jedidi, K., & Trabelsi, A. (2006). Modeling preference evolution in discrete
choice models: a Bayesian state-space approach. Quantitative Marketing and Economics, 4, 57–81.Lee, T. Y., & Bradlow, E. T. (2008). Automatic construction of conjoint attributes and levels from online
customer reviews. Working paper, The Wharton School, University of Pennsylvania.Lenk, P. J., DeSarbo,W. S., Green, P. E., &Young,M. R. (1996). Hierarchical Bayes conjoint analysis: recovery
of partworth heterogeneity from reduced experimental designs. Marketing Science, 15(2), 173–91.
352 Market Lett (2008) 19:337–354
Liechty, J. C., Fong, D. K. H., & DeSarbo, W. S. (2005). Dynamic models incorporating individualheterogeneity: utility evolution in conjoint analysis. Marketing Science, 24(2), 285–293.
Liechty, J., Pieters, R., & Wedel, M. (2003). Global and local covert visual attention: evidence from aBayesian hidden Markov model. Psychometrika, 68, 519–542.
Liechty, J., Ramaswamy, V., & Cohen, S. H. (2001). Choice menus for mass customization: anexperimental approach for analyzing customer demand with an application to a web-basedinformation service. Journal of Marketing Research, 38(2), 183–196.
Louviere, J. J., Meyer, R. J., Bunch, D. S., Carson, R., Dellaert, B., Hanemann, M., et al. (1999).Combining sources of preference data for modeling complex decision processes. Marketing Letters,10(3), 187–204.
Luo, L., Kannan, P. K., Besharati, B., & Azarm, S. (2005). Design of robust new products undervariability: marketing meets design. Journal of Product Innovation Management, 22, 177–192.
Luo, L., Kannan, P. K., & Ratchford, B. (2008). Incorporating subjective characteristics in product designand evaluations. Journal of Marketing Research, 45(2), 182–194.
Marshall, P., & Bradlow, E. T. (2002). A unified approach to conjoint analysis models. Journal of theAmerican Statistical Association, 97(459), 674–682.
McBride, R., & Zufryden, F. S. (1988). An integer programming approach to the optimal product lineselection problem. Marketing Science, 7(2), 126–140.
Michalek, J. J., Feinberg, F. M., Ebbes, P., Adigüzel, F., & Papalambros, P. Y. (2007). Optimal feasibleproduct line design for heterogeneous markets. Working paper, Department of MechanicalEngineering, Carnegie-Mellon University.
Michalek, J. J., Feinberg, F. M., & Papalambros, P. Y. (2005). Linking marketing and engineering productdesign decisions via analytical target cascading. Journal of Product Innovation Management, 22, 42–62.
Netzer, O., Schrift, R., & Toubia, O. (2008). Modeling and exploiting response time in conjoint analysis.Working paper, Columbia Business School.
Netzer, O., & Srinivasan, V. (2008). Adaptive self-explication of multi-attribute preferences. Workingpaper, Columbia Business School.
Otter, T., Allenby, G. M., & van Zandt, T. (2008). An integrated model of choice and response time withapplications to conjoint analysis. Journal of Marketing Research, in press.
Park, Y. H., Ding, M., & Rao, V. R. (2008). Eliciting preference for complex products: A web-basedupgrading method. Journal of Marketing Research, in press.
Parker, B. R., & Srinivasan V. (1976). A consumer preference approach to the planning of rural primaryhealth-care facilities. Operations Research, 24(5), 991–1025.
Prelec, D. (1998). The probability weighting function. Econometrica, 66(3), 497–527.Prelec, D. (2001). A two-person scoring rule for subjective reports. Working Paper, Center for Innovation
in Product Development, Cambridge, MA, Massachusetts Institute of Technology.Rao, V. R., & Steckel, J. H. (1991). A polarization model for describing group preferences. Journal of
Consumer Research, 18(1), 108–118.Rossi, P. E., & Allenby, G. M. (2003). Bayesian statistics and marketing.Marketing Science, 22(3), 304–328.Saigal, C., Dahan, E., & Cumberland, W. (2007). Measuring prostate cancer treatnment preferences with
standard gambles, time tradeoffs and conjoint analysis. NIH Research Proposal.Sandor, Z., & Wedel, M. (2001). Designing conjoint choice experiments using managers prior beliefs.
Journal of Marketing Research, 38, 430–444.Sandor, Z., & Wedel, M. (2005). Heterogeneous conjoint choice designs. Journal of Marketing Research,
42, 210–218.Sonnier, G., Ainslie, A., & Otter, T. (2007). Heterogeneity distributions of willingness-to-pay in choice
models. Quantitative Marketing and Economics, 5(3), 313–331.Srebro, N., Rennie, J. D. M., & Jaakkola, T. (2005). Maximum margin matrix factorization. Advances In
Neural Information Processing Systems, 17.Srinivasan, V. (1988). A conjunctive-compensatory approach to the self-explication of multiattributed
preferences. Decision Sciences, 19, 295–305 (Spring).Srinivasan, V., Lovejoy, W. S., & Beach, D. (1997). Integrated product design for marketability and
manufacturing. Journal of Marketing Research, 34(1), 154–163.Srinivasan, V., & Shocker, A. D. (1973a). Linear programming techniques for multidimensional analysis
of preferences. Psychometrika, 38(3), 337–369.Srinivasan, V., & Shocker, A. D. (1973b). Estimating the weights for multiple attributes in a composite
criterion using pairwise judgments. Psychometrika, 38(4), 473–493.Su, M., & Rao, V. R. (2007). Evolution in willingness to pay at attribute level and its impact on new
product adoption: a continuous conjoint analysis. Working paper, Cornell university.
Market Lett (2008) 19:337–354 353
Tanaka, T., Camerer, C. F., & Nguyen, Q. (2007). Risk and time preferences: experimental and householdsurvey data from Vietnam. Working paper, California Institute of Technology.
Ter Hofstede, F., Kim, Y., & Wedel, M. (2002). Bayesian prediction in hybrid conjoint analysis. Journal ofMarketing Research, 34(2), 253–261.
Toubia, O., & Hauser, J. R. (2007). On managerially efficient experimental designs. Marketing Science, 26(6), 851–858.
Toubia, O., Evgeniou, T., & Hauser, J. R. (2007a). Optimization-based and machine-learning methods forconjoint analysis: estimation and question design. In A. Gustafsson, A. Herrmann, & F. Huber (Eds.),Conjoint measurement: Methods and applications(4th ed.). Berlin: Springer Verlag.
Toubia, O., Hauser, J. R., & Garcia, R. (2007b). Probabilistic polyhedral methods for adaptive choice-based conjoint analysis: Theory and application. Marketing Science, 26(5), 596–610.
Toubia, O., Hauser, J. R., & Simester, D. (2004). Polyhedral methods for adaptive choice based conjointanalysis. Journal of Marketing Research, 41(1), 116–131.
Toubia, O., Simester, D., Hauser, J. R., & Dahan, E. (2003). Fast polyhedral conjoint estimation.Marketing Science, 22(3), 274–303.
Tversky, A., & Kahneman, D. (1992). Advances in prospect theory: cumulative representation ofuncertainty. Journal of Risk and Uncertainty, 5(4), 297–323.
Vadali, S., Liechty, J., & Rangaswamy, A. (2007). Generalized hierarchical Bayes estimation forpolyhedral conjoint analysis. Working Paper, Pennsylvania State University.
von Hippel, E., & Katz, R. (2002). Shifting innovation to users via toolkits. Management Science, 48(7),821–833.
Wassenaar, H. J., Chen, W., Cheng, J., & Sudjianto, A. (2005). Enhancing discrete choice demandmodeling for decision-based design. ASME Journal of Mechanical Design, 127(4), 514–523.
Wind, J., Green, P. E., Shifflet, D., & Scarbrough, M. (1989). Courtyard by Marriott: designing a hotelfacility with consumer-based marketing models. Interfaces, 19, 25–47.
Wittink, D. R., & Cattin, P. (1989). Commercial use of conjoint analysis: an update. Journal of Marketing,53(3), 91–96.
Wittink, D. R., Krishnamurthi, L., & Reibstein, D. J. (1989). The effect of differences in the number ofattribute levels on conjoint results. Marketing Letters, 1, 113–123.
Yee, M., Dahan, E., Hauser, J. R., & Orlin, J. (2008). Greedoid-based noncompensatory inference.Marketing Science, 26(4), 532–549.
Ying, Y., Feinberg, F. M., & Wedel, M. (2006). Leveraging missing ratings to improve onlinerecommendation systems. Journal of Marketing Research, 43(3), 355–365.
354 Market Lett (2008) 19:337–354