beulah reservoir minimum pool and prey base … · beulah reservoir minimum pool and prey base...
TRANSCRIPT

Beulah Reservoir Minimum Pool and Prey Base Studies 2010 – 2013: Part 2 Bioenergetics, Population Sustainability
Prepared for: Bureau of Reclamation, Snake River Area Office, Boise, Idaho
U.S. Department of the Interior Bureau of Reclamation June 2015

U.S. DEPARTMENT OF THE INTERIOR
PROTECTING AMERICA’S GREAT OUTDOORS AND POWERING OUR FUTURE
The U.S. Department of the Interior protects America’s natural resources and heritage, honors our cultures and tribal communities, and supplies the energy to power our future.
MISSION OF THE BUREAU OF RECLAMATION
The mission of the Bureau of Reclamation is to manage, develop, and protect water and related resources in an environmentally and economically sound manner in the interest of the American public.
Front cover photograph – Beulah Reservoir

Beulah Reservoir Minimum Pool and Prey Base Studies 2010 – 2013: Part 2 Bioenergetics, Population Sustainability
Bureau of Reclamation Technical Service Center Fisheries and Wildlife Resources Group 86-68290
Prepared for: Snake River Area Office Boise, Idaho
Prepared by: Michael J. Horn, Ph.D., Manager, Fisheries and Wildlife Resources and Eric Best Fisheries Biologist
U.S. Department of the Interior Bureau of Reclamation June 2015


PEER REVIEW DOCUMENTATION
PROJECT AND DOCUMENT INFORMATION
Project Name -~B~e~u~lowh~R~csc;rv ...... ~o~j~rS~1~ud~i~es._ _____ wo1D A.J89F
Document Bwloh Reservoir Minimum Pool and Prey Base Studies 2010-2013: Part 2 Bioencmtics POlJulatjon Sus!l!jnabjli1y
Document Date June 20 IS
Tenm Leader Michpcl Hom. 86·6829Q. Supervisorv Bjologjst
Document Author(s)IPre.porer(s) Mjcbnel Hom Eric Best
Peer Reviewer Yyonnc Bemo!. Fisheries gnd Wjldljfc Rc:;ources Grouo 86-68290 Denver CO
Pm Reviewer Dimitri Yidergnr Fisheries Biologist. SRA-1211 Boise ID
REVIEW REQUIREMENT
Part A: Document Does Not Require Peer Review
Explain-------------------------------------
Part B: Document Requires Peer Review: SCOPE OF PEER REVIEW
Peer Review restricted 10 the followin& ltems/Section(s): Reviewer: Complete Document Subject to Review Yvonne Bem;JI
Comp!cte Documcnt Subicct to Rcyjew Pimitri Vjdcrgor
REVIEW CERTIFlCATlON
Peer Reviewer· I hove reviewed the assigned hems/Section(s) noted for the obove document and believe t requirements, stondords of the profession, ond Reclamation policy.
Reviewer: Yvonne Bemo! Review Dote: 6 hWs--'Signolur. . -.;J-~/-,~;t:;;:<~::::::'.:~,,..,,,:::~:_---Reviewer: __ .. P..,,irn.,.i..,tn.._· .... V,.jd..,e .. rq.,.o._r ____ Review Dote: 7/o 2/ tS
I have discussed the above document and review requirements with the Peer Reviewer and be!' ve that this review is completed, and that the document wiJI meet the requirements of the project.
Team Leader. MichAc! Hom Signature:


Beulah Reservoir Minimum Pool and Prey Base Studies 2010 – 2013 Part 2 Bioenergetics, Population Sustainability
Acronyms and Abbreviations
cm centimeter
g gram
HDX Half-duplex
kg kilogram
km kilometer
m meter
mm millimeters
NFMR North Fork of the Malheur River
Opinion USFWS 2005 Biological Opinion
PIT Passive integrated transponder
Reclamation U.S. Bureau of Reclamation
TL Total length
USFWS U.S. Fish and Wildlife Service
USGS U.S. Geological Survey


Beulah Reservoir Minimum Pool and Prey Base Studies 2010 – 2013 Part 2 Bioenergetics, Population Sustainability
Table of Contents
Acronyms and Abbreviations
1. Introduction .............................................................................................................. 1
2. Methods .................................................................................................................... 3
3. Results and Discussion ........................................................................................... 6
A. Field Results ................................................................................................... 6 B. Bioenergetics ................................................................................................ 13
4. Conclusions and Recommendations ................................................................... 21
5. Literature Cited ...................................................................................................... 24
List of Figures
Figure 1. Typical pattern of net sets during spring when reservoir was at its fullest. For more detail on netting locations see Prey Base report. .............31
Figure 2. Typical fyke net set along shoreline of Beulah Reservoir. Lead line extends out from shore to net. This set is shallower than most, as most sets were t ypically selected to have just the top of the hoops exposed ................................................................................................32
Figure 3. Typical antenna installation. Job box and solar array can be seen in the background while left foreground shows antenna with tuning box attached to fence post. Second picture shows pair of antenna as strung across the inflow above Beulah Reservoir.. .....................................33
Figure 4. Reservoir s torage patterns in Beulah Reservoir s ince 1970. The lower panel shows water levels during the years of our study. Full pool elevation in Beulah Reservoir i s 59,900 acre-feet. .....................................36
Figure 5. Seasonal pattern of inflow temperatures to Beulah Reservoir as measured at the USGS gage, MABO upstream of Beulah Reservoir.. ...........37
Figure 6. Seasonal pattern of inflow temperatures to Beulah Reservoir as measured at the USGS gage, MABO upstream of Beulah Reservoir.. ...........38
Figure 7. Relative prey consumption for Bull Trout by biomass for all Bull Trout collected from Beulah R eservoir. ..............................................................39
Figure 8. Percent composition of fish prey in Bull Trout stomachs, frequency of occurrence. ............................................................................................40
i

Beulah Reservoir Minimum Pool and Prey Base Studies 2010 – 2013 Part 2 Bioenergetics, Population Sustainability
Table of Contents (continued)
Figure 9. Estimated size at age based on scale analyses for Bull Trout captured from Beulah Reservoir............................................................................ 42
Figure 10. Bull Trout K factor across three years of study. Top panel is K factor for spring samples. These fish have overwintered in Beulah Reservoir. Bottom panel is for fish captured in the fall having summered in the upper watershed upstream of Beulah Reservoir. ............. 44
Figure 11. Pit tag detections at the antenna station just upstream of Beulah Reservoir depicting the time span each season fish were observed entering and exiting the reservoir. Most upstream and downstream migrations were observed to occur at night. ............................................ 45
Figure 12. Rainbow Trout population sampling for 6 sampling periods from spring 2011 through fall 2013 yielded population estimates of 5,375; 1,513; 3,757; 4,061; 1,657; and 1,849, respectively. Higher numbers of recaptures resulted in greater accuracy of overall population estimates following sampling during the spring of 2011. ........................... 46
Figure 13. Relative prey consumption for Rainbow Trout by biomass for all Rainbow Trout collected from Beulah Reservoir........................................ 48
Figure 14. Percent composition of fish prey in Rainbow Trout stomachs, frequency of occurrence......................................................................... 49
Figure 15. Fulton condition factor K of Rainbow Trout collected from Beulah Reservoir from 2011-2013. Top panel represents fish collected during the spring, and bottom panel represents those collected during fall surveys................................................................................................. 50
Figure 16. Data from one of two Bull Trout overwintering in Beulah Reservoir we recaptured. This fish was first captured on October 4, 2012, and recaptured on April 18, 2013. It left the reservoir of May11th, 2013. At time of first capture it weighed 539 grams and was 371 mm TL, at recapture it was 403 mm TL, and 650 grams. The figure below predicts that the growth pattern likely was using modeled data.. ............... 51
Figure 17. Data from the same Bull Trout overwintering in Beulah Reservoir. This fish was first captured on October 4, 2012, and recaptured on April 18, 2013. It left the reservoir of May11, 2013. Data here represents specific growth rate of Bull Trout as weight increase in grams per gram of predator weight......................................................... 52
ii

Beulah Reservoir Minimum Pool and Prey Base Studies 2010 – 2013 Part 2 Bioenergetics, Population Sustainability
Table of Contents (continued)
Figure 18. Data from one of two Bull Trout overwintering in Beulah Reservoir we recaptured. This fish was first captured on October 4, 2012, and recaptured on April, 18, 2013. It left the reservoir of May11, 2013. The graph shows modeled daily prey consumption for this fish based on its weight and what would be needed to support a fish of its size under the given temperature regime........................................................53
Figure 19. Data from one of two Bull Trout overwintering in Beulah Reservoir we recaptured. This fish was first captured on October 4, 2012, and recaptured on April, 18, 2013. It left the reservoir of May11, 2013.. ..........54
Figure 20. Daily reservoir total prey fish consumption by Bull Trout population of average weight fish of 400 g and population of size N. ..............................55
Figure 21. Seasonal cumulative prey fish consumption by Bull Trout population of average weight fish of 400 g and populations of size N in Beulah Reservoir.. .............................................................................................56
Figure 22. Modelled daily whole reservoir prey consumption by Rainbow Trout residing in Beulah Reservoir. Consumption estimates are based on populations estimates obtained through mark recapture for each time period. ..................................................................................................58
Figure 23. Modelled cumulative whole reservoir prey consumption by Rainbow Trout residing Beulah Reservoir. Consumption estimates are based on populations estimates obtained through mark recapture for each time period. ...........................................................................................59
Figure 24. Fall benthic dipteran density as a function of end of season water level in Beulah Reservoir during the period 2010-2013. .............................60
Figure 25. Phytoplankton biovolume and zooplankton biomass collected from Beulah Reservoir from fall 2010 through fall 2014. ....................................61
Figure 26. Hydroacoustic estimation of fish populations in Beulah Reservoir (black circles) vs net estimates (red circles) including data from 2006 to 2008 from Rose and Mesa’s 2013 USGS study.. ....................................62
Figure 27. Estimated prey fish populations in Beulah Reservoir represented as total biomass. Biomass was estimated by multiplying the average weight of each prey species, by their respective population sizes................63
iii

Beulah Reservoir Minimum Pool and Prey Base Studies 2010 – 2013 Part 2 Bioenergetics, Population Sustainability
Table of Contents (continued)
List of Tables
Table 1. Bioenergetics parameters used for the Bull Trout model (from Mesa et al. 2012). ......................................................................................... 34
Table 2. Bioenergetics parameters employed for Rainbow Trout growth in Beulah Reservoir (from van Poorten and Waters 2010) ............................... 35
Table 3. Estimated age and length–at-age for Bull Trout collected from Beulah Reservoir. ......................................................................................... 41
Table 4. Growth of PIT Tagged Bull Trout recaptured from Beulah Reservoir. Fish captured in April and again in October would have spent the summer higher in the watershed. The two October - April fish overwintered in Beulah Reservoir. ................................................. 43
Table 5. Estimated population biomass of Rainbow Trout in Beulah Reservoir from spring 2011 through the fall of 2013. Biomass estimates were generated using the average weight of trout captured multiplied by the estimated fish population. ................................... 47
Table 6. Growth data from recaptured Rainbow Trout in Beulah Reservoir. ............... 57
iv

Beulah Reservoir Minimum Pool and Prey Base Studies 2010 – 2013 Part 2 Bioenergetics, Population Sustainability
1. INTRODUCTION
Bull Trout (Salvelinus confluentus) are native to northwestern North America, extending from California north into Canada, and east to Montana and Alberta. The species was listed as threatened by the U.S. Fish and Wildlife Service (USFWS) in 1998 and 1999 (63 FR 31647; 64 FR 58910). Bull Trout are considered to be a cold water species and are temperature-dependent. They generally occur in interior drainages, but also occur in the Puget Sound. Bull Trout may be resident, fluvial, adfluvial, or anadromous. Recovery areas for Bull Trout populations have been divided into specific recovery units. The Upper Snake Recovery Unit, which includes the Malheur River basin in east central Oregon, was the focus of this study. Bull Trout in the Malheur River basin are further divided into two populations—the Upper Malheur and the North Fork of the Malheur River (NFMR)—that are geographically and reproductively isolated from each other (Buchanan, Hanson, and Hooton 1997). Historically, Bull Trout most likely used the entire Malheur River system, and summer habitat likely included most tributaries in the upper basin where there was cool water. Construction of dams early in the 20th century (Warm Springs Dam in 1919 and Agency Valley Dam in 1934) effectively isolated the populations. At this time, Bull Trout are not known to use Warm Springs Reservoir; however, Beulah Reservoir is critical to the North Fork Malheur population and provides important overwintering habitat for migratory fish. Fish use the tributaries in the entire watershed upstream of Beulah Reservoir on a seasonal basis for spawning, rearing, and as a temperature refugia.
In the NFMR, the Bull Trout population is restricted to Beulah Reservoir and the reach upstream of the reservoir. The reach downstream of Beulah Reservoir only contains an active channel during irrigation season, and temperatures become too warm to support fish later in the summer. Any fish entrained over the dam are essentially lost to the population (Schwabe et al. 2000); however, trap and haul efforts are completed as required by the USFWS during years of reservoir spill (USFWS 2005). Bull Trout spawning occurs in the NFMR mainstem upstream of Crane Crossing as well as many smaller tributaries including Horseshoe, Swamp, Elk, Little Crane, and Flat creeks. This encompasses about 100 kilometers (km) of habitat. Migration into the spawning areas usually occurs by late August, and spawning peaks in September. Redd counts and spawning surveys conducted since 1996 show there are an average of 202 spawning adults yearly, though there is substantial variability from year to year. In 1991 and 1992, there were estimated to be just over 4,000 age 1+ Bull Trout in the NFMR (Buchanan, Hanson, and Hooton 1997). Following spawning in late September and early October, fish again begin migrating back downstream. Migrants typically appear back in Beulah Reservoir around the beginning of November and reside there from fall through spring (Schwabe et al. 2000). Radio-tracking studies conducted in the late 1990s showed fish migrated out of Beulah Reservoir starting in April,
1

Beulah Reservoir Minimum Pool and Prey Base Studies 2010 – 2013 Part 2 Bioenergetics, Population Sustainability
with the last fish leaving by the beginning of June and migrating as far as 60 km upstream of the reservoir. Subadult rearing, adult habitat use, and foraging occur across the entire watershed, into and including Beulah Reservoir. However, during warm summer months the Little Malheur River may be the lower limit of habitat use due to increasingly warm water temperatures further downstream.
Recognizing the importance of Beulah Reservoir as a vital portion of the habitat used by migratory Bull Trout, several studies have focused directly on the reservoir itself, or movement of fish into and out of the reservoir. In 1998 and 1999, Schwabe et al. trapped and tagged Bull Trout from the reservoir and higher in the watershed and were able to determine the pattern of seasonal use of Beulah Reservoir by Bull Trout. Two separate groups of studies have focused on prey base investigations of Beulah Reservoir; one during the period of 2002 and 2003 (Petersen and Kofoot 2002; Petersen, Kofoot, and Rose 2003), and the other during 2006 through 2008 (Rose and Mesa 2007). Both groups of studies followed similar methodologies in that they 1) examined the population structure of the prey base in Beulah Reservoir, 2) examined the impacts of reservoir drawdown to the prey base and Bull Trout, 3) attempted to estimate populations of Bull Trout within the reservoir and, 4) in each case, applied a bioenergetics model to Bull Trout feeding.
In 2005, USFWS issued a biological opinion (Opinion) for Bull Trout with four terms and conditions for Beulah Reservoir. These terms and conditions included:
1. Reduce the frequency and extent of drawdown of Beulah Reservoir to help maintain a viable prey base, and work to identify a target minimum reservoir elevation;
2. Work to explore opportunities to support the prey base, when water levels cannot be maintained that would support the maintenance of an adequate prey base;
3. Work with the USFWS and other willing participants to implement mechanisms to reduce the anticipated take from reservoir drawdown; and
4. Continue efforts to trap and repatriate Bull Trout that have been entrained through Agency Valley Dam.
Two of the four terms and conditions (those regarding a minimum pool) expired on March 31, 2010. Because no minimum pool requirements currently exist, the reservoir has on occasion been reduced to run-of-the-river levels, which studies have shown may decimate forage fish populations in the short term and ultimately may have a negative impact to Bull Trout. Since the effects of drawdowns during previous studies were evaluated at only two levels – one moderate, one extreme which were not within the researchers’ control – Reclamation had insufficient data over a range of reservoir levels to make recommendations by March 31, 2010. Therefore, an extension was granted by the USFWS until April 30, 2015.
2

Beulah Reservoir Minimum Pool and Prey Base Studies 2010 – 2013 Part 2 Bioenergetics, Population Sustainability
The objectives of this study were to follow the same data collection approach used in the previous studies of Rose and Mesa (2007; 2009) to gain additional information on prey base dynamics as well as Bull Trout population size, reservoir usage, prey consumption, and the potential for competitive impacts from other species such as Rainbow Trout (Oncorhynchus mykiss). A key difference between our study and previous studies was an agreement with the irrigation district during the 3 years of our study to prevent the reservoir from being completely dewatered by maintaining at least 2,000 acre-feet of water at all times. Rainbow Trout were also consistently stocked to the reservoir during our study which may not always have been the case historically. By combining our data with those of previous studies, this study seeks to show whether there is a benefit to maintaining a minimum pool, and to provide the basis for a working discussion to set a potential minimum pool for Beulah Reservoir.
2. METHODS
Reservoir sampling for fish occurred during all 3 years of the study (2011, 2012, and 2013). Spring sampling began in late March to early-April and continued to mid-May. Fall sampling began in late September, continuing into mid-October. These time periods were selected to maximize the sampling effort when Bull Trout were likely present in the reservoir, and prior to or after time periods when climatic conditions may have limited the ability to sample.
Attempts were made to sample all available habitats and select different sites each time a region was sampled. The reservoir was divided into four quadrants that were sampled on a rotating basis (Figure 1). We used fyke and experimental gill nets for fish collection. Fyke nets were UV treated # 44 [0.6 centimeters (cm)] mesh with a 91-cm-high by 122-cm-wide rectangular conduit frame opening, five 91-cm-diameter steel hoops to hold the throat open and a 12-meter (m)-long center lead that extended to shore (Figure 2). Fyke nets were typically set in the afternoon, allowed to fish overnight, and pulled the following day. Experimental gill nets were 36.5 m long by 3.0 m deep made of monofilament and contained six, 6-m panels consisting of square mesh sizes of 8.9, 7.6, 6.3, 5.1, 3.8, and 2.5 cm. Gill nets generally were fished on the bottom during daylight hours for 30 minutes or less. A typical sampling day generally entailed pulling fyke nets and working up fish, then resetting fyke nets and fishing two gill nets for the remainder of the day (see prey base report for net locations).
Captured fish were measured [fork length millimeters (mm)], weighed [grams (g)]), and species recorded. For prey base studies, all smaller species were then caudal fin-clipped prior to release. All Rainbow Trout were flow-tagged prior to being released back to the reservoir, whereas all Bull Trout received a passive integrated transponder (PIT) tag injected
3

Beulah Reservoir Minimum Pool and Prey Base Studies 2010 – 2013 Part 2 Bioenergetics, Population Sustainability
into the dorsal sinus and had a sample of scales taken for age and growth analyses. Bull Trout under 300 mm received 12 mm half-duplex (HDX) tags and those over 300 mm received 23 mm HDX tags. For both species, stomachs were sampled using non-lethal gastric lavage methods. All contents were preserved in alcohol for later enumeration. Prior to gastric lavage, or PIT tagging and scale sampling, fish were lightly anesthetized by placing them in a tub of lake water with added Alka-Seltzer tablets. Population estimates for all species were completed using Schumacher-Eschmeyer mark –recapture statistics.
Growth rates for both Rainbow and Bull Trout within the reservoir were based on analyses of mark-recapture data within the reservoir. We also looked at yearly growth rates based on scale data, however, this data could only be used in the general sense as we could not partition seasonal growth between the reservoir and headwater habitats. We further employed growth data available from previous studies to aid in determining the suitability of our data for modeling efforts. Condition factors for captured Bull Trout and Rainbow Trout were calculated based on length weight relationships and then used to provide support for modeling results as well as another means of assessing population health in relation to reservoir levels and prey population.
Two PIT tag antenna arrays were used to determine patterns of Bull Trout movement into and out of Beulah Reservoir (Figure 1). One unit was placed downstream of the dam to determine levels of downstream passage, through or over the dam. The other unit was placed in the inflow a few hundred meters (m) upstream of the full pool elevation near the Reclamation property boundary. Both units were similar in design and operation. For each site we used an Oregon RFID HDX antenna reader. The unit was placed in a job box containing two, 12-volt-deep cycle batteries for power. Batteries were recharged from a pair of 75-watt solar panels. Twin-ax cable was used to connect the reader to the tuning box on the antenna. This cable was buried to protect it from the elements and livestock that frequently moved along the riverbank and through shallow areas. Antenna construction consisted of a single or double loop of 4- or 8-gauge battery cable (depending on location). The antenna cable loop was zip-tied to a Kevlar rope anchored on each river bank at the high-water mark by sinking t-posts into the substrate and using a set of turnbuckles to achieve the desired tension. T-posts were also placed at several locations across the stream width on the downstream side of the cable to help reduce drag on the antenna cable during periods of high water. Once placed, antennas were tuned to achieve a maximum read range. A test tag placed near each antenna fired at 1-hour intervals allowing us to determine if the antenna was operating correctly. Once operational, the units were downloaded weekly during active sampling periods and 2 to 3 times during the off season. The downstream unit was only operated during periods of active water release from the reservoir, but during both years it was vandalized in late summer. The upstream unit operated until late December each season, after which time ice flows typically broke the antenna cables. Antennas were
4

Beulah Reservoir Minimum Pool and Prey Base Studies 2010 – 2013 Part 2 Bioenergetics, Population Sustainability
typically restrung again in February to allow detection of fish migrating out of the reservoir during the spring.
Temperature data for Beulah Reservoir used for modeling was collected continuously within the reservoir using a series of Tidbit temperature recorders strung at 1-m depth intervals from a buoy located near the central channel in the deepest portion of the reservoir. Inflow temperature data was obtained from Reclamation’s Hydromet site, as were inflow, discharge, and reservoir storage.
All data collected was subsequently used as inputs to a bioenergetics model applied to reservoir fish populations. The bioenergetics approach employed in this study was based on an energy balance equation. For this study, we employed Fish Bioenergetics 3.0 (Hanson et al. 1987), commonly called the Wisconsin fish model. The model has been used for a wide variety of applications and parameterized for a number of common species making for relative ease of use. For this study, we focused our model runs on Bull Trout and Rainbow Trout. Rainbow Trout were selected as a secondary species of interest due to high population numbers and their potential for a competitive influence on overwintering Bull Trout. Other species such as Northern Pikeminnow similarly could compete with Bull Trout in Beulah Reservoir and could be considered for inclusion for an overall assessment of food availability.
We parameterized the model for Bull Trout based on data published by Mesa et al. (2012) on the development of a bioenergetics model for Bull Trout (Table 1). Swimming speed can have a significant impact on consumption estimates in the model, so for the purposes of this study it was held as a constant, following the methods of Mesa et al. 2012. To ensure the model was parameterized correctly and that no entry errors were made, we re-entered the laboratory data presented for Bull Trout in Mesa et al. (2012), and were able to repeat their results. This indicated our model was parameterized and performing correctly. For Rainbow Trout we employed the model of van Poorten and Walters (2010) (Table 2). Both prior studies of Bull Trout in Beulah Reservoir were parameterized using lake trout as a surrogate (Rose and Mesa 2007; Petersen and Kofoot 2002). The lake trout model likely overestimated feeding rates in Bull Trout, but had been the best surrogate for Bull Trout until Bull Trout specific parameters were made available. For both species, modeling was completed on what was calculated as the average fish based on growth data collected.
The approach we took was rather simplistic in that we made the assumption that predators were eating only fish or plankton, and that the predator was an opportunist and did not differentiate between prey species, instead consuming them in proportions relative to what was encountered. Energy density of prey used for modeling purposes was taken from work done by Rose and Mesa (2009). Predation, as estimated by the energetics approach used in this study, is at best only an estimate of the true predation mortality. We recognize many
5

Beulah Reservoir Minimum Pool and Prey Base Studies 2010 – 2013 Part 2 Bioenergetics, Population Sustainability
parameters in the model could impact our overall estimate of predation. Our conservative approach put bounds on the lower limits of predation. Our data was based on average growth rates indicating fish were feeding at some percent below their theoretical maximum consumption rate. Since fish are opportunistic feeders and the model suggests that, on average, these species are feeding well below their maximum theoretical consumption rates, adjusting this rate in the model allowed us to explore the potential impact of these species if they were to feed at higher or lower rates.
Whole population prey consumption was calculated based on estimated populations for Rainbow Trout each season, as well as for a range of potential populations for Bull Trout. For the purpose of energetics modeling, we developed a series of populations based on reservoir population estimates determined from our study and from historical redd counts. Four hypothetical Bull Trout population estimates (50, 100, 200, and 500) were run through the model. Redd counts over many years suggest these population sizes are realistic given current conditions in the watershed (USFWS 2002; Rieman and Allendorf 2001).
Using calculated feeding rates determined from weight gains for known fish, we showed what the patterns of growth should look like for individual Bull Trout overwintering in Beulah Reservoir. These estimates were based on species and size specific metabolic processes as a function of temperature, energy density of the prey, proportion of prey in the diet, and growth rate of the predator.
Using modeled feeding rates based on observed growth patterns for each species, consumption was shown as grams of prey consumed per gram of predator per day. Whole reservoir consumption was calculated based on the estimated biomass of fish present as determined from mark-recapture population data and average weight of individual Bull Trout and Rainbow Trout sampled. Seasonal consumption was based on the average residence times of Bull Trout residing in the reservoir, and from seasonal mark recapture data of Rainbow Trout.
3. RESULTS AND DISCUSSION
A. Field Results
1. Reservoir Conditions
Besides understanding the prey base for Bull Trout and other predators residing in Beulah Reservoir, temperature and pool levels were the two most important variables to consider. Rose and Mesa (2009) noted a strong relationship between minimum pool levels and redd counts. However, it should be cautioned this is not necessarily a causal relationship. The
6

Beulah Reservoir Minimum Pool and Prey Base Studies 2010 – 2013 Part 2 Bioenergetics, Population Sustainability
fact that Beulah Reservoir pool levels directly correlate to redd counts could simply be indicative of good water years which may be more amenable to better spawning conditions for Bull Trout, rather than any influence from the reservoir itself. During our study, Beulah Reservoir experienced a wide variety of water years which, when combined with previous studies, provided a good sample of potential reservoir conditions (Figure 4). Petersen and Kofoot (2002) and Schwabe et al. (2000) worked during what would be considered a fairly wet period where Beulah Reservoir remained at fairly high levels throughout the summer. When Rose and Mesa conducted their studies from 2006 through 2008 they were following a period of several dry years, even though the pool was only emptied once during their study period. Although the reservoir was completely dewatered in 2009, it retained a pool of about 2,000 acre-feet from 2010 throughout the remainder of our study. Although the reservoir was completely dewatered in 2009, it retained a pool of about 2,000 acre-feet from 2010 throughout the remainder of our study. Due to favorable climatic conditions in 2010 to 2011, the lowest pool level was above the minimum 2,000 acre-feet agreed upon. In 2012, the reservoir was only drafted to 2,000 acre-feet before beginning to rebound. In 2013, the reservoir was again drafted to 2,000 acre-feet but remained at or slightly below that point for a significant period of time. During 2012 and 2013, it is likely the reservoir would have drained had not a minimum pool agreement been in place.
Water temperature within Beulah Reservoir and the inflows of the NFMR mirrored each other quite closely (Figure 5 and Figure 6). Beulah Reservoir is relatively shallow and does not tend to stratify too strongly. Most water bodies would typically show a peak in stratification during late summer due to seasonal heating. However, Beulah Reservoir does not stratify for several reasons. First, by mid-summer the reservoir has normally been drawn down significantly making it even shallower and more prone to the effects of wind-generated mixing. Secondly, releases are from the bottom of the reservoir which acts to accelerate the removal of any remaining cold water at depth. Finally, inflowing water temperatures during summer months may actually exceed those of the reservoir at times approaching 300oC, therefore, inflows are not acting to provide any cool water input (Figure 5). From August through May, the reservoir was nearly isothermal during our study, but there was some evidence of reverse stratification in winter when the reservoir was ice-covered. A CE-Qual – W2 water quality model for Beulah Reservoir completed in 2002 modeled the same conditions that were observed during this study (Reclamation 2002).
During the years of our study, water temperatures within Beulah Reservoir indicate the reservoir becomes unsuitable for Bull Trout by the beginning of June each year and conditions remain unsuitable through mid-to-late September depending on local climatic conditions (Figure 6). River temperatures near the inflow to the reservoir mirror the temperature conditions within the reservoir indicating that even in the lower river conditions would not support Bull Trout during this same time period (Figure 5)
7

Beulah Reservoir Minimum Pool and Prey Base Studies 2010 – 2013 Part 2 Bioenergetics, Population Sustainability
Water temperature within Beulah Reservoir as well as in the inflows has been shown to be a good predictor of habitat availability for Bull Trout (Figure 5 and Figure 6). Bull Trout distribution is frequently limited by water temperature and data suggests that Bull Trout generally avoid temperatures above 15oC (Rieman and McIntyre 1993) and may start migrating in an attempt to avoid increasing temperatures even earlier (Saffel and Scarnecchiea 1995). However, recent studies by Howell (2011) show that within the migration corridor Bull Trout use habitats that exceed 18oC on occasion. Similar observations have also been documented by Bull Trout in the Boise River basin, Idaho. Schwabe et al. (2000) noted all radio-tagged Bull Trout left the reservoir by the beginning of June, and did not start returning to the reservoir until early November during their study. The rate and extent of upstream migration correlated well to increasing water temperatures as the season progressed.
2. Bull Trout
In the reservoir we tagged 122 Bull Trout during the 3 years of our study. The average size for these fish was of 324 mm in length with a weight of 401 gram (g). Fish ranged from 224 mm to 600 mm total length (TL) and from 108 to 2,687 g in weight. The heaviest fish was a rarity, as the next closest fish weighed only 993 g. This fish, in fact, had a tag from the U.S. Geological Survey (USGS) study several years prior and was the only Bull Trout we observed from a previous study. In general, Bull Trout were easy to capture in shore-based fyke nets, and the same fish could often be caught on subsequent days on opposite sides of the reservoir (Figure 1) indicating they actively moved around the reservoir during their period of residency.
a. Bull Trout Captures
2011 – Seventeen Bull Trout were collected in the spring; six of these were recaptured at least once during the spring sampling. Lengths averaged 298 mm (range = 236-447 mm TL) and weights averaged 329 g (range = 169-993 g). All Bull Trout were collected in fyke nets. Fall reservoir sampling failed to contact any Bull Trout. Based on Schumacher–Eschmeyer mark-recapture statistics, we estimated a population of 31 Bull Trout with a range of 21 to 61 for the spring of 2011.
2012 – Thirty-five Bull Trout were captured and tagged in Beulah Reservoir during the spring sampling effort and 5 were recaptured. Lengths averaged 319 mm (range = 247-600 mm TL) and weights averaged 420 g (range = 184-2,687 g). Eighteen Bull Trout were captured and tagged in the reservoir during the fall sampling effort and 7 were recaptured at least once during that time frame. Lengths averaged 359 mm (range = 243 - 441 mm TL) and weights averaged 474 g (range = 145 - 851 g). During the spring of 2012, we estimated
8
Beulah Reservoir Minimum Pool and Prey Base Studies 2010 – 2013 Part 2 Bioenergetics, Population Sustainability
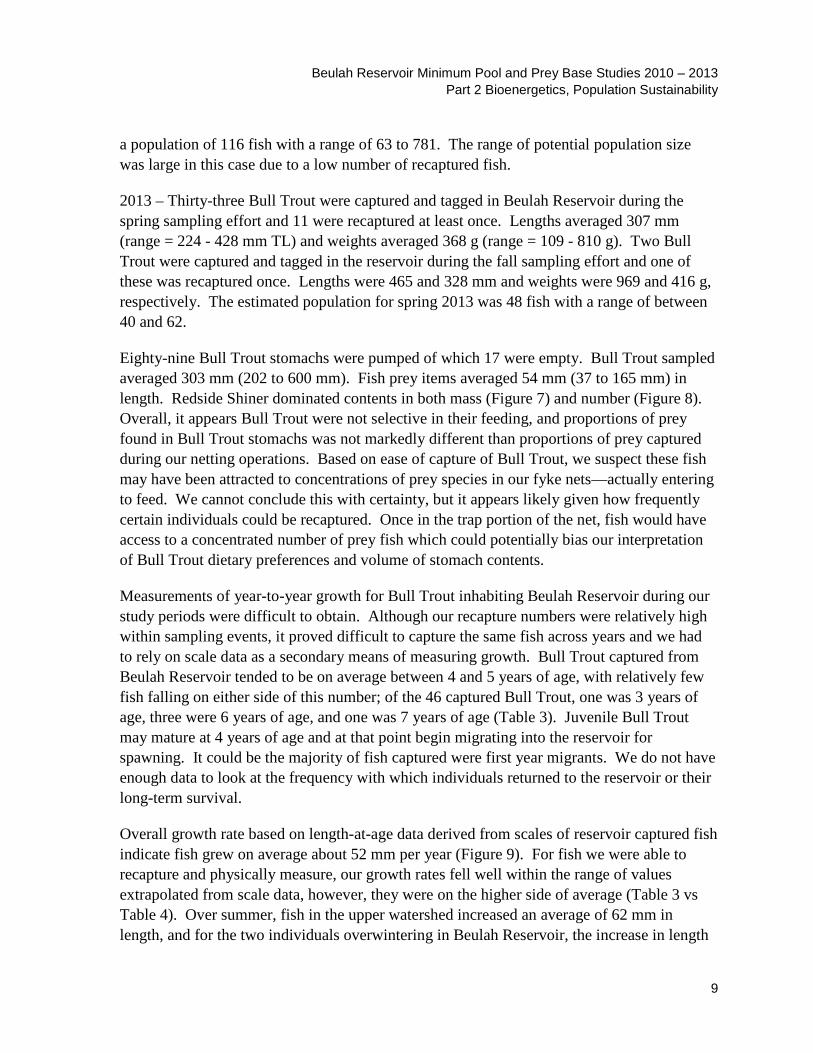
a population of 116 fish with a range of 63 to 781. The range of potential population size was large in this case due to a low number of recaptured fish.
2013 – Thirty-three Bull Trout were captured and tagged in Beulah Reservoir during the spring sampling effort and 11 were recaptured at least once. Lengths averaged 307 mm (range = 224 - 428 mm TL) and weights averaged 368 g (range = 109 - 810 g). Two Bull Trout were captured and tagged in the reservoir during the fall sampling effort and one of these was recaptured once. Lengths were 465 and 328 mm and weights were 969 and 416 g, respectively. The estimated population for spring 2013 was 48 fish with a range of between 40 and 62.
Eighty-nine Bull Trout stomachs were pumped of which 17 were empty. Bull Trout sampled averaged 303 mm (202 to 600 mm). Fish prey items averaged 54 mm (37 to 165 mm) in length. Redside Shiner dominated contents in both mass (Figure 7) and number (Figure 8). Overall, it appears Bull Trout were not selective in their feeding, and proportions of prey found in Bull Trout stomachs was not markedly different than proportions of prey captured during our netting operations. Based on ease of capture of Bull Trout, we suspect these fish may have been attracted to concentrations of prey species in our fyke nets—actually entering to feed. We cannot conclude this with certainty, but it appears likely given how frequently certain individuals could be recaptured. Once in the trap portion of the net, fish would have access to a concentrated number of prey fish which could potentially bias our interpretation of Bull Trout dietary preferences and volume of stomach contents.
Measurements of year-to-year growth for Bull Trout inhabiting Beulah Reservoir during our study periods were difficult to obtain. Although our recapture numbers were relatively high within sampling events, it proved difficult to capture the same fish across years and we had to rely on scale data as a secondary means of measuring growth. Bull Trout captured from Beulah Reservoir tended to be on average between 4 and 5 years of age, with relatively few fish falling on either side of this number; of the 46 captured Bull Trout, one was 3 years of age, three were 6 years of age, and one was 7 years of age (Table 3). Juvenile Bull Trout may mature at 4 years of age and at that point begin migrating into the reservoir for spawning. It could be the majority of fish captured were first year migrants. We do not have enough data to look at the frequency with which individuals returned to the reservoir or their long-term survival.
Overall growth rate based on length-at-age data derived from scales of reservoir captured fish indicate fish grew on average about 52 mm per year (Figure 9). For fish we were able to recapture and physically measure, our growth rates fell well within the range of values extrapolated from scale data, however, they were on the higher side of average (Table 3 vs Table 4). Over summer, fish in the upper watershed increased an average of 62 mm in length, and for the two individuals overwintering in Beulah Reservoir, the increase in length
9

Beulah Reservoir Minimum Pool and Prey Base Studies 2010 – 2013 Part 2 Bioenergetics, Population Sustainability
was 21 mm. Taking the two together this indicated an approximate increase of just over 70 mm for the year. While higher than the average measured with scale data, these estimates still fell within the range of scale derived growth estimates (Table 3). These numbers are similar to that observed for Bull Trout captured in the North Fork of the Boise River where fish grew between 50 and 75 mm in one year (Salow 2004). Tiley (2000) had some recapture data from Bull Trout for Beulah Reservoir based on captures of radio-tagged fish. Of four fish Tiley recaptured, two showed growth rates that were similar to those calculated during our study and the two largest fish showed growth rates of only about 25 mm for a 1-year period.
Condition factor (K) of Bull Trout within the reservoir was an additional means we used to try to examine how fish were responding to variations in water levels and the prey base. Similar K factors in spring were observed in 2011 and 2012 at 1.12 and 1.13, respectively, while a drop to 1.03 was observed in 2013 (Figure 10). Fish collected during the spring of 2013 were significantly lower in condition than those captured in either the spring of 2011 or 2012 (p<0.05). No Bull Trout were captured in the fall of 2011 and only 3 in 2012 that averaged 1.00 compared to 1.04 for the fall of 2013. Fall of 2012 was the first year of our study where without the study pool the reservoir would have been drawn down below 2,000 acre-feet. In 2012, the reservoir was drawn down to 2,000 acre-feet at the end of the irrigation season. Even though year-to-year Bull Trout conditions appeared to trend lower, in the spring of 2013 our prey base estimates were still quite high, and Bull Trout in the spring of 2013 had increased, or maintained the same condition as when they entered in the fall.
In 2013, the reservoir pool fell below 2,000 acre-feet due to evaporation loss and remained at that level for a longer time before refill began, however, we have no Bull Trout data from 2014 to determine if this had a further negative impact on condition factors. This low pool, and likely the lack of a complete fill the prior spring, was reflected in a lower prey base. This is comparable with data of Rose and Mesa 2009 and prior studies, where Bull Trout condition factors were similar to what was observed in this study during periods when the reservoir maintained an overwinter pool. Of all previous studies, Rose and Mesa did have a complete drawdown during 2007, and during the spring of 2008 Bull Trout had the lowest K value of any time observed during their study. This indicates that at extremely low water levels there were likely prey base related impacts to the Bull Trout population. This contrasts with our minimum pool season where, even though fish condition was lower in the reservoir than during previous seasons, there was still a slight increase in condition over the course of the winter. This suggests that at current population levels, a minimum pool of 2,000 acre-feet did not have any deleterious effects on the population. When Schwabe et al. (2000) sampled Beulah Reservoir, 18 Bull Trout were captured between April and May, with an average condition factor of 0.99. Their sampling effort followed a series of several years where the reservoir never dropped below 20,000 acre-feet. Fish captured during the period of our study, and during low water years, were in no worse condition. It should be pointed
10

Beulah Reservoir Minimum Pool and Prey Base Studies 2010 – 2013 Part 2 Bioenergetics, Population Sustainability
out that due to small sample size, testing for significant differences in condition factor were not possible. Relatively low numbers of fish captured, and a wide range of measured condition factors makes any tests of significance difficult for this species.
Based on previous studies and our observations, we recognized that an inability to capture Bull Trout in the reservoir would at best result in only an approximation of whether fish were or would be present that season. We had fixed sampling periods each spring and fall, and these did not necessarily correlate well with peaks in Bull Trout abundance due to year-toyear differences in migration timing. Time of arrival of the first Bull Trout, and time last left the reservoir varied each year, but appeared to correlate well with temperature (Figure 5 and Figure 6). Similar observations can be made in the upper watershed where upstream movement appeared to follow increasing temperatures lower in the watershed (Schwabe et al 2000).
We used antenna detections obtained from the PIT tag array just upstream of the reservoir inflow to determine the range of times fish entered and left the reservoir (Figure 11). In 2011, the first downstream movement was observed on October 28 and the last downstream detection on November 16. Additionally, the first detection was on May 7, 2012 and the last fish left the reservoir on May 31, 2012, but this number was likely not representative of a true first date of upstream passage as flooding prior to this time damaged the weir and it was only repaired once water levels had dropped to a level where it was safe for personnel to reenter the river. In the fall of 2012, the first downstream detection was on September 22 and the last detection was on October 16, 2012. In 2013, the first upstream detection occurred on March 15 and the last on May 31, 2013. In the fall of 2013, our first downstream movement was detected October 5 and the last on November 19. These ranges fell well within those observed during previous radio-tag tracking studies indicating that Bull Trout typically do not use the reservoir from June through September, but could occur there anytime from October through May each year.
PIT tag monitoring and hook and line sampling also did not detect Bull Trout moving downstream of the reservoir except during 2011 when there was some spill over the dam. During the following two seasons when there were only through dam releases, no tagged fish were detected downstream of dam. Past radio-tagging studies demonstrated fish would pass the dam during spring spill, which is the primary reason operations now try to maintain flows through the dam instead of over the spillway whenever possible. In 1998, Schwabe et al. (2000) captured 17 Bull Trout below the dam via angling methods, and 19 in the reservoir. This indicated that during the spill period a significant portion of the population may have been moving over the dam. Our data, or lack thereof, provide support for a positive population benefit of this operational change. However, run-of-the-river operations, which effectively removed most resident fish of all species from the reservoir, do not appear to entrain Bull Trout. The end of the irrigation season typically results in the closure of the
11

Beulah Reservoir Minimum Pool and Prey Base Studies 2010 – 2013 Part 2 Bioenergetics, Population Sustainability
outlets by early October, which in most cases, is prior to any Bull Trout entering the reservoir.
3. Rainbow Trout
Rainbow Trout are a species that presently occur in good numbers within the reservoir and potentially compete directly or indirectly with Bull Trout for food. Rainbow Trout are regularly stocked in the reservoir as fingerlings during the late spring in most years. We were able to catch them in high numbers and develop reliable population estimates for this species (Figure 12; Table 5). The data we used to develop population estimate and that are presented here are of larger fish, that is, those large enough to Floy tag (>150mm TL). The population estimate ranged from a high of nearly 5,400 in the spring of 2011, to a low of 1,500 that same fall. High variance in the population estimate for our first sampling period was due to a very low number of recaptured fish. Overall, we tagged 261 fish in the spring of 2011 with 8 recaptures; 173 with 8 recaptures in the fall of 2011; 320 with 12 recaptures in the spring of 2012; 969 with 97 recaptures in the fall of 2012; 772 with 150 recaptures in the spring of 2013; and 593 with 76 recaptures during the fall of 2013. On a year-to-year basis, both the numbers and biomass of Rainbow Trout decreased in Beulah Reservoir across the duration of the study. At the high point, we estimated there to be almost 2,000 kilograms (kg) of Rainbow Trout in Beulah Reservoir which had decreased to less than 600 kg by the end of the study.
Thirty-five Rainbow Trout stomachs were pumped; of which 11 were empty. The percentage of fish with empty stomachs fell well within the range of other studies sampling trout populations and may in part be due to our ability to effectively lavage stomach contents (Andrusak and Parkinson 1984; Oscoz et al. 2005). Rainbow Trout sampled averaged 399 mm (312 to 518 mm) and prey fish length averaged 56 mm (43 to 122 mm). Similar to observations for Bull Trout, Redside Shiner again dominated stomach contents of Rainbow Trout in both biomass (Figure 13) and number (Figure 14).
We further noted that not all Rainbow Trout resided in Beulah Reservoir on a year-round basis. During fall sampling efforts when the weir was in place upstream of the reservoir, large numbers of rainbows would be observed congregating in the pools upstream of the weir, moving downstream immediately upon weir removal. These fish were observed to be in better condition than those having resided year round in the reservoir, but for this study we did not have any means of assessing the relative proportions of the population that may be utilizing riverine habitats during some or all of the year.
In contrast to what we observed with Bull Trout, Rainbow Trout condition factor K decreased continuously over the course of the study, with a significant decrease in conditions measured for almost all study periods (Figure 15). Comparing spring samples across all
12

Beulah Reservoir Minimum Pool and Prey Base Studies 2010 – 2013 Part 2 Bioenergetics, Population Sustainability
years, statistical analyses indicated a significant difference in condition factor over time, however, a multiple comparison procedure indicated spring of 2013 fish were of lower condition than fish collected during the spring of 2011 and 2012, and that spring 2011 and 2012 did not differ from each other at the P=0.05 level. During the fall of 2010 and 2011, the pool did not drop to the minimum 2,000 acre-feet, whereas in the fall of 2012 it did. Consequently, spring sampling efforts only reflected the impacts of one minimum pool year. Fall sampling differed in that these fish had actually experienced the effects of both low water years; the 2,000 acre-feet just hit in 2012 and the longer term low pool of closer to 1,400 acre-feet experienced in 2013. Condition factors for fall fish did vary significantly from each other for all years at the p=0.05 level, with condition decreasing from 1.192 in fall 2011; 0.99 in fall of 2012; and 0.89 in fall of 2013.
When combining the decrease in population numbers, biomass, and condition factor of Rainbow Trout we are left with several interesting questions about how these populations behave in Beulah Reservoir, and what the impacts of a minimum pool for this species are. None of the previous studies examining prey base in Beulah Reservoir (Petersen and Kofoot, Rose and Mesa) made any marked comments about changes in observed condition factor of the Rainbow Trout populations. We hypothesize this observed change in condition occurred because our study was the first to artificially hold the water levels to a minimum pool when the reservoir otherwise would have been drained. Historically, during years of low water (which in our case were years of population stressors), resident fish and their prey would have simply been entrained out of the reservoir, and we would not have seen the low water impact to the population. It is also apparent, even though we found prey fish in Rainbow Trout stomachs, that the majority of this population may not make the switch from feeding on aquatic insects and zooplankton to being able to take advantage of a fish diet. As we will show in the bioenergetics section below, summer water temperature in Beulah Reservoir may also be impacting observed decreases in condition.
B. Bioenergetics
1. Bull Trout
Average growth rates for Bull Trout were obtained from data collected during this and previous studies, (Schwabe et al. 2000; Petersen and Kofoot 2002; Petersen, Kofoot, and Rose 2003; Rose and Mesa 2007). While we contacted good numbers of Bull Trout during any given study period, recaptures across study periods were low (Table 4). The main caveat to the model focused on growth rates of Bull Trout, and what we felt was acceptable as far as available data. In terms of year-to-year growth in Beulah Reservoir over all the years of study, including previous studies, the growth rate data we have for the reservoir fish is based
13

Beulah Reservoir Minimum Pool and Prey Base Studies 2010 – 2013 Part 2 Bioenergetics, Population Sustainability
on N=2 (aside from calculated growth). Like previous studies, many fish were recaptured but not at the right time. For estimates of overwinter growth, fish needed to have been tagged in October and recaptured the following spring, as these fish were the ones experiencing the reservoir. Both fish we did recapture at the right time showed similar growth rates. We obtained a lot of information about fish growth in the upper watershed from our recapture data, as a lot of fish captured in spring were again captured that same fall, but since we do not know exactly where these fish reared during the summer, we can only guess about the temperature regime they were exposed to, and thus the effect on metabolism and growth rates. Bull Trout that we had actual data for appear to be near or slightly above the mid-range of growth rates based on data from the Rose and Mesa report in terms of their bioenergetics forecasting of feeding levels based on prey base utilization. Rose and Mesa calculated the average growth rate based on data combined from previous studies as well as data of their own. The fact that our data tends to fall right within the same range gives us confidence the fish we were basing our model on do indeed represent the average Bull Trout in Beulah Reservoir.
We assumed the first time we caught the fish in the reservoir was near the time they first entered the reservoir that season. Similarly, the last encounter in the spring we assume was associated with when they left the reservoir. PIT tag detections were not very precise at the inflow and therefore, we often missed individuals that were passing upstream or downstream. However, these detections allowed us to bracket the period when fish were leaving and entering the reservoir. Timing of when individuals entered the reservoir was highly variable. In 2012, fish were observed entering as early as September 22 and as late as November 28 in 2013. Most years, fish tended to appear at our PIT tag site over a period of 6 to 8 weeks in the fall. Similarly, spring time departures from the reservoir ranged from mid-March to May 31 for the 2 years the array was in place. Again, similar to growth data, our residence time coincides closely with that of Schwabe et al. (2000) who used radio tags to determine residence times. This indicates that, while there is some year to year variability due to local climatic conditions and definitely fish-to-fish variability, the data we are using essentially demonstrates that conditions have not changed markedly over at least the past 15 years. Based on the above residence times, we used a modeled residence time of 200 days that Bull Trout resided in Beulah Reservoir, starting October 4 and ending April 18.
For an overwintering population estimate we bracketed the numbers estimated to be in the reservoir which averaged around 50 to 80. We further assessed the impact of higher population numbers to examine the predation potential imposed by these fish. To estimate in-reservoir consumption we used populations of 50,100, 200, and 500 average sized Bull Trout. Rose and Mesa used a number of 1,000 Bull Trout in the reservoir for their modeling, but we elected not to go that high. Based on historical data and the amount of summer habitat available to fish, it seems unrealistic to expect there to ever be a population of 1,000 migratory adult fish. On average this number would be more than 10 times the current yearly
14
Beulah Reservoir Minimum Pool and Prey Base Studies 2010 – 2013 Part 2 Bioenergetics, Population Sustainability
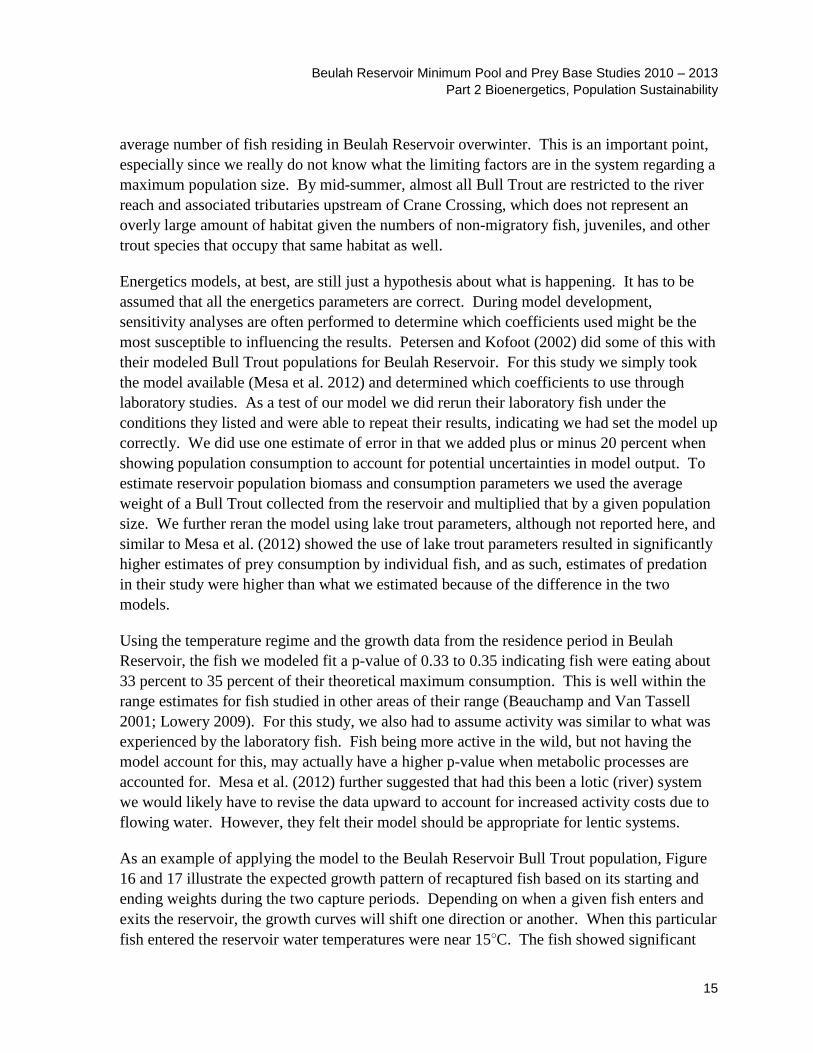
average number of fish residing in Beulah Reservoir overwinter. This is an important point, especially since we really do not know what the limiting factors are in the system regarding a maximum population size. By mid-summer, almost all Bull Trout are restricted to the river reach and associated tributaries upstream of Crane Crossing, which does not represent an overly large amount of habitat given the numbers of non-migratory fish, juveniles, and other trout species that occupy that same habitat as well.
Energetics models, at best, are still just a hypothesis about what is happening. It has to be assumed that all the energetics parameters are correct. During model development, sensitivity analyses are often performed to determine which coefficients used might be the most susceptible to influencing the results. Petersen and Kofoot (2002) did some of this with their modeled Bull Trout populations for Beulah Reservoir. For this study we simply took the model available (Mesa et al. 2012) and determined which coefficients to use through laboratory studies. As a test of our model we did rerun their laboratory fish under the conditions they listed and were able to repeat their results, indicating we had set the model up correctly. We did use one estimate of error in that we added plus or minus 20 percent when showing population consumption to account for potential uncertainties in model output. To estimate reservoir population biomass and consumption parameters we used the average weight of a Bull Trout collected from the reservoir and multiplied that by a given population size. We further reran the model using lake trout parameters, although not reported here, and similar to Mesa et al. (2012) showed the use of lake trout parameters resulted in significantly higher estimates of prey consumption by individual fish, and as such, estimates of predation in their study were higher than what we estimated because of the difference in the two models.
Using the temperature regime and the growth data from the residence period in Beulah Reservoir, the fish we modeled fit a p-value of 0.33 to 0.35 indicating fish were eating about 33 percent to 35 percent of their theoretical maximum consumption. This is well within the range estimates for fish studied in other areas of their range (Beauchamp and Van Tassell 2001; Lowery 2009). For this study, we also had to assume activity was similar to what was experienced by the laboratory fish. Fish being more active in the wild, but not having the model account for this, may actually have a higher p-value when metabolic processes are accounted for. Mesa et al. (2012) further suggested that had this been a lotic (river) system we would likely have to revise the data upward to account for increased activity costs due to flowing water. However, they felt their model should be appropriate for lentic systems.
As an example of applying the model to the Beulah Reservoir Bull Trout population, Figure 16 and 17 illustrate the expected growth pattern of recaptured fish based on its starting and ending weights during the two capture periods. Depending on when a given fish enters and exits the reservoir, the growth curves will shift one direction or another. When this particular fish entered the reservoir water temperatures were near 15°C. The fish showed significant
15

Beulah Reservoir Minimum Pool and Prey Base Studies 2010 – 2013 Part 2 Bioenergetics, Population Sustainability
growth through at least mid-November before cooling water temperatures began to impact metabolism. Again, prior to the fish exiting the reservoir, there was another increase in growth associated with the spring warming of the reservoir. It is important to note that from mid-November until early April during this simulation year fish exhibited almost no growth, and in fact would have been predicted to even lose a little weight due to temperature impacts on feeding and metabolism.
The modeled growth curves were translated to a modeled consumption curve to demonstrate the feeding pattern that would have given rise to the observed growth of the fish (Figure 18 and Figure 19). For our modeled fish, when it first entered the reservoir, its food requirement was close to 10 grams per day which translates to nearly 2 percent of body weight/day (Figure 19). By mid-November, this requirement has dropped by 90 percent and through the early April time period consumption was in the 0.2 percent body weight/day range. Temperature dependence is illustrated well as during brief warming periods, predicted consumption increases mirror the changes in temperature. Again, this fits well with Mesa et al. (2012) where they show Cmax to be extremely low during periods of water temperatures between 0 and 4°C, which occur in Beulah Reservoir for much of the winter months.
Following the modelling of a single fish, whole lake consumption was then calculated based on several theoretical Bull Trout population sizes. Populations were 50, 100, 200, and 500 individuals with an average weight of 400 g (Figure 19 and Figure 20). A population of 50 Bull Trout, upon first entering the reservoir in November could be expected to consume in the neighborhood of 300 g of prey per day, while a population of 500 would be consuming over 3 kg of prey per day. Again, from mid-November through early April, population consumption decreases significantly because of cold water temperatures.
Cumulative consumption provided a good estimate of what would be needed to maintain the population through the period they resided in the reservoir. A population of 50 Bull Trout under modeled conditions would need approximately 18 kg of prey to allow it to overwinter and exit the reservoir at conditions we observed. A population of 500 overwintering Bull Trout would need 180 kg of prey during that same period. These estimates would of course vary depending on the water year, as during a cooler average year we would expect slightly lower consumption and during a warmer year, higher consumption. Long-term temperature data from the monitoring station just above the inflow to Beulah Reservoir does not show any significant trends other than small seasonal differences every year so these results are likely applicable for the near future, barring any climatic increases in temperature. We only had complete reservoir temperature data for a portion of the study and had to use this data across all years, but based on the stream temperature record, this data is likely representative of a typical year for Beulah Reservoir under the water conditions we observed. Any differences in yearly temperature between our data and actual temperatures would be reflected in model differences in consumption parameters based on growth. For this study,
16

Beulah Reservoir Minimum Pool and Prey Base Studies 2010 – 2013 Part 2 Bioenergetics, Population Sustainability
however, the time period we collected data was the warmest of the 3 years, thus in the worst case scenario we were slightly overestimating consumption by these species. Previous studies and modeling results from Beulah Reservoir, however, indicate temperature data similar to what we observed (Petersen and Kofoot 2002; Reclamation 2002). If in the future, modelling suggests a shift in the temperature regime of the reservoir due to climate change that could result in very different estimates of the amount of prey needed to maintain the population.
2. Rainbow Trout
Unlike Bull Trout, we were able to obtain higher numbers of recaptures of Rainbow Trout due to a much larger population size (Table 6). Rainbow Trout were also present in the reservoir throughout the year so we were able to obtain estimates of growth during summer and winter months, as well as data on growth for each year of the study and across all sampling. For energetics modeling, we compiled data for 33 Rainbow Trout collected from Beulah Reservoir (Table 6). The actual number of recaptures was much higher than shown here, but for large numbers of fish we had only length measurements, or the recaptures occurred within a single sampling period too close together to allow growth measurements to be made accurately. We obtained some estimate of growth (weight gain) for the following periods: May 2011 to October 2011 N=1, September 2011 to April 2012 N=3, April 2012 to October 2012 N=3, October 2012 to April/May 2013 N=18, and April/May 2013 - October 2013 N=8, and one fish for the period April 2012 to April 2013, and one fish from October 2012 to October 2013. For each period, we used the overall average percent change in weight for Rainbow Trout within the time period for cases where there was more than one fish. However, we have no real information in terms of which portions of the reservoir individuals inhabited on a long-term basis. Temperature data we used for modeling was taken from data collected 2 m below the water surface.
For each of these time periods, we parameterized the model for Rainbow Trout by using the average number of days between captures for fish, and average starting and ending weights. For whole reservoir predation estimates, we substituted the average weight for all trout captured during a time period, as this number of fish was substantially higher than the few recaptures and would represent a better estimate of the true size of fish in the reservoir. For each time period modelled, we used the estimated Rainbow Trout biomass in the reservoir for that period based on population sizes (Table 5). We further modeled the population under two diet scenarios. In the first case, it was assumed Rainbow Trout only persisted on a fish diet, and for the second case we assumed Rainbow Trout only ate a plankton diet. Based on field observations we suspect the latter is true, but any estimate of diet can be made by adjusting the proportions of food eaten. A 100 percent fish diet represents the lower boundary of consumption, while a 100 percent plankton diet represents the upper boundary
17

Beulah Reservoir Minimum Pool and Prey Base Studies 2010 – 2013 Part 2 Bioenergetics, Population Sustainability
of consumption. Plankton have a lower energy density and require higher consumption rates to achieve the same observed growth.
Rainbow Trout have a much higher metabolic requirement for food than do Bull Trout, so even similar populations within the reservoir would be expected to have greater impacts upon the prey base. Time intervals between each sampling event on Beulah Reservoir were used to delineate periods of prey consumption for Rainbow Trout (Figure 22 and Figure 23). During the winter months, the existing populations would be expected to consume about 2.5 kg of fish a day if they were on an all fish diet and close to 3 kg per day on a plankton diet. In summer months, during the warmest observed period for 2012 the Rainbow Trout population was likely consuming close to 18 kg of fish or upwards of 25 kg of plankton on a daily basis. Even though the population was smaller during 2013, the predation potential is significant at between 9 and 13 kg of food per day depending on prey preference.
Field sampling indicated a continuous decrease in fall condition of Rainbow Trout across study years. Energetics modeling coupled with known tolerances of Rainbow Trout, indicate this decrease in condition may be occurring for a couple of reasons (Matthew and Berg 1997; Selong et al. 2001). Energetics analyses indicated the population of Rainbow Trout needed to be consuming a significant amount of prey to maintain itself even under times of decreasing condition. Experimental data do suggest, however, that regardless of the amount of prey available in Beulah Reservoir it would not be unexpected to see the population lose condition from summer to fall. Spring data suggest that the low water year of 2012 probably impacted fish based on prey availability. Summer to fall data, though, has a large temperature component that could explain a lot of the difference in condition from spring to fall. Beulah Reservoir becomes warm enough during the summer to approach a lethal limit for Rainbow Trout (Brett 1971; Currie, Bennett, and Beitinger 1998; Grande and Andersen 1991; Hokanson, Kleiner, and Thorslund 1977; Taniguchi et al. 1998). These studies have further shown that feeding rates are reduced as water temperatures approach the upper thermal tolerance limits for these fish and that fish simply cannot process food fast enough to maintain condition.
3. Prey Base
Our data presented here, combined with those of previous studies allowed the development of a reasonably comprehensive picture of the dynamics of a couple of the principle species inhabiting Beulah Reservoir. When these data were analyzed in conjunction with analyses of the prey base data in Beulah Reservoir, it provided a better idea of the variety of factors potentially influencing Bull Trout populations. All previous studies have attempted to measure populations, or an index thereof, of prey fishes in the reservoir. Rose and Mesa (2007) further incorporated benthic invertebrates and pelagic aquatic insects to these analyses. We took our studies a little further, and also examined phyto- and zooplankton
18

Beulah Reservoir Minimum Pool and Prey Base Studies 2010 – 2013 Part 2 Bioenergetics, Population Sustainability
populations in addition to fish and benthic invertebrates. While phytoplankton and zooplankton would not be considered a part of a larger Bull Trout’s typical diet, plankton are important in that they provide a majority of the food source for the fish prey base. We did not look at pelagic aquatic insects during our study for a couple of reasons. The primary reason being many pelagic stages of insects are usually only present for short periods of time during hatches when they may be actively migrating through the water column, or present in the water column only during certain times of day. We were concerned that due to the short windows of time we sampled each fall and spring, we might not be adequately sampling these populations and our results could be misleading in terms of the importance of these populations. Instead, we looked at average density of benthic dipterans across the reservoir of as an index of their abundance.
Benthic invertebrate densities were correlated to water volume in the reservoir. During years when the reservoir maintained a lower average volume, benthic insect populations were lower (Figure 24). Many of these organisms will emerge at some point during the season and thus represent a potential food source. The response is likely a function of whole reservoir productivity. When Beulah Reservoir fills, it floods a lot of brush and grass habitat that has grown the previous spring and summer. The breakdown of this material provides a large nutrient input to the reservoir. Rose and Mesa (2013) noted similar results in that lower invertebrate densities were associated with years of lower water level. Our study was not in-depth enough to determine if emergence timing would coincide with a period of time Bull Trout are utilizing Beulah Reservoir.
Plankton populations varied significantly over the course of our study as well (Figure 25). Interpreting the response of plankton populations to reservoir changes was more complex as it appeared there was evidence of predation induced changes coinciding with varying water levels. Zooplankton essentially followed the same pattern as benthic invertebrates. During high water, zooplankton biomass was higher. Zooplankton body size was also larger in 2011 and 2012 then it in 2013. Phytoplankton, however, showed the opposite response, and during higher water we observed lower overall biovolume compared to times of low water. These results, taken with fish density, indicate there was probably a significant predation impact during low water. When the reservoir is drawn down, fish become more concentrated in the remaining pool and the lack of large bodied zooplankton was a likely indication of cropping by planktivorous fishes, which would include all small bodied fish species in the reservoir in addition to native and hatchery Rainbow Trout. Cascading trophic interactions theory then predicts a reduction in zooplankton should result in higher phytoplankton populations as a result of lowered grazing pressure (Carpenter, Kitchell, and Hodgson 1985). Beulah Reservoir conditions fit this model quite well and our analyses indicate that fish populations are probably high enough under some conditions to have noticeable impact on plankton populations. This suggests that fish may be competing for a limited resource at low water levels. At higher reservoir levels the added boosts of nutrients from decomposing vegetation
19

Beulah Reservoir Minimum Pool and Prey Base Studies 2010 – 2013 Part 2 Bioenergetics, Population Sustainability
may also act to give phytoplankton populations a boost, and possibly not make impacts as noticeable. Epiphytic organisms growing on flooded vegetation could provide a further source of food to smaller prey species.
Fish are assumed to provide the principal prey base for Bull Trout in Beulah Reservoir. Combining our 3 years of data with 2 years of Rose and Mesa (2007; 2009) provided 5 complete years of data to work with (Figure 26 and Figure 27). We did not use data from Petersen and Kofoot 2002 or Petersen, Kofoot, and Rose 2003. Petersen, Kofoot, and Rose (2003) applied most of their effort to gill netting and what fyke data they had showed unusually low numbers of fish compared to ours and Rose and Mesa’s data. Unfortunately, their report says little about how nets were deployed so we were unable to draw any conclusions from their data other than some idea of which species predominated at that time.
Using the data from Rose and Mesa, as well as our 3 years of sampling allowed the examination of a range of expected prey base populations under several different reservoir water level scenarios. Since Bull Trout predation is modeled as a function of biomass, we converted data from both sets of studies to whole reservoir population biomass (Figure 27). At the high point of our monitoring it was estimated there were approximately 5,300 kg of suitably sized prey on the reservoir. The lowest biomass estimate occurred during the fall of 2013 following the lowest water period, but was still estimated at near 950 kg of potential prey sized fish. Rose and Mesa noted lower values, with 640 kg during the spring of 2006 and 2007; 203 kg during the fall of 2006; and between 60 and 90 kg from fall 2007 though spring 2008 following a complete dewatering of the reservoir.
Rose and Mesa attribute much of the overwinter increase in biomass to growth of prey species during the winter, not to contribution from new individuals. It was difficult to draw other than general conclusions about the differences in prey abundance for our study compared to Rose and Mesa’s studies because of the inherent variability in the system and the wide number of variables that could be affecting the fishery. Sampling methods also varied between the studies in terms of frequency and location of net placement which could have had impacts on populations estimated for all of our studies. Rose and Mesa leaned towards resetting their nets in similar areas, so if fish were not randomly mixing, this would tend to reduce the overall population estimate. Conversely, we moved our nets widely from day-to-day and this degree of movement could have had the opposite effect. As such, the true population estimates probably reside somewhere between ours and previous studies, as we could not quantify the sources of error.
20

Beulah Reservoir Minimum Pool and Prey Base Studies 2010 – 2013 Part 2 Bioenergetics, Population Sustainability
4. CONCLUSIONS AND RECOMMENDATIONS
Data suggests that a complete drawdown of Beulah Reservoir is deleterious to the Bull Trout population. Rose and Mesa noted a reduction in Bull Trout K factor over winter following a year in which there was a complete drawdown, and in fact their model showed it would not have taken too large a Bull Trout population to have had a dietary requirement larger than the entire prey base within the reservoir. This is similar to the results of the revised energetics model employed for our study. Theoretically, when the reservoir was drained, there were enough prey sized fish remaining to support over 100 Bull Trout for the winter, a population size larger than the current average we determined to be present. However, whether or not these few prey items could be found by Bull Trout is another question entirely. The decrease in condition factor Rose and Mesa observed seems to point to the fact that while there may be enough prey, it does not necessarily mean Bull Trout can find those prey items.
Conversely, the 2,000 acre-feet minimum pool observed in 2012 appeared to have no negative impacts on the Bull Trout overwintering in Beulah Reservoir. Similar to previous years, condition actually tended to increase a little over winter in the reservoir, however, small sample sizes prevented us from running any significant statistical analyses, and those data should be taken as observational. Likely at these levels we would be hesitant to say 2,000 acre-feet is too low a reservoir level given the current population trends on the NFMR. In 2013, the reservoir storage was less than the study pool, with the reservoir maintaining a pool of between 1,400 and 1,500 acre-feet. Our current study ended at this point and we do not know the status of the prey population for the following spring.
Even though the reservoir went to a minimum pool during both 2012 and 2013, the pattern of drawdown was very different. During 2012, reservoir levels decreased over the summer, reaching 2,000 acre-feet at the end of the irrigation season and immediately started to refill. In 2013, minimum pool was reached by early August and remained there through the rest of the irrigation season. This difference in drawdown patterns might explain some of the difference in prey fish populations between the 2 years.
Following a drawdown most authors have agreed that it could take one to several years for the reservoir prey base to fully recover to a point where it was prior to a drawdown. At the beginning of our study and Rose and Mesa’s populations were sampled starting about one year after a drawdown and by this time data indicate prey fish populations having recovered enough to support a substantial Bull Trout population.
Maintaining a minimum pool during the study could have had unintended consequences for the Bull Trout population for a variety of reasons. We noticed over the 3 years of our study a dramatic increase in the presence of larger body sized suckers and Northern Pikeminnow
21

Beulah Reservoir Minimum Pool and Prey Base Studies 2010 – 2013 Part 2 Bioenergetics, Population Sustainability
(Ptychocheilus oregonensis) —the former possibly competing with the prey base for resources and the latter competing directly with Bull Trout for food. Historical gill netting data show similar patterns, where following sequences of years the reservoir did not draw down completely there was a dramatic increase in the populations of larger fish susceptible to gill netting (Petersen, Kofoot, and Rose 2003).
The Petersen, Kofoot, and Rose (2003) and Petersen and Kofoot (2002) reports were also the first ones to mention crappie occurring in the reservoir. The 2002 net data showed crappie making up over 40 percent of their fyke net catch, indicating significant numbers within the reservoir. Rose and Mesa caught a few crappie during their study, but none the year following dewatering. As our study progressed, we also noted an increase in numbers caught, including what we think are the first records of Largemouth Bass (Micropterus salmoides) caught. We caught no crappie the first year of our study, but by 2013 we were consistently catching what appeared to be 2-year classes of fish at the end. Taking both these observations into consideration, this indicates a stable pool may be benefiting these typically reservoir oriented fish, and that periodic dewatering resets these populations. We were not able to identify the origin of the bass and crappie. There may be refugia upstream that allow them to repopulate, or possibly local anglers stocking them from a neighboring lake. It is possible some remain at extremely low numbers following a drawdown and our netting surveys just never encountered them. As a point of concern, adult Largemouth Bass could easily prey on smaller Bull Trout, and the shoreline preference that Bull Trout seem to have, would overlap with preferences of Largemouth Bass. Once crappie reach a larger size they primarily target fish as a food source, and while not a predation risk to Bull Trout, could represent another potential source of competition for overwintering Bull Trout.
Rainbow Trout are stocked yearly in Beulah Reservoir. Observations indicate a portion of this population may behave similar to Bull Trout in that they migrate upstream into the NFMR during certain times of the year while the remainder of the population resides within the reservoir. During years the reservoir draws down completely, the reservoir population is essentially reset and then repopulated by stocking the following spring, and with the addition of fish moving back into the reservoir from the NFMR in the fall. Our observations regarding maintaining a more permanent pool indicate this may be of concern for the Rainbow Trout population, as it appears this population is negatively impacted by reduced pools at its current population level. While there is fishing on the reservoir, the number of anglers is relatively low, based on our observations, and larger Rainbow Trout have no predators of significance in Beulah Reservoir other than anglers. This apparently allows the populations, with continued stocking, to increase greatly during good years, but then to be extremely negatively impacted during low water years. This was not observed during previous studies as during low water years the reservoir was drained completely so this reduced condition factor was never manifested.
22
Beulah Reservoir Minimum Pool and Prey Base Studies 2010 – 2013 Part 2 Bioenergetics, Population Sustainability
We would recommend that to ensure any minimum pool requirement developed for Bull Trout populations is indeed functioning and that periodic sampling occurs in the reservoir to monitor status of both the prey base and Bull Trout populations. The level of sampling need not be as comprehensive as during these studies to determine if the minimum pool is viable. There are enough uncertainties about a minimum pool elevation and its long-term impacts that this should be warranted. Because of the highly variable nature of seasonal precipitation on the watershed, a specific minimum pool level is difficult to determine. A series of good years where the reservoir fills completely, followed by a single dry year where we maintain a minimum pool, will have a different prey fish population response compared to a series of dry years where the reservoir does not fill completely, yet maintains that same minimum pool. We could not expect the reservoir to be as productive during years it does not fill completely and inundate the adjacent grassland and vegetated habitat that would provide a large nutrient pulse. The minimum pool really functions to hold a source population for the following year, and the size of that source population might be a good predictor of the rate of population recovery during good years. The 2,000 acre-feet level used here seems a good starting point for an adaptive management approach to operating Beulah Reservoir. Both years that we measured fish populations following drawdown to this minimum pool, we were able to measure prey populations high enough to support a significant overwintering population of Bull Trout.
Based on our study, we would also suggest at this time that the reservoir is likely not a factor limiting the numbers of Bull Trout in the system. Model simulations and field data demonstrate that under the current scenario of operations, the reservoir could support far more Bull Trout than on average are currently using it. Most years, when Bull Trout migrate upstream in late spring/early summer, their condition suggests the population is not under stress. There has been substantial variability in spawning counts in the watershed and as Rose and Mesa showed, this was correlated to reservoir levels with an offset factor incorporated. Although we cannot say for certain, we highly suspect that water levels in Beulah Reservoir were simply an indicator as to overall habitat conditions across the watershed. We found no evidence in this study to say Bull Trout were significantly impacted by water levels except when the reservoir was completely drained.
23

Beulah Reservoir Minimum Pool and Prey Base Studies 2010 – 2013 Part 2 Bioenergetics, Population Sustainability
5. LITERATURE CITED
Parenthetical Reference Bibliographic Citation
63 FR 31647 Federal Register. 1998. Endangered and Threatened Wildlife and Plants; Determination of Threatened Status for the Klamath River and Columbia River Distinct Population Segments of Bull Trout. Volume 63, No. 111, Pp. 31647-31674. June 10, 1998.
64 FR 58910 Federal Register. 1999. Endangered and Threatened Wildlife and Plants; Determination of Threatened Status for Bull Trout in the Coterminous United States. Volume 64, No. 210, Pp. 5891058923, November 2, 1999.
Andrusak and Parkinson 1984 Andrusak, H., and E.A. Parkinson. 1984. “Food habits of Gerrard stock Rainbow Trout in Kootenay Lake, British Columbia.” Fisheries Technical Circular No. 60. ISSN -229-1150.
Beauchamp and Van Tassel Beauchamp, D.A., and J.J. Van Tassel. 2001. 2001 “Modeling Seasonal Trophic Interactions of Adfluvial
Bull Trout in Lake Billy Chinook, Oregon.” Trans. Amer. Fish. Soc. 130: 204-216.
Reclamation 2002 U.S. Bureau of Reclamation. 2002. Beulah Reservoir Water Quality Modeling Study, Vale Irrigation Project, Oregon. Denver, Colorado.
Brett 1971 Brett, J.R. 1971. “Energetic responses of salmon to temperature: a study of some thermal relations in the physiology and freshwater ecology of sockeye salmon (Oncorhynchus nerka).” Am. Zool. 11:99– 113.
Buchanan, Hanson, and Hooton Buchanan, D.V., M.L. Hanson, and R.M Hooton. 1997 1997. Status of Oregon’s Bull Trout. Oregon
Department of Fish and Wildlife, Portland, Oregon.
24

Beulah Reservoir Minimum Pool and Prey Base Studies 2010 – 2013 Part 2 Bioenergetics, Population Sustainability
Parenthetical Reference Bibliographic Citation
Carpenter, Kitchell, and Hodgson Carpenter, S.R., J.F. Kitchell, and J.R. Hodgson. 1985 1985. “Cascading trophic interactions and lake
productivity.” Bioscience 35:634-639
Currie, Bennett, and Beitinger Currie, R.J., W.A. Bennett, and T.L. Beitinger. 1998. 1998 Critical thermal minima and maxima of three
freshwater game-fish species acclimated to constant temperatures. Environ. Biol. Fish. 51: 198-200.
Grande and Andersen 1991 Grande, M., and S. Andersen. 1991. Critical thermal maxima for young salmoninds. J. Freshw. Ecol. 6:275–279.
Hokanson, Kleiner, and Hokanson, K.E.F., C.F. Kleiner, and T.W. Thorslund. Thorslund 1977 1977. Effect of constant temperatures and diel
temperature fluctuations on specific growth and mortality rates and yield of juvenile Rainbow Trout, Salmo gairdneri. J. Fish. Res. Board Can. 34:639– 648.
Lowery 2009 Lowery, D.E. 2009. Trophic relations and seasonal effects of predation on Pacific salmon by fluvial Bull Trout in a riverine foodweb. MS Thesis. University of Washington.
Mesa et al. 2012 Mesa, M.G., L.K. Weiland, H.E. Christiansen, S.T. Sauter, and D.A. Beauchamp. 2012. Development and Evaluation of a Bioenergetics Model for Bull Trout. Trans. Am. Fish. Soc., 142:1, 41-49.
Oscoz et al. 2005 Oscoz, J., P.M. Leunda, F. Campos, M.C. Escala, C. Garcia-Fresca, and R. Miranda. 2005. Spring diet composition of Rainbow Trout, Onchorhynchus mykiss (Walbaum, 1792) in the Urederra River (Spain). Ann. Limnol. –Int. J. Lim. 41:27-34
Petersen and Kofoot 2002 Petersen, J.H., and E.E. Kofoot. 2002. Conditions for growth and survival of Bull Trout in Beulah Reservoir, Oregon. 2001 Annual Report to the U.S. Bureau of Reclamation, Pacific Northwest Region, Boise, Idaho.
25

Beulah Reservoir Minimum Pool and Prey Base Studies 2010 – 2013 Part 2 Bioenergetics, Population Sustainability
Parenthetical Reference Bibliographic Citation
Petersen, Kofoot, and Rose 2003 Petersen, J.H., E.E. Kofoot, and B. Rose. 2003. Conditions for growth and survival of Bull Trout in Beulah Reservoir, Oregon. 2002 Annual Report to the U.S. Bureau of Reclamation, Pacific Northwest Region, Boise, Idaho.
Rieman and McIntyre 1993 Rieman, B.E., and J.D. McIntyre. 1993. Demographic and habitat requirements for conservation of Bull Trout. General Technical Report INT-302, U.S. Forest Service, Ogden, UT
Rieman and Allendorf 2001 Rieman, B.E., and F.W. Allendorf. 2001. Effective population size and genetic conservation criteria for Bull Trout. North American Journal of Fisheries Management. 21:756-764
Rose and Mesa 2007 Rose, B.P., and Mesa, M.G.. 2007. Bull Trout forage investigations in Beulah Reservoir, Oregon. 2006 Annual Report: U.S. Geological Survey Open-File Report 2009-1036, 38p.
Rose and Mesa 2009 Rose, B.P., and Mesa, M.G. 2009. Minimum pool and Bull Trout prey base investigations at Beulah Reservoir- Final report 2008: U.S. Geological Survey Open-File Report 2009-1068, 54p
Rose and Mesa 2013 Rose, B.P., and Mesa, M.G. 2013. Effects of summer drawdown on the fishes and larval chironimds in Beulah Reservoir, Oregon. Northwest Science 87:207-218
Saffel and Scarnecchia 1995 Saffel, P.D., and D.L. Scarnecchia. 1995. Habitat use by juvenile Bull Trout in belt-series geology watersheds of northern Idaho. Northwest Science 69:304-317
Schwabe et al. 2000 Schwabe, L., M. Tiley, R. Perkins, D. Gonzalez, W. Bowers, R. Rieber, A. Mauer, S. Bush, and C. Tait. 2000. Evaluation of the life history of native salmonids in the Malheur River basin. Project No. 1997-01900. BPA report DOE/BP-00006313-1.
26

Beulah Reservoir Minimum Pool and Prey Base Studies 2010 – 2013 Part 2 Bioenergetics, Population Sustainability
Parenthetical Reference Bibliographic Citation
Selong et al. 2001 Selong, J.H., T.E. McMahon, A.E. Zale, and F.T. Barrows. 2001. Effect of temperature on growth and survival of Bull Trout, with application of an improved method for determining thermal tolerance in fishes. Transactions of the American Fisheries Society. 130:1026-1037.
Salow 2004 Salow, T.D. 2004. Population Structure and Movement Patterns of Adfluvial Bull Trout (Salvelinus confluentus) in the North Fork Boise River Basin, Idaho. Technical Report for Upper Snake River Biological Opinion# 1009.2700.
Taniguchi et al. 1998 Taniguchi, Y, F.J. Rahel, D.C. Novinger, and K.G. Gerow. 1998. Temperature mediation of competitive interactions among three fish species that replace each other along longitudinal stream gradients. Canadian Journal of Fisheries and Aquatic Sciences. 55:1894–1901.
van Poorten and Walters 2010 van Poorten, B.T., and C.J. Walters. Estimation of Bioenergetics Parameters for Rainbow Trout (Oncorhynchus mykiss) Using Capture-Recapture Data with Comparison to Estimates from a Laboratory-Based Model. The Open Fish Science Journal 3:69-69.
27

Beulah Reservoir Minimum Pool and Prey Base Studies 2010 – 2013 Part 2 Bioenergetics, Population Sustainability
This page intentionally left blank.
28

Beulah Reservoir Minimum Pool and Prey Base Studies 2010 – 2013 Part 2 Bioenergetics, Population Sustainability
FIGURES AND TABLES
29

Beulah Reservoir Minimum Pool and Prey Base Studies 2010 – 2013 Part 2 Bioenergetics, Population Sustainability
This page intentionally left blank.
30

Beulah Reservoir Minimum Pool and Prey Base Studies 2010 – 2013 Part 2 Bioenergetics, Population Sustainability
Figure 1. Typical pattern of net sets during spring when reservoir was at its fullest. For more detail on netting locations see Prey Base report . Red dot in upper northwest corner is approximate location of inflow weir and PIT tag array.
31

Beulah Reservoir Minimum Pool and Prey Base Studies 2010 – 2013 Part 2 Bioenergetics, Population Sustainability
Figure 2. Typical fyke net set along shoreline of Beulah Reservoir. Lead line extends out from shore to net. This set is shallower than most, as most sets were typically selected to have just the top of the hoops exposed
32

Beulah Reservoir Minimum Pool and Prey Base Studies 2010 – 2013 Part 2 Bioenergetics, Population Sustainability
Figure 3. Typical antenna installation. Job box and solar array can be seen in the background while left foreground shows antenna with tuning box attached to fence post. Second picture shows pair of antenna as strung across the inflow above Beulah Reservoir. Due to slower read rates when multiplexing, we typically only used the better tuned of the two antennas.
33

Beulah Reservoir Minimum Pool and Prey Base Studies 2010 – 2013 Part 2 Bioenergetics, Population Sustainability
Table 1. Bioenergetics parameters used for the Bull Trout model (from Mesa et al. 2012).
***** Consumption Variables ***** Ca: 0.132 Cb: -0.14 Ck1: 0.06 Ck4: 0.38 Cq: 3 Ctl: 21 Ctm: 17.5 Cto: 15.8 Eq: 3 Ration: 0
***** Egestion & Excretion Variables ***** Eq: 2 Fa: 0.212 Fb: -0.222 Fg: 0.631 Ua: 0.031 Ub: 0.58 Ug: -0.299
***** Predator Caloric Density Variables **** Alpha1: 5322 Alpha2: 6149 Beta1: 5.09 Beta2: 0.367 Cal: 0 Cutoff: 100 Eq: 2 Cutoff: 0
***** Respiration Variables ***** Act: 1 Bact: 0 Eq: 1 Ra: 0.001 Rb: -0.127 Rk1: 1 Rk4: 0 Rq: 0.083 Rt1: 0 Rtm: 0 Rto: 0 Sda: 0.172
34
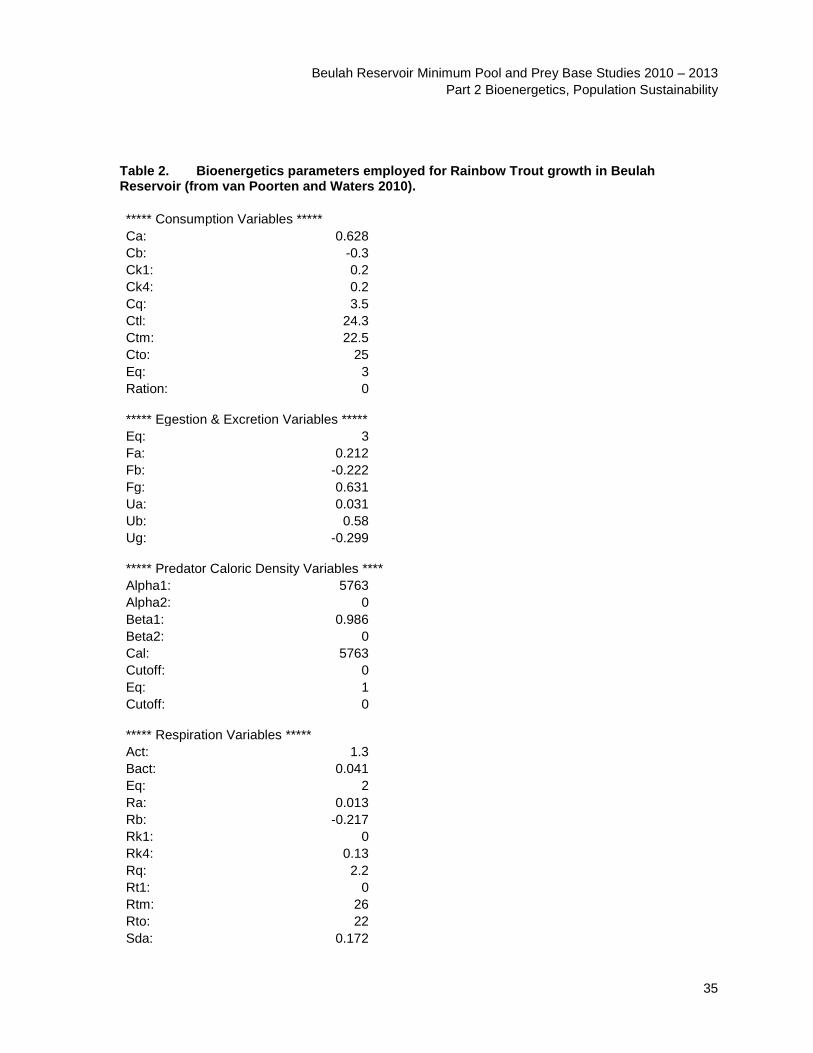
Beulah Reservoir Minimum Pool and Prey Base Studies 2010 – 2013 Part 2 Bioenergetics, Population Sustainability
Table 2. Bioenergetics parameters employed for Rainbow Trout growth in Beulah Reservoir (from van Poorten and Waters 2010).
***** Consumption Variables ***** Ca: 0.628 Cb: -0.3 Ck1: 0.2 Ck4: 0.2 Cq: 3.5 Ctl: 24.3 Ctm: 22.5 Cto: 25 Eq: 3 Ration: 0
***** Egestion & Excretion Variables ***** Eq: 3 Fa: 0.212 Fb: -0.222 Fg: 0.631 Ua: 0.031 Ub: 0.58 Ug: -0.299
***** Predator Caloric Density Variables **** Alpha1: 5763 Alpha2: 0 Beta1: 0.986 Beta2: 0 Cal: 5763 Cutoff: 0 Eq: 1 Cutoff: 0
***** Respiration Variables ***** Act: 1.3 Bact: 0.041 Eq: 2 Ra: 0.013 Rb: -0.217 Rk1: 0 Rk4: 0.13 Rq: 2.2 Rt1: 0 Rtm: 26 Rto: 22 Sda: 0.172
35

1/1
2/1
3/1
4/1
5/1
6/1
7/1
8/1
9/1
10/1
11
/1
12/1
Beulah Reservoir Storage
60000
50000
40000
30000
20000
Res
ervo
irSt
orag
e (A
F) 10000
4000040000
5000050000
6000060000
1970
0
1980 Year
1990 2000
2010
2013 2012
2011
2010
3000030000
2000020000
1000010000
00
Date
Beulah Reservoir Minimum Pool and Prey Base Studies 2010 – 2013 Part 2 Bioenergetics, Population Sustainability
Figure 4. Reservoir storage patterns in Beulah Reservoir since 1970. The lower panel shows water levels during the years of our study. Full pool elevation in Beulah Reservoir is 59,900 acre-feet.
36

9/1/10
12/1/
10
3/1/11
6/1/11
9/1/11
12/1/
11
3/1/12
6/1/12
9/1/12
12/1/
12
3/1/13
6/1/13
9/1/13
12/1/
13
Beulah Reservoir Inflow Temperatures 35
Daily Min Temp Daily Max Temp 30 Daily Mean Temp
25
20
15
10
5
0
Date
Tem
pera
ture
(C0 )
Beulah Reservoir Minimum Pool and Prey Base Studies 2010 – 2013 Part 2 Bioenergetics, Population Sustainability
Figure 5. Seasonal pattern of inflow temperatures to Beulah Reservoir as measured at the USGS gage, MABO upstream of Beulah Reservoir. Vertical black lines in 2012 and 2013 represent last upstream detection in the spring and first downstream detection in the fall of Bull Trout. The Bull Trout critical habitat target thermal range is 2oC – 15oC; 15oC is marked by a black horizontal line.
37

5/1/20
12
6/1/20
12
7/1/20
12
8/1/20
12
9/1/20
12
10/1/
2012
11/1/
2012
12/1/
2012
1/1/20
13
2/1/20
13
3/1/20
13
4/1/20
13
5/1/20
13
6/1/20
13
7/1/20
13
8/1/20
13
9/1/20
13
10/1/
2013
11/1/
2013
30
Water Temperature Beulah 5/12-10/13
25 Bottom
Surface 20 1m
15
10
5
0
Date
Tem
pera
ture
(Co )
Beulah Reservoir Minimum Pool and Prey Base Studies 2010 – 2013 Part 2 Bioenergetics, Population Sustainability
Figure 6. Seasonal pattern of inflow temperatures to Beulah Reservoir as measured at the USGS gage, MABO upstream of Beulah Reservoir. Vertical black lines in 2012 and 2013 represent last upstream detection in the spring and first downstream detection in the fall of Bull Trout. The Bull Trout critical habitat target thermal range is 2oC – 15oC; 15oC is marked by a black horizontal line.
38

Percent composition of prey mass found in Bull Trout stomachs
22.0
0.2
0.4
61.1
8.5
0.2
3.6
2.9
Redside shiner
Longnose dace
Redband trout
Sculpins
Sucker Spp.
Ephemeroptera
Dipteran larvae
Dipteran Pupae
Coleoptera
Daphnia
Oligochaeta
Unk
NPM
Beulah Reservoir Minimum Pool and Prey Base Studies 2010 – 2013 Part 2 Bioenergetics, Population Sustainability
Figure 7. Relative prey consumption for Bull Trout by biomass for all Bull Trout collected from Beulah Reservoir.
39
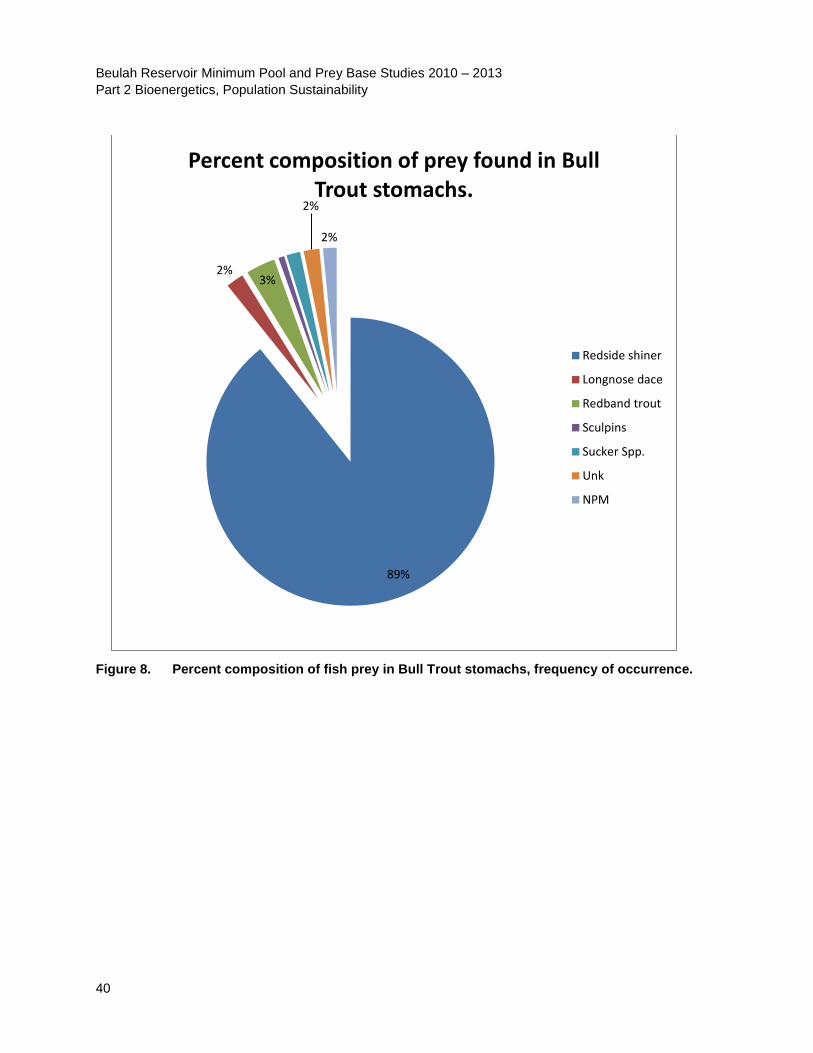
Percent composition of prey found in Bull Trout stomachs.
2%
2%
2%
89%
Redside shiner
Longnose dace
Redband trout
Sculpins
Sucker Spp.
Unk
NPM
3%
Beulah Reservoir Minimum Pool and Prey Base Studies 2010 – 2013 Part 2 Bioenergetics, Population Sustainability
Figure 8. Percent composition of fish prey in Bull Trout stomachs, frequency of occurrence.
40

Beulah Reservoir Minimum Pool and Prey Base Studies 2010 – 2013 Part 2 Bioenergetics, Population Sustainability
Table 3. Estimated age and length–at-age for Bull Trout collected from Beulah Reservoir.
41

Beulah Reservoir Minimum Pool and Prey Base Studies 2010 – 2013 Part 2 Bioenergetics, Population Sustainability
Scale Derived Growth Estimates
Age (years)
0 1 2 3 4 5 6 7 8
Estim
ated
Len
gth
(mm
)
0
100
200
300
400 Y = 17.9 + 52.2 (years)
Figure 9. Estimated size at age based on scale analyses for Bull Trout captured from Beulah Reservoir.
42

Beulah Reservoir Minimum Pool and Prey Base Studies 2010 – 2013 Part 2 Bioenergetics, Population Sustainability
Table 4. Growth of PIT Tagged Bull Trout recaptured from Beulah Reservoir. Fish captured in April and again in October would have spent the summer higher in the watershed. The two October - April fish overwintered in Beulah Reservoir.
Date Capture
Date Recapture
Initial Length (mm)
Recaptured Length
Initial Weight (g)
Recaptured Weight
4/15/2012 10/11/2014 278 361 361 477
4/14/2012 10/14/2012 268 371 196 375
5/1/2012 10/14/2012 290 337 295 420
4/19/2012 10/15/2012 262 324 201 403
5/6/2012 10/2/2012 321 349 416 440
4/14/2012 10/15/2012 354 402 522 552
4/12/2012 10/11/2012 278 341 224 394
Average 62
10/18/2012 4/16/2013 379 401 564 640
10/15/2012 4/10/2013 352 371 421 521
Average 21
43

K Spring 2012 K Spring 2011
1.6
1.4
1.2
1
0.8
0.6 200 250 300 350
K Spring 2013
Avgerage K Spring 2011 = 1.12 2012 = 1.13 2013 = 1.03
Cond
ition
Co
nditi
on
500 550 600
200 250 300 350 400 450 500 550 600 Fork Length
400 450 Fork Length
K Fall 2012 Fall 2013
1.6
1.4
1.2
1
0.8
0.6
Average K Fall 2011 = N/A 2012 = 1.00 2013 = 1.04
Beulah Reservoir Minimum Pool and Prey Base Studies 2010 – 2013 Part 2 Bioenergetics, Population Sustainability
Figure 10. Bull Trout K factor across three years of study. Top panel is K factor for spring samples. These fish have overwintered in Beulah Reservoir. Bottom panel is for fish captured in the fall having summered in the upper watershed upstream of Beulah Reservoir.
44

Beulah Reservoir Minimum Pool and Prey Base Studies 2010 – 2013 Part 2 Bioenergetics, Population Sustainability
Pit tagged Bull Trout Movement Timing into and Out of Beulah Reservoir
Date
9/1/11
11/1/
111/1
/123/1
/125/1
/127/1
/129/1
/12
11/1/
121/1
/133/1
/135/1
/137/1
/139/1
/13
11/1/
13
Five fish detected moving downstream Fall 2011 Fifteen fish moving upstream detected Spring 2012 Eight through end of field season moving down Fall 2012 Thirty Five Fish moving up in Spring 2013
Of 67 Bull trout detected at the antenna 58 moved when it was dark.
Spring 2012 antenna experienced electrical problems and was blown out by weir and non-operational for a significant period of time from April-May.
Downstream detections much more difficult do to fish speed and array design.
Figure 11. Pit tag detections at the antenna station just upstream of Beulah Reservoir depicting the time span each season fish were observed entering and exiting the reservoir. Most upstream and downstream migrations were observed to occur at night.
45

12000
Rainbow Trout Population
10000
8000
6000
4000
2000
0 sp 2011 f 2011 sp 2012 f 2012 sp 2013 f 2013
Beulah Reservoir Minimum Pool and Prey Base Studies 2010 – 2013 Part 2 Bioenergetics, Population Sustainability
Figure 12. Rainbow Trout population sampling for 6 sampling periods from spring 2011 through fall 2013 yielded population estimates of 5,375; 1,513; 3,757; 4,061; 1,657; and 1,849, respectively. Higher numbers of recaptures resulted in greater accuracy of overall population estimates following sampling during the spring of 2011.
46

Beulah Reservoir Minimum Pool and Prey Base Studies 2010 – 2013 Part 2 Bioenergetics, Population Sustainability
Table 5. Estimated population biomass of Rainbow Trout in Beulah Reservoir from spring 2011 through the fall of 2013. Biomass estimates were generated using the average weight of trout captured multiplied by the estimated fish population.
Period Weight Length N Population Biomass Trout (g)
Spring 2011 371.1569 628.211 102 5375 1994968.137
Fall 2011 398.5965 797.158 57 1512 602677.8947
Spring 2012 405.1603 758.387 132 3757 1522187.267
Fall 2012 314.6642 383.166 543 4061 1277851.343
Spring 2013 359.5524 439.052 391 1657 595778.376
Fall 2013 320.7377 285.308 320 1848 592723.1852
47

Percent composition of prey mass found in Rainbow Trout stomachs
0.2
0.1
0.2
2.4
10.6
5.8
15.3
1.0
64.4
Redside shiner
Longnose dace
Ephemeroptera
Dipteran larvae
Dipteran Pupae
Unk
chiselmouth
hemiptera
plant/wood
Beulah Reservoir Minimum Pool and Prey Base Studies 2010 – 2013 Part 2 Bioenergetics, Population Sustainability
Figure 13. Relative prey consumption for Rainbow Trout by biomass for all Rainbow Trout collected from Beulah Reservoir.
48

87%
11%
Percent composition of prey found in Rainbow Trout stomachs
Redside shiner
Longnose dace
Unk
chiselmouth
Beulah Reservoir Minimum Pool and Prey Base Studies 2010 – 2013 Part 2 Bioenergetics, Population Sustainability
Figure 14. Percent composition of fish prey in Rainbow Trout stomachs, frequency of occurrence.
49

Spring 2011 Spring 2012 Spring 2013 Average K Spring 1.8 2011 = 1.10
2012 = 1.10 1.6 2013 = 0.89
1.4
1.2
ition
1.0 Cond
0.8
0.6
0.4 100 150 200 250 300 350 400 450 500 550 600
Fork Length
Fall 2011 Fall 2012 Fall 2013 Average K Fall 2011 = 1.19
1.8 2012 = 0.99 2013 = 0.79 1.6
1.4
1.2
1
0.8
0.6
0.4 100 150 200 250 300 350 400 450 500 550 600
Fork Length
Cond
ition
Beulah Reservoir Minimum Pool and Prey Base Studies 2010 – 2013 Part 2 Bioenergetics, Population Sustainability
Figure 15. Fulton condition factor K of Rainbow Trout collected from Beulah Reservoir from 2011-2013. Top panel represents fish collected during the spring, and bottom panel represents those collected during fall surveys.
50

Beulah Reservoir Minimum Pool and Prey Base Studies 2010 – 2013 Part 2 Bioenergetics, Population Sustainability
Date
Oct Nov Dec Jan Feb Mar Apr May
Wei
ght o
f Fis
h (g
)
520
540
560
580
600
620
640
660
Tem
pera
ture
(0 C)
0
2
4
6
8
10
12
14
16
Figure 16. Data from one of two Bull Trout overwintering in Beulah Reservoir we recaptured. This fish was first captured on October 4, 2012, and recaptured on April 18, 2013. It left the reservoir of May11th, 2013. At time of first capture it weighed 539 grams and was 371 mm TL, at recapture it was 403 mm TL, and 650 grams. The figure below predicts that the growth pattern likely was using modeled data. The black line represents weight and the red dashed line, temperature.
51

Beulah Reservoir Minimum Pool and Prey Base Studies 2010 – 2013 Part 2 Bioenergetics, Population Sustainability
Date
Oct Nov Dec Jan Feb Mar Apr May
Spec
ific
Gro
wth
Rat
e (g
/g p
reda
tor/d
ay)
-0.001
0.000
0.001
0.002
0.003
0.004
0.005
0.006
0.007
Tem
pera
ture
(0 C)
0
2
4
6
8
10
12
14
16
Figure 17. Data from the same Bull Trout overwintering in Beulah Reservoir. This fish was first captured on October 4, 2012, and recaptured on April 18, 2013. It left the reservoir of May11, 2013. Data here represents specific growth rate of Bull Trout as weight increase in grams per gram of predator weight. The black line represents specific growth and the red dashed line, temperature.
52

Beulah Reservoir Minimum Pool and Prey Base Studies 2010 – 2013 Part 2 Bioenergetics, Population Sustainability
Date
Oct Nov Dec Jan Feb Mar Apr May
Gra
ms
Prey
Fis
h/D
ay
0
2
4
6
8
10
Tem
pera
ture
(0 C)
0
2
4
6
8
10
12
14
16
Figure 18. Data from one of two Bull Trout overwintering in Beulah Reservoir we recaptured. This fish was first captured on October 4, 2012, and recaptured on April, 18, 2013. It left the reservoir of May11, 2013. The graph shows modeled daily prey consumption for this fish based on its weight and what would be needed to support a fish of its size under the given temperature regime. The black line represents grams of prey fish/day, and the red dashed line, temperature.
53

Beulah Reservoir Minimum Pool and Prey Base Studies 2010 – 2013 Part 2 Bioenergetics, Population Sustainability
Date
Oct Nov Dec Jan Feb Mar Apr May
Spec
ific
Con
sum
ptio
n g
prey
/ g p
red/
day
0.000
0.002
0.004
0.006
0.008
0.010
0.012
0.014
0.016
0.018
0.020
Tem
pera
ture
(0 C)
0
2
4
6
8
10
12
14
16
Figure 19. Data from one of two Bull Trout overwintering in Beulah Reservoir we recaptured. This fish was first captured on October 4, 2012, and recaptured on April, 18, 2013. It left the reservoir of May11, 2013. Specific prey consumption for Bull Trout. Assuming most Bull Trout in Beulah Reservoir are similar metabolically the following graph represents the amount of prey required on a daily basis as grams of prey per grams of predator per day. In early fall when the water was still warm consumption approaches 2 percent of body weight per day, but is an order of magnitude lower in the winter. The black line represents specific consumption and the red dashed line, temperature.
54
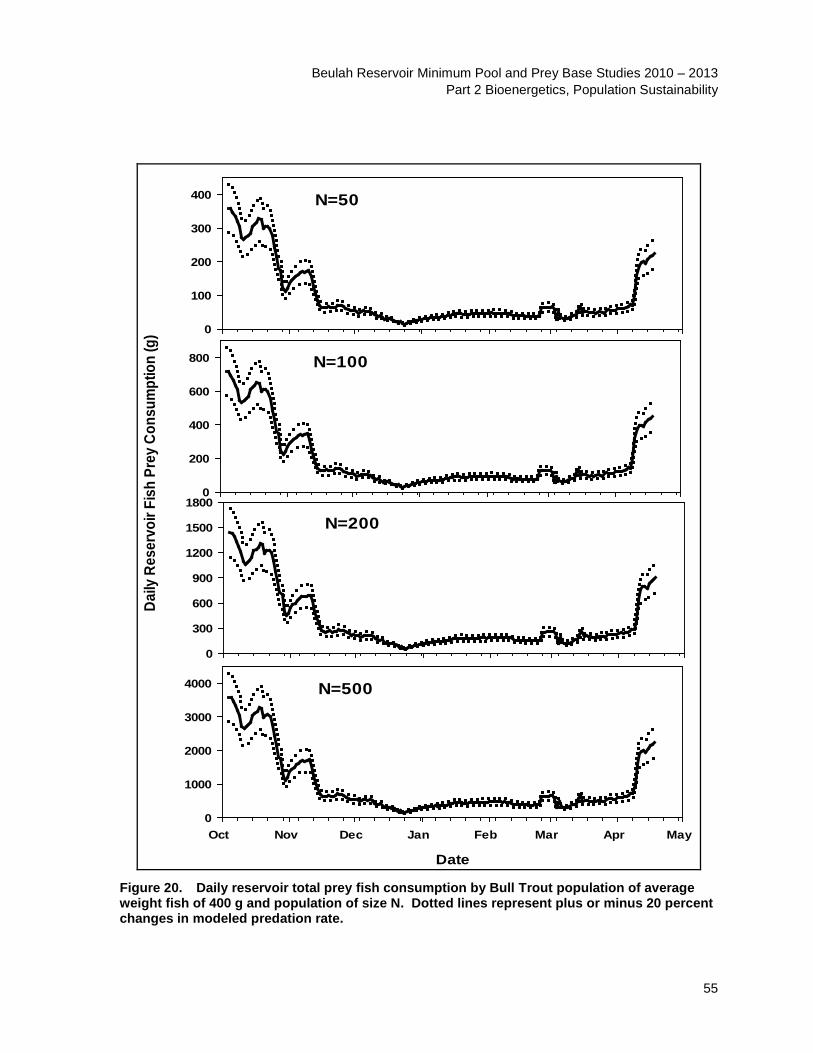
Beulah Reservoir Minimum Pool and Prey Base Studies 2010 – 2013 Part 2 Bioenergetics, Population Sustainability
N=50
0
100
200
300
400
N=100
0
200
400
600
800
N=200
Daily
Res
ervo
ir Fi
sh P
rey
Cons
umpt
ion
(g)
0
300
600
900
1200
1500
1800
N=500
Date
Oct Nov Dec Jan Feb Mar Apr May 0
1000
2000
3000
4000
Figure 20. Daily reservoir total prey fish consumption by Bull Trout population of average weight fish of 400 g and population of size N. Dotted lines represent plus or minus 20 percent changes in modeled predation rate.
55

25000
N=50 20000
15000
10000
5000
0
50000
N=100 40000
30000
20000
10000
0 100000
N=200 80000
60000
40000
20000
0 250000
N=500 200000
150000
100000
50000
0
Oct Nov Dec Jan Feb Mar Apr May
Date
Cum
mul
ativ
e R
eser
voir
Prey
Fis
h C
onsu
mpt
ion
(g)
Beulah Reservoir Minimum Pool and Prey Base Studies 2010 – 2013 Part 2 Bioenergetics, Population Sustainability
Figure 21. Seasonal cumulative prey fish consumption by Bull Trout population of average weight fish of 400 g and populations of size N in Beulah Reservoir. Dotted lines represent plus or minus 20 percent changes in modeled predation rate.
56

Beulah Reservoir Minimum Pool and Prey Base Studies 2010 – 2013 Part 2 Bioenergetics, Population Sustainability
Table 6. Growth data from recaptured Rainbow Trout in Beulah Reservoir.
Time Int StartDate Days Start End Avg Weight percent change 5/11-10/11 1 40688 137 602 896 749 0.39 9/11-4/12 2 40811 212 930 1231 1080 0.28 9/11-4/12 2 40813 217 1105 894 999 -0.21 9/11-4/12 2 80810 204 415 720 566 0.54 4/12-10/12 3 41013 187 1806 1584 1695 -0.13 4/12-10/12 3 41027 166 622 659 640.5 0.06 4/12-10/12 3 41027 172 827 910 868.85 0.10 10/12-4/13 4 41186 193 632 536 548 -0.16 10/12-4/13 4 41186 189 218 220 219 0.01 10/12-4/13 4 41187 202 611 500 555.5 -0.20 10/12-4/13 4 41197 203 745 559 652 -0.25 10/12-4/13 4 41188 212 789.2 636 712.6 -0.21 10/12-4/13 4 41187 198 615.2 552 639.1 0.07 10/12-4/13 4 41196 186 210 186 198 -0.12 10/12-4/13 4 41199 198 596 406 501 -0.38 10/12-4/13 4 41193 183 240 221 230.5 -0.08 10/12-4/13 4 41193 186 948 730 839 -0.26 10/12-4/13 4 41197 200 183 199 191 0.08 10/12-4/13 4 41199 196 182 203 192.5 0.11 10/12-4/13 4 41196 204 598 489 543.5 -0.20 10/12-4/13 4 41194 182 768 637 702.5 -0.19 10/12-4/13 4 41194 206 1305 937 1121 -0.33 10/12-4/13 4 41199 203 745 552 648.5 -0.30 5/13-10/13 5 41397 161 318 292 305 -0.09 5/13-10/13 5 41397 161 225 195 210 -0.14 5/13-10/13 5 41391 170 302 271 286.5 -0.11 5/13-10/13 5 41395 162 216 234 225 0.08 5/13-10/13 5 41392 170 170 221 195.5 0.26 5/13-10/13 5 41376 181 324 312 318 -0.04 5/13-10/13 5 41375 183 610 533 571.5 -0.13 5/13-10/13 5 41379 172 181 209 1995 0.14 4/12-4/13 6 41023 367 1231 948 1098 -0.26 10/12-10/13 7 41193 359 580 387 483 -0.40 10/12-10/13 4 41187 375 191.1 280 235.55 0.38
57

Beulah Reservoir Minimum Pool and Prey Base Studies 2010 – 2013 Part 2 Bioenergetics, Population Sustainability
Figure 22. Modelled daily whole reservoir prey consumption by Rainbow Trout residing in Beulah Reservoir. Consumption estimates are based on populations estimates obtained through mark recapture for each time period. Black lines denoted P indicate a plankton diet where red lines denoted F indicate a fish diet.
58

Beulah Reservoir Minimum Pool and Prey Base Studies 2010 – 2013 Part 2 Bioenergetics, Population Sustainability
Figure 23. Modelled cumulative whole reservoir prey consumption by Rainbow Trout residing Beulah Reservoir. Consumption estimates are based on populations estimates obtained through mark recapture for each time period. Black lines denoted P indicate a plankton diet where red lines denoted F indicate a fish diet
59

Beulah Reservoir Minimum Pool and Prey Base Studies 2010 – 2013 Part 2 Bioenergetics, Population Sustainability
Year
Fall 2010 Fall 2011 Fall 2012 Fall 2013
Ln (D
ipte
ran
Den
sity
)
2.0
2.2
2.4
2.6
2.8
3.0
3.2
3.4
3.6
End
of S
easo
n Vo
lum
e (a
f)
0
2000
4000
6000
8000
10000
12000
14000
16000
18000
Figure 24. Fall benthic dipteran density as a function of end of season water level in Beulah Reservoir during the period 2010-2013.
60
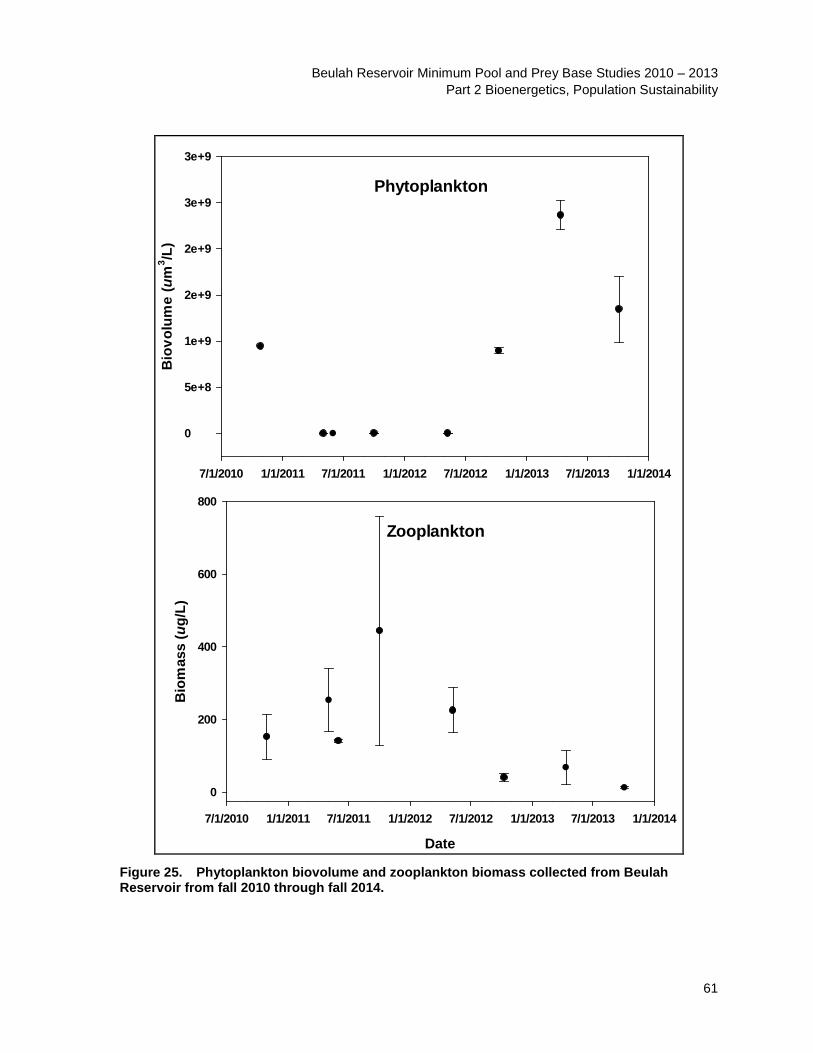
Beulah Reservoir Minimum Pool and Prey Base Studies 2010 – 2013 Part 2 Bioenergetics, Population Sustainability
Phytoplankton
7/1/2010 1/1/2011 7/1/2011 1/1/2012 7/1/2012 1/1/2013 7/1/2013 1/1/2014
Bio
volu
me
(um
3 /L)
0
5e+8
1e+9
2e+9
2e+9
3e+9
3e+9
Zooplankton
Date
7/1/2010 1/1/2011 7/1/2011 1/1/2012 7/1/2012 1/1/2013 7/1/2013 1/1/2014
Bio
mas
s (u
g/L)
0
200
400
600
800
Figure 25. Phytoplankton biovolume and zooplankton biomass collected from Beulah Reservoir from fall 2010 through fall 2014.
61

1/1/20
06
1/1/20
07
1/1/20
08
1/1/20
09
1/1/20
10
1/1/20
11
1/1/20
12
1/1/20
13
1/1/20
14
60000 1200000
100000050000
Rese
rvoi
r Sto
rage
(AF)
800000 40000
600000
30000
400000
20000
200000
10000 0
0
Fish
Pop
ulat
ion
Year
Beulah Reservoir Minimum Pool and Prey Base Studies 2010 – 2013 Part 2 Bioenergetics, Population Sustainability
Figure 26. Hydroacoustic estimation of fish populations in Beulah Reservoir (black circles) vs net estimates (red circles) including data from 2006 to 2008 from Rose and Mesa’s 2013 USGS study. Hydroacoustic estimates are not equivalent to mark-recapture data across study periods, but within our study period were a good check of trends in fish populations during fall sampling periods. Spring periods differed significantly as hydroacoustics were ineffective for sampling areas of the reservoir containing flooded vegetation and shallow weedy habitat. In the fall low reservoir pool provided an ideal sampling volume.
62
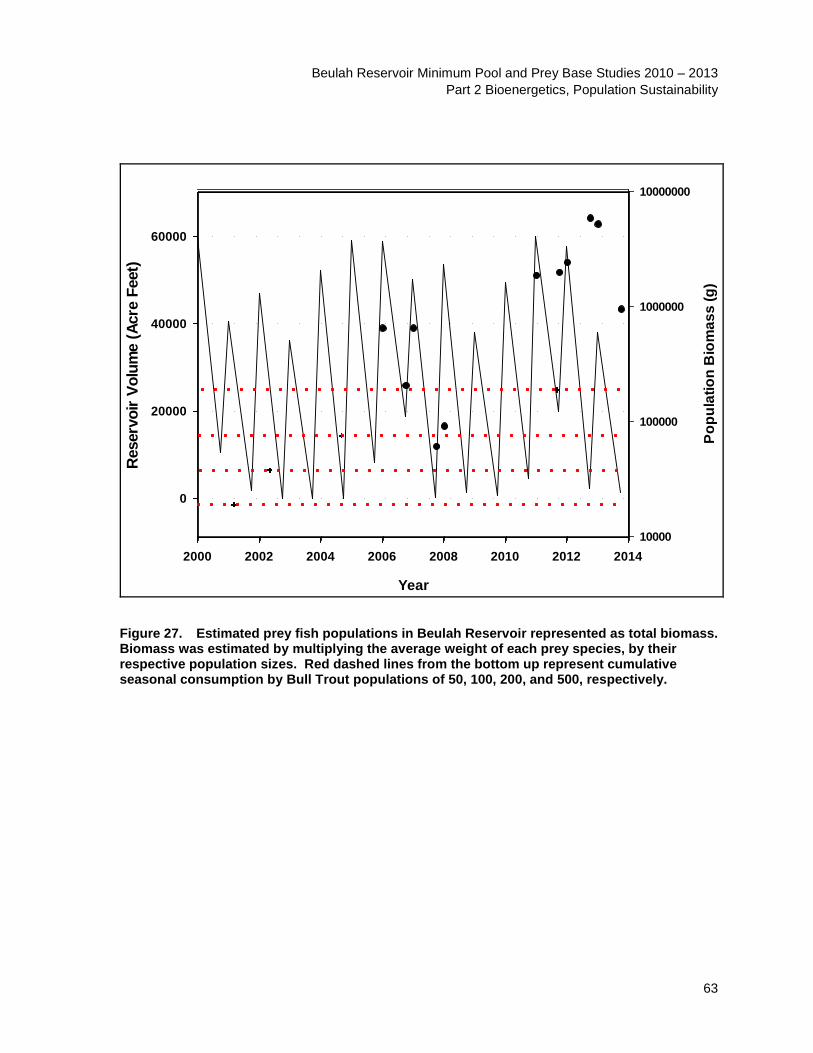
Beulah Reservoir Minimum Pool and Prey Base Studies 2010 – 2013 Part 2 Bioenergetics, Population Sustainability
2000 2002 2004 2006 2008 2010 2012 2014
Rese
rvoi
r Vol
ume
(Acr
e Fe
et)
0
20000
40000
60000
Year
Popu
latio
n B
iom
ass
(g)
10000
100000
1000000
10000000
Figure 27. Estimated prey fish populations in Beulah Reservoir represented as total biomass. Biomass was estimated by multiplying the average weight of each prey species, by their respective population sizes. Red dashed lines from the bottom up represent cumulative seasonal consumption by Bull Trout populations of 50, 100, 200, and 500, respectively.
63

Beulah Reservoir Minimum Pool and Prey Base Studies 2010 – 2013 Part 2 Bioenergetics, Population Sustainability
This page intentionally left blank.
64