between big and small: the role of medium-sized enterprise ... · between big and small: the role...
TRANSCRIPT

Between big and small: the role of medium-sized enterprise in Italy and Europe
Fulvio Coltorti
Unione Industriale Torino
Make it in Italy. 24 October2011
2
Why “medium-size” in industry?

3
Revolution in manufacturing…
Japan. 1950s: Toyota introduces lean production systems; Europe and the U.S. discover them30 years later
Italy. 1970s: industrial districts grow up, as socio-territorial entities in which communities ofpeople are embedded into populations of firms specializing in producing selected goods
USA. 1980s: Fordism model starts to decline under the Japanese invasion of US markets,backed by higher productivity levels; downsizing is the new view in the largest manufacturingcorporations
2000-: globalization is at full speed; firms destructure by forming international value chains

4
Down-sizing in Italy
Mediobanca figures for manufacturing companies: value added as % of turnover
30,730.0
29,6
28.7
27,9
26,8
25.2
25.8
24.6
24,3
23,322,8
21,921,4
21,921,6 21,5
20,8 20,6
19,6
1990 1991 1992 1993 1994 1995 1996 1997 1998 1999 2000 2001 2002 2003 2004 2005 2006 2007 2008

5
Medium-sized enterprises in Italy
6
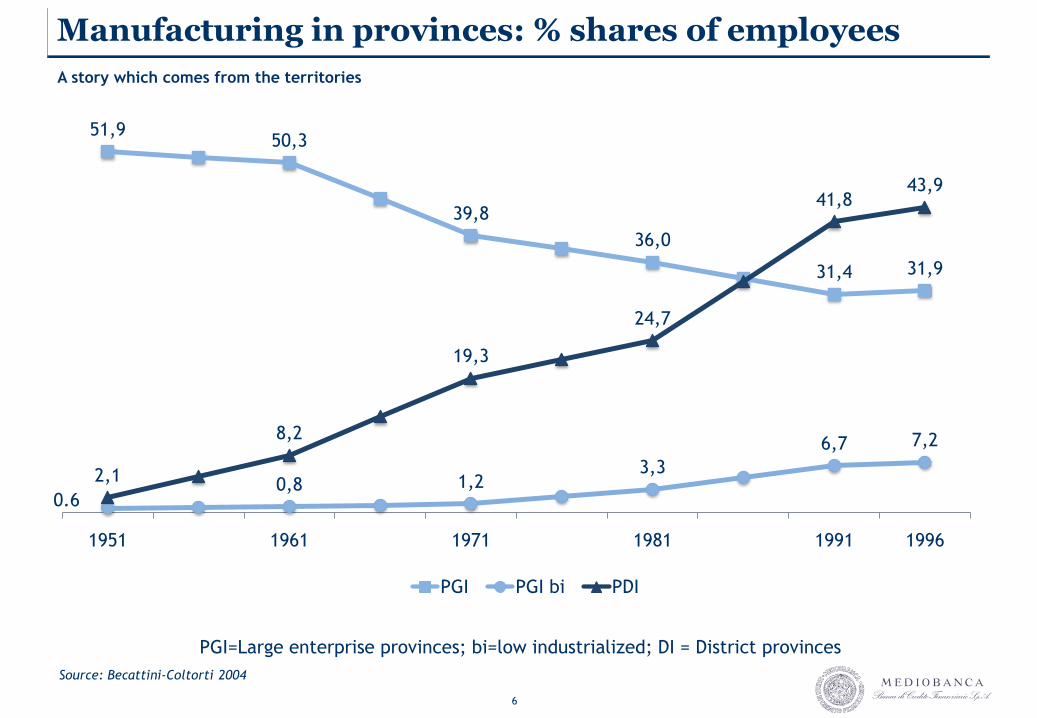
Manufacturing in provinces: % shares of employees
A story which comes from the territories
51,950,3
39,8
36,0
31,4 31,9
0.60,8 1,2
3,3
6,7 7,2
2,1
8,2
19,3
24,7
41,843,9
1951 1961 1971 1981 1991 1996
PGI PGI bi PDI
Source: Becattini-Coltorti 2004
PGI=Large enterprise provinces; bi=low industrialized; DI = District provinces

7
Italian industry value added
Index 1999=100; Istat figures at current prices – in 2010: districts and 4th cap. goods 115. Large enterprise goods
103
95
100
105
110
115
120
125
130
1999 2000 2001 2002 2003 2004 2005 2006 2007 2008 2009 2010
Large enterprise goods Districts and 4th capitalism goods

8
Value added: MSEs and major groups
Index 1995=100; Mediobanca figures at current prices – in 2010: MSEs 144. Major groups 84
70,0
80,0
90,0
100,0
110,0
120,0
130,0
140,0
150,0
160,0
1995 1996 1997 1998 1999 2000 2001 2002 2003 2004 2005 2006 2007 2008 2009 2010
Major groups MSEs

9
Manufacturing value added by companies in 2007
Estimates based on data from Mediobanca and Unioncamere
The importance of the fourth capitalism sector
Major corporate groups
8.4
Non-Italian LEs 13.0
Medium-to-large enterprises
10.3
Medium-sized enterprises
18.3
Small enterprises50.0
4th capitalism
& allied industries
40-50%

10
Engine of growth: export-import balances
55.80361.700 65.747 63.280 60.337 63.354 62.895
68.70877.951 79.822
62.681 64.52770.785
-20.067 -23.236 -20.937 -21.152 -23.997 -25.809 -24.932 -29.012 -30.994-24.108 -20.061
-31.335 -34.973
1999 2000 2001 2002 2003 2004 2005 2006 2007 2008 2009 2010 2011e
Districts and 4th Capitalism Large enterprises
Manufacturing- €m
Based on Istat figures (coke and refineries products excluded)

11
Changing product mix
8.217
6.614
2.829
2.447
1.357
1.276
600
7.827
1.367
1.648
1.784
740
694
196
Mechanical engineering
Personal and household goods
Food
Chemical
Metallurgical
Paper, print and publishing
Other
In 1996 Change 1996-2008
Universe of medium-sized enterprises – Value-added 1996-2008
Made in Italy 62.6% (62.7% in 1996)
Non-Italian sales 36.5% (32.8% in 1996)
12
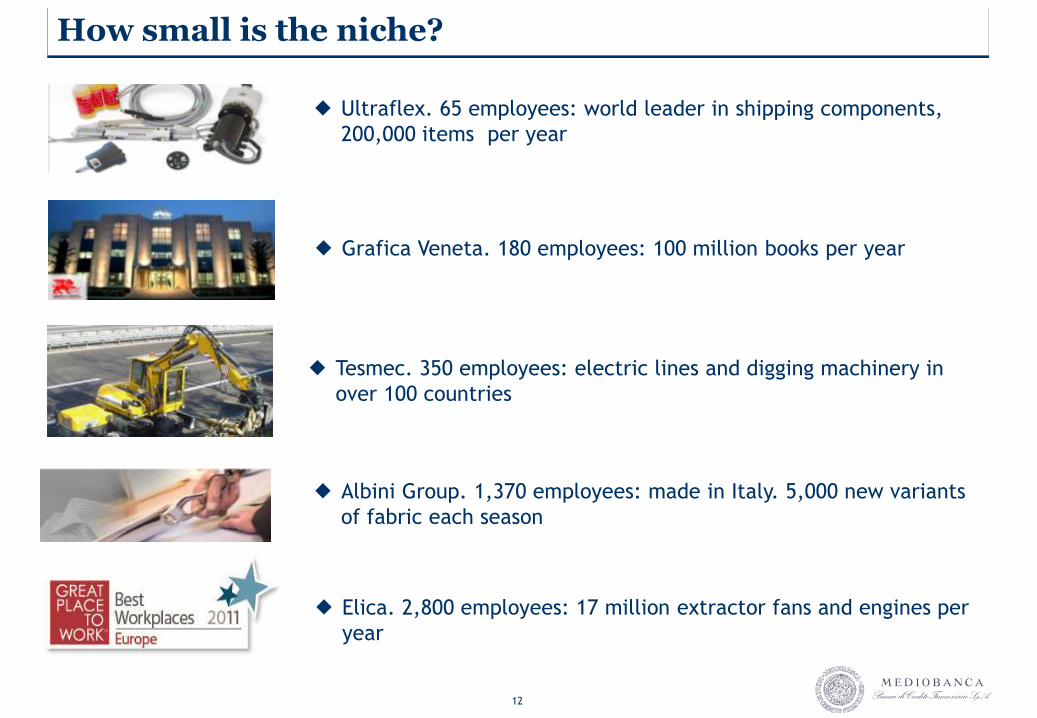
How small is the niche?
Ultraflex. 65 employees: world leader in shipping components,
200,000 items per year
Tesmec. 350 employees: electric lines and digging machinery in
over 100 countries
Albini Group. 1,370 employees: made in Italy. 5,000 new variants
of fabric each season
Elica. 2,800 employees: 17 million extractor fans and engines per
year
Grafica Veneta. 180 employees: 100 million books per year

13
MSEs in Europe

14
Firm size: classifications to be changed
France Germany Italy Spain UK
Number of firms 218,500 195,438 459,728 191,972 128,467
Micro (0-9) 188,500 119,418 373,932 155,699 96,912
Small (10-49) 23,000 55,131 74,647 30,468 23,275
Medium-sized I tranche (50-249) 5,600 16,720 9,753 4,937 6,699
Medium-sized II tr. + large (>249) 1,400 4,170 1,396 868 1,531
Employees (’000) 2,976 7,103 4,407 2,094 2,581
Micro (0-9) 850 467 1,055 407 277
Small (10-49) 680 1,094 1,405 623 536
Medium-sized I tranche (50-249) 840 1,773 944 485 671
Medium-sized II tr. + large (>249) 600 3,768 1,003 579 1,096
Based on Eurostat figures
Manufacturing– situation at 2008/2009 –French figures for classes of firms are our estimates

15
How many are true MSEs?
64%58%
64%
36%42%
36%
Germany Italy Spain
Large enterprise affiliates True MSEs
Turnover €10-250m; 50-499 employees – Source: Confindustria-R&S-Unioncamere. MSEs in Europe (2010)

16
Confindustria R&S Unioncamere survey
Germany, Italy and Spain
FY 2006

17
Medium-sized enterprises: a European phenomenon. but concentrated indeveloped areas - % of country totals; 2006
Germany
North Rhine-
Westphalia
Baden-
WürttembergBavaria
Total
West South South
No. of firms 25.7 20.3 17.5 63.5
Employees 26.9 22.9 17.2 67.0
Value-added 28.1 22.9 16.7 67.7
Italy
Lombardy Veneto Emilia-RomagnaTotal
Northwest Northeast Northeast
No. of firms 30.4 18.4 13.8 62.6
Employees 30.0 17.8 14.6 62.4
Value-added 32.5 17.3 15.4 65.2
Spain
Catalonia Valencia Basque CountryTotal
Northeast East North
No. of firms 28.4 13.8 12.3 54.5
Employees 30.2 13.7 13.1 57.0
Value-added 30.4 13.4 14.5 58.3
Medium-sized enterprises: a comparison between Germany, Italy and Spain
18
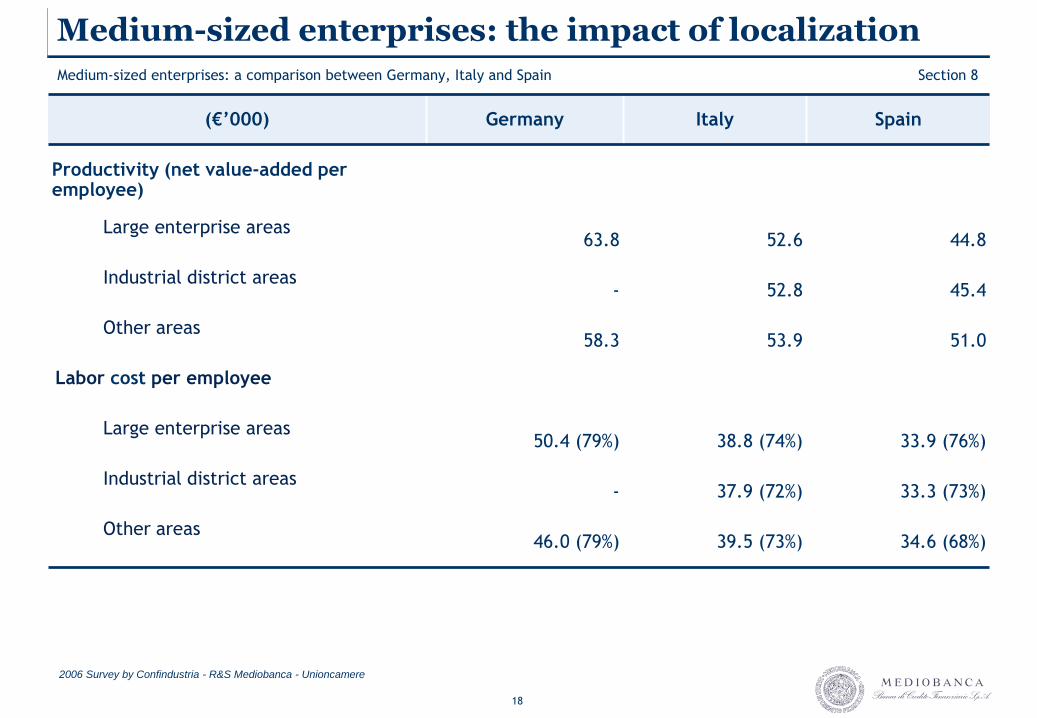
Medium-sized enterprises: the impact of localization
(€’000) Germany Italy Spain
Productivity (net value-added per employee)
Large enterprise areas63.8 52.6 44.8
Industrial district areas- 52.8 45.4
Other areas58.3 53.9 51.0
Labor cost per employee
Large enterprise areas50.4 (79%) 38.8 (74%) 33.9 (76%)
Industrial district areas- 37.9 (72%) 33.3 (73%)
Other areas46.0 (79%) 39.5 (73%) 34.6 (68%)
2006 Survey by Confindustria - R&S Mediobanca - Unioncamere
Medium-sized enterprises: a comparison between Germany, Italy and Spain Section 8

19
MSEs grouped by intensity of technology
31,139,9 39,6
26,3
30,2 33,4
33,9
26,0 19,3
8,73.9 7,7
Germany Italy Spain
Low Low-Medium Medium-High High
Based on OECD method - Turnover

20
Medium-sized enterprises: productivity by size class
(€’000) Germany Italy Spain
Net value-added per employee 59.6 52.2 47.6
Employeesize classes
50 – 99 72.6 55.2 54.0
100 – 249 61.6 51.4 47.5
250 – 499 58.2 51.0 44.8
500 – 749 57.5 - -
2006 Survey by Confindustria - R&S Mediobanca - Unioncamere
Medium-sized enterprises: a comparison between Germany, Italy and Spain Section 8

21
Productivity and wages: €’000 per employee
40,2 38,8
27,6
49,2
3936,9
41,4
33,931
51,2 51,8
40,4
62,5
54,4
47,4
52,3
46,2 46,9
DE IT SP DE IT SP DE IT SP
Wages Net Value Added
Mechanical engineering Personal & households goodsFood & drinks
Value added net of depreciation and amortization

22
Medium-sized enterprises: profitability by size class
% Germany Italy Spain
Net operating margin as % of value-added 19.6 23.4 24.2
Employee size classes
50 – 99 29.6 26.3 31.1
100 – 249 21.6 22.2 24.6
250 – 499 18.2 23.0 20.0
500 – 749 17.2 - -
2006 Survey by Confindustria - R&S Mediobanca - Unioncamere
Medium-sized enterprises: a comparison between Germany, Italy and Spain

23
MSEs: profits and taxation
Germany Spain ItalyItaly: major
manufacturing groups
NOM as % of value added 19.6% 24.2% 23.4% 9.6%
Germany = 100 100.0 123.5 119.4
ROE % 21.0 11.2 6.8
Germany = 100 100.0 53.1 31.8
Tax rate 25.8% 25.6% 48.3% 21.9%
Italian tax rate in 2010
• MSEs 35%
• Major groups 22%
NOM = net operating margin; ROE = Return on equity

24
Composition (as %) of tangible capital invested
-21,1 -22,8 -34,6 -34,6-17,1 -17,5
-22,6 -14,8
-61,8 -59,7-42,8 -50,6
28,651,8
36,3 36,3
49,1
40,450,4 50,4
22,37,8 13,3 13,3
Cash Working capital Net fixed assets Tangible net worth MLT borrowings ST borrowings
Germany Spain Italy Italy2
Italy2 = assuming excess tax for last 7 years vs LE assigned to capital
25
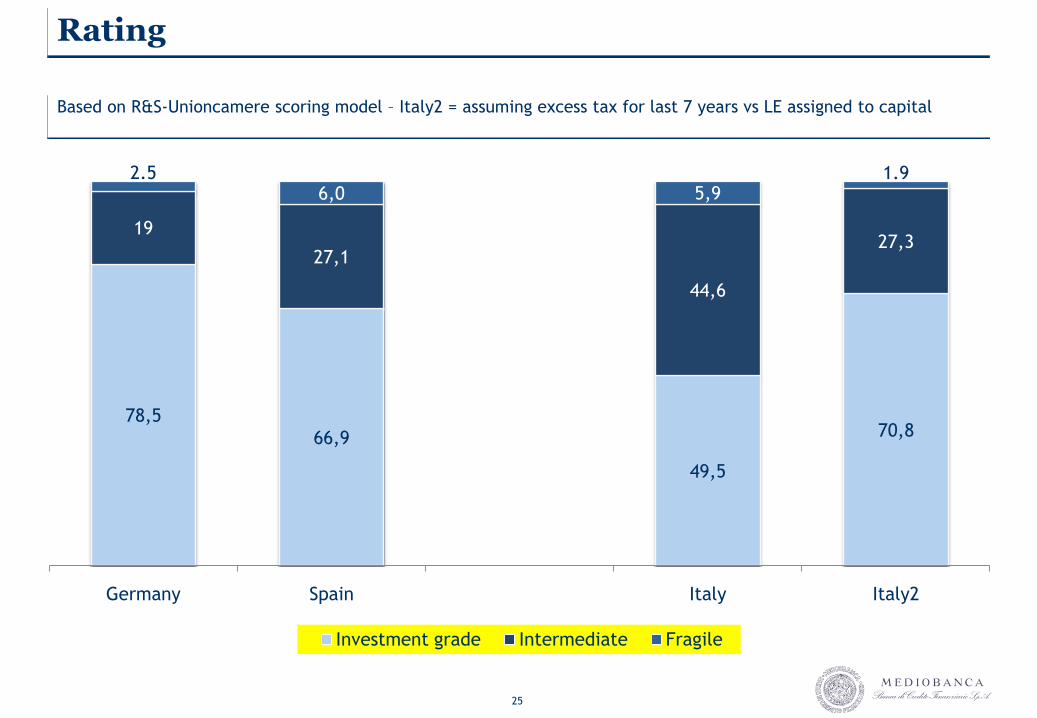
Rating
78,5
66,9
49,5
70,8
19
27,1
44,6
27,3
2.56,0 5,9
1.9
Germany Spain Italy Italy2
Investment grade Intermediate Fragile
Based on R&S-Unioncamere scoring model – Italy2 = assuming excess tax for last 7 years vs LE assigned to capital

26
Stock market and MSEs
93,099,6 98,2
7,0
0.4 1.8
Germany Italy Spain
Not listed Listed
As % of all MSEs

27
Listed MSEs: yields
6,4
-49,7
-5,4
0,8
-61.5
-14.3
Germany Italy Spain
All listed industrials Listed MSEs
Return between 31/12/04 and 17/10/11

28
Italian fourth capitalism:
Shares “system” organization, financial robustness, market leadership and family-
owned structure with German and Spanish firms. Close to large multinationals, mainly
non-Italian ones.
“Life-long project” for those who undertake it (1:5 Italian families), rooted in local
territory and relatively uninterested in financial wizardry. The stock market is the
exception not the rule, but can be useful for overcoming discontinuities in the
owership structure or leveraging acquisition opportunities.
Has taken over the role of main growth driver from large enterprise. Generates
benefits in local communities in which it is rooted, ensures innovation through
continuous flow of “new” men (500 manufacturing companies per week), thus
effectively supporting the production of new national wealth.
1
2
3

Mediobanca Research Area
Milan – 10, Foro Buonaparte
www.mbres.it