beta prototype and test plan - build4scale · beta prototype and test plan. module 4c simulating...
TRANSCRIPT

Simulating Product Use ConditionsU.S. DEPARTMENT OF ENERGY • OFFICE OF ENERGY EFFICIENCY & RENEWABLE ENERGYwww.build4scale.orgwww.build4scale.org
Beta Prototype and Test PlanModule 4C Simulating Product Use Conditions

Simulating Product Use ConditionsU.S. DEPARTMENT OF ENERGY • OFFICE OF ENERGY EFFICIENCY & RENEWABLE ENERGYwww.build4scale.org
A proactive approach throughout product development lifecycle for predicting reliability is necessary to:Avoid discovering problems after the production ramp-up, when
corrective action is much more expensive than if problems are discovered during the design phase
Provide a mechanism for trade-off decisions between product cost on the bill of materials (BOM), warranty cost, and time-to-market impacts
Product use simulation, when combined with testing or modeling, facilitates identification of potential failures (and their root causes) early in the product-development process
2
Why is this module important?Motivation

Simulating Product Use ConditionsU.S. DEPARTMENT OF ENERGY • OFFICE OF ENERGY EFFICIENCY & RENEWABLE ENERGYwww.build4scale.org
PRODUCT DESIGN OBJECTIVES
MANUFACTURING READINESS LEVELSLevels: 109987654321
Mfg DevelopmentManufacturing Research
Mfg Capability
Production
Market ResearchDesign Research
FeasibilityDevelopment
QualificationField Readiness
Launch
Manufacturing Capacity
Simulating Product Use Where does this fit into the development cycle?
Concept and Feasibility Definition Product and
Process DesignImplement and
ValidateProduction and Stock
Launch and Closure
Pre-alpha Alpha Beta Pilot Ramp Scale
PHAS
ESBU
ILDS
Engineering Validation
DesignValidation
ProcessValidation
ConceptValidation
3

Simulating Product Use ConditionsU.S. DEPARTMENT OF ENERGY • OFFICE OF ENERGY EFFICIENCY & RENEWABLE ENERGYwww.build4scale.org
Learning objectivesReliability background and reviewReliability block diagram
—Apportionments—Confidence
Further details—Accelerated life testing (ALT)—Reliability demonstration testing (RDT)—Use modeling software—Physical use testing—Decision trade-offs
4
Module Outline

Simulating Product Use ConditionsU.S. DEPARTMENT OF ENERGY • OFFICE OF ENERGY EFFICIENCY & RENEWABLE ENERGYwww.build4scale.org
LO1. Understand the purpose and value of product use simulation and testing
LO2. Understand reliability block diagram and its function to guide use simulation and testing plans
LO3. Understand basic tools and methods for simulating product-use conditions
5
Learning Objectives

Simulating Product Use ConditionsU.S. DEPARTMENT OF ENERGY • OFFICE OF ENERGY EFFICIENCY & RENEWABLE ENERGYwww.build4scale.org
Reliability is the survival likelihood at use time (“t”) for a defined set of environmental and use conditions (i.e., a, b, c, d)
Use simulation improves reliability predictions throughout the development lifecycle and ensures that reliability goals will be met
Use simulation is part of the reliability program plan that includes diverse activities and cross-team engagement throughout the entire development lifecycle
6
Framework buildingUse Simulation Planning

Simulating Product Use ConditionsU.S. DEPARTMENT OF ENERGY • OFFICE OF ENERGY EFFICIENCY & RENEWABLE ENERGYwww.build4scale.org
Reliability OverviewKey drivers and lifecycle review
Concept and Feasibility Definition
Product & Process
Design
Implement and Validate
Production and Stock
Launch & Closure
Establish Preliminary Reliability
Plans
PHAS
ESRE
LIAB
ILIT
Y
Set the Reliability Goals for
the Product(s)
Design and Implement
the Reliability Case for
the Product(s) to Support
Verify the Product
Reliability from Initial
Product Builds.
Refine the Reliability
Case
Validate Product
Reliability from Initial Production
Validate Product
Reliability from
Production and
Customer Feedback
7

Simulating Product Use ConditionsU.S. DEPARTMENT OF ENERGY • OFFICE OF ENERGY EFFICIENCY & RENEWABLE ENERGYwww.build4scale.org
Reliability Program PlanExample
8
Image enlarged on next two slides

Simulating Product Use ConditionsU.S. DEPARTMENT OF ENERGY • OFFICE OF ENERGY EFFICIENCY & RENEWABLE ENERGYwww.build4scale.org
Reliability Program PlanExample (cont.)
9
Continued on next slide

Simulating Product Use ConditionsU.S. DEPARTMENT OF ENERGY • OFFICE OF ENERGY EFFICIENCY & RENEWABLE ENERGYwww.build4scale.org
Reliability Program PlanExample (cont.)
10

Simulating Product Use ConditionsU.S. DEPARTMENT OF ENERGY • OFFICE OF ENERGY EFFICIENCY & RENEWABLE ENERGYwww.build4scale.org
The bathtub curve is generated by mapping (1) the rate of early “infant mortality" failures when first introduced, (2) the constant rate of “random” failures during its useful life, and (3) the rate of “wear out" failures as the product exceeds its design lifetime
11
OverviewReliability Bathtub Curves
Source: https://en.wikipedia.org/wiki/Bathtub_curve
See Module 7C for more bathtub
curves

Simulating Product Use ConditionsU.S. DEPARTMENT OF ENERGY • OFFICE OF ENERGY EFFICIENCY & RENEWABLE ENERGYwww.build4scale.org
Early failure rate (infant mortality): typically caused by manufacturing, assembly, shipping issues
Example: less than one percent in first 90 daysDesign reliability goal (constant rate failures): typically drives
the component selection and design strategy Example: 90 percent system survivability at year five at 25°C (or other environment/use parameters)Design life goal (wear out): this is the point where the
components selected will start to wear out Example: seven years at 25°C (or other environment/use parameters)
12
ReviewQuality Goals

Simulating Product Use ConditionsU.S. DEPARTMENT OF ENERGY • OFFICE OF ENERGY EFFICIENCY & RENEWABLE ENERGYwww.build4scale.org
The reliability block diagram (RBD) is a graphical and mathematical model of system reliability given the reliability of the individual components or sub-assemblies
In partnership with reliability goals, the RBD is a critical tool for guiding use simulation and test plans
13
What it is and how to use itReliability Block Diagram
PS = product systemSS = sub-systemSC = sub-component

Simulating Product Use ConditionsU.S. DEPARTMENT OF ENERGY • OFFICE OF ENERGY EFFICIENCY & RENEWABLE ENERGYwww.build4scale.org
14
How to calculate reliabilityReliability Block Diagram
PS reliability = product of all SS reliability (SS1 x SS2 x SS3…)SS reliability = product of all SC reliability (SC1 x SC2 x SC3…)
PS = product systemSS = sub-systemSC = sub-component
Simulating Product Use ConditionsU.S. DEPARTMENT OF ENERGY • OFFICE OF ENERGY EFFICIENCY & RENEWABLE ENERGYwww.build4scale.org
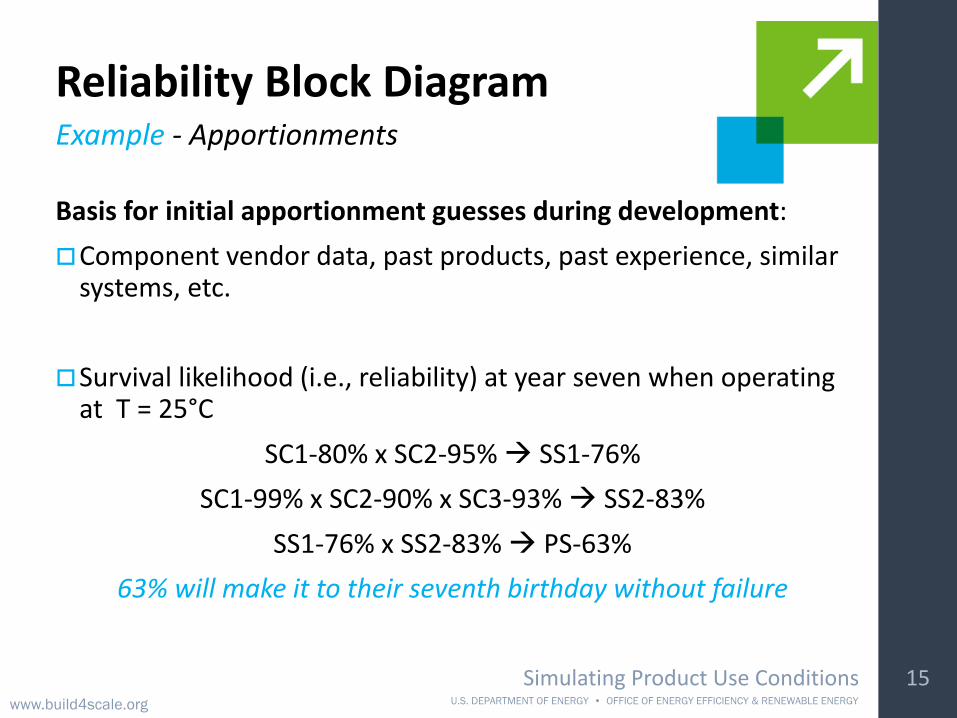
Basis for initial apportionment guesses during development:Component vendor data, past products, past experience, similar
systems, etc.
Survival likelihood (i.e., reliability) at year seven when operating at T = 25°C
SC1-80% x SC2-95% SS1-76%SC1-99% x SC2-90% x SC3-93% SS2-83%
SS1-76% x SS2-83% PS-63% 63% will make it to their seventh birthday without failure
15
Example - ApportionmentsReliability Block Diagram

Simulating Product Use ConditionsU.S. DEPARTMENT OF ENERGY • OFFICE OF ENERGY EFFICIENCY & RENEWABLE ENERGYwww.build4scale.org
Activities during design and development to refine apportionment values:Performance and reliability simulation/modeling (i.e., Reliasoft
BlockSim or Windchill RBD software)Empirical testing (i.e., accelerated life testing (ALT), highly
accelerated life testing (HALT))Validate apportionment predictions with beta product testing:Reliability demonstration tests (RDT)
16
Example – Apportionments (cont.)Reliability Block Diagram

Simulating Product Use ConditionsU.S. DEPARTMENT OF ENERGY • OFFICE OF ENERGY EFFICIENCY & RENEWABLE ENERGYwww.build4scale.org
The confidence level that final product will meet reliability goals should increase throughout product lifecycle (example confidence numbers in figure below)
Confidence levels and measurable data are part of decision “gates” to proceed to next build stage
Tip: A product may require multiple alpha and/or beta version builds if “gate” objectives are not met with the first version
17
ConfidenceReliability Block Diagram
50% 75% 90% 95% 98%
• Pilot• HASS
Future• Alpha• RBD• Goals/
guesses
• Launch• Further
check points
• Beta• Modeling• ALT• HALT
Extrapolation

Simulating Product Use ConditionsU.S. DEPARTMENT OF ENERGY • OFFICE OF ENERGY EFFICIENCY & RENEWABLE ENERGYwww.build4scale.org
Assign proper ownership and accountability to ensure that problem identifications and corrective actions are performed early in the production cycle
18
Confidence (cont.)Reliability Block Diagram
50% 75% 90% 95% 98%
• Pilot• HASS
Future
• Beta• Modeling• ALT• HALT
• Alpha• RBD• Goals/
guesses
• Launch• Further
check pointsExtrapolation

Simulating Product Use ConditionsU.S. DEPARTMENT OF ENERGY • OFFICE OF ENERGY EFFICIENCY & RENEWABLE ENERGYwww.build4scale.org
ALT is a process of testing a product (component or subsystem) in an accelerated way to uncover failure modes quickly
The product is subjected to various stressors (temperature, voltage, vibration, duty cycle, pressure, stress, strain, etc.) in excess of its normal operating parameters to accelerate failures
19
BasicsAccelerated Life Testing

Simulating Product Use ConditionsU.S. DEPARTMENT OF ENERGY • OFFICE OF ENERGY EFFICIENCY & RENEWABLE ENERGYwww.build4scale.org
ALT failures are followed by a root cause analysis and the options for corrective action
Corrective actions in response to ALT failures are prioritized and then implemented in subsequent design and build cyclesTip: In some cases, a product failure may not be corrected if an accelerated test failure mode is unlikely to occur in the field (each ALT failure presents an opportunity for cross-functional discussions about customer impact)
20
Basics (cont.)Accelerated Life Testing

Simulating Product Use ConditionsU.S. DEPARTMENT OF ENERGY • OFFICE OF ENERGY EFFICIENCY & RENEWABLE ENERGYwww.build4scale.org
RDT is a series of demonstrative activities used to validate confidence in a product’s ability to meet its intended lifetime goals
It is conducted before transition to pilot builds and implementation of a product’s warranty/service plan
Ideally, RDT is performed with a nearly complete product design (beta), and is built using the final manufacturing process (or as close as possible) 21
BasicsReliability Demonstration Testing

Simulating Product Use ConditionsU.S. DEPARTMENT OF ENERGY • OFFICE OF ENERGY EFFICIENCY & RENEWABLE ENERGYwww.build4scale.org
Electronic systems (for one example, Windchill): software to model components and conditions for predicting failures and reliability values
Thermal, fluid, mechanical systems: extension beyond just performance modeling (i.e., with finite element software) to include failure mechanisms and predictions based on loading and use conditions
Software systems: automated algorithm and use-case testing (i.e., typically custom developed in parallel with product software development efforts)
22
BasicsModeling Software

Simulating Product Use ConditionsU.S. DEPARTMENT OF ENERGY • OFFICE OF ENERGY EFFICIENCY & RENEWABLE ENERGYwww.build4scale.org
Environment loading: pressure, temperature, humidity, radiation, moisture, etc.
Electronic loading: voltage, current, frequency, natural resonance, etc.
Mechanical loading: thermal, fluid, and stress cycles
Functional loading: repeated exposure through intended use functionality
23
BasicsPhysical Use Testing

Simulating Product Use ConditionsU.S. DEPARTMENT OF ENERGY • OFFICE OF ENERGY EFFICIENCY & RENEWABLE ENERGYwww.build4scale.org
Make engineering changes or revise goals when corrective action is required
Alternative corrective action paths should be analyzed for impact to product cost on the BOM, warranty cost, time-to-market, etc.
Additional investment efforts should add market value to product (market differentiation, customer satisfaction, etc.)
24
Decision trade-offsCorrective Actions

Simulating Product Use ConditionsU.S. DEPARTMENT OF ENERGY • OFFICE OF ENERGY EFFICIENCY & RENEWABLE ENERGYwww.build4scale.org
Every decision has cost implications:Qualitative or quantitative performance testingWhat data to collect? (e.g., functionality values, property
measurements, and environment parameters)Automated or manual processes?Destructive or non-destructive tests? (x-ray, ultrasound, etc.)
Tip: During pre-launch testing, the goal is to take every test to eventual product failure in order to investigate root causes for potential corrective action. The only reason for non-destructive testing at this stage is to collect mid-life data points, or to prepare for post launch inspection procedures.
25
Decision trade-offs (cont.)Corrective Actions

Glossary
Module 4C
Engineering Validation measures and analyzes the process, audits and calibrates equipment and creates a document trail that shows the process leads to a consistent result to ensure the highest quality products are produced. (Repeat from 2C)
Design Validation is testing aimed at ensuring that a product or system fulfills the defined user
needs and specified requirements, under specified operating conditions.
Feasibility is the process in product life cycle which first translates feasible ideas into
technically feasible and economically competitive product concepts, and then
produces product concept through concept generation and selection. Two commonly used
techniques to decide the best design candidate are design-to-cost and life-cycle-cost analyses.
(Repeat from 2B)
Development - The systematic use of scientific and technical knowledge to meet specific
objectives or requirements.
Qualification is either the process of qualifying for an achievement, or a credential attesting to
that achievement
Manufacturing Development or Engineering & Manufacturing and Development (EMD)phase is
where a system is developed and designed before going into production. (Repeat from 2B)
Manufacturing Capability process is a unique combination of tools, materials, methods, and
people engaged in producing a measurable output; for example a manufacturing line for
machine parts. All processes have inherent statistical variability which can be evaluated by
statistical methods. (Repeat from 2B)
Field Readiness is the stage of development just prior to final launch. It is time to review the Pilot run and determine if there are any “game stopper” issues. (Repeat from 4A)
Infant Mortality Failures or Early Failure Rate is caused by defects designed into or built into a
product and are completely unacceptable to the customer. To avoid infant mortalities
appropriate specifications, adequate design tolerance and sufficient component derating can
help, and should always be used, but even the best design intent can fail to cover all possible
interactions of components in operation. In addition to the best design approaches, stress

testing should be started at the earliest development phases and used to evaluate design
weaknesses and uncover specific assembly and materials problems. (Repeat from 3E)
Random failures - Defect or failure whose occurrence is unpredictable in absolute sense, but is
predictable in a probabilistic or statistical sense.
Wear Out Failures are identified when failure is no longer random and greater than specified
acceptability usually caused by stress exceeding strength. Wear Out Failures are characterized
by an increasing failure rate with failures that are caused by the "wear and tear" on the product
over time. (Repeat from 3E)
Simulation - is the imitation of the operation of a real-world process or system over time.
Reliability Block Diagram (RBD) - is a diagrammatic method for showing how component
reliability contributes to the success or failure of a complex system.
Accelerated Life Testing is the process of testing a product by subjecting it to conditions (stress,
strain, temperatures, voltage, vibration rate, pressure etc.) in excess of its normal service
parameters in an effort to uncover faults and potential modes of failure in a short amount of
time.
Environment Loading is testing product under the conditions in which it will receive in its final
environment which may include pressure, temperature, humidity, radiation, moisture, etc.
Electronic Loading is testing product under the conditions in which it will receive in its final environment which may include voltage, current, frequency, natural resonance, etc. To protect the power devices from damage, electronic loads usually have a pre-settable power limit.
Mechanical Load Testing is to verify that all the component parts of a structure including materials, base-fixings are fit for task and loading it is designed for. Static testing is when a designated constant load is applied for a specified time and may be under the influence of thermal, fluid, and stress cycles.
Functional Load Testing is focused on functional requirements of the product or system and
done in accordance with your performance specifications or that of your customer.